ANALYSIS OF LEBANON’S PHARMACEUTICAL MARKET · World Pharmaceutical Market 3 Lebanon’s...
18
ANALYSIS OF LEBANON’S PHARMACEUTICAL MARKET BankMed - Market & Economic Research Division
Transcript of ANALYSIS OF LEBANON’S PHARMACEUTICAL MARKET · World Pharmaceutical Market 3 Lebanon’s...
ANALYSIS OF LEBANON’S PHARMACEUTICAL MARKET
BankMed - Market & Economic Research Division
World Pharmaceutical Market 3
Lebanon’s Pharmaceutical Market 7
Pharmaceutical Imports and Exports 9
Evolution of Pharmaceutical Imports 9
Pharmaceutical Imports by Type 10
Pharmaceutical Imports by Country 12
Evolution of Pharmaceutical Exports 15
Pharmaceutical Exports by Country 16
BankMed - Market & Economic Research Division 2
TABLE OF CONTENTS
SPECIAL REPORT
Analysis of Lebanon’s Pharmaceutical Market - December 2014
Source: IMS Institute for Healthcare Informatics
3
WORLD PHARMACEUTICAL MARKET
BankMed - Market & Economic Research Division
Over the past five years, the pharmaceutical market emerged as one of the key players in the global healthcare system. Today, the pharma industry is regarded as one of the fastest growing industries worldwide. This growth is attributed to the increasing global demand for healthcare medications, especially from emerging economies. It is further underpinned by the greater emphasis on healthcare standards and continuous research toward illness prevention, which prompted the development in this field. With this significant role, the pharmaceutical industry constitutes a major source of employment and earnings for many economies around the globe, yet it remains subject to the dynamic shifts in the market.
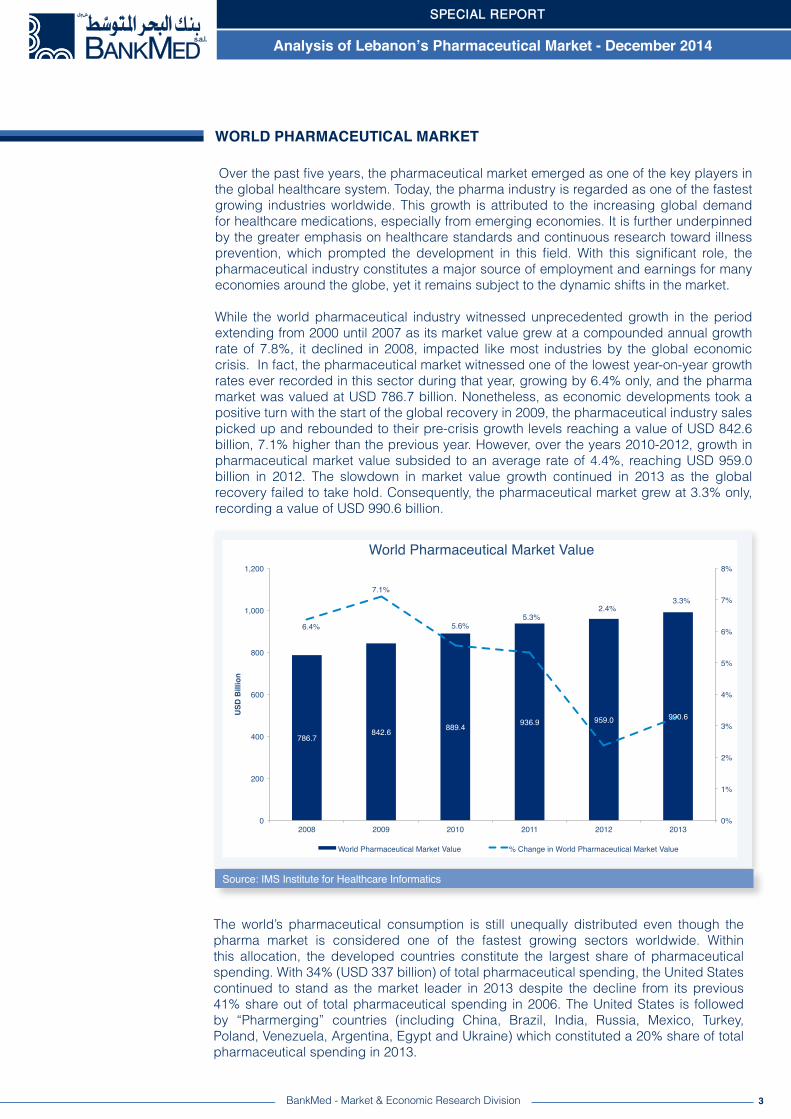
While the world pharmaceutical industry witnessed unprecedented growth in the period extending from 2000 until 2007 as its market value grew at a compounded annual growth rate of 7.8%, it declined in 2008, impacted like most industries by the global economic crisis. In fact, the pharmaceutical market witnessed one of the lowest year-on-year growth rates ever recorded in this sector during that year, growing by 6.4% only, and the pharma market was valued at USD 786.7 billion. Nonetheless, as economic developments took a positive turn with the start of the global recovery in 2009, the pharmaceutical industry sales picked up and rebounded to their pre-crisis growth levels reaching a value of USD 842.6 billion, 7.1% higher than the previous year. However, over the years 2010-2012, growth in pharmaceutical market value subsided to an average rate of 4.4%, reaching USD 959.0 billion in 2012. The slowdown in market value growth continued in 2013 as the global recovery failed to take hold. Consequently, the pharmaceutical market grew at 3.3% only, recording a value of USD 990.6 billion.
SPECIAL REPORT
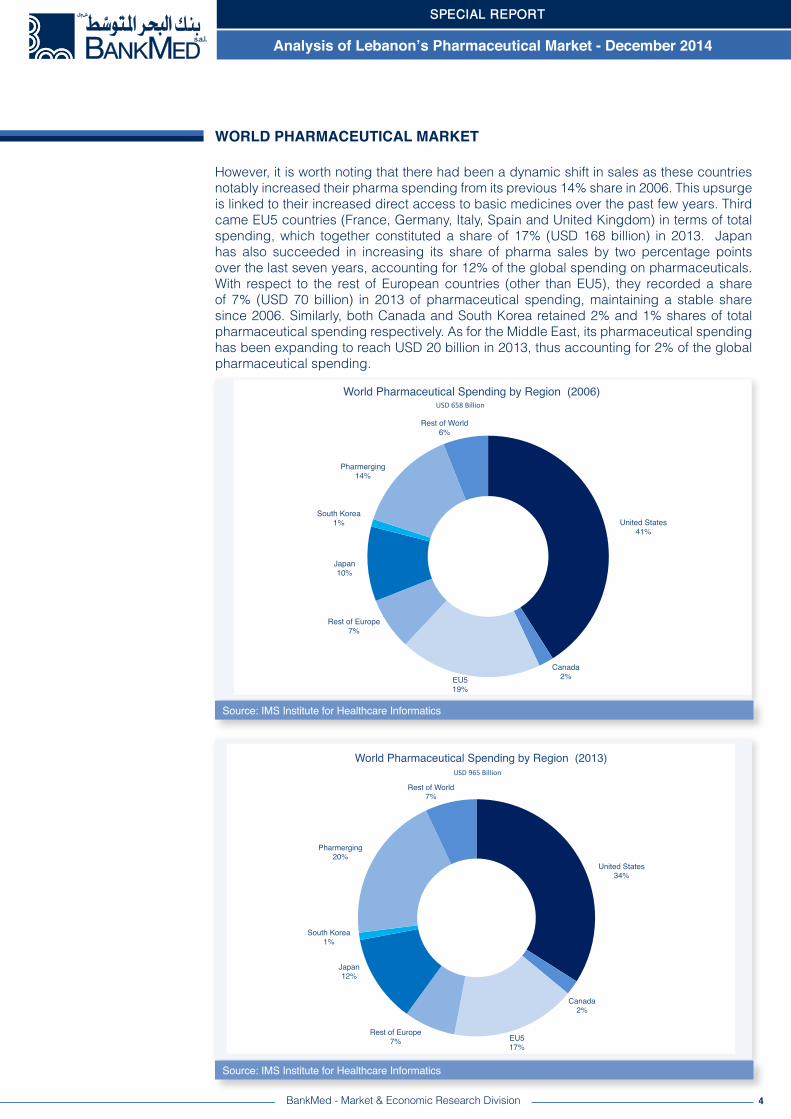
The world’s pharmaceutical consumption is still unequally distributed even though the pharma market is considered one of the fastest growing sectors worldwide. Within this allocation, the developed countries constitute the largest share of pharmaceutical spending. With 34% (USD 337 billion) of total pharmaceutical spending, the United States continued to stand as the market leader in 2013 despite the decline from its previous 41% share out of total pharmaceutical spending in 2006. The United States is followed by “Pharmerging” countries (including China, Brazil, India, Russia, Mexico, Turkey, Poland, Venezuela, Argentina, Egypt and Ukraine) which constituted a 20% share of total pharmaceutical spending in 2013.
Analysis of Lebanon’s Pharmaceutical Market - December 2014
4BankMed - Market & Economic Research Division
However, it is worth noting that there had been a dynamic shift in sales as these countries notably increased their pharma spending from its previous 14% share in 2006. This upsurge is linked to their increased direct access to basic medicines over the past few years. Third came EU5 countries (France, Germany, Italy, Spain and United Kingdom) in terms of total spending, which together constituted a share of 17% (USD 168 billion) in 2013. Japan has also succeeded in increasing its share of pharma sales by two percentage points over the last seven years, accounting for 12% of the global spending on pharmaceuticals. With respect to the rest of European countries (other than EU5), they recorded a share of 7% (USD 70 billion) in 2013 of pharmaceutical spending, maintaining a stable share since 2006. Similarly, both Canada and South Korea retained 2% and 1% shares of total pharmaceutical spending respectively. As for the Middle East, its pharmaceutical spending has been expanding to reach USD 20 billion in 2013, thus accounting for 2% of the global pharmaceutical spending.
Source: IMS Institute for Healthcare Informatics
SPECIAL REPORT
WORLD PHARMACEUTICAL MARKET
United States!41%!
Canada!2%!EU5!
19%!
Rest of Europe!7%!
Japan!10%!
South Korea!1%!
Pharmerging!14%!
Rest of World!6%!
World Pharmaceutical Spending by Region (2006)!USD 658 Billion
Source: IMS Institute for Healthcare Informatics
United States!34%!
Canada!2%!
EU5!17%!
Rest of Europe!7%!
Japan!12%!
South Korea!1%!
Pharmerging!20%!
Rest of World!7%!
World Pharmaceutical Spending by Region (2013)!USD 965 Billion
Analysis of Lebanon’s Pharmaceutical Market - December 2014
5BankMed - Market & Economic Research Division
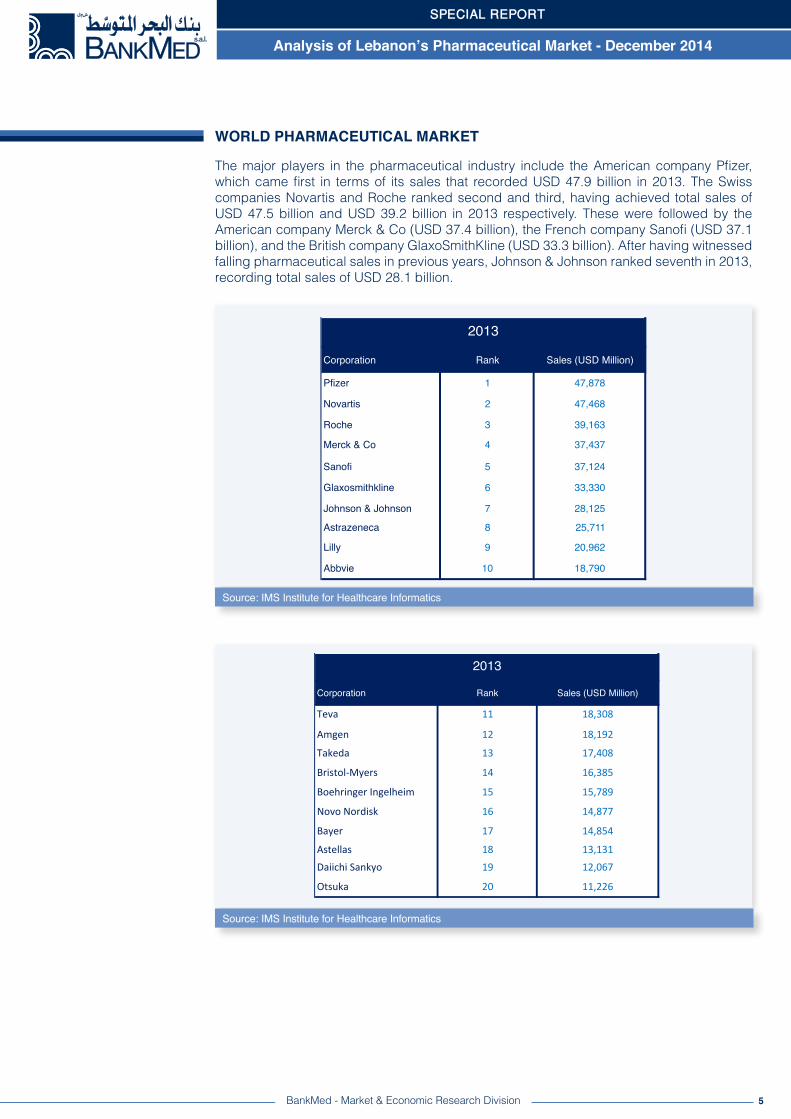
The major players in the pharmaceutical industry include the American company Pfizer, which came first in terms of its sales that recorded USD 47.9 billion in 2013. The Swiss companies Novartis and Roche ranked second and third, having achieved total sales of USD 47.5 billion and USD 39.2 billion in 2013 respectively. These were followed by the American company Merck & Co (USD 37.4 billion), the French company Sanofi (USD 37.1 billion), and the British company GlaxoSmithKline (USD 33.3 billion). After having witnessed falling pharmaceutical sales in previous years, Johnson & Johnson ranked seventh in 2013, recording total sales of USD 28.1 billion.
Source: IMS Institute for Healthcare Informatics
WORLD PHARMACEUTICAL MARKET
Corporation Rank Sales (USD Million)
Pfizer 1 47,878
Novartis 2 47,468
Roche 3 39,163
Merck & Co 4 37,437
Sanofi 5 37,124
Glaxosmithkline 6 33,330
Johnson & Johnson 7 28,125
Astrazeneca 8 25,711
Lilly 9 20,962
Abbvie 10 18,790
2013
Source: IMS Institute for Healthcare Informatics
Corporation Rank Sales (USD Million)
Teva 11 18,308
Amgen 12 18,192
Takeda 13 17,408
Bristol-‐Myers 14 16,385
Boehringer Ingelheim 15 15,789
Novo Nordisk 16 14,877
Bayer 17 14,854
Astellas 18 13,131Daiichi Sankyo 19 12,067
Otsuka 20 11,226
2013
SPECIAL REPORT
Analysis of Lebanon’s Pharmaceutical Market - December 2014
6BankMed - Market & Economic Research Division
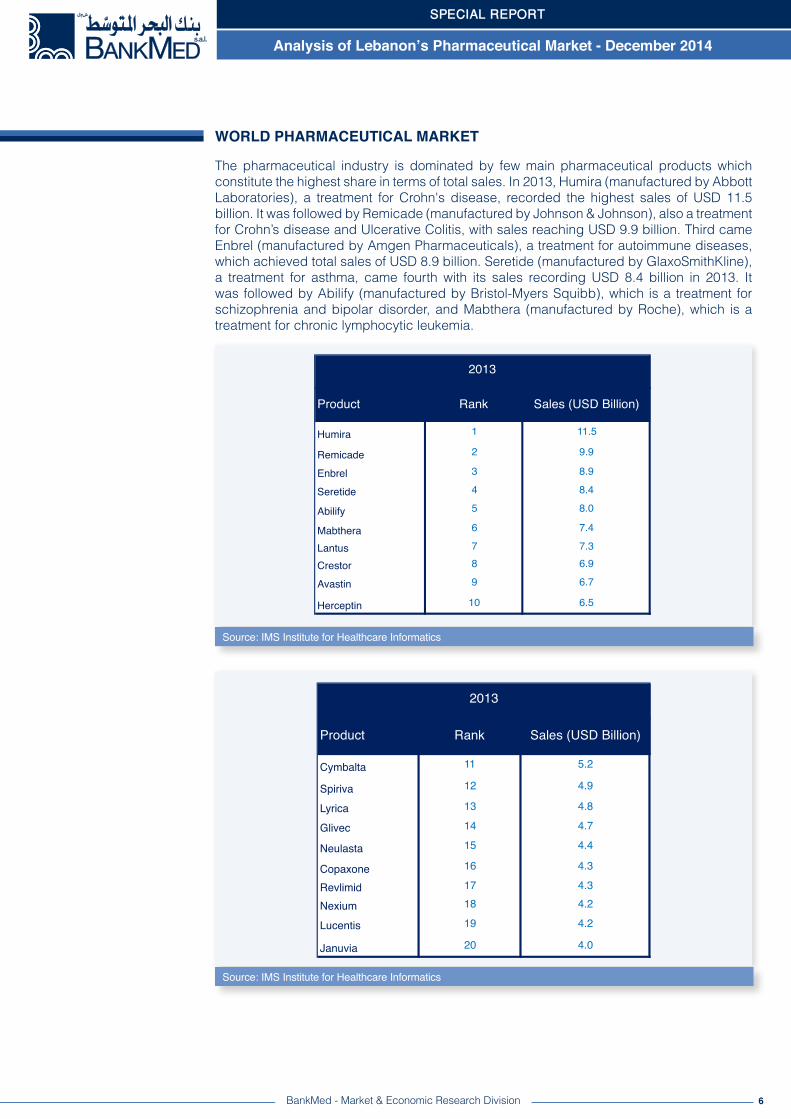
The pharmaceutical industry is dominated by few main pharmaceutical products which constitute the highest share in terms of total sales. In 2013, Humira (manufactured by Abbott Laboratories), a treatment for Crohn's disease, recorded the highest sales of USD 11.5 billion. It was followed by Remicade (manufactured by Johnson & Johnson), also a treatment for Crohn’s disease and Ulcerative Colitis, with sales reaching USD 9.9 billion. Third came Enbrel (manufactured by Amgen Pharmaceuticals), a treatment for autoimmune diseases, which achieved total sales of USD 8.9 billion. Seretide (manufactured by GlaxoSmithKline), a treatment for asthma, came fourth with its sales recording USD 8.4 billion in 2013. It was followed by Abilify (manufactured by Bristol-Myers Squibb), which is a treatment for schizophrenia and bipolar disorder, and Mabthera (manufactured by Roche), which is a treatment for chronic lymphocytic leukemia.
WORLD PHARMACEUTICAL MARKET
Source: IMS Institute for Healthcare Informatics
Source: IMS Institute for Healthcare Informatics
Product Rank Sales (USD Billion)
Humira 1 11.5
Remicade 2 9.9
Enbrel 3 8.9
Seretide 4 8.4
Abilify 5 8.0
Mabthera 6 7.4
Lantus 7 7.3
Crestor 8 6.9
Avastin 9 6.7
Herceptin 10 6.5
2013
Product Rank Sales (USD Billion)
Cymbalta 11 5.2
Spiriva 12 4.9
Lyrica 13 4.8
Glivec 14 4.7
Neulasta 15 4.4
Copaxone 16 4.3
Revlimid 17 4.3
Nexium 18 4.2
Lucentis 19 4.2
Januvia 20 4.0
2013
SPECIAL REPORT
Analysis of Lebanon’s Pharmaceutical Market - December 2014
7BankMed - Market & Economic Research Division
Despite its consistent growth over the past decade, Lebanon’s pharmaceutical sector is still facing several challenges. A particular challenge relates to the high cost of pharmaceuticals. In addition, counterfeit pharmaceuticals and registration of fake medicaments remains a major issue, with several incidents reported recently. Furthermore, the legal framework that governs the pharmaceutical market remains weak, thus hindering foreign investments in the sector.
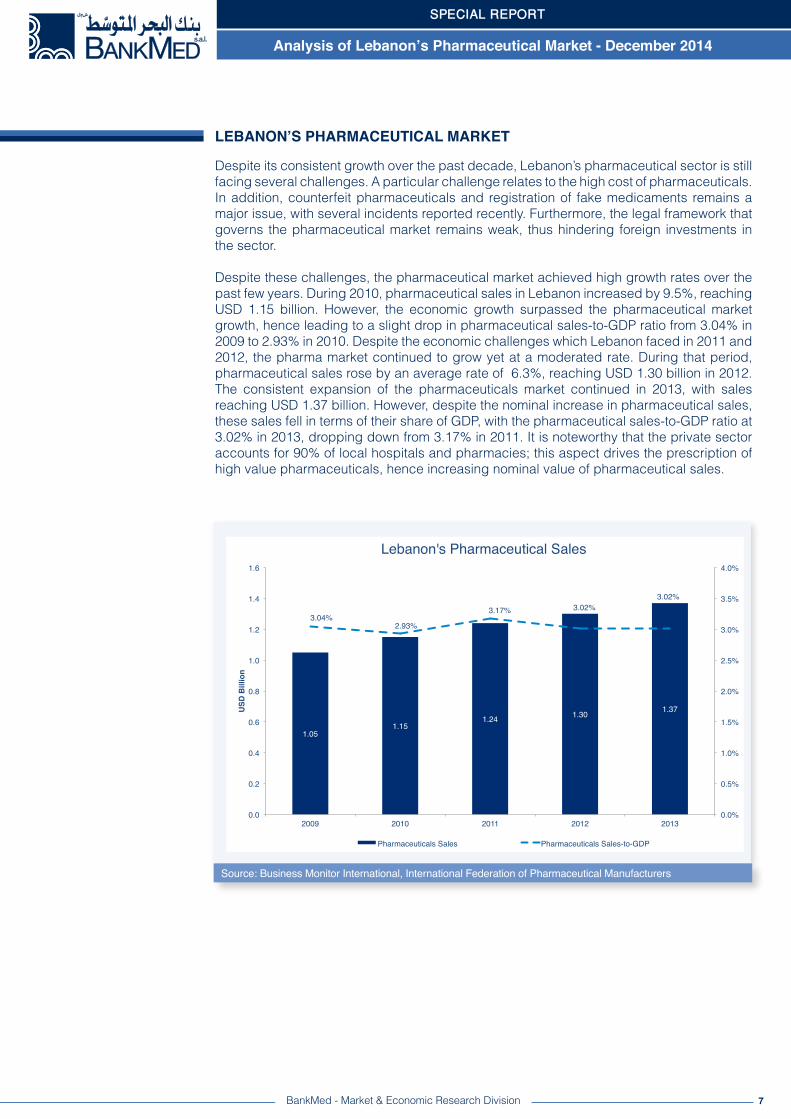
Despite these challenges, the pharmaceutical market achieved high growth rates over the past few years. During 2010, pharmaceutical sales in Lebanon increased by 9.5%, reaching USD 1.15 billion. However, the economic growth surpassed the pharmaceutical market growth, hence leading to a slight drop in pharmaceutical sales-to-GDP ratio from 3.04% in 2009 to 2.93% in 2010. Despite the economic challenges which Lebanon faced in 2011 and 2012, the pharma market continued to grow yet at a moderated rate. During that period, pharmaceutical sales rose by an average rate of 6.3%, reaching USD 1.30 billion in 2012. The consistent expansion of the pharmaceuticals market continued in 2013, with sales reaching USD 1.37 billion. However, despite the nominal increase in pharmaceutical sales, these sales fell in terms of their share of GDP, with the pharmaceutical sales-to-GDP ratio at 3.02% in 2013, dropping down from 3.17% in 2011. It is noteworthy that the private sector accounts for 90% of local hospitals and pharmacies; this aspect drives the prescription of high value pharmaceuticals, hence increasing nominal value of pharmaceutical sales.
LEBANON’S PHARMACEUTICAL MARKET
Source: Business Monitor International, International Federation of Pharmaceutical Manufacturers
SPECIAL REPORT
Analysis of Lebanon’s Pharmaceutical Market - December 2014
8BankMed - Market & Economic Research Division
Source: Business Monitor International, International Federation of Pharmaceutical Manufacturers
Lebanon’s per capita pharmaceutical spending is considered one of the highest in the Middle East. Several factors interact leading to this high expenditure. Lebanon’s pharmaceutical market is dominated by private pharmacies facing a fixed mark-up scheme on drugs. This factor has developed a tendency towards the prescription of high value pharmaceutical products in an attempt to drive up returns. Furthermore, the pharmaceutical market encompasses over 50 pharmaceutical companies, which limits the benefits from economies of scale.
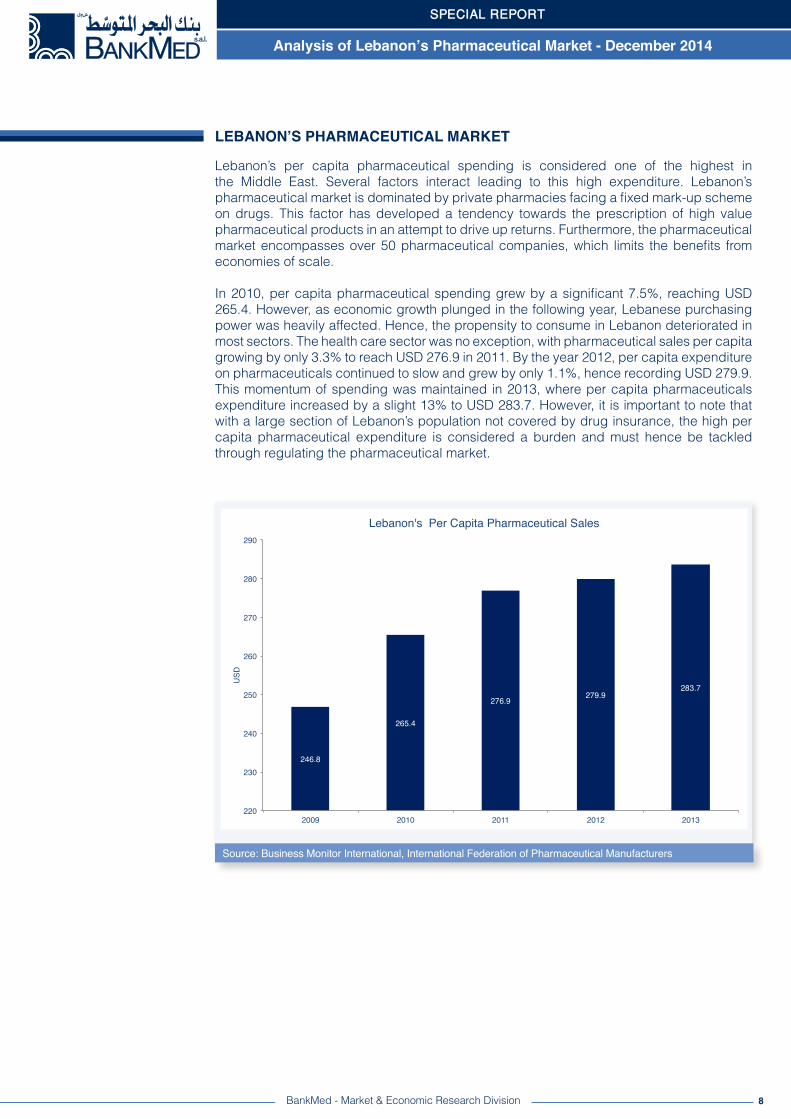
In 2010, per capita pharmaceutical spending grew by a significant 7.5%, reaching USD 265.4. However, as economic growth plunged in the following year, Lebanese purchasing power was heavily affected. Hence, the propensity to consume in Lebanon deteriorated in most sectors. The health care sector was no exception, with pharmaceutical sales per capita growing by only 3.3% to reach USD 276.9 in 2011. By the year 2012, per capita expenditure on pharmaceuticals continued to slow and grew by only 1.1%, hence recording USD 279.9. This momentum of spending was maintained in 2013, where per capita pharmaceuticals expenditure increased by a slight 13% to USD 283.7. However, it is important to note that with a large section of Lebanon’s population not covered by drug insurance, the high per capita pharmaceutical expenditure is considered a burden and must hence be tackled through regulating the pharmaceutical market.
LEBANON’S PHARMACEUTICAL MARKET
SPECIAL REPORT
246.8!
265.4!
276.9! 279.9!283.7!
220!
230!
240!
250!
260!
270!
280!
290!
2009! 2010! 2011! 2012! 2013!
USD!
Lebanon's Per Capita Pharmaceutical Sales!
Analysis of Lebanon’s Pharmaceutical Market - December 2014
9BankMed - Market & Economic Research Division
Source: Lebanese Customs
EVOLUTION OF PHARMACEUTICAL IMPORTS
Local pharmaceutical production in Lebanon remains limited as it faces several inefficiencies, including high production cost and limited production efficiency, relatively small local market, as well as uncertain authenticity. Since local pharmaceutical production is still weak, satisfying only 5% of local demand, imports constitute over 95% of the total pharmaceutical products sold in the Lebanese market.
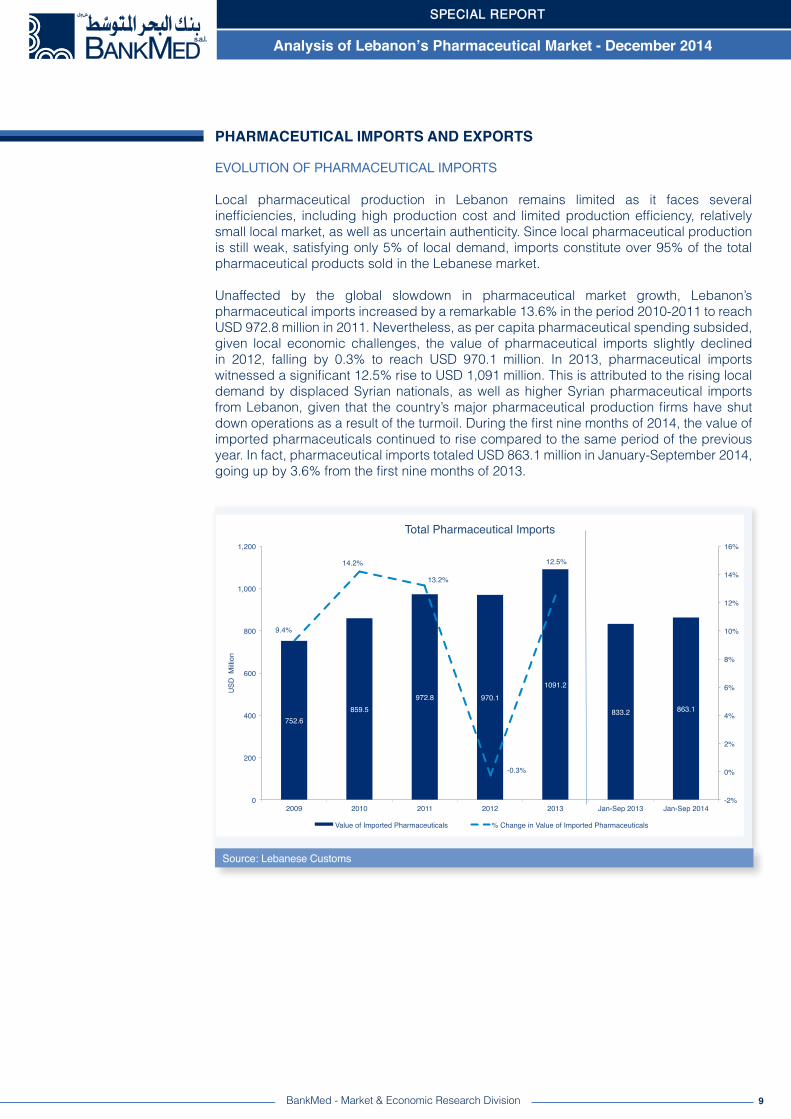
Unaffected by the global slowdown in pharmaceutical market growth, Lebanon’s pharmaceutical imports increased by a remarkable 13.6% in the period 2010-2011 to reach USD 972.8 million in 2011. Nevertheless, as per capita pharmaceutical spending subsided, given local economic challenges, the value of pharmaceutical imports slightly declined in 2012, falling by 0.3% to reach USD 970.1 million. In 2013, pharmaceutical imports witnessed a significant 12.5% rise to USD 1,091 million. This is attributed to the rising local demand by displaced Syrian nationals, as well as higher Syrian pharmaceutical imports from Lebanon, given that the country’s major pharmaceutical production firms have shut down operations as a result of the turmoil. During the first nine months of 2014, the value of imported pharmaceuticals continued to rise compared to the same period of the previous year. In fact, pharmaceutical imports totaled USD 863.1 million in January-September 2014, going up by 3.6% from the first nine months of 2013.
PHARMACEUTICAL IMPORTS AND EXPORTS
SPECIAL REPORT
Analysis of Lebanon’s Pharmaceutical Market - December 2014
10BankMed - Market & Economic Research Division
Source: Lebanese Customs
PHARMACEUTICAL IMPORTS BY TYPE
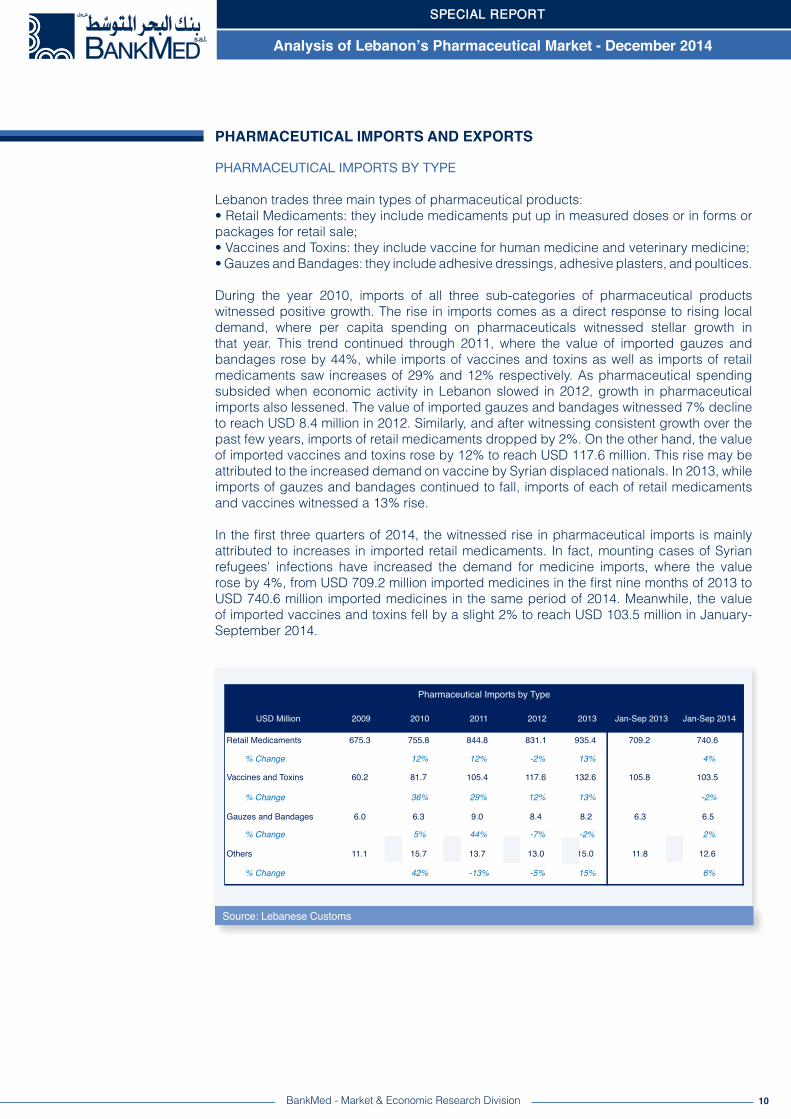
Lebanon trades three main types of pharmaceutical products:• Retail Medicaments: they include medicaments put up in measured doses or in forms or packages for retail sale;• Vaccines and Toxins: they include vaccine for human medicine and veterinary medicine;• Gauzes and Bandages: they include adhesive dressings, adhesive plasters, and poultices.
During the year 2010, imports of all three sub-categories of pharmaceutical products witnessed positive growth. The rise in imports comes as a direct response to rising local demand, where per capita spending on pharmaceuticals witnessed stellar growth in that year. This trend continued through 2011, where the value of imported gauzes and bandages rose by 44%, while imports of vaccines and toxins as well as imports of retail medicaments saw increases of 29% and 12% respectively. As pharmaceutical spending subsided when economic activity in Lebanon slowed in 2012, growth in pharmaceutical imports also lessened. The value of imported gauzes and bandages witnessed 7% decline to reach USD 8.4 million in 2012. Similarly, and after witnessing consistent growth over the past few years, imports of retail medicaments dropped by 2%. On the other hand, the value of imported vaccines and toxins rose by 12% to reach USD 117.6 million. This rise may be attributed to the increased demand on vaccine by Syrian displaced nationals. In 2013, while imports of gauzes and bandages continued to fall, imports of each of retail medicaments and vaccines witnessed a 13% rise.
In the first three quarters of 2014, the witnessed rise in pharmaceutical imports is mainly attributed to increases in imported retail medicaments. In fact, mounting cases of Syrian refugees' infections have increased the demand for medicine imports, where the value rose by 4%, from USD 709.2 million imported medicines in the first nine months of 2013 to USD 740.6 million imported medicines in the same period of 2014. Meanwhile, the value of imported vaccines and toxins fell by a slight 2% to reach USD 103.5 million in January-September 2014.
PHARMACEUTICAL IMPORTS AND EXPORTS
SPECIAL REPORT
USD Million 2009 2010 2011 2012 2013 Jan-Sep 2013 Jan-Sep 2014
Retail Medicaments 675.3 755.8 844.8 831.1 935.4 709.2 740.6
% Change 12% 12% -2% 13% 4%
Vaccines and Toxins 60.2 81.7 105.4 117.6 132.6 105.8 103.5
% Change 36% 29% 12% 13% -2%
Gauzes and Bandages 6.0 6.3 9.0 8.4 8.2 6.3 6.5
% Change 5% 44% -7% -2% 2%
Others 11.1 15.7 13.7 13.0 15.0 11.8 12.6
% Change 42% -13% -5% 15% 6%
Pharmaceutical Imports by Type
Analysis of Lebanon’s Pharmaceutical Market - December 2014
11BankMed - Market & Economic Research Division
PHARMACEUTICAL IMPORTS BY TYPE
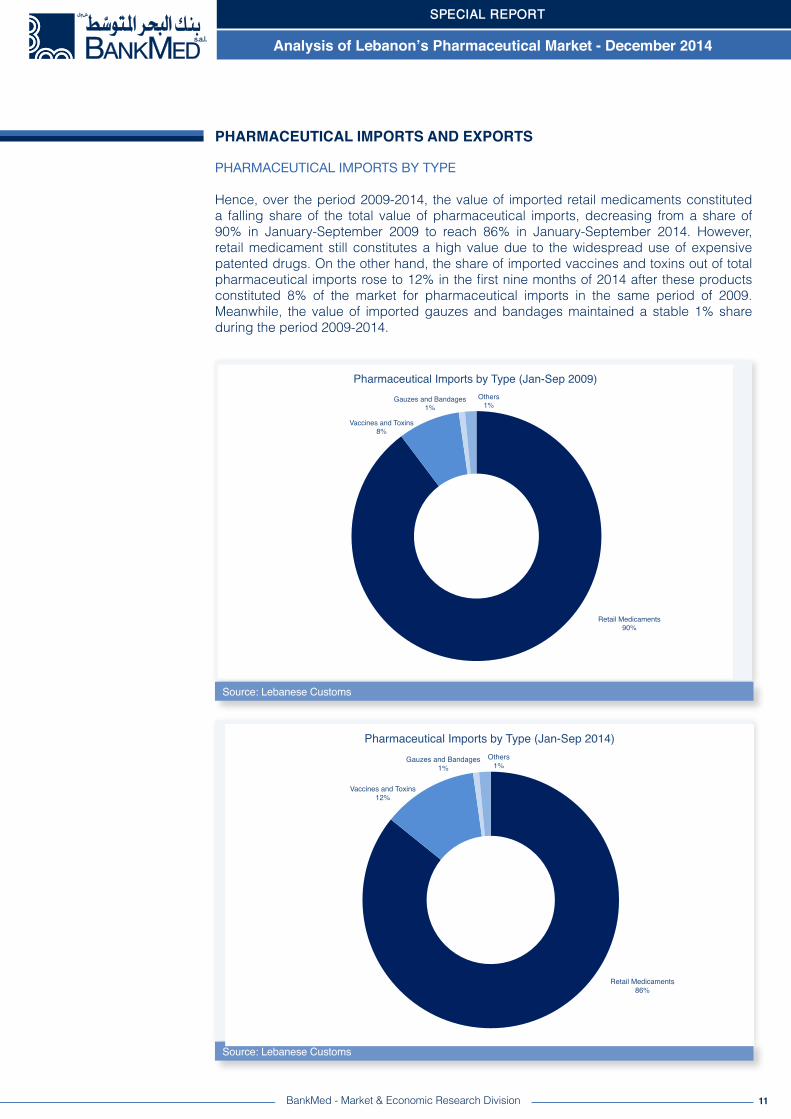
Hence, over the period 2009-2014, the value of imported retail medicaments constituted a falling share of the total value of pharmaceutical imports, decreasing from a share of 90% in January-September 2009 to reach 86% in January-September 2014. However, retail medicament still constitutes a high value due to the widespread use of expensive patented drugs. On the other hand, the share of imported vaccines and toxins out of total pharmaceutical imports rose to 12% in the first nine months of 2014 after these products constituted 8% of the market for pharmaceutical imports in the same period of 2009. Meanwhile, the value of imported gauzes and bandages maintained a stable 1% share during the period 2009-2014.
PHARMACEUTICAL IMPORTS AND EXPORTS
SPECIAL REPORT
Source: Lebanese Customs
Source: Lebanese Customs
Retail Medicaments!90%!
Vaccines and Toxins!8%!
Gauzes and Bandages!1%!
Others!1%!
Pharmaceutical Imports by Type (Jan-Sep 2009)!
Retail Medicaments!86%!
Vaccines and Toxins!12%!
Gauzes and Bandages!1%!
Others!1%!
Pharmaceutical Imports by Type (Jan-Sep 2014)!
Analysis of Lebanon’s Pharmaceutical Market - December 2014
12BankMed - Market & Economic Research Division
PHARMACEUTICAL IMPORTS BY COUNTRY
Lebanon mainly imports pharmaceutical products from France, Germany, Switzerland, and the US. During the period 2010-2011, imports of pharmaceutical products from France and Switzerland have been on the rise. In fact, over the abovementioned period, the value of imported pharmaceuticals from Switzerland saw a high average annual increase of 19.5%, to reach USD 113.1 million in 2011. Concurrently, the value of imported pharmaceuticals from France rose by an average annual rate of 6%, totaling USD 143.3 million in 2011. It is noteworthy that France and Switzerland together account for about 45% of the 3,500 imported drugs which are sold in Lebanon. Likewise, the value of imported pharmaceuticals from the US grew by an average annual rate of 26% to reach USD 85.1 million in 2011.
However, the year 2012 witnessed a trend reversal in the value of pharmaceutical imports by country. While pharmaceutical imports from US saw the highest 23% rise to reach a value of USD 104.8 million, the value of imports from France and Switzerland dropped. In fact, the value of imported pharmaceuticals from Switzerland decreased by a yearly 8% to reach USD 104.4 million, while the value of pharmaceutical imports from France dropped by 4% to reach USD 137.8 million in 2012. The rise in Euro and Swiss franc during the previous year affected the choice of drug importers in Lebanon over countries of origin. Drugs prices in Euro and Swiss franc became more expensive as a result of the depreciating dollar against the aforementioned currencies. Hence, pharmaceutical importers shifted their demand from importing Swiss and French pharmaceutical products towards importing from the US given that the local currency is pegged to the US dollar.
In 2013, pharmaceuticals imported from Germany surpassed those imported from France, thus making Germany the major source of Lebanon’s imported pharmaceuticals. In fact, imported pharmaceuticals from Germany grew by a significant 28% to reach USD 160.5 million. Meanwhile, imports from each of France and the US witnessed modest increases of 3% and 2% respectively. As for pharmaceutical imports from Switzerland, they continued to fall in 2013, substituted by imports from Denmark (27% rise), Spain (17% rise), and Jordan (9% rise).
PHARMACEUTICAL IMPORTS AND EXPORTS
SPECIAL REPORT
Analysis of Lebanon’s Pharmaceutical Market - December 2014
13BankMed - Market & Economic Research Division
Source: Lebanese Customs
PHARMACEUTICAL IMPORTS BY COUNTRY
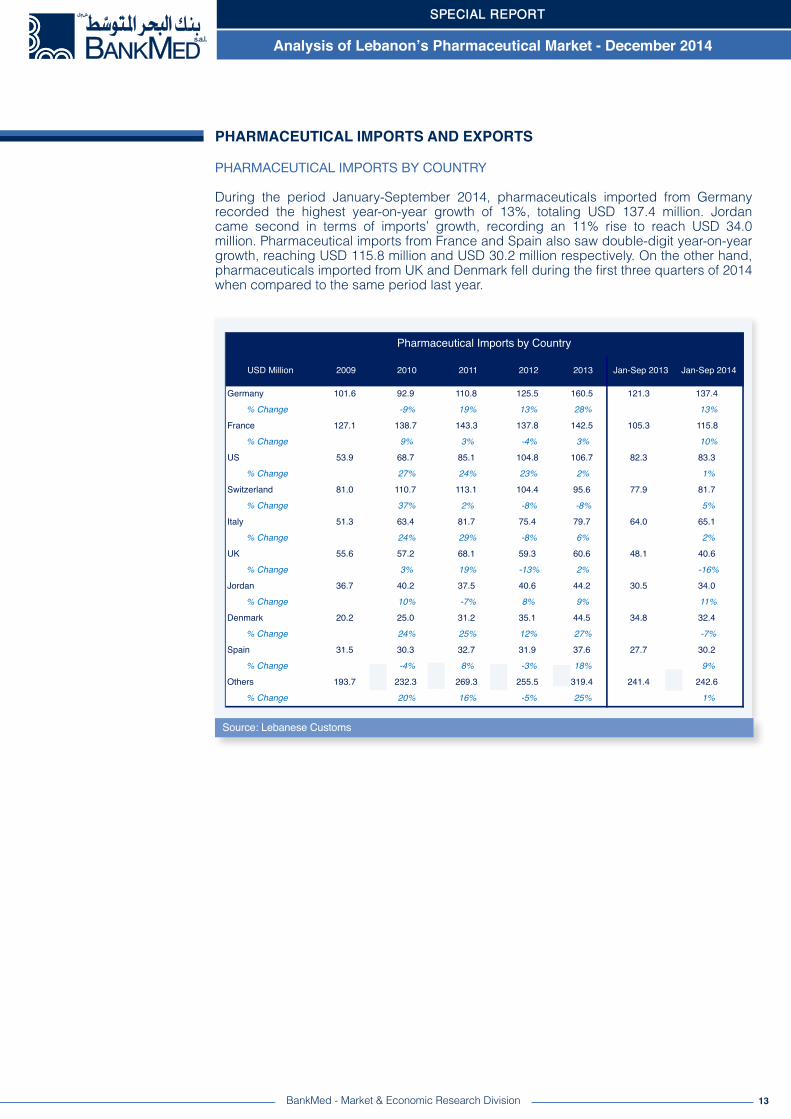
During the period January-September 2014, pharmaceuticals imported from Germany recorded the highest year-on-year growth of 13%, totaling USD 137.4 million. Jordan came second in terms of imports’ growth, recording an 11% rise to reach USD 34.0 million. Pharmaceutical imports from France and Spain also saw double-digit year-on-year growth, reaching USD 115.8 million and USD 30.2 million respectively. On the other hand, pharmaceuticals imported from UK and Denmark fell during the first three quarters of 2014 when compared to the same period last year.
PHARMACEUTICAL IMPORTS AND EXPORTS
SPECIAL REPORT
USD Million 2009 2010 2011 2012 2013 Jan-Sep 2013 Jan-Sep 2014
Germany 101.6 92.9 110.8 125.5 160.5 121.3 137.4% Change -9% 19% 13% 28% 13%
France 127.1 138.7 143.3 137.8 142.5 105.3 115.8% Change 9% 3% -4% 3% 10%
US 53.9 68.7 85.1 104.8 106.7 82.3 83.3% Change 27% 24% 23% 2% 1%
Switzerland 81.0 110.7 113.1 104.4 95.6 77.9 81.7% Change 37% 2% -8% -8% 5%
Italy 51.3 63.4 81.7 75.4 79.7 64.0 65.1% Change 24% 29% -8% 6% 2%
UK 55.6 57.2 68.1 59.3 60.6 48.1 40.6% Change 3% 19% -13% 2% -16%
Jordan 36.7 40.2 37.5 40.6 44.2 30.5 34.0% Change 10% -7% 8% 9% 11%
Denmark 20.2 25.0 31.2 35.1 44.5 34.8 32.4% Change 24% 25% 12% 27% -7%
Spain 31.5 30.3 32.7 31.9 37.6 27.7 30.2% Change -4% 8% -3% 18% 9%
Others 193.7 232.3 269.3 255.5 319.4 241.4 242.6% Change 20% 16% -5% 25% 1%
Pharmaceutical Imports by Country
Analysis of Lebanon’s Pharmaceutical Market - December 2014
14BankMed - Market & Economic Research Division
PHARMACEUTICAL IMPORTS BY COUNTRY
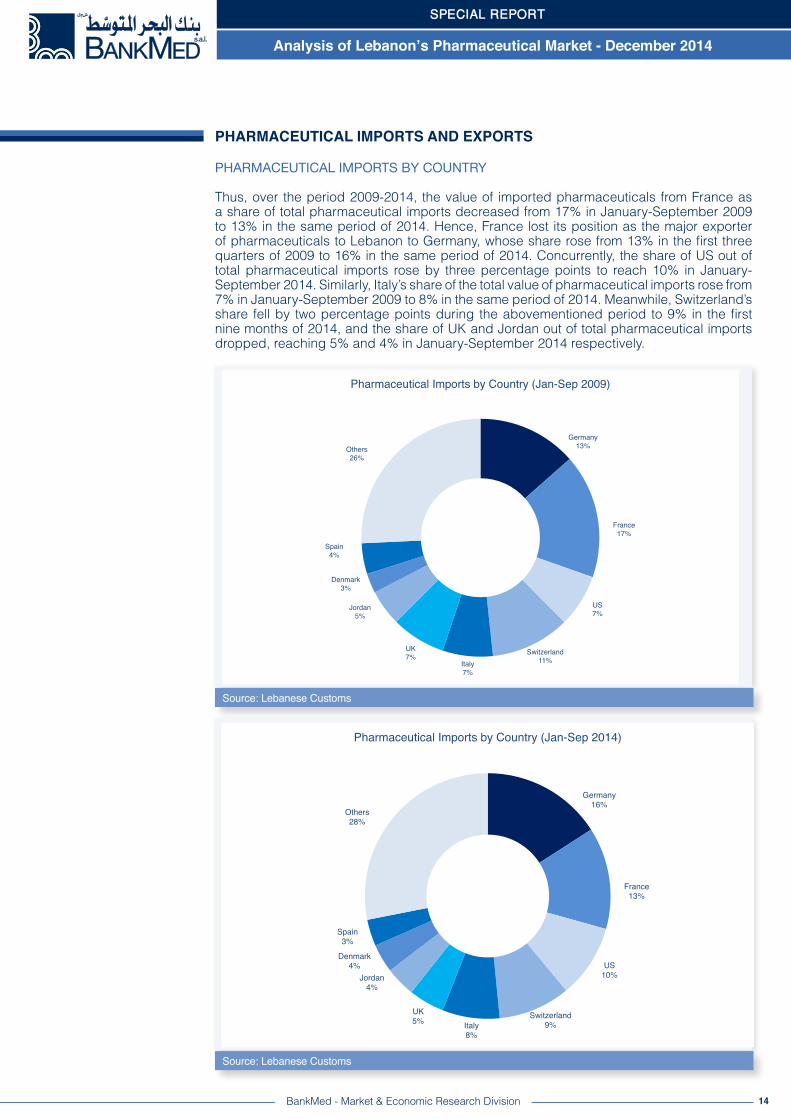
Thus, over the period 2009-2014, the value of imported pharmaceuticals from France as a share of total pharmaceutical imports decreased from 17% in January-September 2009 to 13% in the same period of 2014. Hence, France lost its position as the major exporter of pharmaceuticals to Lebanon to Germany, whose share rose from 13% in the first three quarters of 2009 to 16% in the same period of 2014. Concurrently, the share of US out of total pharmaceutical imports rose by three percentage points to reach 10% in January-September 2014. Similarly, Italy’s share of the total value of pharmaceutical imports rose from 7% in January-September 2009 to 8% in the same period of 2014. Meanwhile, Switzerland’s share fell by two percentage points during the abovementioned period to 9% in the first nine months of 2014, and the share of UK and Jordan out of total pharmaceutical imports dropped, reaching 5% and 4% in January-September 2014 respectively.
PHARMACEUTICAL IMPORTS AND EXPORTS
SPECIAL REPORT
Source: Lebanese Customs
Source: Lebanese Customs
Germany!13%!
France!17%!
US!7%!
Switzerland!11%!Italy!
7%!
UK!7%!
Jordan!5%!
Denmark!3%!
Spain!4%!
Others!26%!
Pharmaceutical Imports by Country (Jan-Sep 2009)!
Germany!16%!
France!13%!
US!10%!
Switzerland!9%!Italy!
8%!
UK!5%!
Jordan!4%!
Denmark!4%!
Spain!3%!
Others!28%!
Pharmaceutical Imports by Country (Jan-Sep 2014)!
Analysis of Lebanon’s Pharmaceutical Market - December 2014
15BankMed - Market & Economic Research Division
Source: Lebanese Customs
EVOLUTION OF PHARMACEUTICAL EXPORTS
With domestic demand consuming most of the imported and locally produced pharmaceutical products, Lebanon has a modest pharmaceutical export activity. However, despite the large pharmaceutical trade deficit, Lebanese pharmaceutical companies have reoriented their focus more towards export activity over the past few years as they faced subsiding local demand.
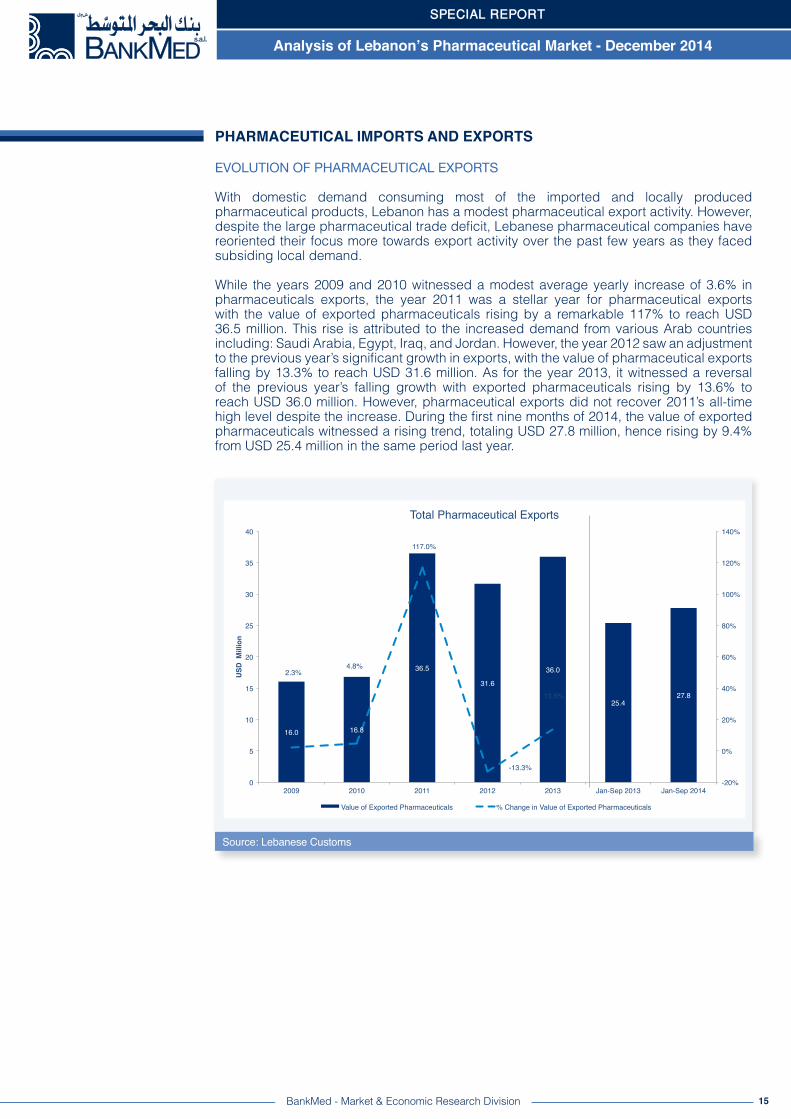
While the years 2009 and 2010 witnessed a modest average yearly increase of 3.6% in pharmaceuticals exports, the year 2011 was a stellar year for pharmaceutical exports with the value of exported pharmaceuticals rising by a remarkable 117% to reach USD 36.5 million. This rise is attributed to the increased demand from various Arab countries including: Saudi Arabia, Egypt, Iraq, and Jordan. However, the year 2012 saw an adjustment to the previous year’s significant growth in exports, with the value of pharmaceutical exports falling by 13.3% to reach USD 31.6 million. As for the year 2013, it witnessed a reversal of the previous year’s falling growth with exported pharmaceuticals rising by 13.6% to reach USD 36.0 million. However, pharmaceutical exports did not recover 2011’s all-time high level despite the increase. During the first nine months of 2014, the value of exported pharmaceuticals witnessed a rising trend, totaling USD 27.8 million, hence rising by 9.4% from USD 25.4 million in the same period last year.
PHARMACEUTICAL IMPORTS AND EXPORTS
SPECIAL REPORT
Analysis of Lebanon’s Pharmaceutical Market - December 2014
16BankMed - Market & Economic Research Division
PHARMACEUTICAL EXPORTS BY COUNTRY
Lebanon’s pharmaceutical exports are mostly destined to Arab countries. However, some non-Arab countries import specific types of pharmaceutical products that are locally manufactured.
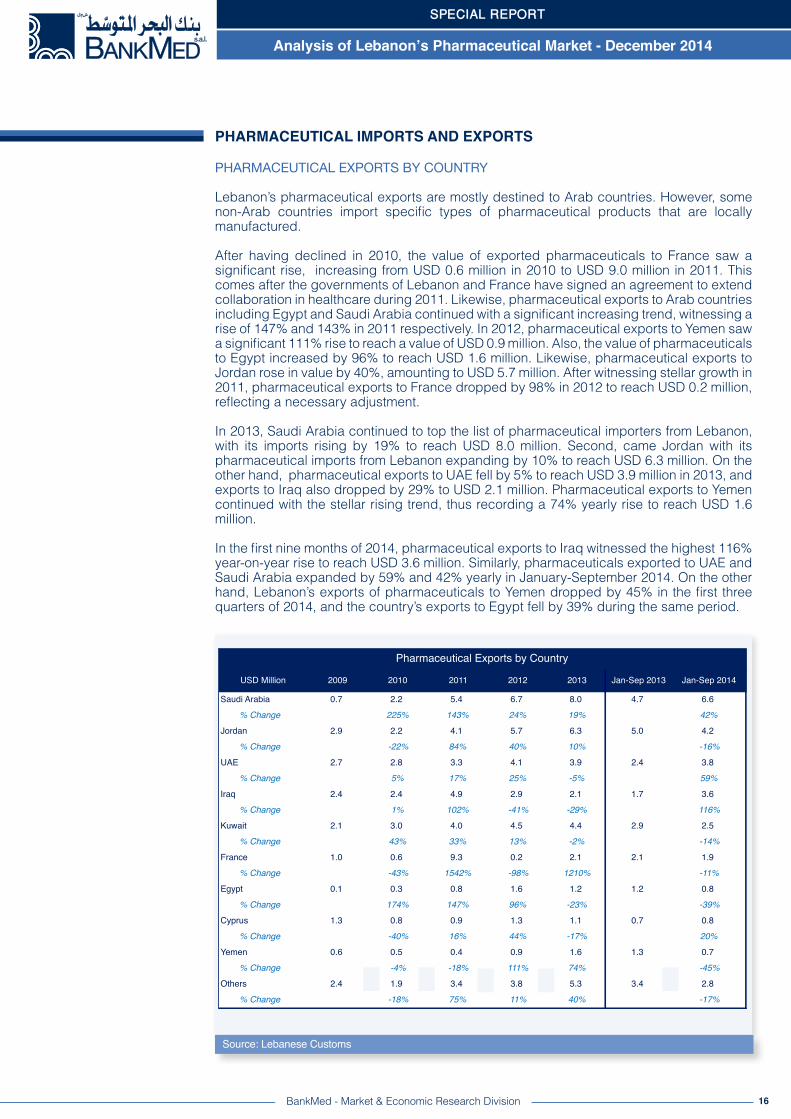
After having declined in 2010, the value of exported pharmaceuticals to France saw a significant rise, increasing from USD 0.6 million in 2010 to USD 9.0 million in 2011. This comes after the governments of Lebanon and France have signed an agreement to extend collaboration in healthcare during 2011. Likewise, pharmaceutical exports to Arab countries including Egypt and Saudi Arabia continued with a significant increasing trend, witnessing a rise of 147% and 143% in 2011 respectively. In 2012, pharmaceutical exports to Yemen saw a significant 111% rise to reach a value of USD 0.9 million. Also, the value of pharmaceuticals to Egypt increased by 96% to reach USD 1.6 million. Likewise, pharmaceutical exports to Jordan rose in value by 40%, amounting to USD 5.7 million. After witnessing stellar growth in 2011, pharmaceutical exports to France dropped by 98% in 2012 to reach USD 0.2 million, reflecting a necessary adjustment.
In 2013, Saudi Arabia continued to top the list of pharmaceutical importers from Lebanon, with its imports rising by 19% to reach USD 8.0 million. Second, came Jordan with its pharmaceutical imports from Lebanon expanding by 10% to reach USD 6.3 million. On the other hand, pharmaceutical exports to UAE fell by 5% to reach USD 3.9 million in 2013, and exports to Iraq also dropped by 29% to USD 2.1 million. Pharmaceutical exports to Yemen continued with the stellar rising trend, thus recording a 74% yearly rise to reach USD 1.6 million.
In the first nine months of 2014, pharmaceutical exports to Iraq witnessed the highest 116% year-on-year rise to reach USD 3.6 million. Similarly, pharmaceuticals exported to UAE and Saudi Arabia expanded by 59% and 42% yearly in January-September 2014. On the other hand, Lebanon’s exports of pharmaceuticals to Yemen dropped by 45% in the first three quarters of 2014, and the country’s exports to Egypt fell by 39% during the same period.
PHARMACEUTICAL IMPORTS AND EXPORTS
SPECIAL REPORT
Source: Lebanese Customs
USD Million 2009 2010 2011 2012 2013 Jan-Sep 2013 Jan-Sep 2014
Saudi Arabia 0.7 2.2 5.4 6.7 8.0 4.7 6.6% Change 225% 143% 24% 19% 42%
Jordan 2.9 2.2 4.1 5.7 6.3 5.0 4.2% Change -22% 84% 40% 10% -16%
UAE 2.7 2.8 3.3 4.1 3.9 2.4 3.8% Change 5% 17% 25% -5% 59%
Iraq 2.4 2.4 4.9 2.9 2.1 1.7 3.6% Change 1% 102% -41% -29% 116%
Kuwait 2.1 3.0 4.0 4.5 4.4 2.9 2.5% Change 43% 33% 13% -2% -14%
France 1.0 0.6 9.3 0.2 2.1 2.1 1.9% Change -43% 1542% -98% 1210% -11%
Egypt 0.1 0.3 0.8 1.6 1.2 1.2 0.8% Change 174% 147% 96% -23% -39%
Cyprus 1.3 0.8 0.9 1.3 1.1 0.7 0.8% Change -40% 16% 44% -17% 20%
Yemen 0.6 0.5 0.4 0.9 1.6 1.3 0.7% Change -4% -18% 111% 74% -45%
Others 2.4 1.9 3.4 3.8 5.3 3.4 2.8% Change -18% 75% 11% 40% -17%
Pharmaceutical Exports by Country
Analysis of Lebanon’s Pharmaceutical Market - December 2014

17
Source: Lebanese Customs
Source: Lebanese Customs
BankMed - Market & Economic Research Division
PHARMACEUTICAL EXPORTS BY COUNTRY
Hence, over the period 2009-2014, the value of exported pharmaceuticals to Saudi Arabia as a share of total pharmaceutical exports increased significantly from 4% in January-September 2009 to 24% in the same period of 2014, thus making Saudi Arabia the major importer of pharmaceuticals from Lebanon. Concurrently, the share of France out of total pharmaceutical exports rose by one percentage point to reach 7% in the first three quarters of 2014. Similarly, Egypt’s share of the total value of pharmaceutical exports rose from 1% in January-September 2009 to 3% in the same period of 2014. On the other hand, the share of each of Jordan (15%), Iraq (13%), and Kuwait (9%) dropped during the aforementioned period. Nonetheless, Arab countries still constitute about 80% of the demand for Lebanon’s pharmaceutical exports.
PHARMACEUTICAL IMPORTS AND EXPORTS
SPECIAL REPORT
Saudi Arabia!4%!
Jordan!18%!
UAE!16%!
Iraq!15%!
Kuwait!13%!
France!6%!
Egypt!1%!
Cyprus!8%!
Yemen!4%!
Others!15%!
Pharmaceutical Exports by Country (Jan-Sep 2009)!
Saudi Arabia!24%!
Jordan!15%!
UAE!14%!
Iraq!13%!
Kuwait!9%!
France!7%!
Egypt!3%!
Cyprus!3%!
Yemen!2%!
Others!10%!
Pharmaceutical Exports by Country (Jan-Sep 2014)!
Analysis of Lebanon’s Pharmaceutical Market - December 2014
18
PHARMACEUTICAL EXPORTS BY COUNTRY
In conclusion, while Lebanon’s pharmaceutical sector faces several challenges related to the governing framework and price-setting principles, the pharmaceutical market still achieved high growth rates over the past few years mainly due to the high spending on pharmaceuticals in Lebanon. However, to satisfy local demand, imports constitute the bulk of the pharmaceutical products sold in the Lebanese market due to limited local production. Despite this, Lebanese pharmaceutical companies are still finding room for exports and have thus reoriented their strategies towards placing more focus on external markets.
PHARMACEUTICAL IMPORTS AND EXPORTS
SPECIAL REPORT
Disclaimer:This material has been prepared by BankMed, sal based on publicly available information and personal analysis. It is provided for information purposes only. It is not intended to be used as a research tool nor as a basis or reference for any decision. The information contained herein including any opinion, news and analysis, is based on various publicly available sources believed to be reliable but its accuracy cannot be guaranteed and may be subject to change without notice. BankMed, sal does not guarantee the accuracy, timeliness, continued availability or completeness of such information. All data contained herein are indicative. Neither the information provided nor any opinion expressed therein, constitutes a solicitation, offer, personal recommendation or advice. BankMed, sal does not assume any liability for direct, indirect, incidental or consequential damages resulting from any use of the information contained herein.
Mazen Soueid, Stephanie Ghanem, Ziad Hariri, Nadine Yamout, Rita Nehme
Analysis of Lebanon’s Pharmaceutical Market - December 2014