
Dr. Rick Sibbel - Pharmaceutical Industry Perspective of the Impacts of the Regulatory Environment
Pharmaceutical Market Perspective
Policy Dialogue on Universal Health Care & Access to Medicines
25 July 2013
Disclaimer
IMS does not warrant that the information contained herein shall meet the present or future needs or objectives of the recipient, who assumes sole responsibility for the use, selection, and suitability of the said information to its needs and objectives. IMS shall not be liable for any expressions of opinion, evaluations, or forecasts contained in the said information. For Services or deliverables provided by IMS Health which contain forward-looking statements or projections, it is acknowledged by the Parties that such forward-looking statements or projections are subject to known and unknown risks, uncertainties, and other factors which could cause the actual results or performance to differ from such projections, and IMS shall not be responsible for and disclaims any liability arising from any such differences. IMS does not accept or assume responsibility to any person or third party for any matter contained in or referred to in the information provided in accordance with these Services or for any reliance placed on the information contained in this presentation or deliverables resulting from these Services.
Agenda
• The Philippine pharma market (size & growth)
• Market share trends
• Ethical vs. OTC
• Retail vs. hospital sectors
• Innovators vs. branded generics vs. unbranded generics
• Philippines
• Comparator Asian countries
• Post-MDRP/GMAP scenario (snapshots for select molecules)
• Summary: Prospects for the Philippine pharma market
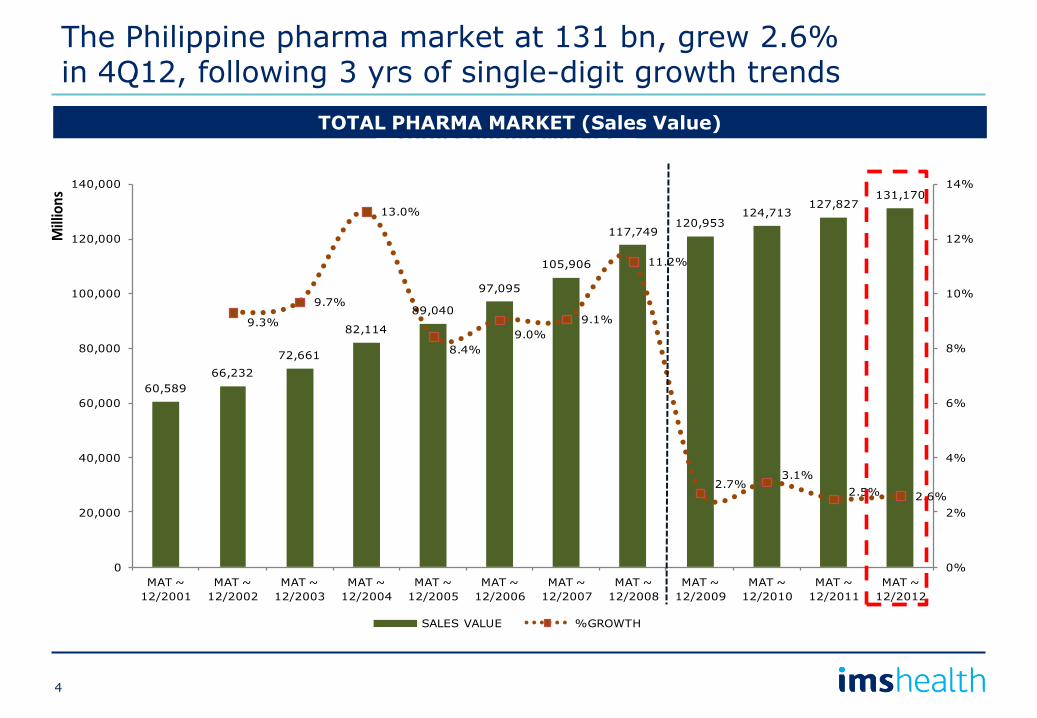
60,589
66,232
72,661
82,114
89,040
97,095
105,906
117,749120,953
124,713127,827
131,170
9.3%
9.7%
13.0%
8.4%
9.0%
9.1%
11.2%
2.7%3.1%
2.5% 2.6%
0%
2%
4%
6%
8%
10%
12%
14%
0
20,000
40,000
60,000
80,000
100,000
120,000
140,000
MAT ~
12/2001
MAT ~
12/2002
MAT ~
12/2003
MAT ~
12/2004
MAT ~
12/2005
MAT ~
12/2006
MAT ~
12/2007
MAT ~
12/2008
MAT ~
12/2009
MAT ~
12/2010
MAT ~
12/2011
MAT ~
12/2012
Millions
Total Pharma Marketin Sales Value
SALES VALUE %GROWTH
TOTAL PHARMA MARKET (Sales Value)
The Philippine pharma market at 131 bn, grew 2.6% in 4Q12, following 3 yrs of single-digit growth trends
4
56,324
62,113
68,661
76,690
83,412
90,684
99,016
109,928112,943
117,066121,167
124,548
10.3%
10.5%
11.7%
8.8% 8.7%
9.2%
11.0%
2.7%
3.7%3.5%
2.8%
0%
2%
4%
6%
8%
10%
12%
14%
0
20,000
40,000
60,000
80,000
100,000
120,000
140,000
MAT ~
12/2001
MAT ~
12/2002
MAT ~
12/2003
MAT ~
12/2004
MAT ~
12/2005
MAT ~
12/2006
MAT ~
12/2007
MAT ~
12/2008
MAT ~
12/2009
MAT ~
12/2010
MAT ~
12/2011
MAT ~
12/2012
Millions
Total Pharma Market less V6V7in Sales Value
SALES VALUE %GROWTH
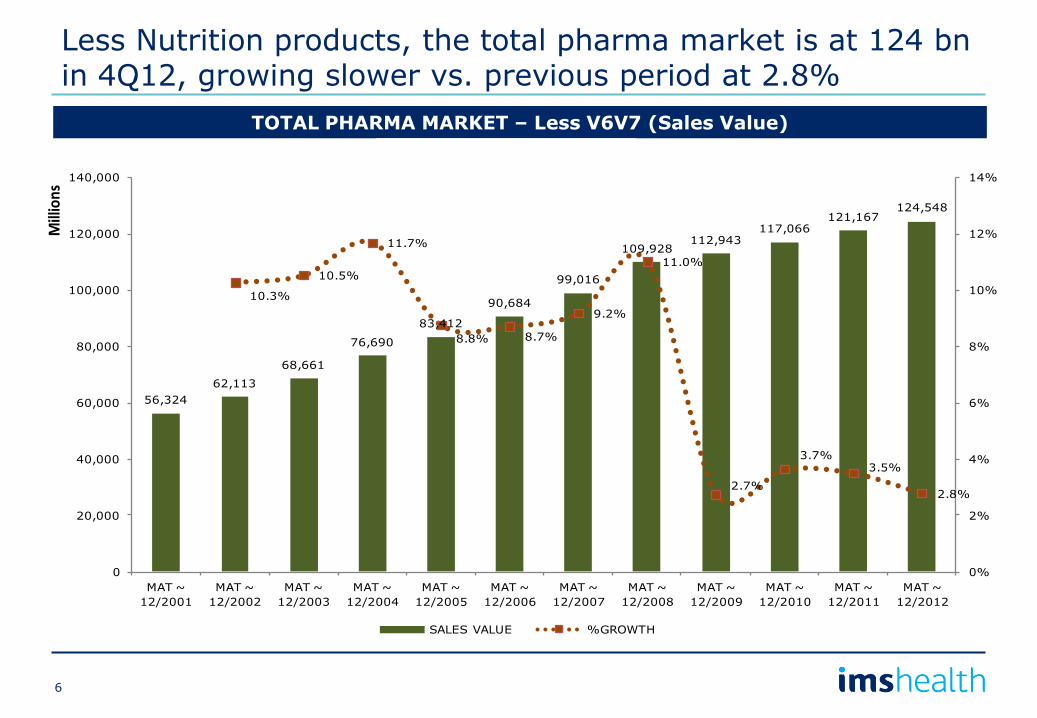
TOTAL PHARMA MARKET – Less V6V7 (Sales Value)
Less Nutrition products, the total pharma market is at 124 bn in 4Q12, growing slower vs. previous period at 2.8%
6
Agenda
• The Philippine pharma market (size & growth)
• Market share trends
• Ethical vs. OTC
• Retail vs. hospital sectors
• Innovators vs. branded generics vs. unbranded generics
• Philippines
• Comparator Asian countries
• Post-MDRP/GMAP scenario (snapshots for select molecules)
• Summary: Prospects for the Philippine pharma market
42,04246,320 49,733
55,78361,944
66,46873,285
81,466 82,006 84,897 88,143 90,78514,282
15,793
18,929
20,907
21,469
24,215
25,730
28,462 30,93732,169
33,02433,764
10.2%
7.4%
12.2% 11.0%
7.3%
10.3%
11.2%
0.7%
3.5%
3.8% 3.0%
10.6%
19.9%
10.5%
2.7%
12.8%
6.3%
10.6%
8.7%
4.0%
2.7%2.2%
0%
5%
10%
15%
20%
25%
0
20,000
40,000
60,000
80,000
100,000
120,000
140,000
MAT ~
12/2001
MAT ~
12/2002
MAT ~
12/2003
MAT ~
12/2004
MAT ~
12/2005
MAT ~
12/2006
MAT ~
12/2007
MAT ~
12/2008
MAT ~
12/2009
MAT ~
12/2010
MAT ~
12/2011
MAT ~
12/2012
Millions
Ethical vs. OTC (less V6V7)in Sales Value
Ethical Proprietar %GR Ethical %GR Proprietary
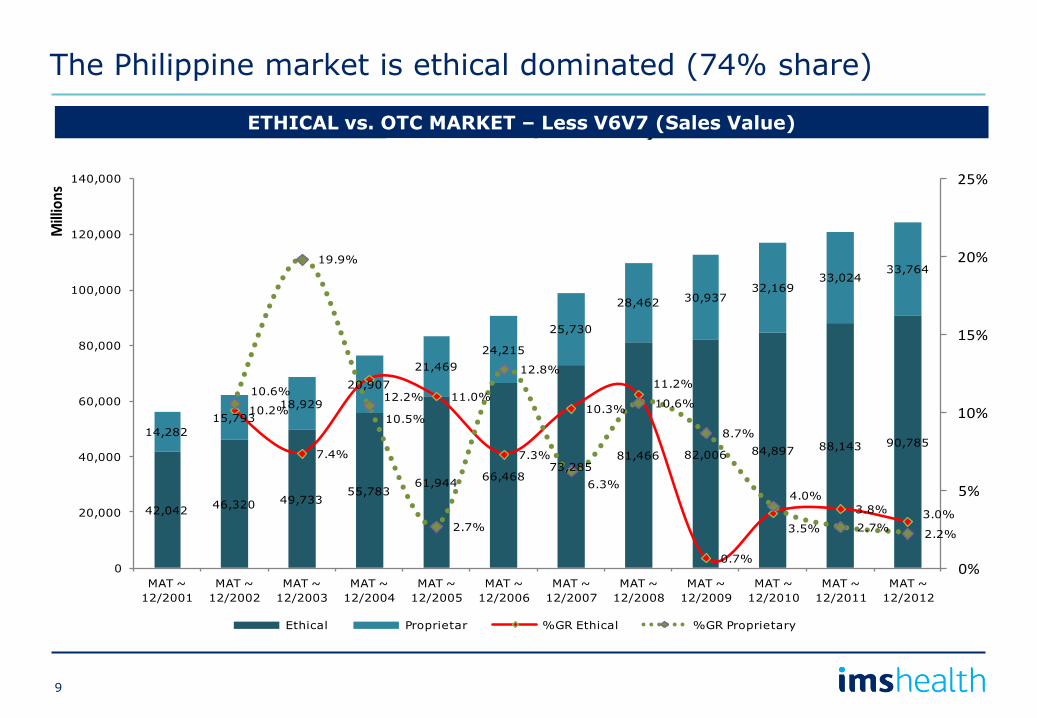
ETHICAL vs. OTC MARKET – Less V6V7 (Sales Value)
The Philippine market is ethical dominated (74% share)
9
49,25054,262
60,63467,469
73,37180,370
87,786
98,023 100,991 104,299 107,282 109,8957,075
7,852
8,028
9,220
10,041
10,314
11,230
11,90511,952
12,76713,885
14,653
10.2%
11.7%11.3%
8.7%9.5%
9.2%
11.7%
3.0%3.3%
2.9%2.4%
11.0%
2.2%
14.9%
8.9%
2.7%
8.9%
6.0%
0.4%
6.8%
8.8%
5.5%
0%
2%
4%
6%
8%
10%
12%
14%
16%
0
20,000
40,000
60,000
80,000
100,000
120,000
140,000
MAT ~
12/2001
MAT ~
12/2002
MAT ~
12/2003
MAT ~
12/2004
MAT ~
12/2005
MAT ~
12/2006
MAT ~
12/2007
MAT ~
12/2008
MAT ~
12/2009
MAT ~
12/2010
MAT ~
12/2011
MAT ~
12/2012
Millions
Drugstore vs. Hospital (less V6V7)in Sales Value
PHILIPPINES DRUGSTORE PHILIPPINES HOSPITAL %GR DS %GR HS
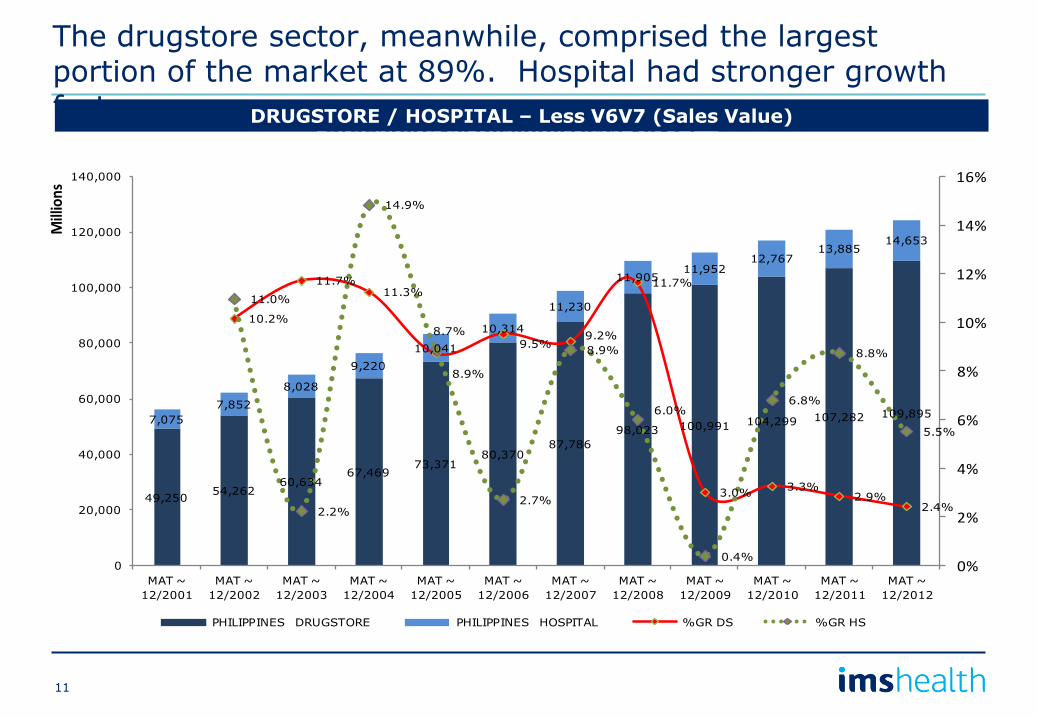
DRUGSTORE / HOSPITAL – Less V6V7 (Sales Value)
The drugstore sector, meanwhile, comprised the largest portion of the market at 89%. Hospital had stronger growth faster
11
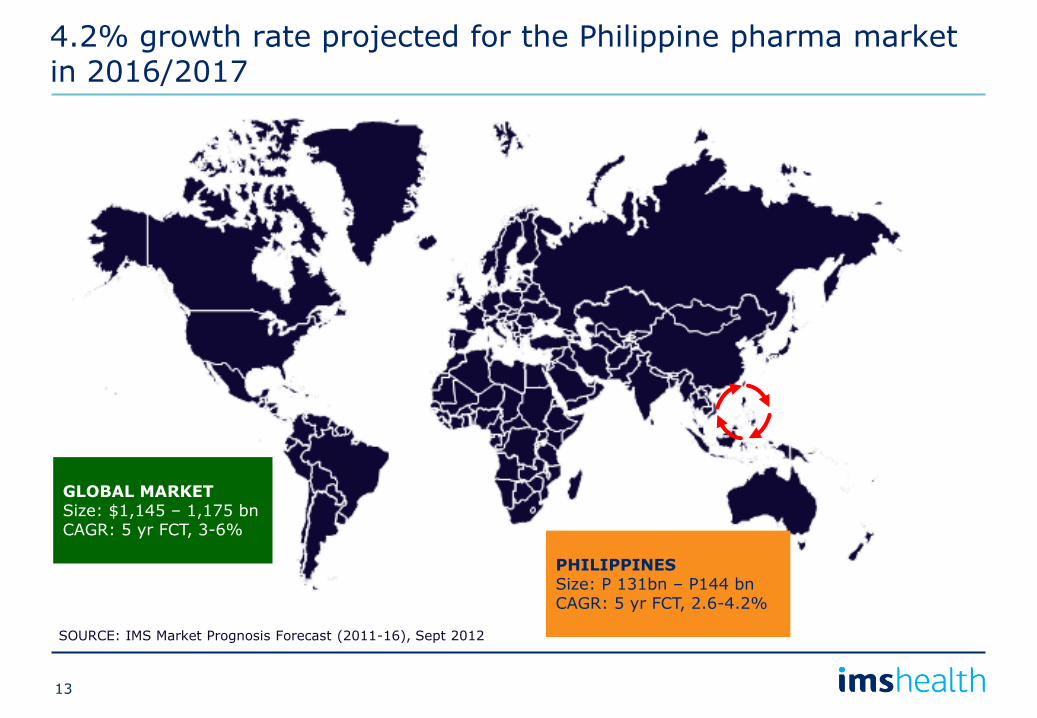
4.2% growth rate projected for the Philippine pharma market in 2016/2017
SOURCE: IMS Market Prognosis Forecast (2011-16), Sept 2012
GLOBAL MARKET Size: $1,145 – 1,175 bn CAGR: 5 yr FCT, 3-6%
PHILIPPINES Size: P 131bn – P144 bn CAGR: 5 yr FCT, 2.6-4.2%
13
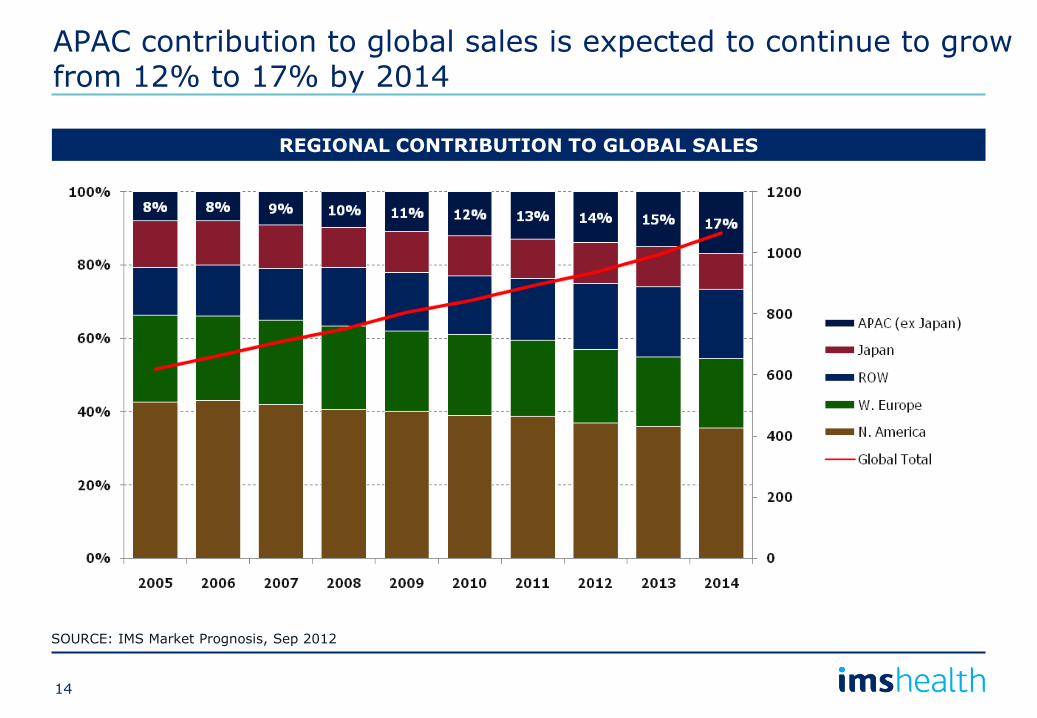
APAC contribution to global sales is expected to continue to grow from 12% to 17% by 2014
SOURCE: IMS Market Prognosis, Sep 2012
REGIONAL CONTRIBUTION TO GLOBAL SALES
14
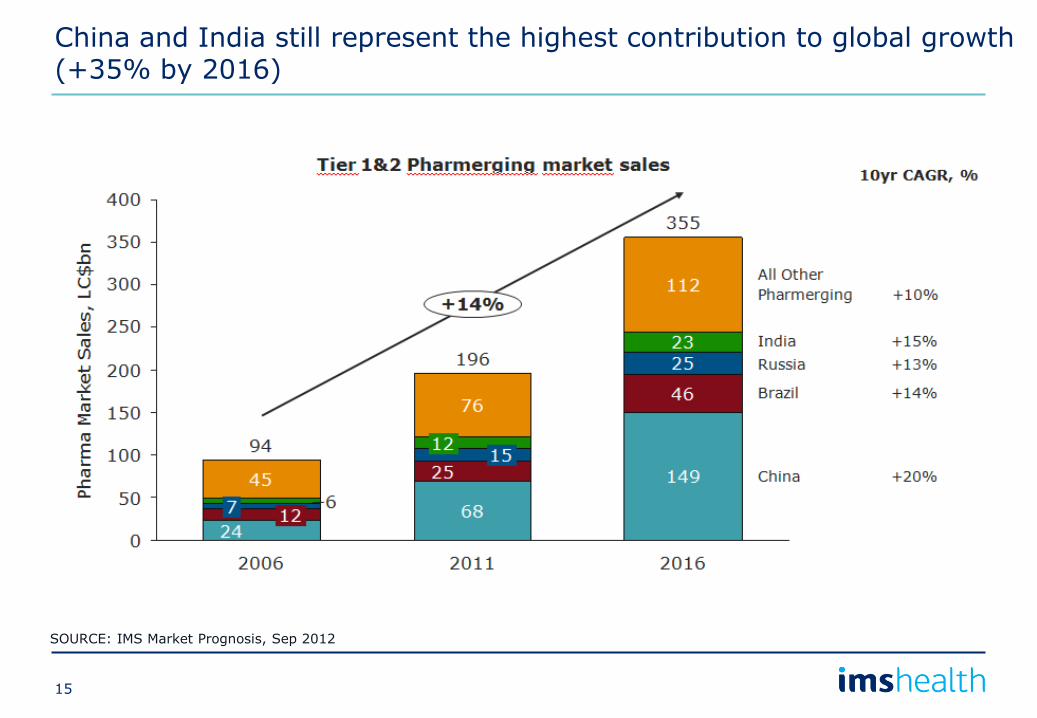
China and India still represent the highest contribution to global growth (+35% by 2016)
SOURCE: IMS Market Prognosis, Sep 2012
15
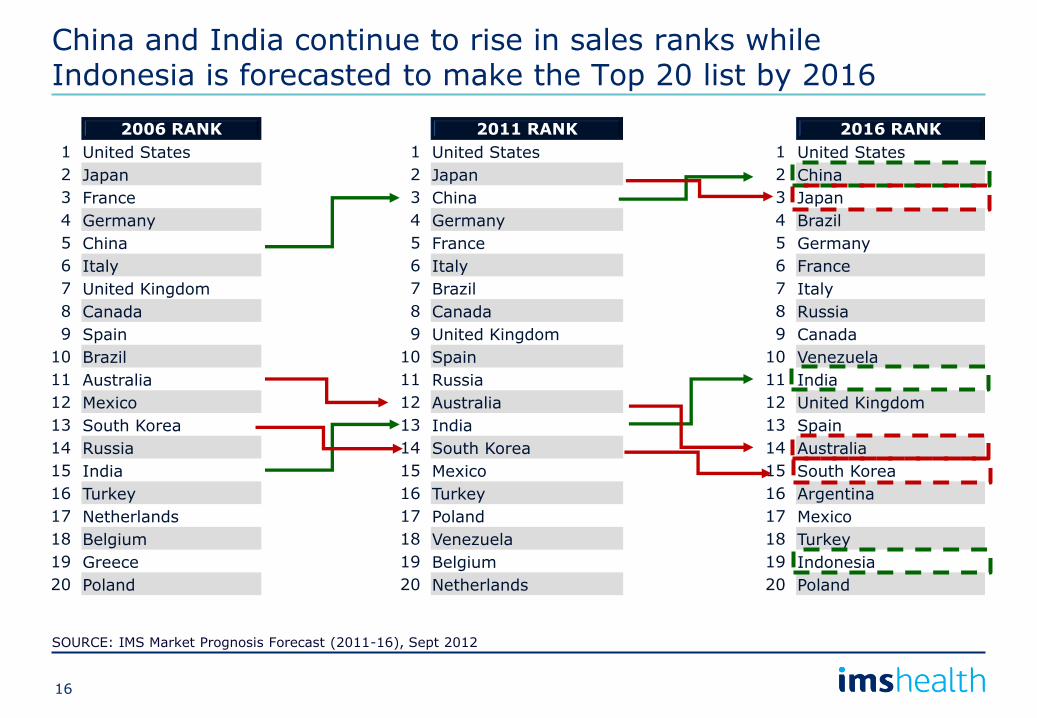
China and India continue to rise in sales ranks while Indonesia is forecasted to make the Top 20 list by 2016
2006 RANK 2011 RANK 2016 RANK
1 United States 1 United States 1 United States
2 Japan 2 Japan 2 China
3 France 3 China 3 Japan
4 Germany 4 Germany 4 Brazil
5 China 5 France 5 Germany
6 Italy 6 Italy 6 France
7 United Kingdom 7 Brazil 7 Italy
8 Canada 8 Canada 8 Russia
9 Spain 9 United Kingdom 9 Canada
10 Brazil 10 Spain 10 Venezuela
11 Australia 11 Russia 11 India
12 Mexico 12 Australia 12 United Kingdom
13 South Korea 13 India 13 Spain
14 Russia 14 South Korea 14 Australia
15 India 15 Mexico 15 South Korea
16 Turkey 16 Turkey 16 Argentina
17 Netherlands 17 Poland 17 Mexico
18 Belgium 18 Venezuela 18 Turkey
19 Greece 19 Belgium 19 Indonesia
20 Poland 20 Netherlands 20 Poland
SOURCE: IMS Market Prognosis Forecast (2011-16), Sept 2012
16
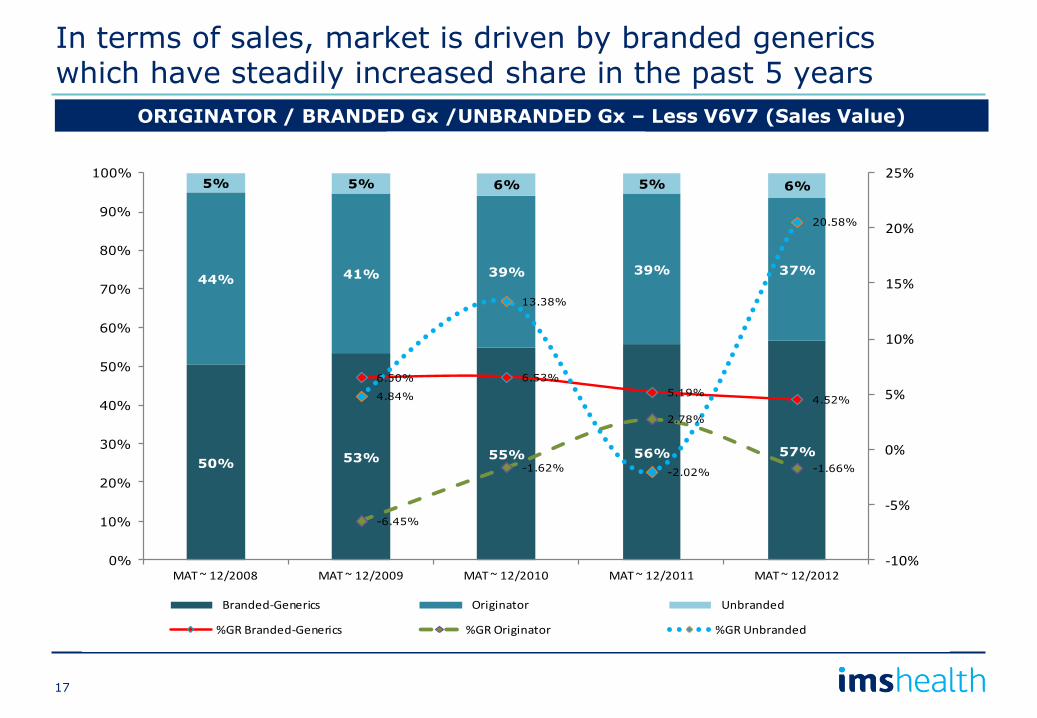
50% 53% 55% 56% 57%
44% 41% 39% 39% 37%
5% 5% 6% 5% 6%
6.50% 6.53%
5.19%4.52%
-6.45%
-1.62%
2.78%
-1.66%
4.84%
13.38%
-2.02%
20.58%
-10%
-5%
0%
5%
10%
15%
20%
25%
0%
10%
20%
30%
40%
50%
60%
70%
80%
90%
100%
MAT ~ 12/2008 MAT ~ 12/2009 MAT ~ 12/2010 MAT ~ 12/2011 MAT ~ 12/2012
Ethical Market less V6V7Share Trend in Sales Value
Branded-Generics Originator Unbranded
%GR Branded-Generics %GR Originator %GR Unbranded
ORIGINATOR / BRANDED Gx /UNBRANDED Gx – Less V6V7 (Sales Value)
In terms of sales, market is driven by branded generics which have steadily increased share in the past 5 years
17
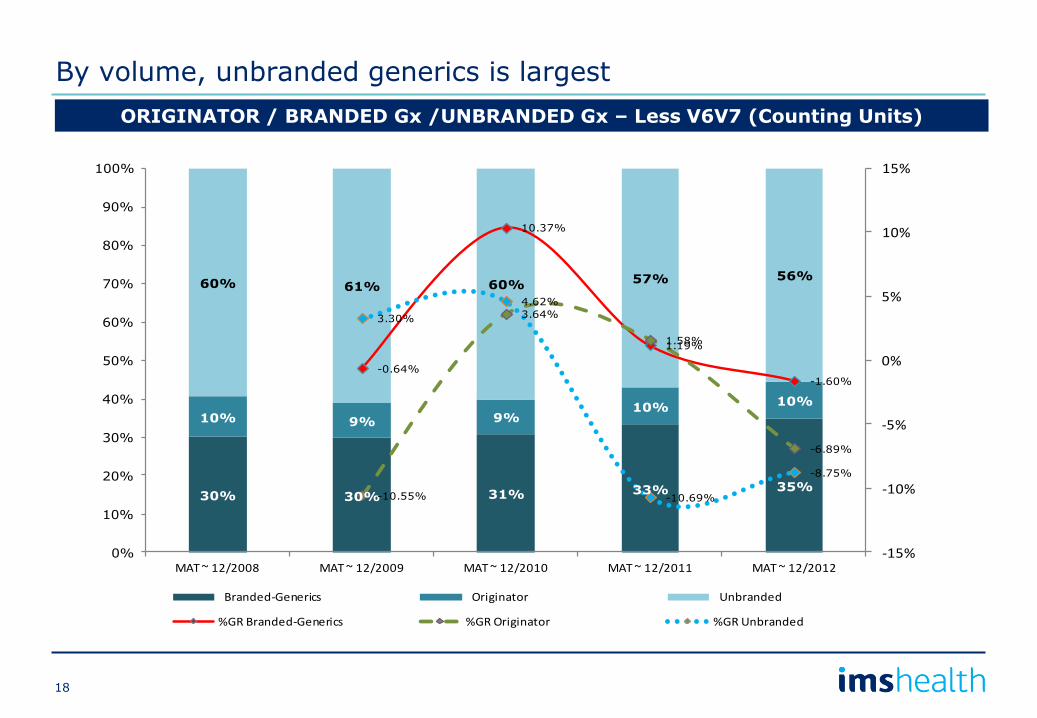
30% 30% 31% 33% 35%
10% 9% 9%10%
10%
60% 61% 60% 57% 56%
-0.64%
10.37%
1.19%
-1.60%
-10.55%
3.64%
1.58%
-6.89%
3.30%
4.62%
-10.69%
-8.75%
-15%
-10%
-5%
0%
5%
10%
15%
0%
10%
20%
30%
40%
50%
60%
70%
80%
90%
100%
MAT ~ 12/2008 MAT ~ 12/2009 MAT ~ 12/2010 MAT ~ 12/2011 MAT ~ 12/2012
Ethical Market less V6V7Share Trend in Counting Units
Branded-Generics Originator Unbranded
%GR Branded-Generics %GR Originator %GR Unbranded
ORIGINATOR / BRANDED Gx /UNBRANDED Gx – Less V6V7 (Counting Units)
By volume, unbranded generics is largest
18
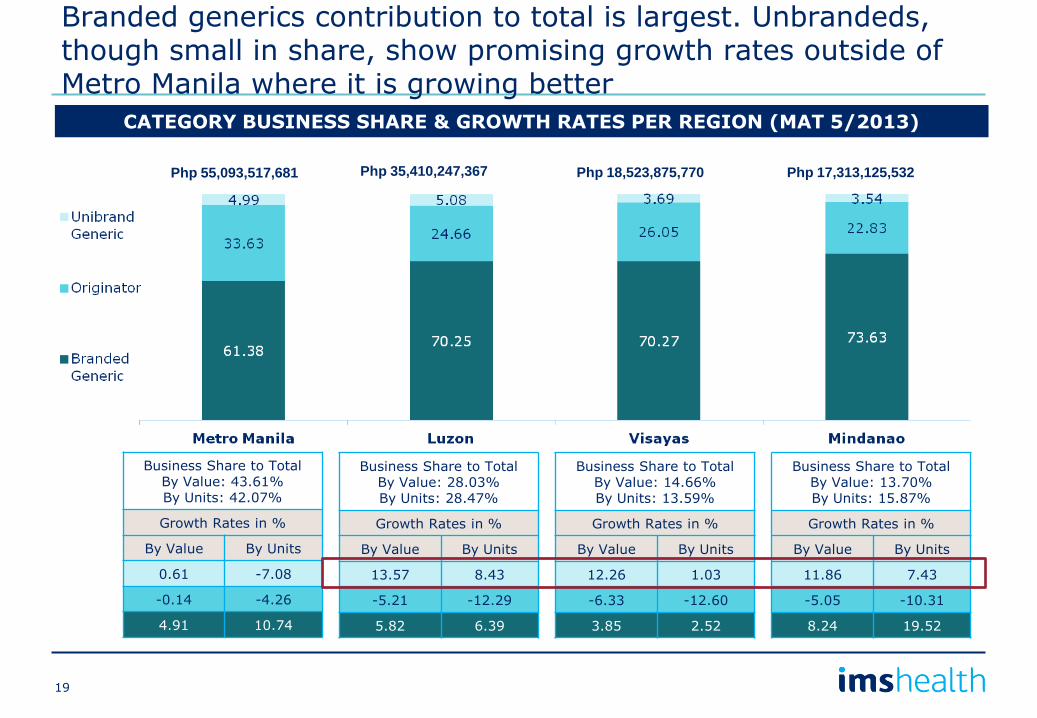
Branded generics contribution to total is largest. Unbrandeds, though small in share, show promising growth rates outside of Metro Manila where it is growing better
Business Share to Total By Value: 43.61% By Units: 42.07%
Growth Rates in %
By Value By Units
0.61 -7.08
-0.14 -4.26
4.91 10.74
Business Share to Total By Value: 28.03% By Units: 28.47%
Growth Rates in %
By Value By Units
13.57 8.43
-5.21 -12.29
5.82 6.39
Business Share to Total By Value: 14.66% By Units: 13.59%
Growth Rates in %
By Value By Units
12.26 1.03
-6.33 -12.60
3.85 2.52
Business Share to Total By Value: 13.70% By Units: 15.87%
Growth Rates in %
By Value By Units
11.86 7.43
-5.05 -10.31
8.24 19.52
Php 55,093,517,681 Php 35,410,247,367 Php 18,523,875,770 Php 17,313,125,532
CATEGORY BUSINESS SHARE & GROWTH RATES PER REGION (MAT 5/2013)
19
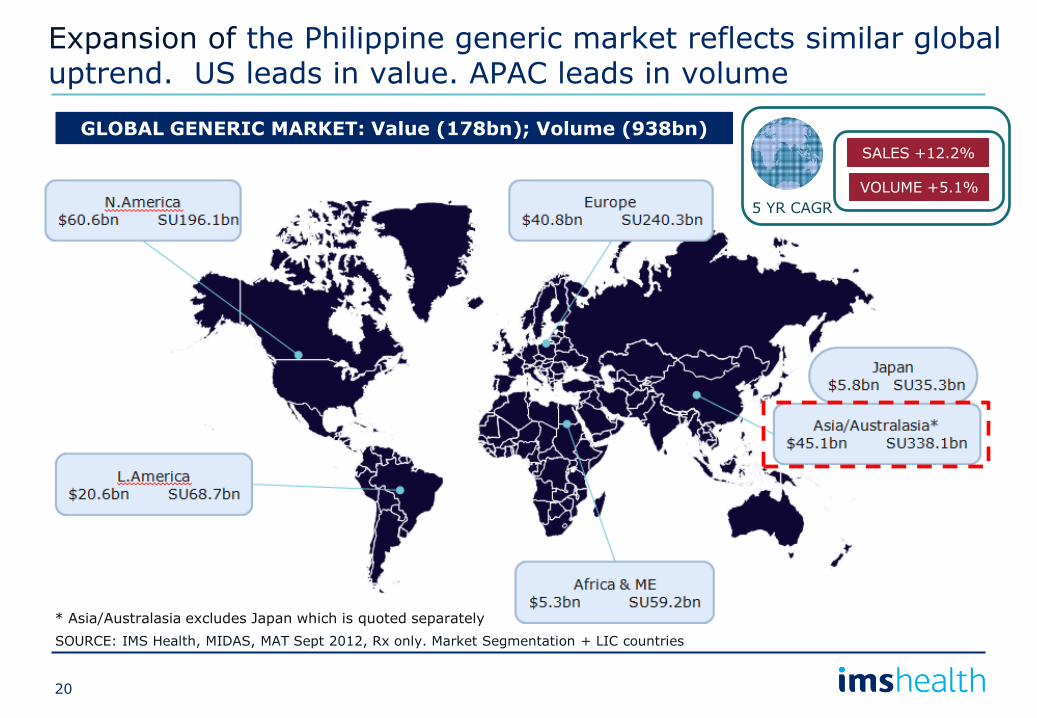
Expansion of the Philippine generic market reflects similar global uptrend. US leads in value. APAC leads in volume
SOURCE: IMS Health, MIDAS, MAT Sept 2012, Rx only. Market Segmentation + LIC countries
* Asia/Australasia excludes Japan which is quoted separately
5 YR CAGR
SALES +12.2%
VOLUME +5.1%
GLOBAL GENERIC MARKET: Value (178bn); Volume (938bn)
20
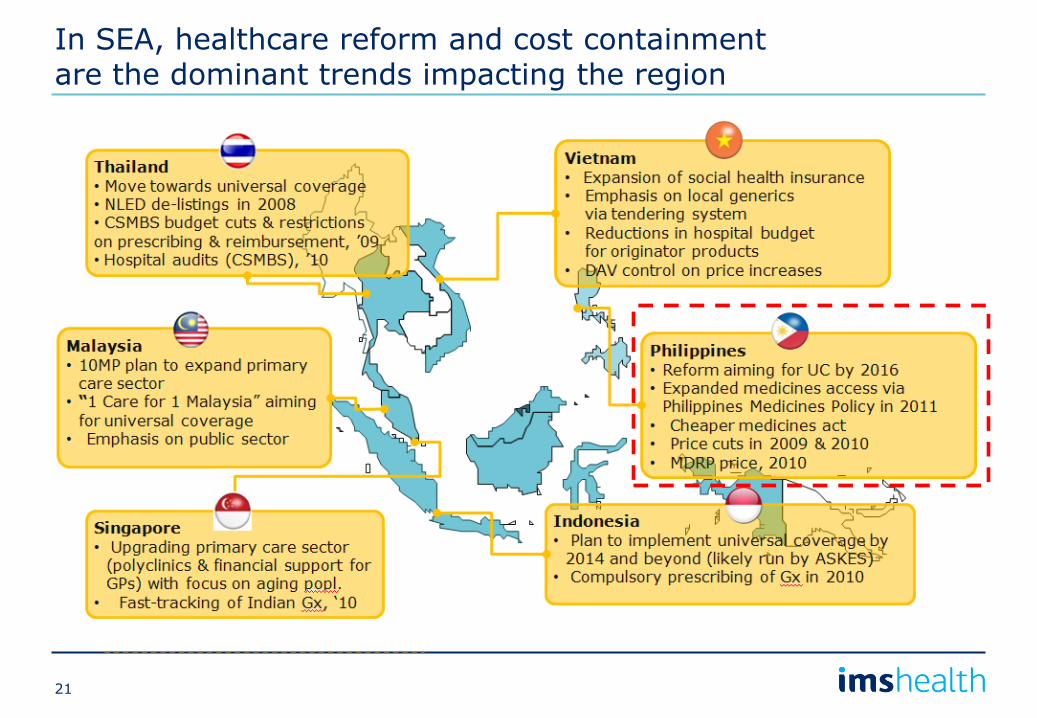
In SEA, healthcare reform and cost containment are the dominant trends impacting the region
21
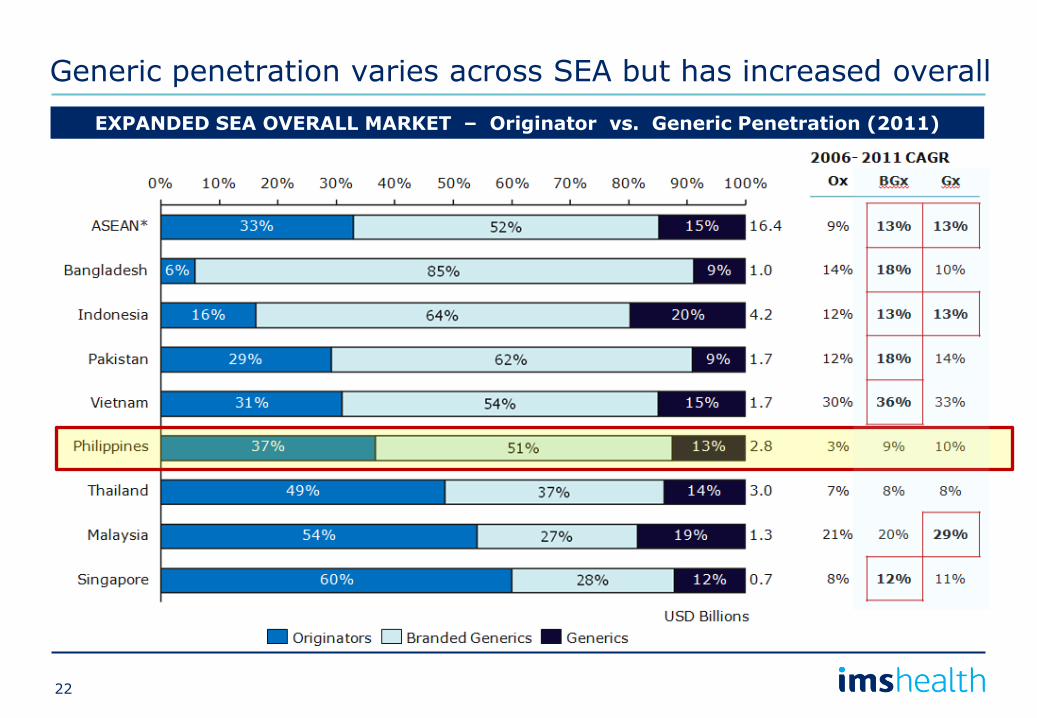
Generic penetration varies across SEA but has increased overall
EXPANDED SEA OVERALL MARKET – Originator vs. Generic Penetration (2011)
22
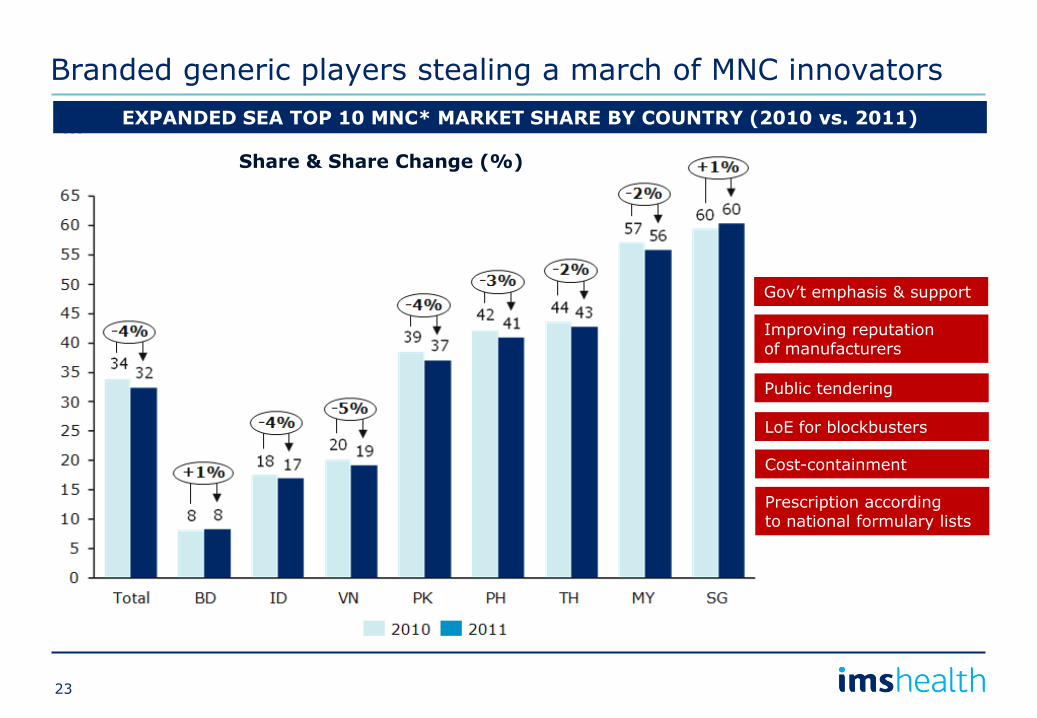
Branded generic players stealing a march of MNC innovators
…
SOURCE:
EXPANDED SEA TOP 10 MNC* MARKET SHARE BY COUNTRY (2010 vs. 2011)
Gov’t emphasis & support
Improving reputation of manufacturers
Public tendering
LoE for blockbusters
Cost-containment
Prescription according to national formulary lists
Share & Share Change (%)
23
Agenda
• The Philippine pharma market (size & growth)
• Market share trends
• Ethical vs. OTC
• Retail vs. hospital sectors
• Innovators vs. branded generics vs. unbranded generics
• Philippines
• Comparator Asian countries
• Post-MDRP/GMAP scenario (snapshots for select molecules)
• Summary: Prospects for the Philippine pharma market
0
500
1,000
1,500
2,000
2,500
3,000
3,500
MAT ~
12/2001
MAT ~
12/2002
MAT ~
12/2003
MAT ~
12/2004
MAT ~
12/2005
MAT ~
12/2006
MAT ~
12/2007
MAT ~
12/2008
MAT ~
12/2009
MAT ~
12/2010
MAT ~
12/2011
MAT ~
12/2012
Thousands
Amlodipine PrescriptionOriginator vs Generic Rx vs Others
ORIGINATOR AMLODIPINE GGG OTHERS
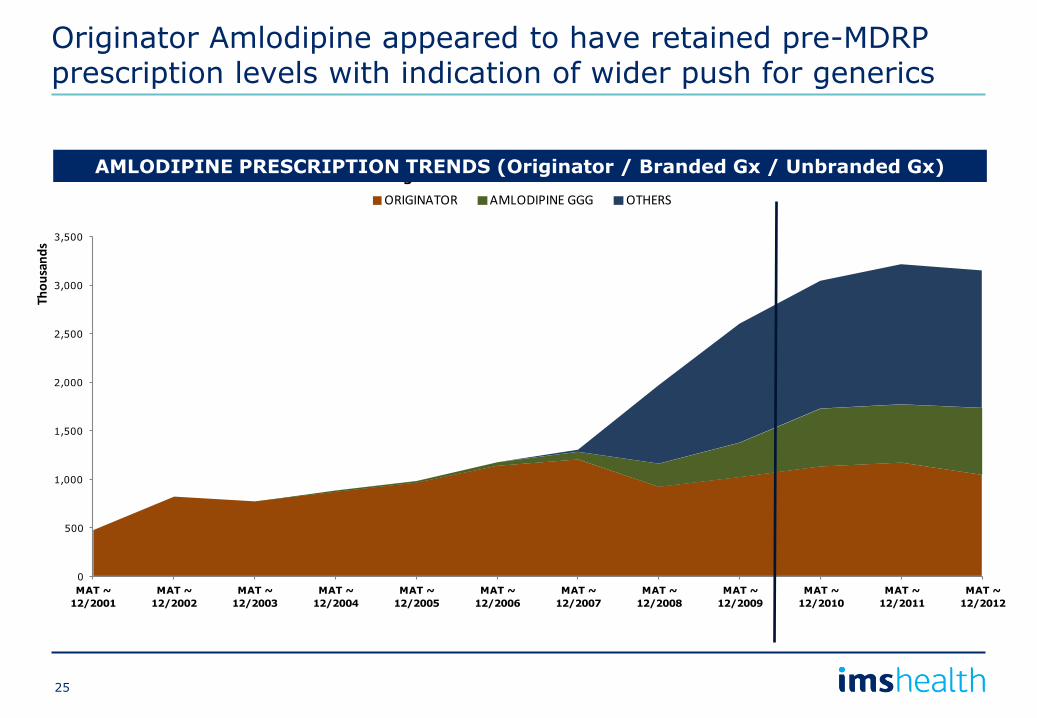
Originator Amlodipine appeared to have retained pre-MDRP prescription levels with indication of wider push for generics
AMLODIPINE PRESCRIPTION TRENDS (Originator / Branded Gx / Unbranded Gx)
25
40 43 44 43 40
34
57
7383 89
4
10
15
20
35
1,982
1,648
1,101 1,075
996
503716
833
9371,011
58137
187
230
376
0
500
1000
1500
2000
2500
3000
0
20
40
60
80
100
120
140
160
180
MAT~12/2008(19 Products)
MAT~12/2009(26 Products)
MAT~12/2010(33 Products)
MAT~12/2011(43 Products)
MAT~12/2012(44 Products)
Millions
Millions
Amlodipine
ORIGINATOR (CU) BRANDED-GENERIC (CU) UNBRANDED (CU)
ORIGINATOR (PHP) BRANDED-GENERIC (PHP) UNBRANDED (PHP)
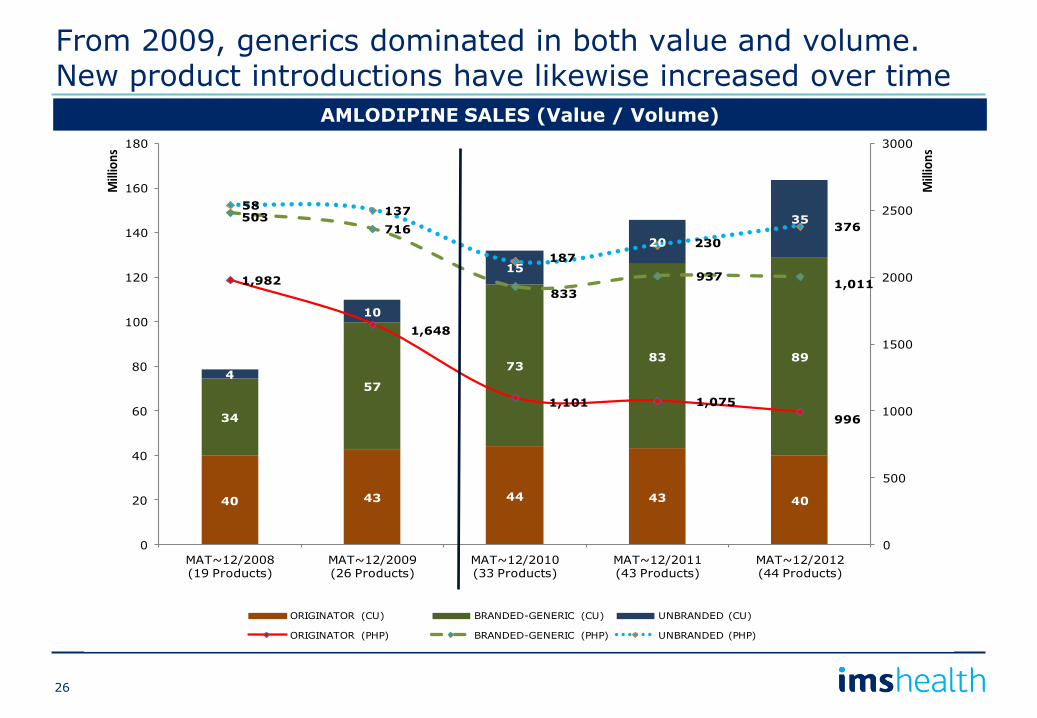
From 2009, generics dominated in both value and volume. New product introductions have likewise increased over time
AMLODIPINE SALES (Value / Volume)
26
0
200
400
600
800
1,000
1,200
1,400
1,600
1,800
MAT ~
12/2001
MAT ~
12/2002
MAT ~
12/2003
MAT ~
12/2004
MAT ~
12/2005
MAT ~
12/2006
MAT ~
12/2007
MAT ~
12/2008
MAT ~
12/2009
MAT ~
12/2010
MAT ~
12/2011
MAT ~
12/2012
Thousands
Simvastatin PrescriptionOriginator vs Generic Rx vs Others
ORIGINATOR SIMVASTATIN GGG OTHERS
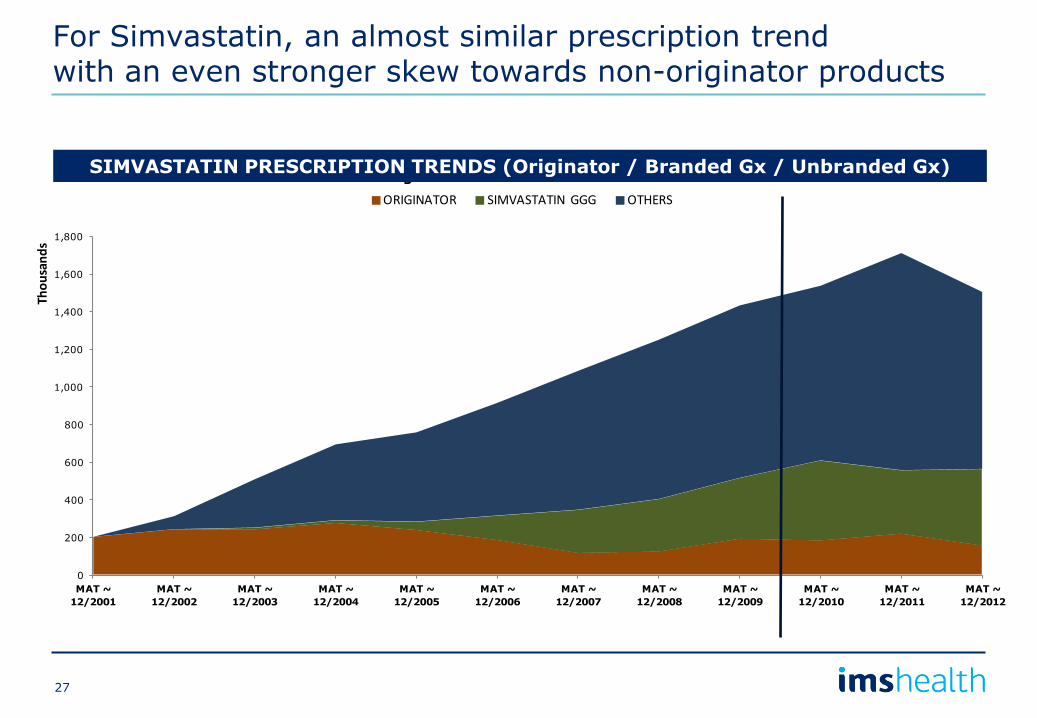
For Simvastatin, an almost similar prescription trend with an even stronger skew towards non-originator products
SIMVASTATIN PRESCRIPTION TRENDS (Originator / Branded Gx / Unbranded Gx)
27

3 4 4 4 3
29
3236
32
28
9
10
13
14 22
83 115 113 111 96
682
695 662
587
539
160
175200
209
321
0
200
400
600
800
1000
1200
0
10
20
30
40
50
60
MAT~12/2008(36 Products)
MAT~12/2009(43 Products)
MAT~12/2010(45 Products)
MAT~12/2011(44 Products)
MAT~12/2012(41 Products)
Millions
Millions
Simvastatin
ORIGINATOR (CU) BRANDED-GENERIC (CU) UNBRANDED (CU)
ORIGINATOR (PHP) BRANDED-GENERIC (PHP) UNBRANDED (PHP)
Value and volume figures show dominance of generics. Unbranded generic Simvastatin growing stronger in past 5 years
SIMVASTATIN SALES (Value / Volume)
28
0
10
20
30
40
50
60
70
80
90
MAT ~
12/2001
MAT ~
12/2002
MAT ~
12/2003
MAT ~
12/2004
MAT ~
12/2005
MAT ~
12/2006
MAT ~
12/2007
MAT ~
12/2008
MAT ~
12/2009
MAT ~
12/2010
MAT ~
12/2011
MAT ~
12/2012
Thousands
Tamoxifen PrescriptionOriginator vs Generic Rx vs Others
ORIGINATOR TAMOXIFEN GGG OTHERS
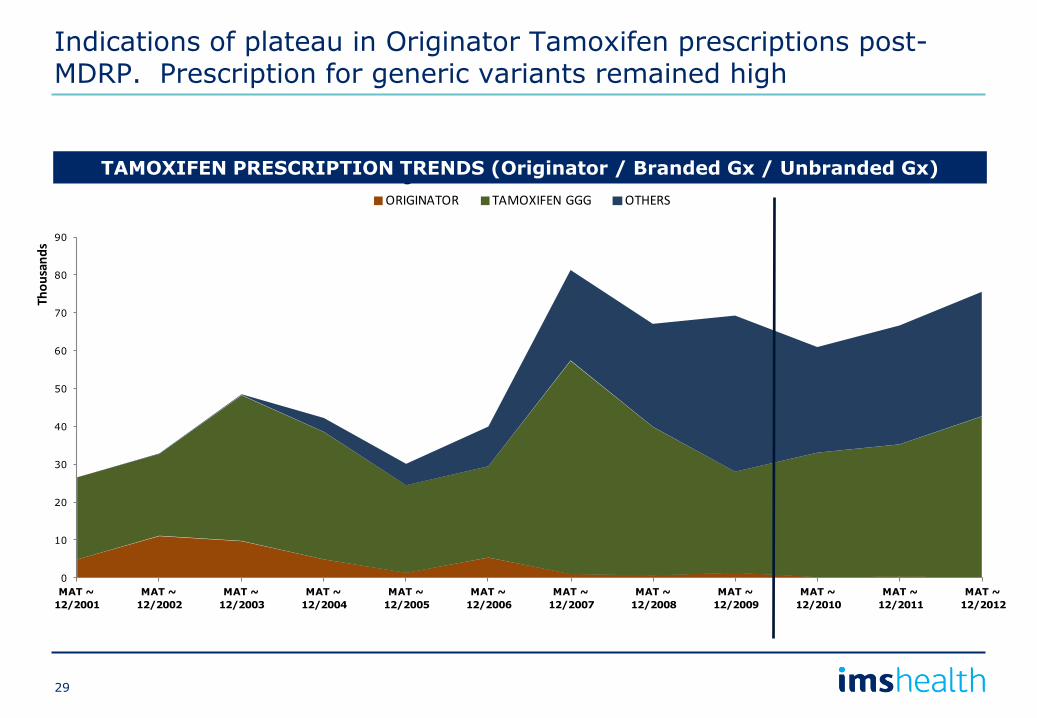
Indications of plateau in Originator Tamoxifen prescriptions post-MDRP. Prescription for generic variants remained high
TAMOXIFEN PRESCRIPTION TRENDS (Originator / Branded Gx / Unbranded Gx)
29
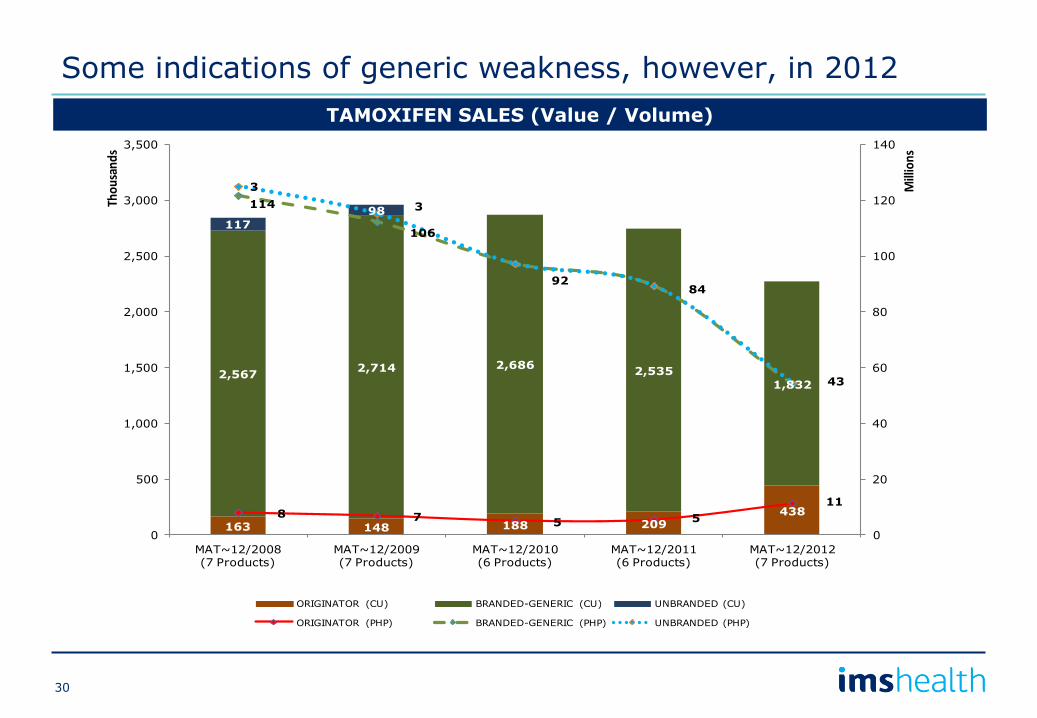
163 148 188 209438
2,5672,714 2,686
2,535
1,832
117
98
8 75 5
11
114
106
9284
43
3
3
0
20
40
60
80
100
120
140
0
500
1,000
1,500
2,000
2,500
3,000
3,500
MAT~12/2008(7 Products)
MAT~12/2009(7 Products)
MAT~12/2010(6 Products)
MAT~12/2011(6 Products)
MAT~12/2012(7 Products)
Millions
Thou
sand
sTamoxifen
ORIGINATOR (CU) BRANDED-GENERIC (CU) UNBRANDED (CU)
ORIGINATOR (PHP) BRANDED-GENERIC (PHP) UNBRANDED (PHP)
Some indications of generic weakness, however, in 2012
TAMOXIFEN SALES (Value / Volume)
30
Agenda
• The Philippine pharma market (size & growth)
• Market share trends
• Ethical vs. OTC
• Retail vs. hospital sectors
• Innovators vs. branded generics vs. unbranded generics
• Philippines
• Comparator Asian countries
• Post-MDRP/GMAP scenario (snapshots for select molecules)
• Summary: Prospects for the Philippine pharma market
PHILIPPINE
PHARMA/
HEALTHCARE
INDUSTRY
Players
Product
Channel
Therapy
class
Market
Promotion
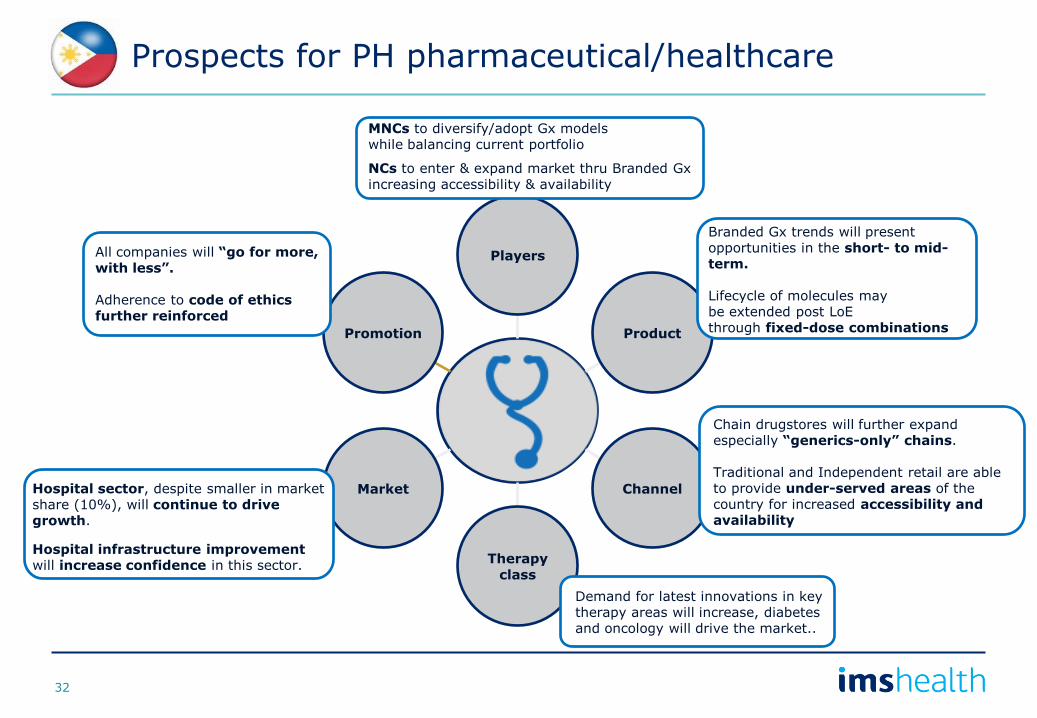
Prospects for PH pharmaceutical/healthcare
MNCs to diversify/adopt Gx models while balancing current portfolio
NCs to enter & expand market thru Branded Gx increasing accessibility & availability
Chain drugstores will further expand especially “generics-only” chains. Traditional and Independent retail are able to provide under-served areas of the country for increased accessibility and availability
All companies will “go for more, with less”. Adherence to code of ethics further reinforced
Hospital sector, despite smaller in market share (10%), will continue to drive growth.
Hospital infrastructure improvement will increase confidence in this sector.
Branded Gx trends will present opportunities in the short- to mid-term. Lifecycle of molecules may be extended post LoE through fixed-dose combinations
Demand for latest innovations in key therapy areas will increase, diabetes and oncology will drive the market..
32
Deejay Cromwell V. Sanqui Product Manager – Philippines & Indonesia
+632 5885407 / +917 5535970
IMS Health
Thank you very much.


![Secondary Pharmaceutical Patents: A Global Perspective · Secondary Pharmaceutical Patents: A Global Perspective Kenneth C. Shadlen (LSE) [Bhaven N. Sampat (Columbia)] WHO-WIPO-WTO](https://static.fdocuments.net/doc/165x107/5ea3393d0f1a3a0d1948b29f/secondary-pharmaceutical-patents-a-global-perspective-secondary-pharmaceutical.jpg)