Vienna International Airport Presentation to Investors · Airport Segment zFocus on Eastern Europe,...
26
22. August 2006 Herbert Kaufmann CEO and Speaker of the Board Flughafen Wien AG Vienna International Airport Presentation to Investors International Investors Conference Kitzbühel, January 20 - 22, 2007
Transcript of Vienna International Airport Presentation to Investors · Airport Segment zFocus on Eastern Europe,...

22. August 2006
Herbert KaufmannCEO and Speaker of the BoardFlughafen Wien AG
Vienna International AirportPresentation to Investors
International Investors ConferenceKitzbühel, January 20 - 22, 2007

Facts & Activities18.8 m passengers in 2007
Share of transfer traffic in 2007: 31.9%
Vienna Airport plc
●Privatised in 1992
●Ownership structure since 2001:
Excellent location as gateway to East European countries
Full-service airport provider(incl. ground handling)
Working environment:
● Approx. 4,050 employees in the Flughafen Wien Group
High dividend yield
20% City of Vienna
20% Province of Lower Austria60% free float, thereof 10% employee trust

Traffic highlights
Passenger traffic 2007 + 11.3% above European average (+ 5.6%*)
Strong development in traffic to Middle East + 18.5%
Flights to Eastern Europe +24.8%
Low-cost carriers + 57.2%
20 mill. passengers expected in 2008 (instead of original forecast for 2010)
* Source: ACI (January - November 2007)

Results for 1-9/2007
Revenue 1-9/2007: EUR 377.9 million + 8.9%
EBITDA 1-9/2007: EUR 152.1 million + 13.0%
EBIT 1-9/2007: EUR 101.6 million + 15.8%
Net profit 1-9/2007: EUR 74.5 million + 13.0%after minority interest
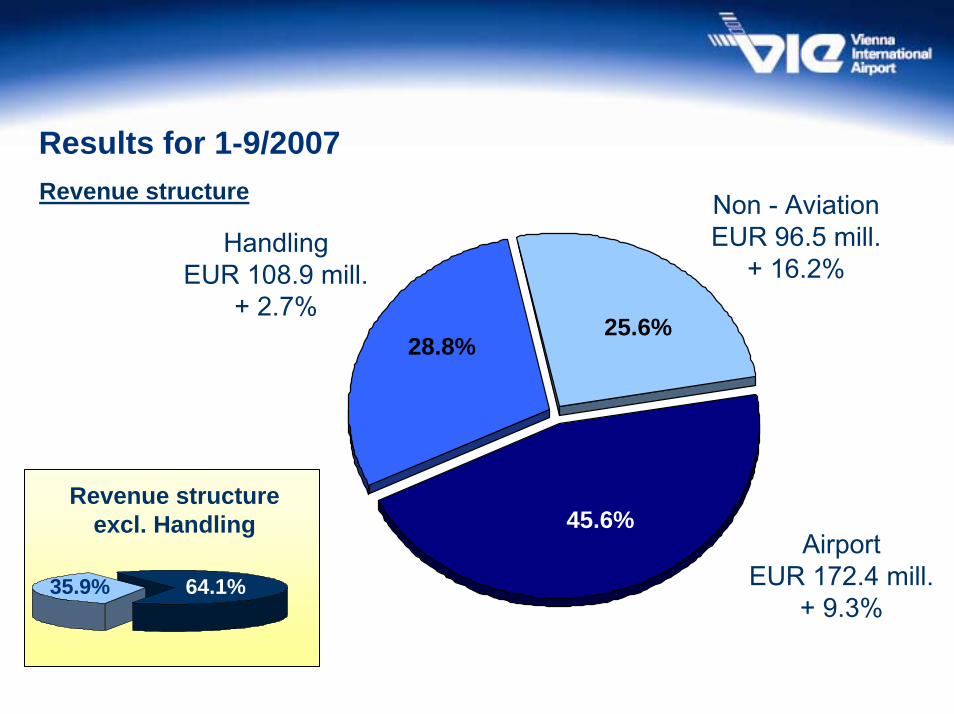
Results for 1-9/2007Revenue structure
AirportEUR 172.4 mill.
+ 9.3%
Non - AviationEUR 96.5 mill.
+ 16.2%Handling
EUR 108.9 mill.+ 2.7%
45.6%
28.8%25.6%
64.1%35.9%
Revenue structureexcl. Handling

Strategy
Airport Segment Goal: growth of 1% above European average
• Focus on Eastern Europe, transfer hub and low-cost carriers• Tariffs and incentives• Capacity measures
Handling Segment Goal: safeguard market share and quality standards
Non-Aviation Segment Goal: significant increase in shops and gastronomyReal estate developmentIncrease in parking revenueSecurity services

StrategyAirport Segment
Focus on Eastern Europe, transfer hub and low-cost carriers
Key gateway to Eastern Europe
(+24.8% in passengers during 2007)
High share of transfers (31.9%)
Low-cost carriers: 18.7% share of passenger volume
Marketing activitiesIncreased international marketing activities, above all forairlines in Eastern Europe and Middle East New airlines in 2007: Delta Air Lines, Air Europe, Sky Europe, KD Avia, Air Transat, Saudi Arabian Airlines, Clickair, Estonian Air, Air One, Easy Jet

*Flights to all regions - all airlines - excl. security
Note: VIE growth and transfer incentives were deducted from the landing tariff because these measures benefit the airlines.
Tariffs in Comparison*
Legend: Landing tariff Infrastructure tariff Parking tariff Passenger tariff
Continuation of incentive programme
Durc
hsch
nitt
1
30292827262524232221201918171615-141312111098765432
63%
143%137%133%120%120%117%113%112%107%106%106%105%105%104%103%102%100%99%98%97%95%95%85%83%83%78%77%74%71%70%
250 € 0 € 250 € 500 € 750 € 1,000 € 1,250 € 1,500 € 1,750 € 2,000 € 2,250 € 2
LHRCDGATHFRA
HAMINNHAJLNZ
KSCBTSCGNGRZDUSAMSMUCSZG
AverageSTRTXL
WAWBUDVIE
MXPPRGMLABRUKLUZRHGVACPHMAD
€ pro Turnaround

Development of Tariffs 2007/2008Changes as of 1.1.2007
1.38% decrease in the landing charge for pax-flightsNo change in the passenger service charge and landside infrastructure charge2.02% decrease in the infrastructure charge for fuelling
Changes as of 1.1.2008
0.09% decrease in the landing charge, parking fee and airside infrastructure charge 1.04% decrease in the passenger service charge and landside infrastructure charge 1.06% increase in the infrastructure charge for fuelling

StrategyHandling Segment
Hold key customers over the mid-term
Korean up to 12/2010Delta Air Lines up to 5/2010Sky Europe up to 12/2009 Austrian up to 12/2009 Eva Air up to 2/2009China Airlines up to 12/2009Qatar up to 12/2009
Market share for first nine months 2007: 88.9%
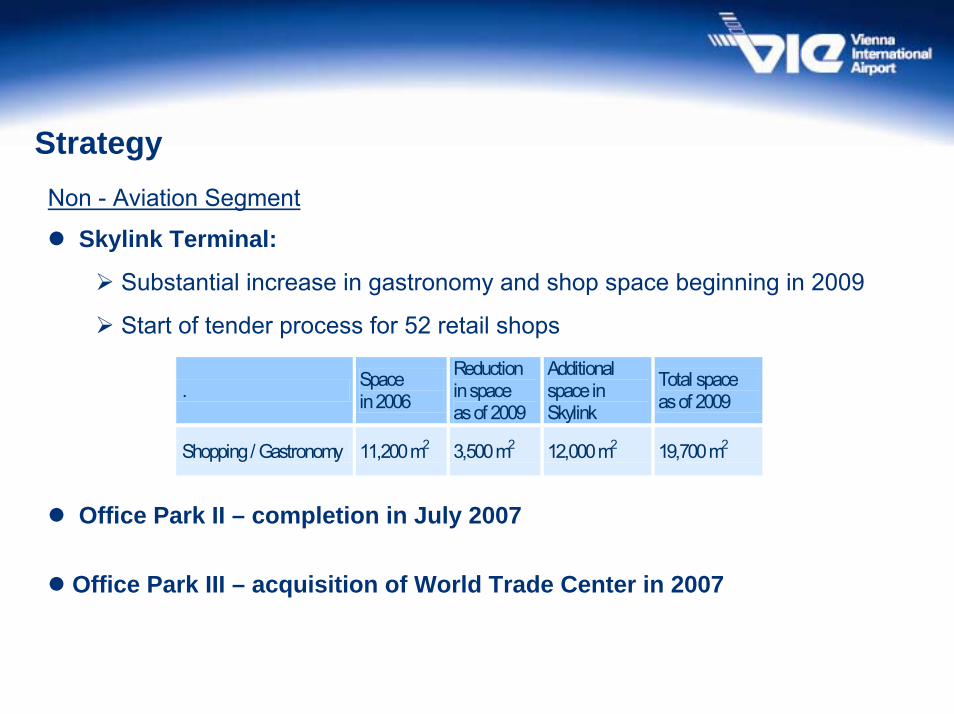
StrategyNon - Aviation Segment
Skylink Terminal:
Substantial increase in gastronomy and shop space beginning in 2009
Start of tender process for 52 retail shops
Office Park II – completion in July 2007
Office Park III – acquisition of World Trade Center in 2007
. Space in 2006
Reduction in space as of 2009
Additional space in Skylink
Total space as of 2009
Shopping / Gastronomy 11,200 m2 3,500 m2 12,000 m2 19,700 m2

StrategyNon - Aviation Segment
Parking: Current status: 15,400 parking spaces – thereof 8,000 in car parks
Plus 5,000 spaces in Mazur parking lot (off airport)
Expansion: 2,200 parking spaces in car park 4 (beginning in mid-2008)
Vienna International Airport Security Services GesmbHIncreased security controls support growth in revenue
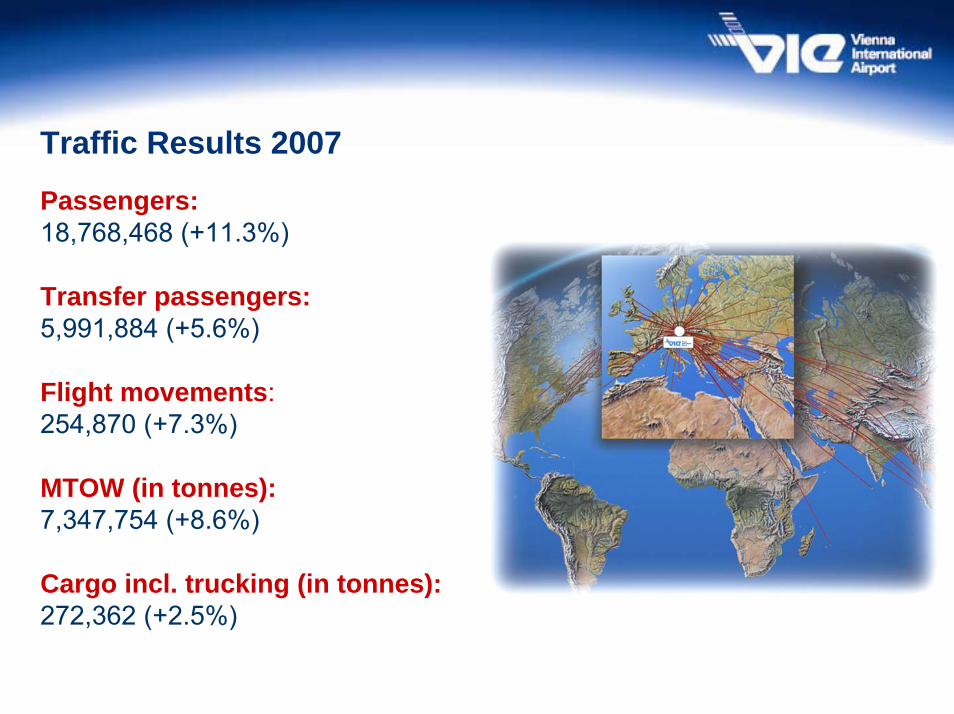
Traffic Results 2007
Passengers:18,768,468 (+11.3%)
Transfer passengers:5,991,884 (+5.6%)
Flight movements:254,870 (+7.3%)
MTOW (in tonnes):7,347,754 (+8.6%)
Cargo incl. trucking (in tonnes):272,362 (+2.5%)

Source: A
CI A
irports Council International –
Europe11/2007
Number of passengers at selected airports in Europe
7.3
4.9
6.35.3
11.3
5.6*
0
2
4
6
8
10
12
2005 2006 2007
Vienna International Airport European average (selected airports)

67.9%
+ 13.8%Western Europe
17.9%
+ 24.8%Eastern Europe85.8%
+ 16.0%Europe total
5.6%
- 17.3%Far East
4.3%
+ 18.5%Middle East2.9%
+ 15.2%North America
1.4%
+ 11.0%Others
Share of total passengers
Change vs. 2006
Traffic Results 2007Scheduled Traffic
“Passengers”

Traffic Results 2007Airlines – share of passengers
% 2007 2006
Austrian Airlines Group 52.6 57.0 Air Berlin 6.7 6.3 Niki 5.5 4.5 Lufthansa 5.3 5.6 Skyeurope Airlines 3.4 0.0 Germanwings 2.5 2.1 British Airways 1.8 2.1 Swiss Intl. 1.7 1.8 Air France 1.6 1.8 KLM 1.2 1.4 Others 17.7 17.4
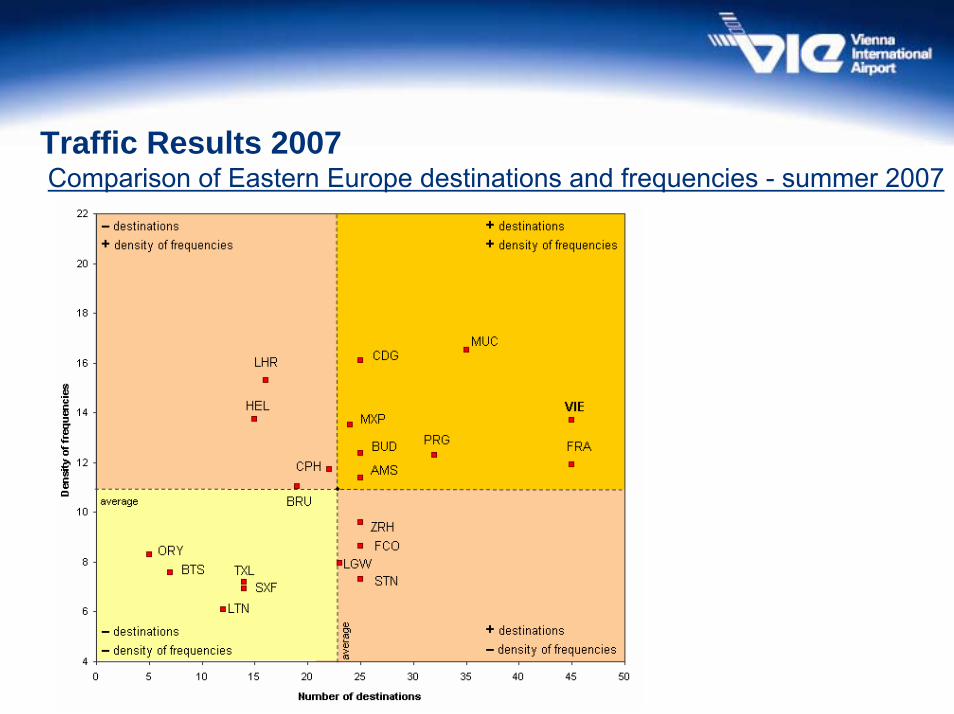
Traffic Results 2007Comparison of Eastern Europe destinations and frequencies - summer 2007
Traffic Results 2007
New airlines
Scheduled airlines 2007: 68 (2006: 64)
New destinations
Scheduled destinations 2007: 192 (2006: 178)

Traffic Results 2007Comparison - Punctuality at European Hubs
Departures delayed more than 15 minutes
Delayed aircraft (more than 15 min) in %
Vienna International Airport 18.3 Amsterdam 21.4 Zurich 21.4 Frankfurt 22.1 Munich 22.6 Milan Malpensa 23.3 Copenhagen 24.1 Rome 26.8 Paris CDG 29.3 London Heathrow 38.9
Source: AEA 3rd quarter 2007

Forecast 2008
Passengers + 8.0%
MTOW + 6.0%
Flight movements + 6.0%
29.528.0
26.625.3
24.022.8
21.520.3
18.816.9
15.914.812.8
12.011.911.9
10
15
20
25
30
35
2000
2001
2002
2003
2004
2005
2006
2007
2008
2009
2010
2011
2012
2013
2014
2015
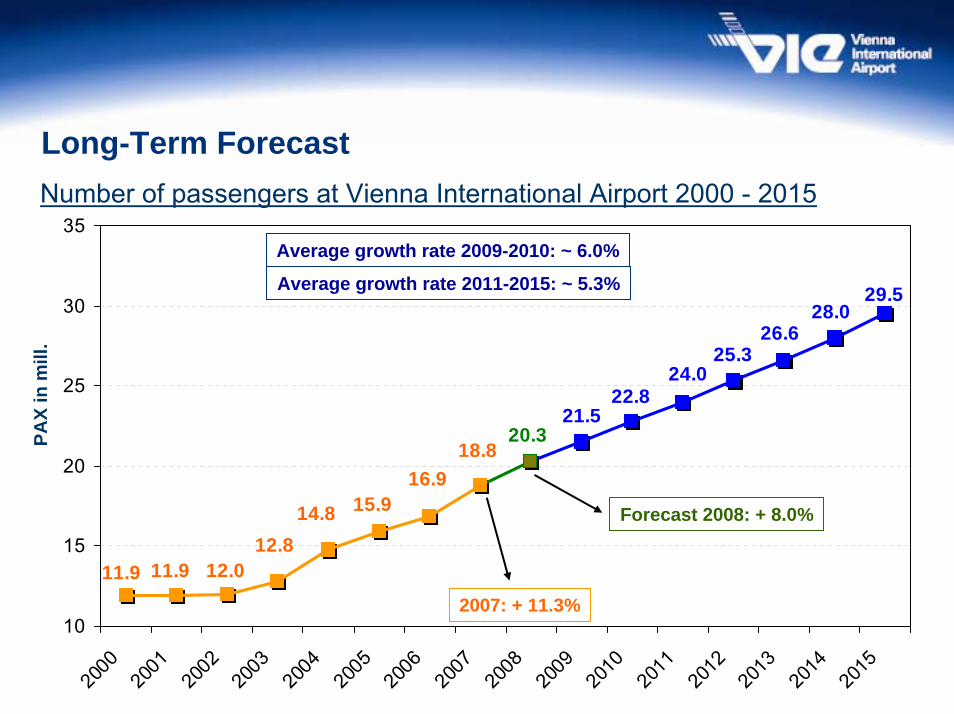
Average growth rate 2009-2010: ~ 6.0%
2007: + 11.3%
Forecast 2008: + 8.0%
PAX
in m
ill.
Average growth rate 2011-2015: ~ 5.3%
Long-Term ForecastNumber of passengers at Vienna International Airport 2000 - 2015
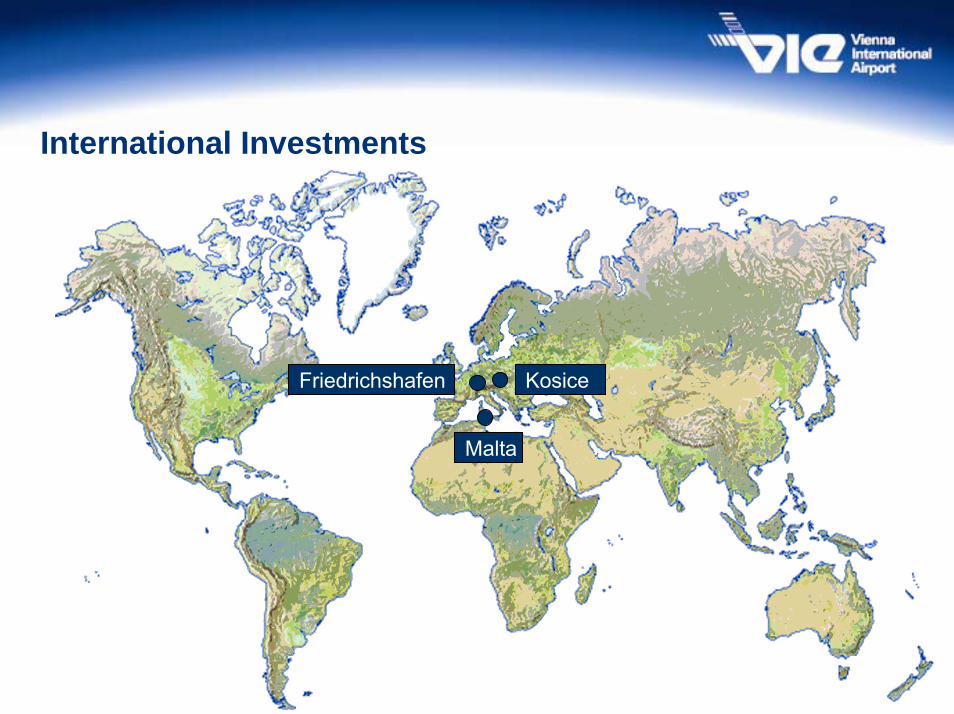
International Investments
Malta
Friedrichshafen Kosice

International InvestmentsKosice AirportSecond largest airport in Slovakia66% stake held by TwoOne Consortiumsince 25 October 2006
Location near borders of: Poland – Ukraine – Hungary - Slovakia
443,448 passengers 2007 (+ 29,0%)
343,818 passengers in 2006
Investment programme: ~EUR 11 mill.

International Investments and ProjectsMalta Airport
Passengers 20072,974,582 (+9.8%)
Passengers 20062,709,280
Owners– Government of Malta: 20.0%
– Private investors: 29.9%
– VIE through 100% subsidiary 10.1%
– MMLC (thereof VIE: 57%) 40.0%

International Investments and ProjectsFriedrichshafen Airport
Flughafen Wien AG is the largest single shareholder with stake of 25.15%
Located near borders of: Germany – Austria – Switzerland
655,689 passengers in 2007 (- 0.3%)
657,749 passengers in 2006
Acquisition price: EUR 7.7 mill.

22. August 2006
Herbert KaufmannCEO and Speaker of the BoardFlughafen Wien AG
Vienna International AirportPresentation to Investors
International Investors ConferenceKitzbühel, January 20 - 22, 2007


![HILTON HEIGHTS · Domestic Airport International Airport W estern Expr ess Hwy CHEMBUR MUMBAI Mumbai - Pune Express Highway Santacruz - Chembur Link Road Eastern Freeway [Mumbai]](https://static.fdocuments.net/doc/165x107/600346df8114aa09654159a7/hilton-domestic-airport-international-airport-w-estern-expr-ess-hwy-chembur-mumbai.jpg)