VI. Insurance Marketplace and Competition
35
VI-1 VI. INSURANCE MARKETS AND COMPETITION The California workers’ compensation marketplace has seen a dramatic improvement in competitiveness and pricing in the last 18 months with some major, national carriers moving aggressively back into the California market. However, there remains reluctance on the part of some of the larger insurance carriers to re-enter the market. The uncertainty regarding the ultimate disposition of major components of the reforms, the long-term liability of future claims and the potential for the market to overheat (as the liquidations of workers’ compensation insurers of the recent past suggest) are main inhibitors for the commitment of capital to the California workers’ compensation market. Through our research, we have also found inconclusive information on the sufficiency of reserves for many companies, which could explain why some large insurance companies are hesitant. The uncertainty of reserve levels is based upon the long-tailed cost of claims liability and the difficulty to predict medical inflation rates which directly affect liability. Methodology and Sources of Information We sought information from a number of information sources for our competitive analysis: (1) historical data from the California Department of Insurance, the Workers’ Compensation Insurance Rating Bureau of California (WCIRB), and the California Commission on Health and Safety and Workers’ Compensation (CHSWC), (2) interviews conducted with analysts from the main rating agencies and insurance brokers from key brokerage firms, (3) industry reports (i.e. Hoovers, Standard & Poor’s, AM Best) and individual company financials, and (4) a survey of mid-sized brokers sponsored by IBA West, a leading California trade association representing California independent insurance agents and brokers and a survey of employers sponsored by the California Chamber of Commerce, a trade association of California employers. And to address the question of increased competition, we considered a number of dimensions: 1. Current number of competitors 2. Previous number of competitors (during previous tougher insurance periods) 3. Relative pricing 4. Relative cost of providing coverage and paying for claims 5. Quality of competitors (currently versus prior periods): a. Rating agency assessments b. Health of the players (new versus established players) c. Market share shifts among players d. Carrier stock price, price-earnings (P/E) ratio, return on equity (ROE) (historic, current and recent past) e. Industry stock indicators (S&P, Dow Jones, NASDAQ), price-earnings (P/E) ratio industry average and return on equity (ROE) vs. the industry average f. The quality of California competitors versus that of other states (Oregon Study) 6. Reserve level versus liability experience
Transcript of VI. Insurance Marketplace and Competition

VI-1
VI. INSURANCE MARKETS AND COMPETITION
The California workers’ compensation marketplace has seen a dramatic improvement in competitiveness and pricing in the last 18 months with some major, national carriers moving aggressively back into the California market. However, there remains reluctance on the part of some of the larger insurance carriers to re-enter the market. The uncertainty regarding the ultimate disposition of major components of the reforms, the long-term liability of future claims and the potential for the market to overheat (as the liquidations of workers’ compensation insurers of the recent past suggest) are main inhibitors for the commitment of capital to the California workers’ compensation market. Through our research, we have also found inconclusive information on the sufficiency of reserves for many companies, which could explain why some large insurance companies are hesitant. The uncertainty of reserve levels is based upon the long-tailed cost of claims liability and the difficulty to predict medical inflation rates which directly affect liability.
Methodology and Sources of Information
We sought information from a number of information sources for our competitive analysis: (1) historical data from the California Department of Insurance, the Workers’ Compensation Insurance Rating Bureau of California (WCIRB), and the California Commission on Health and Safety and Workers’ Compensation (CHSWC), (2) interviews conducted with analysts from the main rating agencies and insurance brokers from key brokerage firms, (3) industry reports (i.e. Hoovers, Standard & Poor’s, AM Best) and individual company financials, and (4) a survey of mid-sized brokers sponsored by IBA West, a leading California trade association representing California independent insurance agents and brokers and a survey of employers sponsored by the California Chamber of Commerce, a trade association of California employers. And to address the question of increased competition, we considered a number of dimensions:
1. Current number of competitors 2. Previous number of competitors (during previous tougher insurance periods) 3. Relative pricing 4. Relative cost of providing coverage and paying for claims 5. Quality of competitors (currently versus prior periods):
a. Rating agency assessments b. Health of the players (new versus established players) c. Market share shifts among players d. Carrier stock price, price-earnings (P/E) ratio, return on equity (ROE)
(historic, current and recent past) e. Industry stock indicators (S&P, Dow Jones, NASDAQ), price-earnings (P/E)
ratio industry average and return on equity (ROE) vs. the industry average f. The quality of California competitors versus that of other states (Oregon
Study) 6. Reserve level versus liability experience

VI-2
The State of the Market: Competition, Concentration and Market Share
Identifying changes in the California workers’ compensation insurance marketplace and assessing the health of the carriers in that marketplace are important parameters within which to evaluate the state of market competition. This is especially true given the insurance industry’s inherent cyclicality. For example, from 1999 and 2004 California experienced what is known as a hard market with suboptimal competition and few firms willing to underwrite policies. A partial explanation for the hard market which occurred from 2000 to 2003 was the very adverse financial results experienced by workers’ compensation insurers. Exhibit VI.1. below shows the combined industry loss ratios from 1993 through 2004. Accident years 1995 through 2002 reflect loss and operating costs well above levels ever seen in California.
The relativity of workers’ compensation as a line of coverage to other lines of coverage available for insurance companies to direct capital was extremely negative throughout this period. Exhibit VI.2. below illustrates the comparison of incurred loss ratios between workers’ compensation and all other lines of commercial insurance coverage. The line graph shows that workers’ compensation was a very high risk line of coverage for any insurer to venture into until 2003, after which there were significant rate increases and the first legislative reforms (AB 749) were enacted. Of the insurers active in the California workers’ compensation market during this period, many became insolvent and transferred billions of dollars of remaining unfunded claims liabilities to CIGA for future insured policyholders to pay (28 insolvencies occurred during this
Exhibit VI.1. Accident Year Combined Loss and Expense Ratios
57 62
90103
113130
139124
107
85
54
36
1313
17
20
22
2623
23
19
15
12
9
1518
20
20
21
2222
20
18
16
15
14
-
20
40
60
80
100
120
140
160
180
200
1993 1994 1995 1996 1997 1998 1999 2000 2001 2002 2003 2004
Losses LAE Other Expense
%As of 9/30/2005
Accident Year
(After Reflecting the Estimated Impact of AB 227, SB 228, & SB 899 on Unpaid Losses)
85
178
156
143
127
93
116
144
167
184
59
81
Source: WCIRB

VI-3
period, as cited in Section I of this report, an unprecedented number since the beginning of workers’ compensation in California).
65%
53%
61%
81%
85%
104%
108%
98% 97%
78%
64%
68%
87%
66%
60%58%
63%
89%
63%
69%72% 72%
53%
62%
40%
50%
60%
70%
80%
90%
100%
110%
1993 1994 1995 1996 1997 1998 1999 2000 2001 2002 2003 2004
Workers Compensation All Lines
Exhibit VI.2. Workers' Compensation Incurred Loss Ratios Compared to All Major Lines of Coverage
Workers' Compensation
All Lines
Source: California Department of Insurance
A more detailed comparison of workers’ compensation to other major lines of insurance coverages in California is shown in Exhibit VI.3. below. Such lines of insurance as homeowners and automobile insurance historically have much lower loss ratios. These lines of coverage also have much greater predictability of ultimate cost, unlike workers’ compensation which has had a high degree of actuarial uncertainty and has claims which extend out for many more years (some for over 20 years).

VI-4
Workers Compensation
30%
40%
50%
60%
70%
80%
90%
100%
110%
1993 1994 1995 1996 1997 1998 1999 2000 2001 2002 2003 2004
Homeowners Multi Peril Workers Compensation Private Pass. Auto Liability Privat Pass. Auto Phys. Dam.
Exhibit VI.3. Workers' Compensation Incurred Loss Ratios Compared to All Major Lines of Coverage
Source: California Department of Insurance
Current and Previous Number of Competitors
Starting in 2004 and continuing through 2005, the California began to witness increased competition with new carriers entering the market, decreased insolvencies and liquidations, few carriers exiting the market, and the reemergence of carriers who had previously competed in the state. A summary of the market composition from 1998 through 2004 is illustrated in the exhibit below. It shows that the number of overall carriers has stayed relatively stable. However, there has been are marked reduction in the number of carriers exiting the market.
Exhibit VI.4. Measures of California Workers’ Compensation Market Concentration 1998 1999 2000 2001 2002 2003 2004 Number of Total Carriers 99 95 96 91 90 87 89 Number of Carriers with 90% cumulative market share 21 22 24 23 18 18 16
Number of New Entrants Unknown 15 11 8 13 9 10
Number of Firms Exiting 19 10 13 13 10 8 Not available
Number of Firms Re-emerging -- -- 2 1 2 1 Not available
Number of Liquidations Unknown Unknown 7 8 5 7 2
Source: Analysis from California Department of Insurance data

VI-5
The group of exhibits below shows the composition of insurers comprising the insurers in the top ten (as ranked by size of written premium, net of deductible credit adjustments) for the period 2000 through 2004. In 2004, the top ten insurers comprised 80.2 percent of the market, whereas in 2000 they accounted for only 70.7 percent. Data are not yet available for written premiums for 2005, so we are unable to project what the respective market shares are at this time.

VI-6
In addition to the above competitive trends, we have also reviewed SCIF’s changing market share. Exhibit VI.5. shows that SCIF peaked in 2003 and has continued to decline since.1 In 2003 SCIF held over 58% of the workers’ compensation insurance market (based on written premium, net of deductible), leaving over 80 firms competing for the other 42%.
The following exhibit indicates that the remaining top nine insurers have increased market share from a low of 33.2 percent in 2001 to 42 percent in 2004. We project that the increase in the market of the nine private insurers in the top ten will approach 50 percent in 2005.
Exhibit VI.7. Market Share of Top Private Insurers Compared to SCIF
2000 2001 2002 2003 2004 SCIF 2,325,248,442 47.2% 4,950,905,632 66.8% 6,034,188,842 66.3% 9,560,135,298 70.0% 6,872,674,092 58.0% Remaining Nine Top Insurers
2,596,234,541 52.8% 2,455,827,974 33.2% 3,068,019,156 33.7% 4,099,630,214 30.0% 4,971,374,986 42.0%
Total Top Ten: 4,921,482,983 100% 7,406,733,606 100% 9,102,207,998 100% 13,659,765,512 100% 11,844,049,078 100%
Source: California Department of Insurance
The decrease in SCIF’s market share is evidence of the increase in workers’ compensation insurance competition and the benefit that may have for California employers (either in terms of lower cost or improved service). The SCIF reduction in market share is also explained by the fact that private insurers are offering greater reductions from approved pure premium rate levels than SCIF. (Refer to Section IV). Over time, the remaining market share that SCIF retains could have adverse selection attributes which could complicate the competitive environment dynamics and increase its volatility. For example, if SCIF aggressively tries to retain market share, the overall market pricing will need to follow or the private insurers will lose their recent market share gains. While this may be create a healthy competitive environment in the short run, it could lead to the cut-throat competition which in the mid-1990’s led to inadequately priced coverage and subsequent insolvencies.
Source: Analysis from California Department of Insurance data, written premium, net of deductible
Exhibit VI.6. SCIF Market Share, 1998 - 2004
41%33%
51% 53% 51%53%50%43%
28%
58%
47%
36%
22%22%
0%
10%
20%
30%
40%
50%
60%
70%
1998 1999 2000 2001 2002 2003 2004 2005
Year
Mar
ket S
hare
Unadjusted Adjusted

VI-7
The market share leaders by insurer group during this period are shown in the exhibit below. There have been only five insurers consistently in the top ten rankings. Several other insurers in the top ten in various years may have elected to relinquish market share during the unprofitable period. Two insurers in the top ten ranking became insolvent.
Exhibit VI.8. Market Share Rankings by Insurance Groups In the Top Ten During 2000-2005
2000 2001 2002 2003 2004
TOP TEN - FIVE OR MORE YEARS
State Compensation Ins Fund 1 1 1 1 1 Zurich Insurance Grp 4 2 5 4 3 American Intl Grp 6 5 2 2 2 Liberty Mutual Grp 3 4 7 7 9 American Financial Grp 8 8 9 8 7 TOP TEN - FOUR YEARS Everest Rein Hol 23 6 3 3 6 Zenith Nat Ins Grp 12 9 6 5 4 TOP TEN - THREE YEARS Hannover Grp 14 12 8 6 10 Lumbermens Mut Cas Grp 7 3 4 18 59 TOP TEN - TWO YEARS Saint Paul Travelers Grp 20 18 14 9 5 Legion Ins Grp 5 7 127 131 135 TOP TEN - ONE YEAR Aon Corp 34 35 21 14 8 Allianz Ins Grp 9 19 23 25 23 Travelers Property Cas Corp Group 11 10 ACE Ltd 33 15 10 17 14 Royal & Sun Alliance USA 13 10 12 19 45 Sierra Health Svcs Grp 10 14 18 120 124 Insolvent Fremont General Grp 2 Insolvent
Another measure of market competitiveness we examined is market concentration (the issue of quality of players notwithstanding). This is measured by cumulative market share as a function of the number of firms, excluding SCIF. Exhibit VI.8. California’s 2004 Cumulative Market Share illustrates this metric. It shows a high degree of market concentration among insurers.

VI-8
This concentration differs from many other states who have many more insurers competing for the workers’ compensation insurance market than California does, as Exhibit VI.8. below illustrates. This suggests there is additional room for new entrants into California’s market.
Exhibit VI.10. Other State’s Competition, Number of Firms Writing Workers’ Compensation
California Over 85 carriers Maine Over 250 carriers Michigan Over 275 carriers Minnesota Over 200 carriers Oregon Over 185 carriers Texas Over 200 carriers
Source: Analysis from CDI, Maine Bureau of Insurance, Department of Professional Financial Regulations, Michigan Office of Financial and Insurance Services, Minnesota Department of Labor and Industry & Department of Commerce Insurance, Oregon Department of Consumer Business Services, Workers' Compensation Division, Texas Department of Insurance, Division of Workers' Compensation.
California Workers' Compensation Insurance Markets: New Insurers, Insurers Reentering the Market, and Insurers Who Are Growing Substantially According to CDI, in 2004 there were 15 new insurer groups requesting approval to insure workers’ compensation risks in California. In 2005, there were eight such requests, and two approvals—Western United Insurance Company and SUA Insurance Company. In 2004 the new insurers were Guard Insurance Group, Comp West Insurance Co., Employers’ Reinsurance Corp., National Liability and Fire Co., California Insurance Company, TNUS Insurance Company, and Berkley Regional Insurance Company. The number of applications, according to CDI, during the last two years was higher than what in had been in the past. The recent reform legislation has been cited as a likely cause of the renewed interest.
Exhibit VI.9. California's 2004 Cumulative Market Share, Excluding SCIF
0%
20%
40%
60%
80%
100%
0 5 10 15 20 25 30 Number of Firms
Source: Analysis from California Department of Insurance data

VI-9
Other insurers currently licensed to operate in California may elect to increase their writings. Such market intentions are not disclosed to CDI in advance and only are measured retrospectively by CDI in statutory filings. Insurers market intentions are guarded and generally are only disclosed to their business partners, such as insurance agents and brokers. Information provided to BRS by IBA West, the largest industry association of insurance and brokers and agents in California, indicates the following insurance market activity in 2005.
• ACE USA: The U.S. operations of a major Bermuda-based insurer, ACE Insurance Group, which bought the CIGNA/INA book of business. Initially a market only for large risks in California, ACE USA is now a significant insurer of small and medium sized employers with ACE Complete, a program offered through general agencies.
• American Insurance Group (AIG): The largest private insurer in the California market and is continuing to grow. It specializes in large complex risks.
• Applied Underwriters: Offers integrated insurance and risk management solutions to preferred employers.
• ARCH Insurance Group: This is the U.S. operations for another major Bermuda-based insurer. Arch Capital is expanding in California.
• Argonaut: This large specialty carrier has returned to the California market following passage of the reforms. It had been a significant player in California’s workers' compensation market previously.
• California Insurance Company (CIC): CIC opened for business April 1, 2005 after receiving March 23, 2005 approval from California Department of Insurance. CIC plans to serve the small to medium-sized employer market (premiums of $5,000 to $500,000) in the blue collar and construction arena with insurance and risk management services. CIC is owned by Applied Underwriters, a managing general agency, which purchased CIC from General Electric two years ago.
• Chubb Group of Insurance Companies: Chubb is a major international insurer that writes California workers' comp for businesses when it writes other lines on the account.
• Clarendon National Insurance Company and Redland Insurance Company: Part of the Clarendon Insurance Group owned by Hanover Re Group. This is the largest writer of program business with a large and growing volume of California business written through managing general agencies.
• CNA Insurance Companies: CNA is a major national insurer that writes workers' compensation for businesses where it has the employer’s other lines of coverage.
• CompWest Insurance Company: Started writing end of September 2004 with a small number of brokers. CompWest expects to write $50-75 million in 2005.
• Employers Compensation Insurance Company of California: This insurer is a subsidiary of Employers Insurance Group, formerly the Nevada State Fund now privatized, and is expanding into other states including California. It bought Fremont Compensation's California book of business and is growing it at a significant pace.

VI-10
• Employers Direct Insurance Company: This insurer, a subsidiary of Swiss Re, started writing in 2003 on a direct marketing basis. They expect to write in excess of $150 million in 2005.
• Everest Insurance Company: After writing more than $600 million through the AARIS managing general agency, October 1, 2004 Everest began writing and renewing business directly. Operating directly Everest continues to be a significant factor in the California market.
• Farmers Insurance Group: Farmers is the third largest insurer in the country and has become increasingly competitive in the California workers' compensation market writing very large accounts as well as small and medium. Is owned by Zurich Financial Services Group.
• Fireman's Fund Insurance Company: Like Safeco, Fireman's Fund has decided to stay in the market following passage of the reforms. The company is proceeding slowly but continues to write a small market share.
• Hartford: Following the passage of legislative reforms, Hartford expanded the number of classes of business it would write. This year the company has become more aggressive in attracting business.
• National Liability and Fire Insurance Company: A subsidiary of Berkshire Hathaway Group, replaced Everest Insurance Company as the insurer for the American All Risk Insurance Services (AARIS) general agency in San Francisco. The AARIS / Everest program had written premiums exceeding $600 million when they agreed to separate effective October 1, 2004. The AARIS program has continued with National Liability and Fire as the insurer.
• Preferred Employers: This San Diego-based workers' compensation insurer specializing in smaller employers in California. It is part of W.R. Berkley Corp group of insurance companies. It is growing in its market niche.
• Redwood Fire & Casualty: Redwood is subsidiary of Berkshire Hathaway Group. Redwood has significantly increased its commitment to the California market writing business through Cypress Point Insurance Services, a San Diego-based managing general agency recently acquired by Arrowhead General Insurance Group. Cypress Point plans to increase its premium volume from $120 million to $240 million in 2005.
• Republic Indemnity: Like Zenith, Republic is another California domestic insurer specializing in workers' compensation that stayed the course and is growing following the passage of the reforms.
• Safeco: Safeco is an important insurer in the small and medium-sized employer market. They had planned to exit the California workers' compensation market but decided to stay following 2004 passage of the reforms.
• SeaBright Insurance Company: A publicly traded insurer brought to market by venture capital (Summit Global Partners). It bought the Eagle Insurance Company subsidiary from Kemper Insurance in 2003. The company is headquartered in Seattle, but writes 60% of its business in California. They wrote premiums of $136 million in 2004. The

VI-11
company specializes in maritime exposures subject to the USL&H Act. They have a large component of Alternative Dispute Resolution (ADR) risks, and large construction risks.
• St. Paul/Travelers: St. Paul is a major international insurer that writes the workers' compensation for employers when it has the employers other lines of coverage.
• State Farm: State Farm has become more than aggressive in the workers compensation market, especially in medical office classes including doctor offices, dental offices, physical therapy practices, physical rehab facilities, mental counseling of all kinds and surgery centers.
• Zenith Insurance Company: Zenith is one of the few California domestic insurers specializing in workers' compensation. The company survived the disastrous market of the late 1990s. The Zenith is increasing its business significantly following the passage of the reforms. In 2004 its writings grew by 27%.
• Zurich North America: This is the U.S. operation of the worldwide Zurich Financial Services Group. It writes accounts of all sizes and is committed to growth in the California market.
Relative Pricing and Cost of Providing Coverage
The complexion of participants alone is not enough to ensure that the marketplace is competitive. Capital levels and financial capacity must also increase. And there has been an increase which is coming from two sources: new capital from new participants and new capital from existing players who are attempting to enhance their market share. Although the new capital has had a positive impact on reducing premium pricing, it also has been sufficiently robust to slow commensurate improvements in return on equity (ROE), which has improved but remains below required levels on a risk adjusted basis. This suggests that the return of some larger insurers, who could place further download pressure on the workers’ compensation premium pricing, may be delayed until certain risk factors, such as legal and legislative uncertainty, abate. Another key risk factor is the ultimate long term effectiveness of the reforms on mitigating claim costs. However, understanding this risk metric may not happen until new entrants’ claims experience on their book of business matures. In reviewing the alternatives of the California market and the appropriate level for premiums, comparisons to other states can also be instrumental. In this regard, California exhibits higher costs than any other state with the exception of Florida and Alaska, and now Texas (refer to Section IV). However, California has significantly narrowed the gap with virtually all states. The persistence of California’s relatively costly pricing is driven by claim costs. Although these are decreasing, they remain relatively high. If rates are to drop further, the sustainability of these reductions must continue to attract additional new markets.

VI-12
Quality of Competitors
Rating Agency Assessments and Health of Players
The following exhibit, Analysis of California Workers’ Compensation Carriers’ Financial and Credit Strength, assigns an overall ranking to the top (defined by market share, comprising roughly 90-95% of the market) carriers based on current published credit and financial strength ratings. The carriers with the greatest financial strength are: American International Group, State Farm, Berkshire Hathaway, and Safeco Insurance Company. There are three caveats to this analysis: (1) each rating agency does not publish updated ratings annually or rate every carrier, (2) the rating agency’s methodologies for assigning positive ratings favor carriers with diverse services and mono-line carriers primarily serving the California market, compared to other carriers, have middle of the road financial strength; and (3) SCIF, the dominant mono-line carrier in California is not rated by the credit agencies, although as a State of California entity, SCIF carries the financial credit rating of the state. Also, SCIF is not a private carrier, but rather a state agency corporation.

VI-13
The purpose of the analysis is to identify which carriers have greater financial strength based on current evaluations completed by the major rating agencies. If the strongest private carriers have the greatest presence in the marketplace, then the long term health and stability of the marketplace is enhanced. On the other hand, if weaker private carriers dominate, who have relatively less capital adequacy, then any future bumps in the road (like an unexpected increase in liabilities) could result in their quick exit and a return to a harder market. When we examine this table, it appears that the private carriers with the strongest rating agency view have small market shares currently (except for AIG, which has the second greatest market share). The trend is not definitive, but it is less than ideal. It leads further credence to the benefit of larger well-established carriers increasing their committed capital levels and market share, which as mentioned before may take time to realize. The analysis is also complicated by the difficulty of identifying the California book of business for most of these competitors versus the
Source: Analysis from California Department of Insurance, AM Best, Fitch Financial Strength Ratings, Standard & Poor’s Credit Ratings, and Moody’s Credit Ratings.
Group NameMarket Share
AM Best Financial
AM Best Credit Fitch S&P Moody's
Overall Rating
State Compensation Insurance Fund 53.03% NR NRAmerican International Grp 5.89% A+ aa- AA+ AA AA1 1Zurich 4.28% A NR A+ A2 3Zenith Natl 3.80% A- a- A- BB+ Baa1 5St Paul Grp 3.72% A+ aa- AA- BBB+ Aa3 3Everest Rein Hol 2.68% a- AA- A- Aa3 3American Financial Grp 2.21% bbb A+ BBB Baa3 5Aon Corp 1.83% A- BBB+ A3 4Liberty Mut Grp 1.76% bbb A- BBB Baa3 6Hannover Grp 1.72% A a A- 3Employers Ins Grp 1.43% A- AA- 3Hartford Fire & Cas Grp 1.41% A+ aa- AA AA- 2Chubb & Son Inc 1.32% aa- AA 2Ace 1.15% A+ A+ BBB+ Baa2 4WR Berkeley Corp 1.02% A+ 4Fairfax Financial 0.92% BBB BB Baa1 7State Farm IL 0.91% A+ AA+ AA 1CNA Ins Grp 0.84% A+ a 2Arch Ins Grp 0.72% A- 4Swiss Re 0.67% A+ aa 2Sentry Ins Grp 0.67% A+ 2Majestic Ins Co 0.64% B++ 7Allianz Ins Grp 0.63% A a 3Rhine RE Grp 0.62%Seabright Ins Co 0.60% A- a- 4Berkshire Hathaway 0.51% A++ aa+ 1Argonaut Grp 0.42% NRSafeco Ins Grp 0.34% A a+ 1
Scale:Best (1) financial strength to worst (7) 1 2 3 4 5 6 7
Exhibit VI.11. Analysis of California Workers’ Compensation Carriers’ Financial and Credit Strength

VI-14
workers’ compensation book in other states (with Zenith being the one exception). Further analysis is necessary to determine how much this state distribution affects the adequacy of capital question.
Carrier and Industry Financial Performance Information
To further assess the quality of competitors (beyond the rating agency’s evaluation of debt and adequacy of reserves), we looked at various measures including stock price, return on equity (ROE), return on assets (ROA) and profit margin. We compared each company’s non-debt financial measures (for those companies that are publicly traded) to industry averages. We also looked at a five year and one year change in each company’s stock price and compared that to various indices (NASDAQ, DJIA, S&P). We compared some of the major publicly traded insurers operating in California by measuring the company’s financial performances to industry averages by looking at five year and one year changes in each company’s stock price and compared company stock price to various indices (NASDAQ, DJIA, S&P). Certain major carriers operating in California, including ACE, American Financial Group, W.R. Berkeley, and Zenith, have outperformed both their competitors and industry averages and others are performing right along with the industry averages The strong financial performance of major carriers is encouraging and positive for California’s competitiveness outlook. It suggests that investors are relatively optimistic about the quality and future earnings performance characteristics of several key California workers’ compensation carriers. And since equity values historically are more accurate in reflecting risk factors that are not easily quantifiable (like the impact of medical inflation and hidden claim costs on the adequacy of reserve), this bodes well for the likelihood that such risk factors will ultimately prove not to be an issue. Equity markets are of course sometimes misleading in predicting short term trends, but over the long term they are positively correlated to performance. Another metric which provides meaningful insight into the quality of the California workers’ compensation carriers is a measure which monitors cumulative market share versus weighted average. This statistic is outlined in Exhibit VI.14. Analysis by Carrier and Industry Indicators. It shows that those carriers with the highest ROE are concentrated in the top 15% of carriers, as measured by cumulative market share. This suggests that many carriers have either unknown financial performance or financial performance with room for improvement (keeping in mind there is no pure California equity measure). This outcome is consistent with the rating agency view. But it is inconsistent with the stock market measures. This provides further evidence that the future performance of carriers in the California market is not reflected in performance to date. But the investors believe future financial performance should be superior to current performance. And in that view investors are optimistic that risk factors affecting future financial performance will be favorably resolved.

VI-15
Carrier Name Description Market Cap
(MC) Weighted
MC EPSWeighted
EPS ROE Weighted
ROE
Calculated Market Share
(MS) Cumulative
MSZenith Natl Public $ 1,720 $ 79 4.22 0.52 27.76% 1.27% 4.59% 3.57%American International Grp Public $ 181,820 $ 12,352 2.61 1.09 13.63% 0.93% 6.79% 7.14%St Paul Grp Public $ 33 $ 1 2.52 0.70 10.36% 0.39% 3.73% 10.71%WR Berkeley Corp Public $ 6,480 $ 77 3.73 0.16 22.93% 0.27% 1.19% 14.29%Aon Corp Public $ 11,980 $ 236 1.77 0.42 11.77% 0.23% 1.97% 17.86%American Financial Grp Public $ 30,050 $ 628 2.72 0.30 9.10% 0.19% 2.09% 21.43%Ace Public $ 17,700 $ 214 3.56 0.19 10.86% 0.13% 1.21% 25.00%CNA Ins Grp Public $ 8,530 $ 79 2.75 0.11 8.45% 0.08% 0.92% 28.57%Seabright Ins Co Public $ 267 $ 1 1.09 0.07 14.81% 0.07% 0.50% 32.14%Safeco Ins Grp Public $ 7,140 $ 22 5.31 0.03 17.60% 0.06% 0.31% 35.71%Argonaut Grp Public $ 1,040 $ 4 2.61 0.05 13.24% 0.05% 0.35% 39.29%Berkshire Hathaway Public $ 137,980 $ 543 4376.87 0.08 7.92% 0.03% 0.39% 42.86%Zurich Private $ - - 0.00% 46.43%Everest Rein Hol Private (parent) $ - - 0.00% 50.00%Liberty Mut Grp Private $ - - 0.00% 53.57%Hannover Grp Private $ - - 0.00% 57.14%Employers Ins Grp Private $ - - 0.00% 60.71%Hartford Fire & Cas Grp Private (parent) $ - - 0.00% 64.29%Chubb & Son Inc Private (parent) $ - - 0.00% 67.86%State Farm IL Private $ - - 0.00% 71.43%Arch Ins Grp Private $ - - 0.00% 75.00%Swiss Re Private $ - - 0.00% 78.57%Sentry Ins Grp Private $ - - 0.00% 82.14%Majestic Ins Co Private $ - - 0.00% 85.71%Allianz Ins Grp Private $ - - 0.00% 89.29%Rhine RE Grp Private $ - - 0.00% 92.86%Fairfax Financial Public $ 2,420 $ 23 -9.31 -4.56% -0.04% 0.97% 96.43%
SCIF Not-for profit 100.00%
Industry $ 137,000 $ 56,994 1.76 14.88 14.60% 25.02%
Exhibit VI.12. Analysis Carrier and Industry Indicators
-0.20% 0.00% 0.20% 0.40% 0.60% 0.80% 1.00% 1.20% 1.40%
4% 11% 18% 25% 32% 39% 46% 54% 61% 68% 75% 82% 89% 96% Cumulative Market Share
Wei
ghte
d R
etur
n on
Equ
ity (R
OE)
Exhibit VI.13. Concentration of Competitors

VI-16
Reserve level versus liability experience
Our last factor relates to the adequacy of reserves for all the California insurers on a collective basis. Although elsewhere in our analysis we have shared insights into the reserve levels of some of the major insurers, this analysis does not apply to the majority of insurers who make most of the market share (excluding SCIF). And since most of these insurers write either in multiple states or across multiple lines, it is difficult reach any conclusions without extensive further analysis. The best that we can say today is that the carriers we have looked at seem to have increasing reserves which are fast approaching adequacy, if current pricing and cost trends continue. Likewise, the difficulty is ascertaining what the collective reserve level truly is provides a further risk factor that investors and regulators must keep in mind as the number of competitors continue to grow. Observations: Scorecard of Competition Indicators In sum, the exhibit below illustrates the key indicators examined. We compiled a scorecard and rated each indicator based on the above analysis. Key observations illustrated by the table:
• Competition has increased in the California workers’ compensation market, but less than in other states. Therefore, there is room for further competition and further rate reduction even if some large high-quality insurance companies remain on the sideline until the ROE and reserve levels become stronger.
• If additional well-capitalized insurers compete for the California market share, further rate reductions could occur.
• However, uncertainties remain, specifically regarding the success insurers will continue to experience in controlling the medical cost component of workers’ compensation claims and whether key aspects of the reforms may be overturned by the WCAB courts, the legislature, or by voters through the referendum process.
Exhibit VI.14. Scorecard of Competition Indicators
Indicator California Average of other markets
1. Current number of competitors B ↑ A
2. Previous number of competitors C ↑ N/A
3. Relative pricing B → B
4. Relative cost C ↓ B
5. Quality of competitors B ↑ A
a. Rating agencies C ↑ B
b. Health of players B ↑ B
c. Market share B ↑ A
d. Carrier (stock, P/E, ROE) C ↑ B
e. Industry (average, P/E, ROE) B → B
f. California versus other states C ↑ B
6. Reserve levels B ↑ B
Key: A (strong), B (average), C (needs improvement). ↑ (improving), → (staying the same), ↓ (not improving).
VI-17
Survey Results: Brokers and Employers
Broker Survey
As part of the BRS evaluation of the workers’ compensation reform legislation, a survey was targeted to mid-sized and smaller insurance brokers. The survey was designed and conducted by the FSC Group for this project to look at a cross section of brokers in California to determine pricing and availability of the workers’ compensation insurance market by industry, geography and employer size. The objective of the survey was to determine current levels of market competition and premium savings to policyholders. The web-based survey gathered data regarding broker’s perceptions about: active markets, changes to premiums charged, satisfaction with the quality of services and the market since reforms. The survey also gathered data on: client size, industry, geographical location, average number of employees and premium size. Sample Design
The survey was web-based and of insurance brokers in California, all of whom are members of the Insurance Brokers and Agents of the West (IBA West). IBA West is a regional trade association that represents both insurance agents and brokers. In California, IBA West has 861 members that represent approximately 13,000 professionals. The insurance professionals include principals, producers and customer service staff.2 In order to attain an email list of the appropriate insurance brokers, the project team met with the Clark Payan, Chief Executive Officer and David Benesh, Vice President of Marketing to determine survey distribution to their members.3 During this meeting and in numerous follow-up phone conversations and email correspondences, the IBA West team explained their membership criteria (and that the IBA West executives would be informing their members) that only one individual from each membership should respond to the survey. This is because of membership qualification and criteria restrictions. It also ensures there would be no over-representation in certain areas and companies. Furthermore, the project team conducted a focus group of five California brokers, from throughout the state, to provide feedback and make suggestions to improve the survey questionnaire.4 A link to the survey was sent via email, from IBA West’s domain to IBA West’s member list. Therefore the sample was not drawn randomly and may have self-selection bias.
Survey Instrument The survey consisted of twenty-one (21) questions and took approximately 15-20 minutes to complete. The questions asked were based on project team and IBA West focus group input. The questions were designed to collect data regarding: number of active insurance markets, changes to premiums charged and perceptions and satisfaction in the post workers’ compensation reform era. The survey instrument is included at the end of the report in Appendix H. Data Collection Procedures A link to the survey was sent via email to the member list that IBA West provided. The data was collected online through QuestionPro, on on-line survey software that enables the collection and export of survey data into other programs (i.e. excel and SPSS) to analyze the results. An

VI-18
introductory email was sent by IBA West to provide information regarding the purpose of the survey. Then, Questionpro identified the survey by a unique URL link. This link was emailed to respondents. Three days after the link was sent out, a follow-up reminder email was sent to the list to help increase the response rate. The survey remained active for one week in November (November 14 – 21st, 2005) to collect results. Additionally, security measures were built into the system to track IP addresses to ensure that only one response came from each computer that received the email link.
Survey Response & Characteristics of Respondents There were a total of 253 responses to the survey (the email was sent to 861 members), for an approximate 29% response rate, which is a reasonable, representative sample. We did not attempt to estimate the number of ineligible members from the original 861 to calculate a more accurate response rate. In order to be a member of IBA West, there are a few key characteristics, members must: be a licensed property/casualty insurance broker, who own the expirations and renewals of their business, be members of another similar at-large organization and pay dues and initiation fees to the Board of Directors. We acknowledge that in reporting any results from this survey we are not capturing the views of any California brokers that are not current members of IBA members that do no read their emails, or use the internet. For the most part we have an accurate representation of each industry segmented by geographical region. The basic demographic characteristics of the survey respondents:
Exhibit VI.15. Response breakdown by Industry and Region Region
Industry Classification Bay Area Orange County Los AngelesSacramento
Area San Diego Central Valley Other Entire State Multi-StateManufacturing 19% 6% 28% 5% 4% 10% 9% 13% 5%Construction 18% 7% 22% 6% 5% 13% 9% 17% 3%Public Entities 19% 5% 10% 5% 7% 17% 17% 17% 5%Financial 19% 4% 26% 9% 5% 13% 7% 15% 2%Transportation 14% 1% 20% 5% 4% 18% 8% 25% 4%Retail 21% 6% 24% 7% 4% 12% 9% 15% 3%Services 18% 8% 23% 7% 4% 12% 9% 17% 4%Agriculture 8% 2% 5% 6% 5% 27% 22% 20% 4%Health Care 13% 1% 26% 6% 4% 16% 10% 21% 1%Other 17% 5% 24% 7% 4% 8% 12% 19% 4%

VI-19
Exhibit VI.16. Response breakdown by Industry and Number of Clients
Estimated Number of Client employeesIndustry Classification Less than 5 5 to 50 51 to 100 101 to 500 More than 500
Manufacturing 3% 59% 24% 13% 1%Construction 8% 70% 14% 6% 1%Public Entities 5% 44% 15% 27% 10%Financial 9% 60% 16% 10% 4%Transportation 6% 62% 19% 12% 1%Retail 19% 66% 9% 4% 2%Services 15% 65% 12% 6% 1%Agriculture 6% 57% 19% 11% 7%Health Care 9% 55% 14% 16% 5%Other 10% 69% 14% 5% 2%
Changes in Market Competitiveness Active Markets
• According to respondents from the broker survey, the following industries are experiencing increased competition as evidence by a greater number of markets now available to their clients, with anywhere between five and nine active WC markets: manufacturing, financial services, retail, and other services.
• The following industries experiencing a continued hard market, with only 1 – 4 markets
available: construction, public entities, transportation, agriculture and healthcare, where workers’ compensation claims tend to concentrate. Respondents also identified the construction and transportation as more difficult to place and conversely retail, other services and financial services are much easier.
Exhibit VI.17. Number of Active Markets, by Industry
# of Active Markets
Industry Classification
None, all coverage is referred to
SCIF 1 to 4 5 to 9 10 to 20 More than 20Manufacturing 2% 33% 40% 22% 3%Construction 13% 61% 21% 3% 1%Public Entities 10% 60% 23% 8% 0%Financial 1% 31% 42% 24% 2%Transportation 8% 61% 23% 8% 0%Retail 0% 25% 42% 27% 5%Services 0% 26% 45% 23% 5%Agriculture 10% 56% 27% 7% 0%Health Care 4% 55% 30% 11% 1%Other 3% 35% 42% 18% 2%
• By calculating the average rating for the ease of difficulty in placing clients with insurers,
we find that the following industries are the easiest to place: retail, financial, services,

VI-20
manufacturing and other. And the more difficult to place industries: healthcare, agriculture, public entities, transportation and construction.
• When we consider both difficulty to place and number of bids, construction is the hardest, then transportation, agriculture and public entities. However, retail and services have seen the most benefit from the reforms and financial services is not far behind.
Exhibit VI.18. Ease of Difficulty in Placing Clients, by Industry
Difficulty in placing clients with private insurers
Industry Classification 1 (Easiest) 2 3 4 5 (Hardest)Average Rating
Manufacturing 27% 25% 35% 10% 4% 2.4Construction 2% 6% 16% 27% 49% 4.2Public Entities 3% 26% 23% 26% 23% 3.4Financial 35% 43% 19% 4% 0% 1.9Transportation 5% 6% 25% 29% 35% 3.8Retail 62% 24% 11% 1% 1% 1.6Services 42% 35% 18% 2% 2% 1.9Agriculture 3% 22% 34% 27% 14% 3.3Health Care 11% 28% 36% 19% 6% 2.8Other 14% 32% 42% 8% 3% 2.5
• We found inconclusive evidence to state any differences in placing large or small accounts, but there appears to be increased competition with smaller players. This was identified through a question that asked brokers about was whether small-to-mid sized accounts (less than $100,000 annual premiums) are easier or harder to place.
Changes in the Market
• According to survey respondents there is evidence that premiums charged have decreased since the previous policy period.
• It appears that the greatest beneficiaries have been retail, services, financial services and manufacturing, all at relative the same benefit level.
• Public entities have seen the least benefit. Agriculture and construction also lag below the average benefit level, but less than anticipated from conversations during our large broker interviews.
Exhibit VI.19. Changes in Premium, by Industry
Change in WC premium in most recent policy period
Industry ClassificationMore than
25% increase16 to 25% increase
5 to 15% increase
Less than 5% increase No Change
Less than 5% decrease
5 to 15% decrease
16 to 25% decrease
More than 25% decrease
Manufacturing 3% 5% 2% 2% 1% 4% 34% 34% 14%Construction 3% 5% 5% 2% 3% 11% 35% 25% 11%Public Entities 3% 6% 6% 6% 3% 14% 40% 23% 0%Financial 2% 5% 2% 3% 1% 5% 33% 34% 14%Transportation 3% 5% 2% 2% 6% 4% 42% 24% 11%Retail 5% 5% 1% 1% 1% 4% 32% 36% 14%Services 4% 5% 1% 1% 1% 3% 31% 36% 17%Agriculture 2% 4% 3% 1% 1% 5% 43% 31% 9%Health Care 6% 6% 1% 3% 2% 7% 31% 35% 10%Other 4% 6% 1% 2% 1% 3% 41% 32% 11%

VI-21
• According to survey respondents there is little evidence of a notable change in clients opting for deductibles in comparison to the previous policy period, with public entities the one exception, who have seen some increase.
Perceptions and Impact of Legislation
• But looking at the respondents as a whole, there is overwhelming evidence that the market has improved since the recent workers’ compensation reforms.
Exhibit VI.20. Changes in Premium, by Industry
Greatly Improved
Slightly Improved
Little or No Change
Slighty Worse
Dramitically Worse
0% 20% 40% 60% 80%Percent
What is your perception of Californias Workers Compensation market since recent reform efforts (AB-749, AB-277, SB-228 and SB-899) have been
implemented?
Exhibit VI.21. Perception of Market since Reforms, by Premium Size Greatly
ImprovedSlightly
ImprovedLittle or No
Change Slighty WorseDramitically
WorseLess than $1 million 39% 52% 6% 3% 0%$1 million to $2.5 million 58% 35% 4% 2% 2%$2.5 million to 5 million 64% 31% 5% 0% 0%$5 million to $10 million 78% 18% 5% 0% 0%More than $10 million 88% 11% 1% 0% 0%Total 70% 25% 4% 8% 4%
• Looking at the respondents by the total annual premium they underwrite, it is apparent
that the larger the insurance brokers have seen more improvement in the market than the smaller premium categories.
Employer Survey
A survey of California employers was designed and conducted to look at a cross section of businesses in California to determine pricing and availability of markets. The objective of the survey was to determine current market competition. The survey also gathered data about

VI-22
industry classification, employer size, geographical location, recent claims experience, and the timing of employer’s policy renewals, allowing for comparisons of differences across groups.
While the results of the survey provide useful insights about how the market has evolved and which employers have benefited, they are far from conclusive. Given the budget, scope, and the time frame for the employer study, a scientific, random-sample based survey was not feasible. Instead, the survey was posted on the California Chamber of Commerce website page restricted to its members. The process inherently led to self-selection of businesses, did not guarantee a balanced representation of businesses across geography, industry, and size, and did not provide any checks and balances to ensure that the appropriate, knowledgeable individuals within large organizations replied to the survey. The shortcomings of the survey are illustrated by the low representation of agricultural industry respondents. Due in part to the non-random nature of the sample, the breadth of statistical test and techniques to parse out the relative impact of different factors and employers characteristics were not applied to the data at this stage. While the insights provided from this survey are valuable, they are preliminary and do not substitute the need for a comprehensive random assignment survey or the use of statistical techniques to isolate the relationship between businesses and their respective change in premiums.
Sample Design
The survey was web-based and targeted to California Chamber of Commerce members. The survey was intended to complement the actuarial analysis by gauging how employers of various sizes, regions, and industries perceived the market and the impacts of the legislation. The Chamber of Commerce is a not-for-profit organization that professionals, such as corporate executives and human resource professionals join to help them with compliance and policy areas for their businesses. The organization is the largest business advocate and works through both state and federal mechanisms to leverage knowledge of laws and regulations to provide affordable and easy-to-use compliance products and services to California businesses. Currently, there are over 15,000 members, representing one-quarter of all private sector companies in California and 75% of its members have fewer than 100 employees.5 The survey conducted contains responses from current Chamber members, and therefore includes only those that have paid their annual membership. Also, the survey respondents are limited to those that read email and use the internet. We acknowledge that the results from this survey do not capture the views of any California businesses that are not current Chamber members or do not use the internet. In particular, smaller businesses and those owned by ethnic minorities are most likely under-represented. While, generally, the preferred method is to administer surveys via random sampling and stratify the sample to ensure adequate representation across regions, business size, and industries, the team decided to administer the survey via the web based on the costs of survey administration, the time frame and limited resources. Using the Chamber of Commerce website allowed companies in different industries and of different sizes to participate on their own schedule, and identify the individual with adequate knowledge of workers’ compensation within the organization.

VI-23
Survey Instrument
The survey consisted of twenty-nine (29) questions and took approximately 15-20 minutes to complete. The selection of the questions was based on input and discussions among project team members and employer groups. The process ensured that the questionnaire enhanced the main actuarial analysis, used the most appropriate means to reach the targeted population, and required minimal effort from employers.
Respondents were informed from the outset that the survey was part of a project to evaluate the impact of the recent workers’ compensation reforms and report findings to the Governor and the State Legislature. The survey instrument itself is included at the end of this section. The questions asked can be classified into the following four main categories:
a. employer characteristics; b. pricing and market competitiveness; c. policy renewals and changes; and d. employer perceptions about the impact of the reforms.
Collecting information about employer and insurance policy characteristics (i.e. start date, number of quotes) allowed for comparison of perceptions and reported impacts across time, regions, employer size, and industries.
Data Collection Procedures
A link to the survey was sent via email from the Chamber to their member list. Also, the link was placed on the Chamber’s on-line member sign-in page. Therefore, there were two main avenues to access the survey: responding to the link through an email or logging into the member page of the Chamber’s website. The data was collected online through QuestionPro, an on-line survey software that allows you to create, collect and export survey data into other programs (i.e. excel and SPSS) in order to analyze the results. An introductory email was sent by the Chamber. They also mentioned the survey in their newsletter. The survey remained active for two weeks in December and January to collect responses. Security measures were built into the system to ensure that only one response came from each computer that received the email link.
Results
This section provides a summary of the survey results. It is divided into three key sections. First, the overall survey response and respondent characteristics are detailed. Second, we provide a summary of the questions that provide some measure of market competitiveness. Finally, we report on the result of questions regarding perceptions of the legislation and its impact.
Survey Response & Respondent Characteristics In total 1,051 respondents completed the survey. We are unable to calculate eligibility numbers since the survey was distributed through two avenues (i.e. email list and web-page). The respondents included a wide array of businesses across industries, regions, and number of employees.

VI-24
The geographical location of the businesses is roughly representative of the California population as a whole, according to comparisons with US Census Bureau figures. Because the sample is non-random, we urge caution in interpreting the results. After performing a Chi-Square test, we found that there are significant differences between the survey sample and the population of California employers, by industry. Exhibit VI.23 below shows a comparison and which industries are over and/or under represented.
Exhibit VI.22. Sample versus Population Comparison, by Industry Classification
IndustryNumber of Firms
in California % of Population Respondents % of SampleAgriculture 2,311 0.3% 19 1.8%Mining, utilities, construction 68,226 10.1% 94 9.1%Wholesale, retail, accommodation. food 174,462 25.8% 161 15.5%Transportation and warehousing 14,760 2.2% 38 3.7%Information, professional, management, admin 168,817 25.0% 217 20.9%Finance, insurance, real estate 58,025 8.6% 96 9.3%Healthcare 71,588 10.6% 98 9.5%Other services 72,070 10.7% 139 13.4%Manufacturing 46,075 6.8% 174 16.8%TOTALS 676,334 100.0% 1,036 100.0%
Sample versus Population Comparison
0.0% 5.0% 10.0% 15.0% 20.0% 25.0% 30.0%
Agriculture
Mining, utilities, construction
Wholesale, retail, accommodation.food
Transportation and warehousing
Information, professional,management, admin
Finance, insurance, real estate
Healthcare
Other services
Manufacturing % of Sample% of Population

VI-25
The three exhibits below present the respondent characteristics by region and industry, by region and employer size, and by region and policy renewal or initiation date.
Exhibit VI.23. Respondent Characteristics by Region, by Industry Classification
Northern California
Los Angeles and Inland
Empire Orange CountySan Diego
County
Central Valley, Tahoe, and
OtherAgriculture 56% 6% 0% 6% 31%Mining, Utilities, and Construction 40% 14% 3% 12% 32%Wholesale trade, retail trade, accommodation and food services 32% 18% 7% 15% 28%
Transportation and Warehousing 24% 17% 7% 14% 38%Information,Professional, Management of Companies, and Administrative 33% 22% 5% 10% 31%
Finance, Insurance, and Real Estate 27% 27% 7% 15% 24%Healthcare 37% 19% 1% 12% 31%Other services 36% 25% 9% 9% 21%Manufacturing 26% 38% 6% 11% 19%
TOTAL 33% 23% 6% 12% 27%
Industry Classification
Geographical Location
Changes in Market Competitiveness The responses from the employer survey indicate that the competitiveness of the workers’ compensation market has increased relative to 2004. Additionally, all the measured indicators reflect that competitiveness steadily increased during 2005. A larger share of employers report that their premiums decreased, particularly if they renewed or started their policy in the latter half of 2005. The share of firms receiving multiple quotes from their carrier and quotes from multiple carriers also increased as did the share of employers switching to new carriers. In addition, the share of respondents who reported receiving the majority of their coverage from the State Compensation Insurance Fund (SCIF) decreased steadily in 2005. Companies initiated policies with private carriers and fewer remained with SCIF.
• Premiums: While on average, premiums decreased modestly from 2004, the worker’s compensation insurance market has changed. Of the employers who renewed or started their policy in the final quarter of 2005, 62% reported decreases in their premium (21% reported increases). In contrast, of employers who last renewed or started their policy in 2004, only 37% experienced decreased while 47 percent reported increases.
VI-26
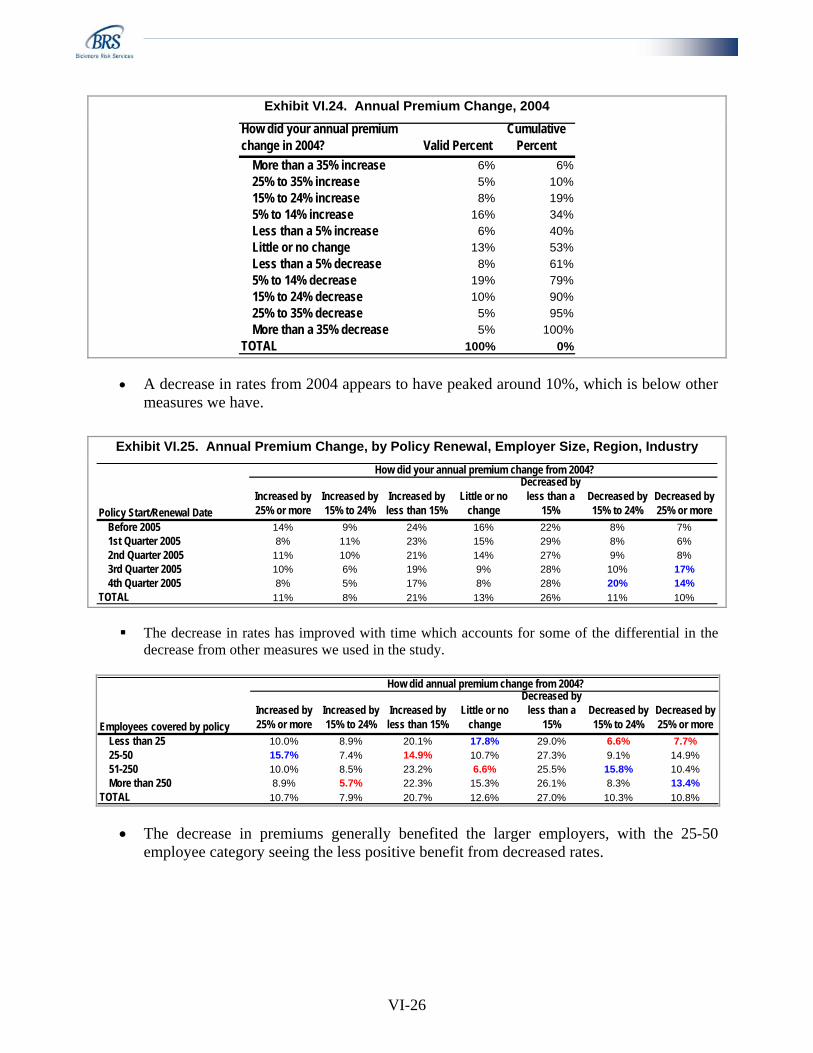
Exhibit VI.24. Annual Premium Change, 2004 How did your annual premium change in 2004? Valid Percent
Cumulative Percent
More than a 35% increase 6% 6%25% to 35% increase 5% 10%15% to 24% increase 8% 19%5% to 14% increase 16% 34%Less than a 5% increase 6% 40%Little or no change 13% 53%Less than a 5% decrease 8% 61%5% to 14% decrease 19% 79%15% to 24% decrease 10% 90%25% to 35% decrease 5% 95%More than a 35% decrease 5% 100%
TOTAL 100% 0%
• A decrease in rates from 2004 appears to have peaked around 10%, which is below other measures we have.
Exhibit VI.25. Annual Premium Change, by Policy Renewal, Employer Size, Region, Industry How did your annual premium change from 2004?
Increased by 25% or more
Increased by 15% to 24%
Increased by less than 15%
Little or no change
Decreased by less than a
15%Decreased by 15% to 24%
Decreased by 25% or more
Before 2005 14% 9% 24% 16% 22% 8% 7%1st Quarter 2005 8% 11% 23% 15% 29% 8% 6%2nd Quarter 2005 11% 10% 21% 14% 27% 9% 8%3rd Quarter 2005 10% 6% 19% 9% 28% 10% 17%4th Quarter 2005 8% 5% 17% 8% 28% 20% 14%
TOTAL 11% 8% 21% 13% 26% 11% 10%
Policy Start/Renewal Date
The decrease in rates has improved with time which accounts for some of the differential in the decrease from other measures we used in the study.
How did annual premium change from 2004?
Increased by 25% or more
Increased by 15% to 24%
Increased by less than 15%
Little or no change
Decreased by less than a
15%Decreased by 15% to 24%
Decreased by 25% or more
Less than 25 10.0% 8.9% 20.1% 17.8% 29.0% 6.6% 7.7%25-50 15.7% 7.4% 14.9% 10.7% 27.3% 9.1% 14.9%51-250 10.0% 8.5% 23.2% 6.6% 25.5% 15.8% 10.4%More than 250 8.9% 5.7% 22.3% 15.3% 26.1% 8.3% 13.4%
TOTAL 10.7% 7.9% 20.7% 12.6% 27.0% 10.3% 10.8%
Employees covered by policy
• The decrease in premiums generally benefited the larger employers, with the 25-50 employee category seeing the less positive benefit from decreased rates.
VI-27
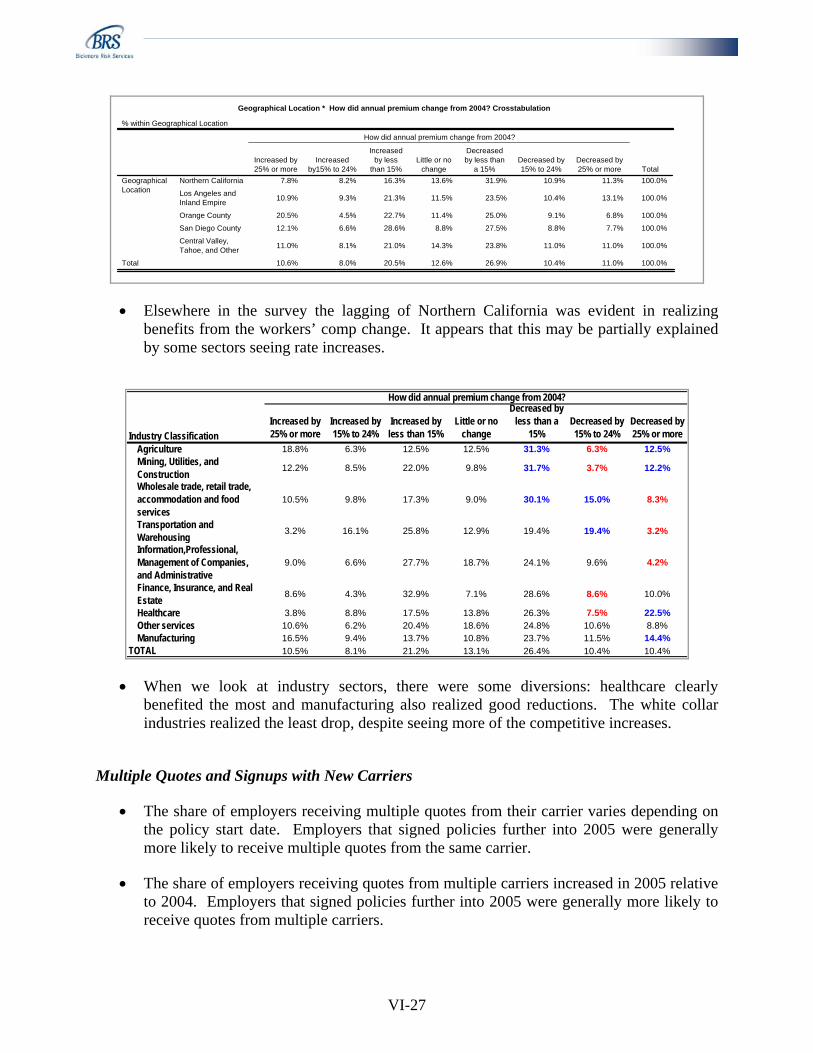
Geographical Location * How did annual premium change from 2004? Crosstabulation
% within Geographical Location
7.8% 8.2% 16.3% 13.6% 31.9% 10.9% 11.3% 100.0%
10.9% 9.3% 21.3% 11.5% 23.5% 10.4% 13.1% 100.0%
20.5% 4.5% 22.7% 11.4% 25.0% 9.1% 6.8% 100.0%
12.1% 6.6% 28.6% 8.8% 27.5% 8.8% 7.7% 100.0%
11.0% 8.1% 21.0% 14.3% 23.8% 11.0% 11.0% 100.0%
10.6% 8.0% 20.5% 12.6% 26.9% 10.4% 11.0% 100.0%
Northern California
Los Angeles andInland Empire
Orange County
San Diego County
Central Valley,Tahoe, and Other
GeographicalLocation
Total
Increased by25% or more
Increasedby15% to 24%
Increasedby less
than 15%Little or no
change
Decreasedby less than
a 15%Decreased by15% to 24%
Decreased by25% or more
How did annual premium change from 2004?
Total
• Elsewhere in the survey the lagging of Northern California was evident in realizing benefits from the workers’ comp change. It appears that this may be partially explained by some sectors seeing rate increases.
How did annual premium change from 2004?
Increased by 25% or more
Increased by 15% to 24%
Increased by less than 15%
Little or no change
Decreased by less than a
15%Decreased by 15% to 24%
Decreased by 25% or more
Agriculture 18.8% 6.3% 12.5% 12.5% 31.3% 6.3% 12.5%Mining, Utilities, and Construction 12.2% 8.5% 22.0% 9.8% 31.7% 3.7% 12.2%
Wholesale trade, retail trade, accommodation and food services
10.5% 9.8% 17.3% 9.0% 30.1% 15.0% 8.3%
Transportation and Warehousing 3.2% 16.1% 25.8% 12.9% 19.4% 19.4% 3.2%
Information,Professional, Management of Companies, and Administrative
9.0% 6.6% 27.7% 18.7% 24.1% 9.6% 4.2%
Finance, Insurance, and Real Estate 8.6% 4.3% 32.9% 7.1% 28.6% 8.6% 10.0%
Healthcare 3.8% 8.8% 17.5% 13.8% 26.3% 7.5% 22.5%Other services 10.6% 6.2% 20.4% 18.6% 24.8% 10.6% 8.8%Manufacturing 16.5% 9.4% 13.7% 10.8% 23.7% 11.5% 14.4%
TOTAL 10.5% 8.1% 21.2% 13.1% 26.4% 10.4% 10.4%
Industry Classification
• When we look at industry sectors, there were some diversions: healthcare clearly benefited the most and manufacturing also realized good reductions. The white collar industries realized the least drop, despite seeing more of the competitive increases.
Multiple Quotes and Signups with New Carriers
• The share of employers receiving multiple quotes from their carrier varies depending on the policy start date. Employers that signed policies further into 2005 were generally more likely to receive multiple quotes from the same carrier.
• The share of employers receiving quotes from multiple carriers increased in 2005 relative to 2004. Employers that signed policies further into 2005 were generally more likely to receive quotes from multiple carriers.

VI-28
• Larger employers were more likely to receive multiple quotes from their carrier and quotes from multiple carriers.
• The share of employers signing up with new carriers varies depending on the policy start date. Employers that signed policies further into 2005 were generally more likely to sign up with a new carrier.
• Employers in wholesale trade and retail were more likely than average to sign up with new carriers.
• The results vary little by industry (with the exception of healthcare which experienced deeper decreases in premiums than other industries).
Exhibit VI.26. Policy Renewal with Current versus New Carrier
When you most recently renewed your Worker’s Compensation coverage did you? Valid Percent
Cumulative Percent
Renew with your current carrier 73% 73%Sign with a new carrier 25% 99%Neither, it is the first time having this type of coverage 1% 100%
TOTAL 100% 100%
• The survey shows that approximately 25% went to a new carrier when renewing their policies. This is a sign of increased competition.
Exhibit VI.27. Policy Renewal with Current versus New Carrier, by Industry
Renew with your current carrier
Sign with a new carrier
First time having WC coverage
Agriculture 68.8% 31.3% 0.0% 100.0%Mining, Utilities, and Construction 78.2% 19.2% 2.6% 100.0%Wholesale trade, retail trade, accommodation and food services 64.5% 33.9% 1.6% 100.0%
Transportation and Warehousing 86.2% 13.8% 0.0% 100.0%Information,Professional, Management of Companies, and Administrative 79.1% 20.9% 0.0% 100.0%
Finance, Insurance, and Real Estate 82.1% 16.4% 1.5% 100.0%Healthcare 72.4% 27.6% 0.0% 100.0%Other services 72.2% 25.9% 1.9% 100.0%Manufacturing 67.9% 29.9% 2.2% 100.0%
TOTAL 73.5% 25.3% 1.3% 100.0%
Industry Classification
When you most recently renewed your Worker’s Compensation coverage did you?
Total
• Not surprisingly, the most dissatisfied sector, agriculture, had the most movement (31% versus 25% average), with wholesale + retail trade very similar. But for some reason, transportation lagged.

VI-29
Exhibit VI.28. Policy Renewal with Current Carrier, Single versus Multiple Quotes, by Policy State
Only one quoteOffer multiple
quotes TotalBefore 2005 76.4% 23.6% 100.0%1st Quarter 2005 75.0% 25.0% 100.0%2nd Quarter 2005 75.0% 25.0% 100.0%3rd Quarter 2005 72.7% 27.3% 100.0%4th Quarter 2005 60.2% 39.8% 100.0%
TOTAL 72.7% 27.3% 100.0%
Policy Start/Renewal Date
When you renewed your insurance with your current carrier, did they offer you?
• As with new carrier penetration, the trend on the number of quotes increased in each progressive quarter.
Exhibit VI.29. Distribution of Workers’ Compensation Coverage
Who currently provides the majority of your Workers’ Compensation Coverage? Valid Percent Cumulative Percent
CA State Compensation Insurance Fund (SCIF) 29% 29%
Insurer other than SCIF 53% 82%Individual Self-Insurance 6% 89%Group Self Insurance 9% 97%Other 3% 100%
TOTAL 100%
• According to the survey 30% use SCIF which is generally consistent with other data we have on SCIF’s market share.
• Self-insurance has a respectable 15% market share despite the fact that the survey focused on smaller employers.
Exhibit VI.30. Distribution of Workers’ Compensation Coverage, by Industry
SCIF
Insurer other than SCIF
Individual Self-Insurance
Group Self Insurance Other
Agriculture 47.4% 31.6% 5.3% 15.8% 0.0% 100.0%Mining, Utilities, and Construction 39.1% 41.3% 6.5% 8.7% 4.3% 100.0%Wholesale trade, retail trade, accommodation and food services 16.9% 64.2% 7.4% 8.8% 2.7% 100.0%
Transportation and Warehousing 19.4% 63.9% 8.3% 8.3% 0.0% 100.0%Information,Professional, Management of Companies, and Administrative 35.0% 51.5% 5.8% 5.3% 2.4% 100.0%
Finance, Insurance, and Real Estate 26.1% 58.7% 3.3% 6.5% 5.4% 100.0%Healthcare 38.0% 40.2% 4.3% 15.2% 2.2% 100.0%Other services 41.1% 41.9% 6.2% 7.8% 3.1% 100.0%Manufacturing 15.3% 64.4% 8.6% 9.8% 1.8% 100.0%
TOTAL 29.3% 53.0% 6.3% 8.6% 2.8% 100.0%
Industry
Who currently provides the majority of your Workers’ Compensation Coverage?
Total

VI-30
• Not surprisingly SCIF’s market share was most evident in agriculture (47%), which is difficult to place. This may explain why agriculture is dissatisfied with reforms, a potentially significant issue.
• Mining also had 40% in SCIF, which is not surprising as it is also a difficult to place industry.
• Predictably, retail used SCIF the least (17%) since there are more carrier alternatives. • And manufacturing has a higher percentage of self-insured (19%) and do not use SCIF as
much. • We recommend a second level cross tabulation looking at who provides the coverage by
both industry and policy renewal date.
Exhibit VI.31. Distribution of perception of reforms
How did the 2002, 2003 and 2004 reforms of the Workers Compensation programimpact your decisions for your California employees?
515 49.0 57.9 57.9
250 23.8 28.1 86.1
72 6.9 8.1 94.2
52 5.0 5.8 100.0
889 84.7 100.0
161 15.3
1050 100.0
Little or no impact
Moderate impact
Major impact
Key factor inmaking decision
Total
Valid
SystemMissing
Total
Frequency Percent Valid PercentCumulative
Percent
• A significant (35%) of employers indicated their decisions were being influenced by the
workers’ compensation reform. This is a very positive outcome.

VI-31
Exhibit VI.32. Distribution of Perception of Reforms, by Industry
Industry Classification * How did the 2002, 2003 and 2004 reforms of the Workers Compensation programimpact your decisions for your California employees? Crosstabulation
% within Industry Classification
47.1% 29.4% 5.9% 17.6% 100.0%
43.0% 39.2% 7.6% 10.1% 100.0%
55.6% 30.8% 9.0% 4.5% 100.0%
34.3% 45.7% 8.6% 11.4% 100.0%
66.5% 22.2% 6.5% 4.9% 100.0%
71.8% 22.4% 2.4% 3.5% 100.0%
58.6% 23.0% 6.9% 11.5% 100.0%
62.1% 23.3% 12.1% 2.6% 100.0%
52.3% 33.1% 10.6% 4.0% 100.0%
57.9% 28.2% 8.1% 5.9% 100.0%
Agriculture
Mining + Utilities +Construction
Wholesale trade + retailtrade + accommodationand food serv
Transportation andWarehousing
Information +Professional +Management ofCompanies + Admin
Finance and Insurance+ Real Estate
Healthcare
Other services
Manufacturing
IndustryClassification
Total
Little or noimpact
Moderateimpact Major impact
Key factorin makingdecision
How did the 2002, 2003 and 2004 reforms of theWorkers Compensation program impact your
decisions for your California employees?
Total
• The mining, transportation and agriculture sectors were the most impacted and they have
the most experience with workers’ comp claims, another good result. Not surprisingly, the least impact was with the white collar industries.
Exhibit VI.33. Distribution of Perception of Reforms, by Employer Size
How many employees does your company have that are covered by your California Workers CompensationPolicy? * How did the 2002, 2003 and 2004 reforms of the Workers Compensation program impact your
decisions for your California employees? Crosstabulation
% within How many employees does your company have that are covered by your California WorkersCompensation Policy?
62.3% 21.9% 8.3% 7.5% 100.0%
56.5% 25.0% 8.3% 10.2% 100.0%
56.6% 30.2% 7.4% 5.8% 100.0%
52.3% 34.9% 11.4% 1.3% 100.0%
57.5% 27.8% 8.7% 6.1% 100.0%
Less than 25
25-50
51-250
More than 250
How many employeesdoes your companyhave that are covered byyour California WorkersCompensation Policy?
Total
Little or noimpact
Moderateimpact Major impact
Key factorin makingdecision
How did the 2002, 2003 and 2004 reforms of theWorkers Compensation program impact your
decisions for your California employees?
Total

VI-32
• Another positive result is the impact’s being felt by larger employers who have the most sophisticated experience with workers’ comp claims.
Exhibit VI.33. Distribution of Perception of Reforms, by Region
Geographical Location * How did the 2002, 2003 and 2004 reforms of the Workers Compensationprogram impact your decisions for your California employees? Crosstabulation
% within Geographical Location
59.5% 29.7% 5.2% 5.6% 100.0%
57.9% 24.4% 11.6% 6.1% 100.0%
42.1% 36.8% 15.8% 5.3% 100.0%
59.8% 24.1% 6.9% 9.2% 100.0%
55.8% 28.9% 9.6% 5.6% 100.0%
57.2% 28.0% 8.6% 6.1% 100.0%
Northern California
Los Angeles andInland Empire
Orange County
San Diego County
Central Valley,Tahoe, and Other
GeographicalLocation
Total
Little or noimpact
Moderateimpact Major impact
Key factorin makingdecision
How did the 2002, 2003 and 2004 reforms of theWorkers Compensation program impact your
decisions for your California employees?
Total
• There was some regional variation with Lost Angeles seeing the greatest benefit and
Northern California the least. This correlates to the fraud propensity in there region (Northern California the least and Los Angeles the most fraud), and this is expected to drop as reforms simmer.

VI-33
Perceptions about Satisfaction and Impact of Legislation
Exhibit VI.34. Satisfaction with the Workers’ Compensation System, by Industry
Very SatisfiedSomewhat Satisfied Neutral
Somewhat Unsatisfied
Very Unsatisfied
Agriculture 6% 38% 6% 6% 44%Mining, Utilities, and Construction 3% 29% 23% 25% 21%Wholesale trade, retail trade, accommodation and food services 4% 25% 25% 20% 25%
Transportation and Warehousing 4% 44% 12% 16% 24%
Information,Professional, Management of Companies, and Administrative 5% 24% 26% 19% 26%
Finance, Insurance, and Real Estate 8% 22% 22% 28% 22%Healthcare 8% 31% 18% 27% 16%Other services 10% 17% 23% 25% 26%Manufacturing 5% 29% 17% 24% 25%
TOTAL 6% 26% 22% 23% 24%
Industry Classification
How would you rate the Workers’ Compensation system?
• Not surprisingly agriculture is the least satisfied [note: agriculture has a small sample size] while healthcare was the most benefited.
• A further concern in interpreting the agriculture results is the difficulty in reaching the Hispanic population.
• We recommend taking a look at a few additional cross tabulations: 1) satisfaction by both industry and the changes in annual premium paid, 2) breaking down the 16% of very unsatisfied healthcare respondents to find out additional characteristics and 3) breaking down the 44% of somewhat satisfied transportation + warehousing respondents to find out additional characteristics.
Exhibit VI.35. Satisfaction with the Workers’ Compensation System, by Geography
Very SatisfiedSomewhat Satisfied Neutral
Somewhat Unsatisfied
Very Unsatisfied
Northern California 8% 25% 23% 24% 20%Los Angeles and Inland Empire 6% 26% 17% 22% 29%Orange County 2% 20% 29% 15% 34%San Diego County 2% 31% 23% 24% 19%Central Valley, Tahoe, and Other 5% 27% 21% 23% 25%TOTAL 6% 26% 21% 23% 24%
How would you rate the Workers’ Compensation system?
• Looking at satisfaction by geography, Los Angeles + Inland Empire show the most relative dissatisfaction with the workers’ comp system.
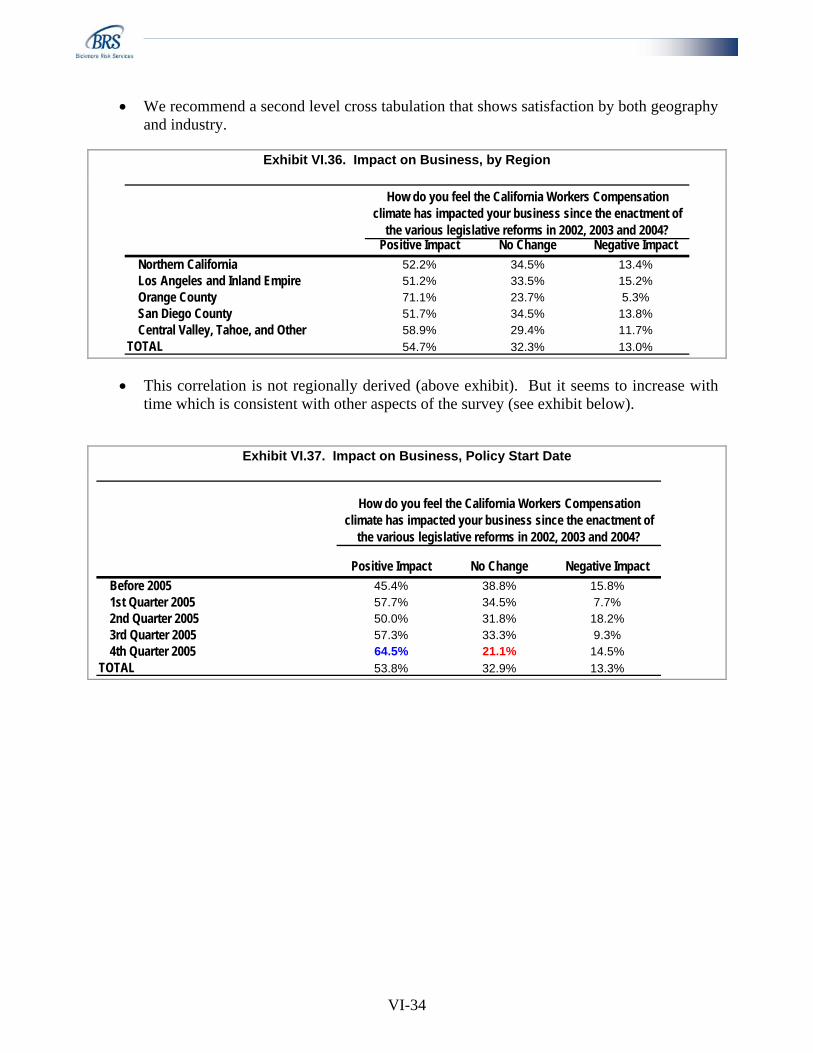
VI-34
• We recommend a second level cross tabulation that shows satisfaction by both geography and industry.
Exhibit VI.36. Impact on Business, by Region
Positive Impact No Change Negative ImpactNorthern California 52.2% 34.5% 13.4%Los Angeles and Inland Empire 51.2% 33.5% 15.2%Orange County 71.1% 23.7% 5.3%San Diego County 51.7% 34.5% 13.8%Central Valley, Tahoe, and Other 58.9% 29.4% 11.7%
TOTAL 54.7% 32.3% 13.0%
How do you feel the California Workers Compensation climate has impacted your business since the enactment of
the various legislative reforms in 2002, 2003 and 2004?
• This correlation is not regionally derived (above exhibit). But it seems to increase with time which is consistent with other aspects of the survey (see exhibit below).
Exhibit VI.37. Impact on Business, Policy Start Date
Positive Impact No Change Negative ImpactBefore 2005 45.4% 38.8% 15.8%1st Quarter 2005 57.7% 34.5% 7.7%2nd Quarter 2005 50.0% 31.8% 18.2%3rd Quarter 2005 57.3% 33.3% 9.3%4th Quarter 2005 64.5% 21.1% 14.5%
TOTAL 53.8% 32.9% 13.3%
How do you feel the California Workers Compensation climate has impacted your business since the enactment of
the various legislative reforms in 2002, 2003 and 2004?

VI-35
Chapter VI Endnotes 1 The adjusted market share figures include a correction to the written premium, net of deductible figures, due to the fact that SCIF reports their written premium in an alternative method to the other industry carriers. SCIF has historically reported their ‘earned premium’ as written premium to the CDI. Since earned premium lags written premium an adjustment is needed to be made to accurately reflect SCIF’s premiums with the rest of the industry. The 2005 data is only through third quarter (3Q). 2 IBA West Member Access Program 3 In-person Interview, October 28, 2005 4 Focus Group, November 7, 2005 5 California Chamber of Commerce; http://www.calchamber.com