
NCVER No Frills Conference - Engaging employers in regional workforce development

OCCASIONAL PAPER
VET program completion rates: an evaluation of the current method
National Centre for Vocational Education Research
Publisher’s note
The views and opinions expressed in this document are those of the author/project team and do not necessarily reflect
the views of the Australian Government, or state and territory governments. Any interpretation of data is the
responsibility of the author/project team.
To find other material of interest, search VOCEDplus (the UNESCO/NCVER international database
<http://www.voced.edu.au>) using the following keywords: completion; data analysis; evaluation; outcomes;
participation; qualifications; statistical method; vocational education and training.
© National Centre for Vocational Education Research, 2016
With the exception of cover design, artwork, photographs, all logos, and any other material where copyright is owned by
a third party, all material presented in this document is provided under a Creative Commons Attribution 3.0 Australia
<http://creativecommons.org/licenses/by/3.0/au>.
This document should be attributed as NCVER 2016, VET program completion rates: an evaluation of the current method,
NCVER, Adelaide.
NCVER is an independent body responsible for collecting, managing and analysing, evaluating and communicating
research and statistics about vocational education and training (VET).
NCVER’s in-house research and evaluation program undertakes projects which are strategic to the VET sector. These
projects are developed and conducted by NCVER’s research staff and are funded by NCVER. This research aims to improve
policy and practice in the VET sector.
COVER IMAGE: GETTY IMAGES/iStock
ISBN 978 1 925173 71 0
TD/TNC 126.07
Published by NCVER, ABN 87 007 967 311
Level 11, 33 King William Street, Adelaide SA 5000
PO Box 8288 Station Arcade, Adelaide SA 5000, Australia
Phone +61 8 8230 8400 Fax +61 8 8212 3436
Email [email protected] Web <http://www.ncver.edu.au> <http://www.lsay.edu.au>
Follow us: <http://twitter.com/ncver> <http://www.linkedin.com/company/ncver>

About the research VET program completion rates: an evaluation of the current method
National Centre for Vocational Education Research
The premise to this work is a simple question: ‘how reliable is the method used by NCVER to estimate
projected rates of VET program completion?’ In other words, how well do early projections align with
actual completion rates some years later?
Completion rates are simple to calculate with a cohort of students who start together in a very short
program with a defined end date. The context in vocational education and training (VET) is, however, far
more complex. Program lengths vary and may span several years, students commence at different times
and many study part-time. Waiting for all students to complete or ‘drop out’ of their training before
calculating an actual completion rate gives a reliable answer, but is somewhat impractical.
This paper summarises the key findings from a technical review of the validity of the method long used by
NCVER in estimating projected completion rates for government-funded VET programs. This analysis
required the interrogation of large longitudinal data sets with tens of millions of enrolments over multiple
years. Whilst the work beneath it is complex, the outcomes are revealing because of ever-high interest in
completion rates as measures of the efficiency and effectiveness of the VET sector.
Key findings The method long used by NCVER for estimating VET program completion rates using data from the
National VET Provider Collection is shown to be reliable and aligns well with actual rates of completion
for historical estimates. One of the advantages of the methodology is that it can be readily applied to
subsets of the data based on student demographics or attributes of the training.
Given that it takes a number of years for actual rates of completion to stabilise, the method is well
suited for inclusion as part of any method of assessing completion rates, where the projected
completion rate method is used to estimate rates for the most recent years and actual rates used for
prior years.
The technical review has also shown that the current predictive method can be improved by defining a
program’s commencing year as the year it first appears in the National VET Provider Collection rather
than using the commencing flag variable.
It is anticipated that the incorporation of unique student identifiers into any preferred methodology,
and its extension to total VET activity, can be phased in from the collection of 2017 training activity.
Dr Craig Fowler
Managing Director, NCVER

Contents
About the research 3
Tables and figures 5
Introduction 6
How does NCVER currently derive VET completion rates? 8 How the projected rates are currently calculated 8
How accurate are the current estimates of completion rates? 10
Reviewing the methodology 12
Conclusion 16
References 17
Appendix 18 The current method for projecting rates of completion: a working example 18
i
4 VET qualification completion rates: an evaluation of the current method

Tables and figures Tables 1 Breakdown of where commencing flag = ‘Y(es)’ within three-year
matched datasets centred around years of interest (% of total) 12
2 Comparison of Mean Absolute and Mean Squared errors based on
projected completion rates estimated using the current and revised
approach, 2008—13 14
3 Actual rates of completion by collection year (%) 14
A1 Breakdown of student program enrolments within the three-year
matched dataset centred around 2014 18
A2 2014 program enrolment status and their transitioning 2015
equivalents (number) 19
A3 Proportion of 2014 program enrolments transitioning to 2015
statuses 20
Figures 1 Comparison of current projected and actual program completion
rates, 2008—15 (%) 10
2 Comparison of projected program completion rates (current and
revised) against actual rates of completions, 2008—15 (%) 13
NCVER 5

Introduction The Australian vocational education and training (VET) system provides training across a
wide range of subject areas for students of all ages and backgrounds. The training is
delivered through a variety of training institutions and enterprises (including to
apprentices and trainees), and students may study individual subjects or full programs
that lead to formal program completions.
This diversity presents a challenge for the VET sector in devising indicators of efficiency
and effectiveness, such as VET completion rates — the focus of this paper.
There are two fundamental concepts associated with deriving completion rates. The first
concerns subject-completion1 rates, which are straightforward and are routinely
published in the Productivity Commission’s Report on government services (2016). It is
simply the proportion of subjects undertaken that are successfully completed, based on
hours of training.
The second, the rate at which programs or qualifications are completed, is more
problematic. The difficulties arise in two areas. First, technically, it is far from
straightforward because the VET system has only recently introduced a unique student
identifier (USI), which can be used to track a student’s training activity from
commencement through to completion, and identifying the date at which a student
commenced a qualification is not well defined.
The second issue concerns the interpretation of a program-completion rate, as many
individuals undertake particular VET subjects with a view to obtaining particular skills
rather than obtaining a complete qualification. Because some of these students are
reported to the National VET Provider Collection as enrolled in qualifications, the
enrolment data overestimate the actual number of qualifications being undertaken,
while completion rates underestimate the number of qualifications being completed.
Notwithstanding, it is readily agreed the sector needs information pertaining to the rate
of program completion and a methodology with which to derive it.
In an occasional paper published by the National Centre for Vocational Education
Research (NCVER) in 2012, Bednarz examined completion rates, which included an
explanation of how they are defined and calculated. In terms of a definition for
completion rates, Bednarz (2012, p.7) notes that:
The most intuitive definition of a completion rate is that it is simply the
proportion of students who finish the course they started. For example, if 100
students started a course in 2005, and 27 of those students went on to complete
their course, we’d say that the completion rate for 2005 is 27%.
As Bednarz (2012) explains, in an ideal world we would wait for all courses to finish
before calculating the actual rate of completion, noting that some courses can take
several years to complete and many students undertake part-time study, both of which
extend completion dates. Thus, as Bednarz (2012) explains, because ‘we potentially
1 Load pass rate in the terminology of the VET sector.
6 VET qualification completion rates: an evaluation of the current method
i
have to wait many years to ensure all students have had the opportunity to complete’,
determination of actual completion rates can be delayed significantly, reducing the
usefulness of the data (p.7).
To overcome this issue, NCVER has derived a methodology for estimating projected
program completion rates. The methodology used is presented in Mark and Karmel
(2010), and applies probability theory to the National VET Provider Collection data,
specifically to the status of program enrolments across successive years, to derive the
probability that a commencing VET program enrolment will eventually be completed.
NCVER has long published completion rates of government-funded2 VET programs in
Australia for a number of VET sub-populations using this technique, including those
relating to states and territories, program level and broad fields of education. These are
further sub-populated for full-time students aged 25 years and under with no prior post-
school program completion.
Ongoing interest in completion rates as measures of the efficiency and effectiveness of
the VET sector has prompted NCVER to undertake a review of the long-used methodology
to examine its validity. This paper summarises the findings of this technical review and
makes some recommendations for its improvement and the future publication of
completion rates.
2 Government-funded VET is broadly defined as all programs delivered by government providers and government-funded programs delivered by community and other registered providers.
NCVER 7

How does NCVER currently derive VET completion rates?
To explain NCVER’s current approach to deriving completion rates, we again borrow
from Bednarz (2012). NCVER reports completion rates at several different levels; that is,
for courses, subjects, apprentices and trainees, and specific sub-groups of students. To
estimate completion rates, we need to track particular components, or entities, of
these, for example, courses, subjects, contracts of training, or individual students from
their commencement. A group of entities that started at the same time is referred to as
a ‘commencing cohort’.
This paper is concerned with completion rates for VET qualifications and the
methodology used to derive them. NCVER currently publishes two sets of completion
rates: program completion rates and subject completion rates.
Bednarz (2012, p.7) offers a useful starting point for our definitions of program
completion rate and subject completion rate, noting that the terms ‘program’
‘qualification’ and ‘course’ are used interchangeably throughout this paper.
A program completion rate is the proportion of VET programs started in a given year
that will eventually be completed. It is also referred to as a qualification or course
completion rate.
Subject completion rates A VET program is comprised of a number of subjects, also referred to as ‘modules’ or
‘units of competency’. NCVER also reports subject completion rates, termed ‘load pass
rates’. Unlike the program completion rate, the subject load pass rate needs to be
weighted because subjects are of different lengths, and this needs to be accommodated.
Determination of the subject completion rate is based on the annual hours (or full year
training equivalent — FYTE) for each assessable module or unit of competency. A subject
load pass rate is defined by Bednarz (2012, p.8) as follows:
A subject load pass rate is the ratio of hours studied by students who passed their
subject(s) to the total hours committed to by all students who passed, failed or
withdrew from the corresponding subject(s).
How the projected rates are currently calculated As highlighted in this paper’s introduction, to calculate the true program completion rate,
we need to wait for all students who started a program in a given period to either
complete or drop out of the program; that is, we need to track each program from start to
finish. Only when all programs are accounted for will we know the final program
completion rate. Unfortunately, this can take years as some programs are scheduled for
two or three years, which can take even longer if undertaken on a part-time basis.
8 VET qualification completion rates: an evaluation of the current method
There is a further problem: even if we wait for the programs to finish (either completed or
withdrawn), completions are not always reported immediately to the National VET
Provider Collection. This delay in reporting means that completions occurring in a given
year or quarter might take another year or longer to be reported.
Not surprisingly, the longer we wait, the more accurate the completion rate becomes,
although, as time goes by, the data become less relevant, making the information less
useful for performance evaluation. While the direct approach of tracking programs from
start to finish is adequate for tracking historic rates of completion, the need remains to
derive projected completion rates for the most recent years.
As a result, NCVER has developed a methodology for estimating projected program
completion rates using data from the National VET Provider Collection. The data used
provide information on the status of program enrolments across successive years. While
the National VET Provider Collection is essentially a cross-sectional database by year, it
contains enough inherent information to match data across years for individual VET
students and the programs they undertake. The matched longitudinal dataset obtained
then allows the use of mathematical techniques that rely on conditional probabilities to
calculate the anticipated rates of completion.
The current methodology, which has been used by NCVER for some time, is presented in
Mark and Karmel (2010). This approach uses information about program enrolments over a
three-year window (centred on the year of interest), together with the theory of absorbing
Markov chains to derive the probability that a commencing VET program enrolment will
eventually be completed. The advantage of Markov chain theory is that it has the property
that the probability of an entity ‘transitioning’ from one status to another in successive
time periods is not dependent on past transitions. This means we can use knowledge of the
‘status’ of program enrolments across successive years to predict the long-term program
completion rate without having the full history of all program enrolments. Another
advantage of the methodology is that it can be readily applied to subsets of the data based
on student demographics or attributes of the training.
To obtain these statuses, student and program information are matched across a three-
year window, centred on the year of interest. Here, the year of interest is year n, the year
prior year n–1 and the following year year n+1. The first two years of data (years n-1 and
n) are used to determine the status of program enrolments for the year of interest. The
last two years (years n and n+1) are used to determine the status of program enrolments
for the following year. Once this is done, we can cross-tabulate the status of program
enrolments for the year of interest with those of the following year to calculate the
proportions transitioning from one status to another and use these to determine the
likelihood that any program enrolment commencing in the year of interest will eventually
be completed. To illustrate this process in more detail, a working example is presented in
the appendix.
NCVER 9

How accurate are the current estimates of completion rates?
The title of this chapter asks a very important question but it is by no means an easy one
to answer, as it requires tracking every student enrolment from start to finish. While
there is enough information to match data across years, a number of inherent data
issues limit the accuracy of the tracking process. Foremost amongst these is the fact
that NCVER does not have the actual names and addresses of students but an encrypted
identifier. This means we cannot be 100% certain we are following the same student
over time. For example, if a student gets married and changes their name, they will get
a different encrypted ID based on their new name. Also, if a student starts a course with
one training provider and completes it with another, relating this activity to the same
individual may not be possible. It is anticipated that the recent introduction of the
unique student identifier (USI) will overcome this issue, although it will take some years
before all program enrolments in the system will have an associated USI. Additional
complications arise due to the lack of reliable information on the actual start date of
the program enrolment, an issue discussed further in the next chapter.
Notwithstanding these inherent data issues, it is possible to assess the accuracy of the
completion rates derived using the Mark and Karmel (2010) method, by matching, as best
we can, student program enrolment information across the collection years from
commencement to completion.
By taking the year in which a program enrolment first appears as a pseudo starting year
and matching records across collection years by unique encrypted ID, sex, date of birth
and course identifier, we can derive estimates of actual qualification completion rates
for enrolments flagged as commencing in a particular year.3
The derived ‘actual’ rates of completion are shown in figure 1, together with the latest
projected rates based on the Mark and Karmel (2010) method.
Figure 1 Comparison of current projected and actual program completion rates, 2008–15 (%)
Source: National VET Provider Collection, 2015.
3 As some encrypted IDs have multiple client IDs connected to them, the ‘actual’ rates have been based on unique NCVER encrypted IDs comprising only a single client identifier.
20
25
30
35
40
2008 2009 2010 2011 2012 2013 2014 2015
NCVER ACTUAL (as at 2015 collection) (based on commencing year = first year appears in the collection)Current NCVER rates projection method
10 VET qualification completion rates: an evaluation of the current method

Two things stand out immediately in the graph above. First, the actuals ‘fall away’ from
the projected estimates in the most recent years. This reflects the upwards revision in
the rates that occurs once additional award records become available in subsequent
collections. The second observation is that the projected rates of completion produced
by the Mark and Karmel (2010) method are remarkably similar to those of the actual
rates. Notwithstanding, there is some evidence that the Mark and Karmel method has
historically understated historical rates. While the discrepancy is not large, it suggests
some refinements to the existing methodology may be warranted.
NCVER 11
Reviewing the methodology As with any projection methodology, ongoing evaluation is crucial to understanding and
taking account of changes in the underlying data. The previous chapter highlighted that
the Mark and Karmel methodology appears to reasonably project the rates of
completion, although there is some evidence it may be regularly understating the true
rates. This prompted NCVER to undertake a review of the approach and its assumptions.
Several areas were investigated, including alternative modelling techniques, the criteria
developed by Mark and Karmel (2010) for classifying an enrolment’s Markov chain state,
and the quality of the data elements in the National VET Provider Collection. Rather
than detail all these analyses, findings and the issues potentially requiring consideration
in the future, we restrict our attention to the issues requiring immediate attention.
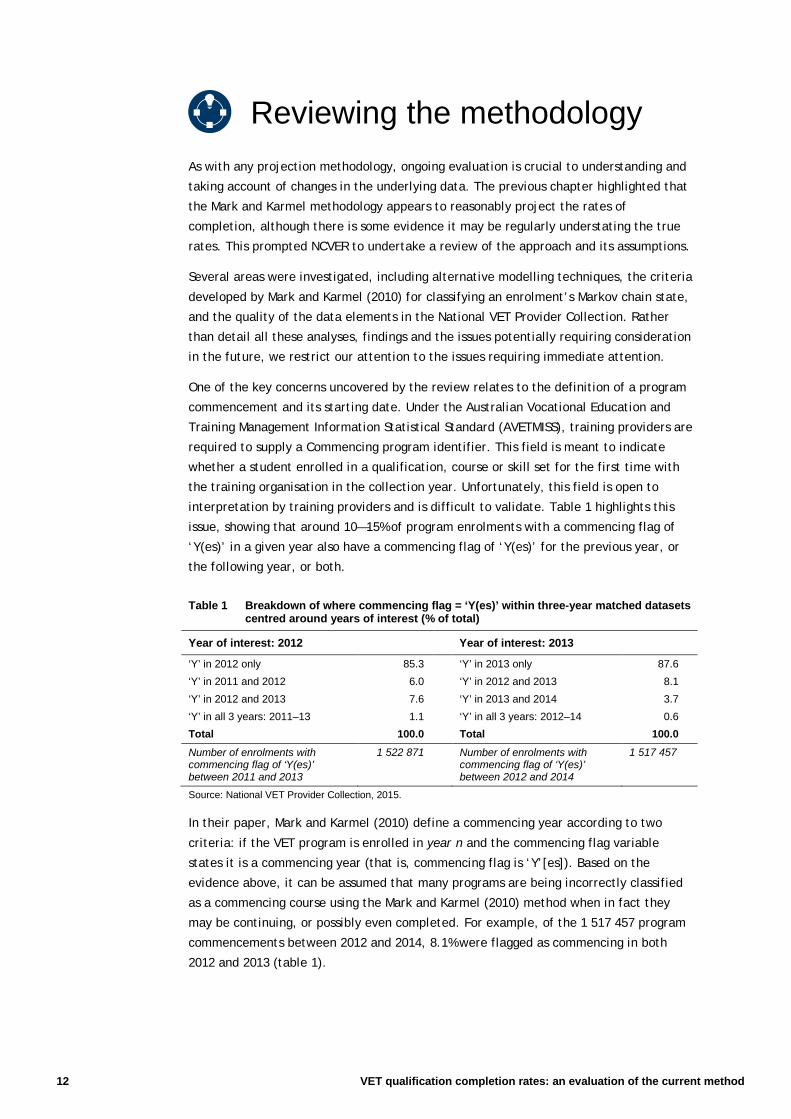
One of the key concerns uncovered by the review relates to the definition of a program
commencement and its starting date. Under the Australian Vocational Education and
Training Management Information Statistical Standard (AVETMISS), training providers are
required to supply a Commencing program identifier. This field is meant to indicate
whether a student enrolled in a qualification, course or skill set for the first time with
the training organisation in the collection year. Unfortunately, this field is open to
interpretation by training providers and is difficult to validate. Table 1 highlights this
issue, showing that around 10—15% of program enrolments with a commencing flag of
‘Y(es)’ in a given year also have a commencing flag of ‘Y(es)’ for the previous year, or
the following year, or both.
Table 1 Breakdown of where commencing flag = ‘Y(es)’ within three-year matched datasets centred around years of interest (% of total)
Year of interest: 2012 Year of interest: 2013
‘Y’ in 2012 only 85.3 ‘Y’ in 2013 only 87.6 ‘Y’ in 2011 and 2012 6.0 ‘Y’ in 2012 and 2013 8.1 ‘Y’ in 2012 and 2013 7.6 ‘Y’ in 2013 and 2014 3.7 ‘Y’ in all 3 years: 2011–13 1.1 ‘Y’ in all 3 years: 2012–14 0.6 Total 100.0 Total 100.0 Number of enrolments with commencing flag of ‘Y(es)’ between 2011 and 2013
1 522 871 Number of enrolments with commencing flag of ‘Y(es)’ between 2012 and 2014
1 517 457
Source: National VET Provider Collection, 2015.
In their paper, Mark and Karmel (2010) define a commencing year according to two
criteria: if the VET program is enrolled in year n and the commencing flag variable
states it is a commencing year (that is, commencing flag is ‘Y’[es]). Based on the
evidence above, it can be assumed that many programs are being incorrectly classified
as a commencing course using the Mark and Karmel (2010) method when in fact they
may be continuing, or possibly even completed. For example, of the 1 517 457 program
commencements between 2012 and 2014, 8.1% were flagged as commencing in both
2012 and 2013 (table 1).
12 VET qualification completion rates: an evaluation of the current method

Rather than use the commencing flag variable, an obvious alternative is to define the
year of commencement as the year a program first appears in the National VET Provider
Collection. An analysis was undertaken to compare the projected rates of completion
against the derived actual values, with projections based on: (a) the existing Mark and
Karmel (2010) method utilising the collection’s inherent commencing flag; and (b) the
utilisation of the new commencing year derived from the earliest year in which a
program enrolment appears in the collection. The results are presented in figure 2.
Figure 2 Comparison of projected program completion rates (current and revised) against actual rates of completions, 2008–15 (%)
Source: National VET Provider Collection, 2015.
Again, the graph highlights the dramatic ‘falling away’ of the actual completion rates
from the projected rates in the most recent couple of years, reflecting the upwards
revision of the rates that occurs with subsequent collections. With respect to the
projected rates, the graph highlights an apparent increase in accuracy of the rates via
the revised methodology, which incorporates the new approach for defining the
commencing year, as evidenced by this projected series more closely aligning with the
actual series for 2013 and prior years.
20
25
30
35
40
2008 2009 2010 2011 2012 2013 2014 2015
NCVER ACTUAL (as at 2015 collection) (based on commencing year = first yearappears in the collection)Current NCVER rates projection method
Projected rates based on revised methodology
NCVER 13
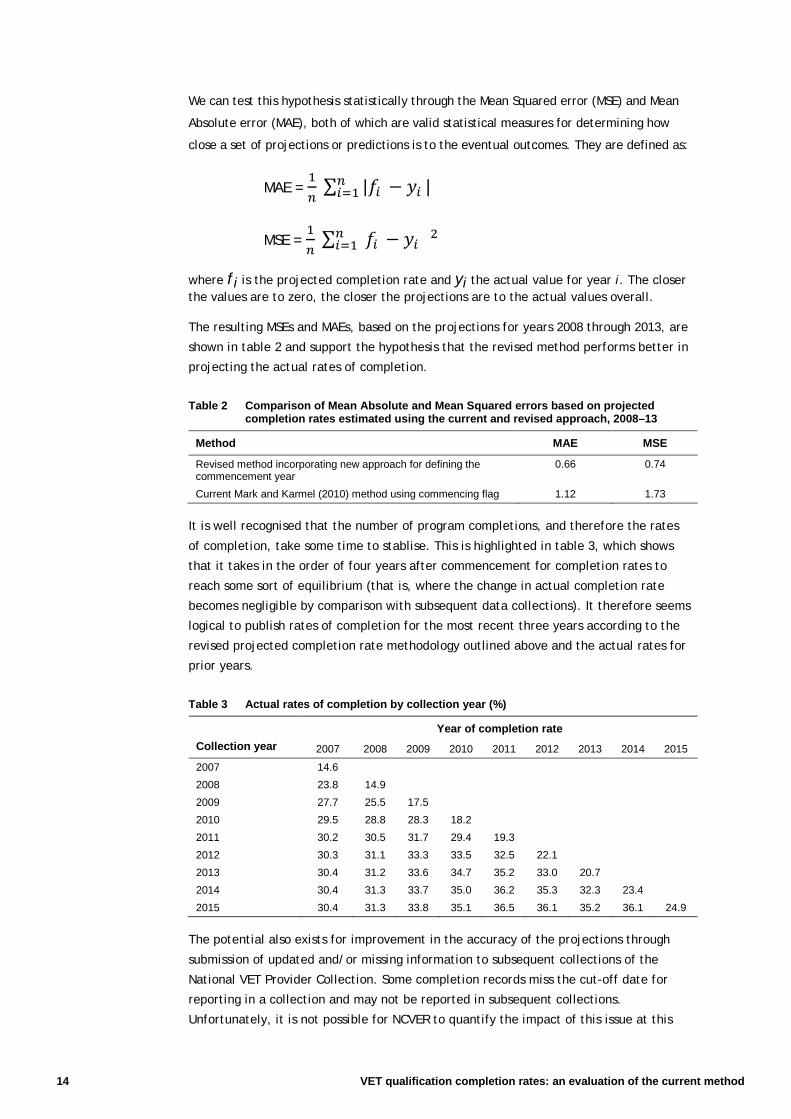
We can test this hypothesis statistically through the Mean Squared error (MSE) and Mean
Absolute error (MAE), both of which are valid statistical measures for determining how
close a set of projections or predictions is to the eventual outcomes. They are defined as:
MAE = 1𝑛𝑛
∑ |𝑓𝑓𝑖𝑖 − 𝑦𝑦𝑖𝑖 |𝑛𝑛𝑖𝑖=1
MSE = 1𝑛𝑛
∑ (𝑓𝑓𝑖𝑖 − 𝑦𝑦𝑖𝑖 )2𝑛𝑛𝑖𝑖=1
where fi is the projected completion rate and yi the actual value for year i. The closer the values are to zero, the closer the projections are to the actual values overall.
The resulting MSEs and MAEs, based on the projections for years 2008 through 2013, are
shown in table 2 and support the hypothesis that the revised method performs better in
projecting the actual rates of completion.
Table 2 Comparison of Mean Absolute and Mean Squared errors based on projected completion rates estimated using the current and revised approach, 2008–13
Method MAE MSE
Revised method incorporating new approach for defining the commencement year
0.66 0.74
Current Mark and Karmel (2010) method using commencing flag 1.12 1.73
It is well recognised that the number of program completions, and therefore the rates
of completion, take some time to stablise. This is highlighted in table 3, which shows
that it takes in the order of four years after commencement for completion rates to
reach some sort of equilibrium (that is, where the change in actual completion rate
becomes negligible by comparison with subsequent data collections). It therefore seems
logical to publish rates of completion for the most recent three years according to the
revised projected completion rate methodology outlined above and the actual rates for
prior years.
Table 3 Actual rates of completion by collection year (%)
Collection year Year of completion rate
2007 2008 2009 2010 2011 2012 2013 2014 2015
2007 14.6 2008 23.8 14.9 2009 27.7 25.5 17.5 2010 29.5 28.8 28.3 18.2 2011 30.2 30.5 31.7 29.4 19.3 2012 30.3 31.1 33.3 33.5 32.5 22.1 2013 30.4 31.2 33.6 34.7 35.2 33.0 20.7 2014 30.4 31.3 33.7 35.0 36.2 35.3 32.3 23.4 2015 30.4 31.3 33.8 35.1 36.5 36.1 35.2 36.1 24.9
The potential also exists for improvement in the accuracy of the projections through
submission of updated and/or missing information to subsequent collections of the
National VET Provider Collection. Some completion records miss the cut-off date for
reporting in a collection and may not be reported in subsequent collections.
Unfortunately, it is not possible for NCVER to quantify the impact of this issue at this
14 VET qualification completion rates: an evaluation of the current method

time. Actual and projected program completion rates may be being underestimated
across all levels, an issue that requires further investigation.
Although the unique student identifier has only recently been introduced, it is expected
to make the process of observing and tracking program enrolments from commencement
to completion easier and more reliable. As the Markov chain approach requires a
minimum of three years data to estimate projected completion rates, the application of
USIs into the methodology will be phased in from the 2017 collection. The incorporation
of USIs into the methodology used to estimate program completion rates will require due
investigation to understand its impact before implementation.
Further investigation is also required to confirm the adequacy of the Markov chain
methodology to project rates of completion for total VET activity, first collected with a
number of exemptions in 2014 and more fully for 2015. It is anticipated that the
methodology can be readily applied to TVA; however, similar to the incorporation of the
USI noted above, a minimum of three years of comparable data is required, meaning
that any TVA projections based on this methodology would not become fully available
until after the collection of 2017 training activity.
Another area warranting investigation concerns superseded qualifications (that is, when
a program is replaced or incorporated into a new one) and their potential impact on
completion rates. A very initial analysis at the national level indicated rates of
completion may increase by as much as two percentage points once superseded
qualifications are taken into account in a longitudinal analysis of program enrolments.
In general, the criteria developed by Mark and Karmel (2010) for classifying an
enrolment’s Markov chain state was found to be adequate for the purposes of projecting
actual rates of completion. While a number of alternative ways to classify program
enrolments into initial Markov chain states were considered, none appears to work more
effectively in terms of more closely approaching the actual rates.
The possibility of using other statistical techniques was also considered. Methods such as
non-linear regression and mixed modelling are valid alternatives to the Markov chain
approach; however, there are some significant downfalls in their application. In
particular, these methods assume that the historic nature of the data continues into the
future, and that they are not intrinsically adaptive in their approach to projecting the
future. This is where the conditional probability Markov chain method offers the
advantage: being a random sequential and adaptive process, any change in the
underlying trend will quickly be reflected in the transitional probabilities the Markov
chain approach uses.
NCVER 15

Conclusion In this paper, we reviewed the validity of the method used by NCVER for some time to
estimate completion rates for government-funded vocational education and training
programs.
Our findings show that this approach, whereby data from the National VET Provider
Collection are utilised, is reliable and aligns well with the actual rates of completion.
The divergence of data for the most recent years reflects the upwards revision in the
rates that occurs once additional award records become available, in subsequent
collections. The current methodology has the advantage that it can be readily applied to
subsets of the data based on student demographics or attributes of the training.
One of the key issues identified during the review concerns the definition of a program
commencement and its starting date. The current methodology uses the commencing
flag variable, which this analysis has shown is problematic, in that it understates
projected completion rates. Defining a program’s commencing year as the year it first
appears in the National VET Provider Collection increases the accuracy of the projected
rates, with these rates aligning more closely with actuals for all but the most recent
years, for the reasons described above.
Given that it takes a number of years for actual rates of completion to stabilise, the
method is well suited for inclusion as part of any method of assessing completion rates,
where the projected completion rate method is used to estimate rates for the most
recent years and actual rates used for previous years.
Further improvements to the rates may also be possible, for example, by investigating
the effect of superseded qualifications to determine what other refinements could be
made to improve accuracy. Due investigation will also be required to fully understand
the impact of incorporating USIs into the methodology. As the method requires a
minimum of three years data, the addition of USIs into the methodology cannot be
phased in until data for 2017 training activity have been collected.
Investigation is also required to check the adequacy of applying the methodology to
total VET activity. With 2015 being the first year of TVA collection without exemptions,
along with the methodology requiring three years of comparable data, projections for
TVA rates of completions would not become fully available until after the collection of
2017 training activity.
16 VET qualification completion rates: an evaluation of the current method

References Bednarz, A 2012, Lifting the lid on completion rates in the VET sector: how they are defined and
derived, viewed June 2016, <http://www.ncver.edu.au/publications/2467.html>, NCVER, Adelaide.
Mark, K & Karmel, T 2010, The likelihood of completing a VET qualification: a model-based approach, viewed June 2016, <http://www.ncver.edu.au/publications/2272.html>, NCVER, Adelaide.
NCVER (National Centre for Vocational Education Research) 2016, Australian vocational education and training statistics: the likelihood of completing a VET qualification 2010—14, viewed June 2016, <http://www.ncver.edu.au/publications/2272.html>, NCVER, Adelaide.
Productivity Commission 2016, Report on government services 2016, viewed July 2016, <http://www.pc.gov.au/research/ongoing/report-on-government-services/2016>, Productivity Commission, Canberra.
NCVER 17

Appendix The current method for projecting rates of completion: a working example At the time of writing this paper, the latest National VET Provider Collection was 2015.
As we require information for both the year of interest and the year following the year
of interest, the latest year for which we can predict program completion rates is 2014.
The first step in the process is to create a matched dataset of program enrolments; this
is undertaken by matching students and the programs they enrolled in across the three
years, 2013 to 2015. This process is well explained in Mark and Karmel (2010), and
essentially entails using information in the National VET Provider Collection pertaining to
the student and the unique programs in which they enrol to match unique program
enrolments and completions (awards) across the three years, 2013 to 2015.
Table A1 details the breakdown of the 4 555 365 unique student program enrolments in
the 2013 to 2015 matched dataset.4
Table A1 Breakdown of student program enrolments within the three-year matched dataset centred around 2014
Program enrolments in 2013 Program enrolments in 2014 Program enrolments in 2015
In 2013 only 1 470 338 In 2013 but not 2015 390 467 In 2013 but not 2014 9 133
In 2014 but not 2015 390 467 In 2014 only 983 608 In 2014 but not 2013 354 890
In 2015 but not 2014 9 133 In 2015 but not 2013 354 890 In 2015 only 1 098 673
In all 3 years 96 578 In all 3 years 96 578 In all 3 years 96 578
Total 1 966 516 Total 1 825 543 Total 1 559 274
Total records in matched dataset
4 555 365 Total records in matched dataset
4 555 365 Total records in matched dataset
4 555 365
Source: National VET Provider Collection, 2015.
The next step of the process is to determine the status of these program enrolments in
the year of interest (2014) and the following year (2015). Based on the approach
outlined by Mark and Karmel (2010), this involves classifying each VET program
enrolment in any one-year period as being in one of four states:
commencing program year
continuing program year
dropped out of the program (discontinued)
completed the program.
Here, a VET program enrolment can only be classified to one state in each year. Thus a
program commenced in 2014, say, is counted as a commencing program in 2014 even if
the program is also completed in that same year. Such a program will be classified as
completed in the following year, in 2015. Further, the VET program enrolment’s course
4 In terms of the matched datasets, a program enrolment associated with a given year means a program enrolment record exists within the VET Provider Collection for that year.
18 VET qualification completion rates: an evaluation of the current method

is assumed to be a discrete-time random (stochastic) process, meaning that the year-to-
year transition in an enrolment’s status only depends on the last status the enrolment
occupied, and is independent of its past. Furthermore, the last two states (‘dropped
out’ and ‘completed’) are assumed to be absorbing states, since, in theory, a program
that has been completed or been dropped out of will always remain that way.
Finally, some of the program enrolments in our matched dataset will not fall into any of
the four states listed above for a particular year of interest, either because they have
not yet commenced, have already been completed, or already dropped out of. To
account for these, a dummy status of ‘Not in the system’ is assigned.
The method for classifying the status of a program enrolment is presented in Mark and
Karmel’s (2010) paper. Based on this approach, and applying it to the data in our 2014
matched longitudinal dataset (centred around 2014 as our year of interest), we derive
the program enrolment statuses for 2014 and also their transitioning statuses for 2015,
as shown in table A2.
Table A2 2014 program enrolment status and their transitioning 2015 equivalents (number)
2015 Status
2014 Status Completed
(1) Dropped out (2)
Continuing (3)
Commencing (4)
Not in the VET system
Total
Completed (1) 45 163 5 721 764 510 557 915 610 073 Dropped out (2) 378 0 3 929 4 320 958 652 967 279 Continuing (3) 202 604 242 108 127 155 0 0 571 867 Commencing (4) 328 315 599 986 319 278 0 0 1 247 579 Not in the system 13 045 0 87 184 1 011 026 47 312 1 158 567
Total 589 505 847 815 538 310 1 015 856 1 563 879 4 555 365 Source: National VET Provider Collection, 2015.
A couple things become immediately obvious: first, the states ‘completed’ and ‘dropped
out’ are not completely ‘absorbing’, with several program enrolments moving from a
completed state in 2014 to either a continuing (764) or commencing (510) state in 2015.
The numbers are small however and can be ignored. Second, there are a number of
enrolments deemed not in the system in 2014 transitioning to either a continuing
(87 184) or completing (13 045) state in 2015. This reflects the flexibility in the sector,
whereby students can undertake their program part-time and not enrol in successive
years.
As our interest is in the proportion of program enrolments within a defined state in 2014
‘transitioning’ to another state in 2015, we need to consider the corresponding row
percentages, as provided in table A3.
NCVER 19

Table A3 Proportion of 2014 program enrolments transitioning to 2015 statuses
2015 Status
2014 Status Completed (1)
Dropped out (2)
Continuing (3)
Commencing (4)
Not in the VET system
Total
Completed (1) 7.40 0.94 0.31 0.08 91.45 100% Dropped out (2) 0.04 0.00 0.14 0.45 99.11 100% Continuing (3) 35.43 42.34 22.24 0.00 0.00 100% Commencing (4) 26.32 48.09 25.59 0.00 0.00 100% Not in the system 1.13 0.00 7.53 87.27 4.08 100%
It is these ‘row’ proportions (prow,column) that are used to derive the conditional
probability that any VET program enrolment commencing in 2014 will eventually be
completed.
This can be calculated by applying absorbsing Markov chain theory via the following
formula:
3231
314341program) completinglly Pr(eventua
ppppp+
+= .
Where
41p = the proportion of program enrolments deemed to commence in 2014 and completed
in 2015 (i.e. row 4, column 1)
43p = the proportion of program enrolments deemed to commence in 2014 and continuing
in 2015 (i.e. row 4, column 3)
31p = the proportion of program enrolments deemed to be continuing in 2014 and
completed in 2015 (i.e. row 3, column 1)
32p = the proportion of program enrolments deemed to be continuing in 2014 and
dropped out in 2015 (i.e. row 3, column 2).
Thus, in terms of table A3, we have:
P41 = 26.32
P43 = 25.59
P31 = 35.43
p32 = 42.34
Applying these values to the formula above results in the overall probability of a VET
program enrolment commenced in 2014 eventually being completed of 38%.
It is this probability that is taken as the projected completion rate for program
enrolments commencing in 2014.
20 VET qualification completion rates: an evaluation of the current method

NCVER 21

National Centre for Vocational Education Research
Level 11, 33 King William Street, Adelaide, SA 5000 PO Box 8288 Station Arcade, Adelaide SA 5000, Australia
Phone +61 8 8230 8400 Fax +61 8 8212 3436 Email [email protected] Web <http://www.ncver.edu.au> <http://www.lsay.edu.au>
Follow us: <http://twitter.com/ncver> <http://www.linkedin.com/company/ncver>
22 VET qualification completion rates: an evaluation of the current method