Vertical Axis Wind Turbine Evaluation and Design · Vertical Axis Wind Turbine Evaluation and...
81
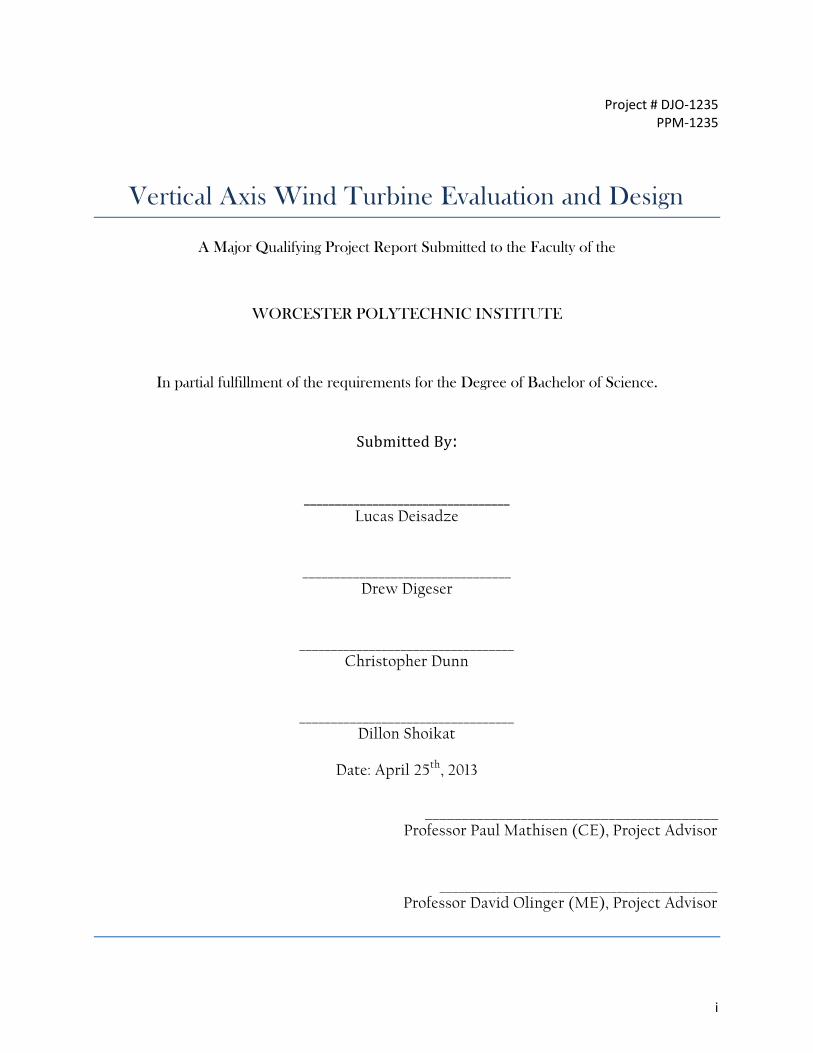
i Project # DJO-1235 PPM-1235 Vertical Axis Wind Turbine Evaluation and Design A Major Qualifying Project Report Submitted to the Faculty of the WORCESTER POLYTECHNIC INSTITUTE In partial fulfillment of the requirements for the Degree of Bachelor of Science. Submitted By: _________________________________ Lucas Deisadze _________________________________ Drew Digeser __________________________________ Christopher Dunn __________________________________ Dillon Shoikat Date: April 25 th , 2013 ________________________________________ Professor Paul Mathisen (CE), Project Advisor ____________________________________________ Professor David Olinger (ME), Project Advisor
Transcript of Vertical Axis Wind Turbine Evaluation and Design · Vertical Axis Wind Turbine Evaluation and...
i
Project # DJO-1235 PPM-1235
Vertical Axis Wind Turbine Evaluation and Design
A Major Qualifying Project Report Submitted to the Faculty of the
WORCESTER POLYTECHNIC INSTITUTE
In partial fulfillment of the requirements for the Degree of Bachelor of Science.
Submitted By:
_________________________________ Lucas Deisadze
_________________________________ Drew Digeser
__________________________________ Christopher Dunn
__________________________________ Dillon Shoikat
Date: April 25th, 2013
________________________________________
Professor Paul Mathisen (CE), Project Advisor
____________________________________________ Professor David Olinger (ME), Project Advisor

ii
Certain materials are included under the fair
use exemption of the U.S.
Copyright Law and have been prepared according
to the fair use guidelines
and are restricted from further use.
iii
Abstract
This project studied the potential for installing roof-mounted vertical axis wind
turbine (VAWT) systems on house roofs. The project designed several types of VAWT
blades with the goal of maximizing the efficiency of a shrouded turbine. The project also
used a wind simulation software program, WASP, to analyze existing wind data measured
on the roofs of various WPI buildings. Scale-model tests were performed in the WPI closed-
circuit wind tunnel. An RPM meter and a 12 volt step generator were used to measure
turbine rotation speeds and power output at different wind speeds. The project also
studied roof mounting systems for turbines that are meant to dissipate vibrations to the
roof structure. Turbine vibrations were measured during the wind tunnel tests and in
impact tests on a scale-model house. Recommendations were made for future designs of
roof-mounted VAWTs.
iv
Capstone Design Experience ABET requirement
To fulfill the requirements for a Major Qualifying Project (MQP), this project must
meet the requirements for a capstone design experience. The Accreditation Board for
Engineering and Technology (ABET) defines the capstone design experience as an
“experience based on the knowledge and skills acquired in earlier course work and
incorporating engineering standards and realistic constraints that include most of the
following considerations: economic; environmental; sustainability; manufacturability;
ethical; health and safety; social; and political.” (Cryer, 2011)
The design components for this project include the following attributes which
satisfy the ABET requirements for capstone design:
Environmental: Environmental concerns have been an important issue in the engineering
field. Projects have been taking consideration of environmental impacts as a result of their
products. Wind turbines are a form of renewable energy that will help the environment by
not producing emissions while creating electricity. As an end result less fossil fuel would be
required in order to provide electricity for a house.
Sustainability: The project outcome will produce a commodity that will be able to help the
environment and make society more self-sustainable. This is accomplished by making
society more independent from using fossil fuels. This has been a very big topic as of recent
and many different movements happening in America and around the world are focused on
using our renewable energy, such as wind. This project is helping the succession of this
idea and broadening the capability of turbines to reduce carbon footprints.
Manufacturability and Economic: With a simpler design of these turbines and easier assembly,
it will make it possible for local hardware stores to sell these products. Along with simpler

v
design this will also decrease manufacturing cost and make it more economical for families to
buy.
Health and Safety: This project considers health and safety concerns by addressing roof
mounting systems. The hope is to design a mounting system that will not cause structural
damage to residential roofs. A mount that is able to diminish vibrations before entering roof
trusses will help protect trusses longevity and decrease chance of failure.
vi
Acknowledgements
The VAWT group would like to thank: Professor David Olinger and Paul Mathisen For their guidance, leadership, and dedication to our project from the beginning to the end Professor James O’Shaughnessy For originally organizing this project and allowing us to contribute into furthering research on vertical axis wind turbines Francis X. Reilly, Sr. For introducing us to the idea of using enclosures for vertical axis wind turbines Peter Hefti For his help and guidance with using lab equipment that was vital in completing the project Don Pellegrino For assisting us with various wind speed instruments as well as repairing damaged equipment The Staff of the WPI Machine Shops, esp. Christopher DeStefano For assisting our group in machining brackets for our mounting system
vii
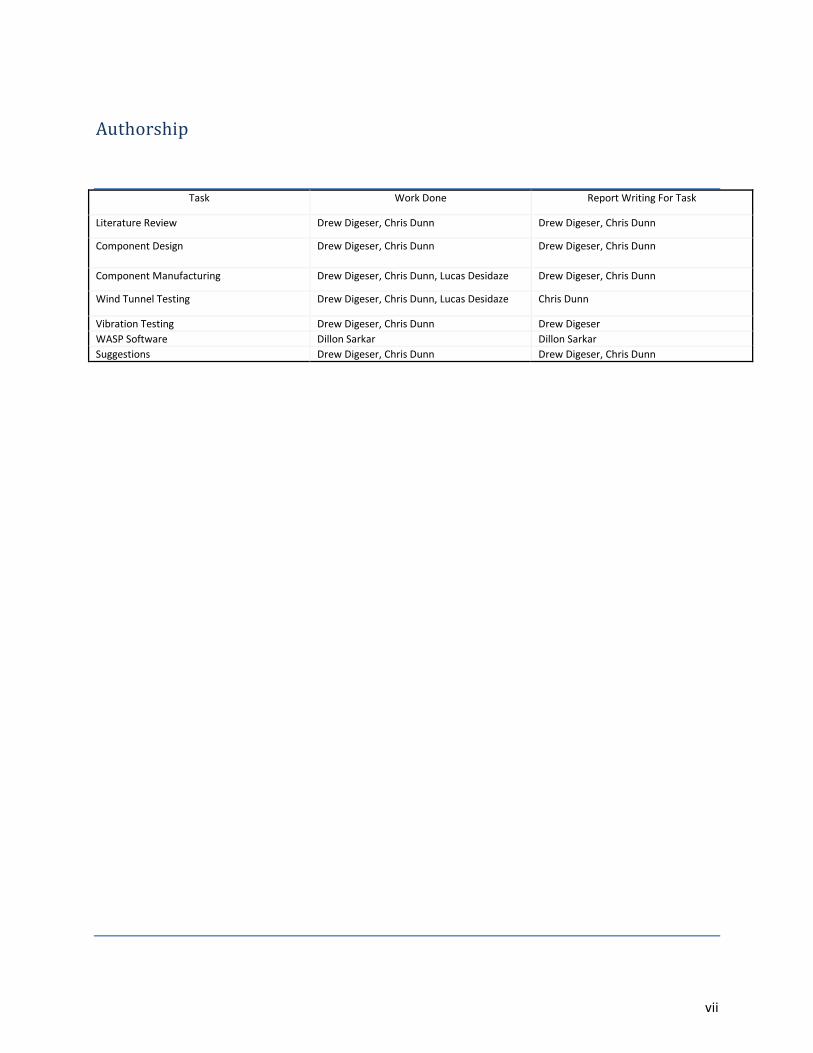
Authorship
Task Work Done Report Writing For Task
Literature Review Drew Digeser, Chris Dunn Drew Digeser, Chris Dunn
Component Design Drew Digeser, Chris Dunn Drew Digeser, Chris Dunn
Component Manufacturing Drew Digeser, Chris Dunn, Lucas Desidaze Drew Digeser, Chris Dunn
Wind Tunnel Testing Drew Digeser, Chris Dunn, Lucas Desidaze Chris Dunn
Vibration Testing Drew Digeser, Chris Dunn Drew Digeser
WASP Software Dillon Sarkar Dillon Sarkar
Suggestions Drew Digeser, Chris Dunn Drew Digeser, Chris Dunn
viii
Table of Contents
1.0 Introduction ...................................................................................................................................... 1
2 Background ................................................................................................................................................ 4
2.1 Wind Intro ....................................................................................................................................... 4
2.1.1 Power Density .............................................................................................................................. 5
2.1.2 Wind Speed .................................................................................................................................. 8
2.1.3 Power Coefficient ......................................................................................................................... 9
2.1.4 Tip Speed Ratio .......................................................................................................................... 10
2.2 Wind Turbine Classification .......................................................................................................... 11
2.2.1 HAWT ......................................................................................................................................... 11
2.2.2 VAWT ......................................................................................................................................... 12
2.3 The Effects of Shrouds on Vertical Axis Wind Turbines (VAWT) ................................................... 14
2.3.1 Shrouded Wind Turbines ........................................................................................................... 16
2.4 Savonius VAWT ............................................................................................................................. 17
2.5 Home Turbines .............................................................................................................................. 18
2.6 Background to WASP .................................................................................................................... 19
2.7 Mounting system .......................................................................................................................... 21
2.8 Noise and Vibrations ..................................................................................................................... 22
3. Methodology ........................................................................................................................................... 24
3.1 Background Research .................................................................................................................... 24
3.1.2 Old Projects ................................................................................................................................ 25
3.1.3 Additional Research ................................................................................................................... 25
3.2 Design turbine blade designs to test............................................................................................. 26
3.2.1 Adjustable angle S1223 airfoil design ........................................................................................ 26
3.2.2 Design of split Savonius turbine ................................................................................................. 28
3.3 Scale Model roof structure ........................................................................................................... 30
3.3.1Designing Scale Model Roof........................................................................................................ 31
3.3.2 Create experimental set up........................................................................................................ 32
3.4 Wind turbine set-up ...................................................................................................................... 32
ix
3.4.1 Generators ................................................................................................................................. 35
3.4.2 Data Acquisition ......................................................................................................................... 36
3.4.3 Power output from the generator ............................................................................................. 37
3.4.4 Perform vibrations testing on Turbine ....................................................................................... 38
3.4.5 Perform vibration testing on the scale model house ................................................................ 38
3.5 Manufacturing of turbine blades and rod..................................................................................... 40
3.5.1 Building of model house ............................................................................................................ 40
3.6 Testing ........................................................................................................................................... 41
3.6.1 Turbine testing ........................................................................................................................... 42
3.6.2 Vibration testing ........................................................................................................................ 42
3.7 Develop future design recommendations .................................................................................... 44
4 Results ...................................................................................................................................................... 45
4.1 Turbine Data.................................................................................................................................. 45
4.1.1 Use of Funnels ............................................................................................................................ 45
4.1.2 Air Foil Design ............................................................................................................................ 47
4.1.3 Turbine Results .......................................................................................................................... 47
4.2 Vibration Data ............................................................................................................................... 50
4.2.1 Vibration Analysis....................................................................................................................... 56
4.3 Wind Atlas Analysis and Application Program Results ................................................................. 59
5.0 Conclusions and Suggestions ................................................................................................................ 65
5.1 Turbine Design .............................................................................................................................. 65
5.2 Turbine Shrouds and Enclosures ................................................................................................... 67
5.3 Mounting System .......................................................................................................................... 69
5.4 WAsP and Wind Power Potential .................................................................................................. 70
5.4 Overview ....................................................................................................................................... 70
References .................................................................................................................................................. 71
1
1.0 Introduction
With populations increasing exponentially and our natural resources being strained
by increases in demand, it is more important than ever to invest in renewable energy. Our
consumption of fossil fuels as energy has been traced to be a leading cause in
environmental issues. The byproduct of fossil fuel consumption is carbon dioxide, which
has been named to be a primary constituent leading to Global Warming. The amount of
carbon dioxide that someone or something produces is known as its “carbon footprint.”
The media has been focusing on this issue and many green movements have started to try
and reduce our “carbon footprint.” (Green Student U, 2008)
There are only a few types of energy that do not produce carbon dioxide. These are
nuclear power and renewable energy sources such as wind, solar and hydro power.
Renewable energy sources are the cleanest from of these sources, because there is no
waste formed as byproducts of these sources. Nuclear energy produces nuclear waste
which could take up to but not limited to 100 years until it can be disposed of properly.
Wind turbines have been used throughout the world to generate electricity from off shore
wind farms to residential smaller scale wind turbines. (California Energy Commission,
2012)
2
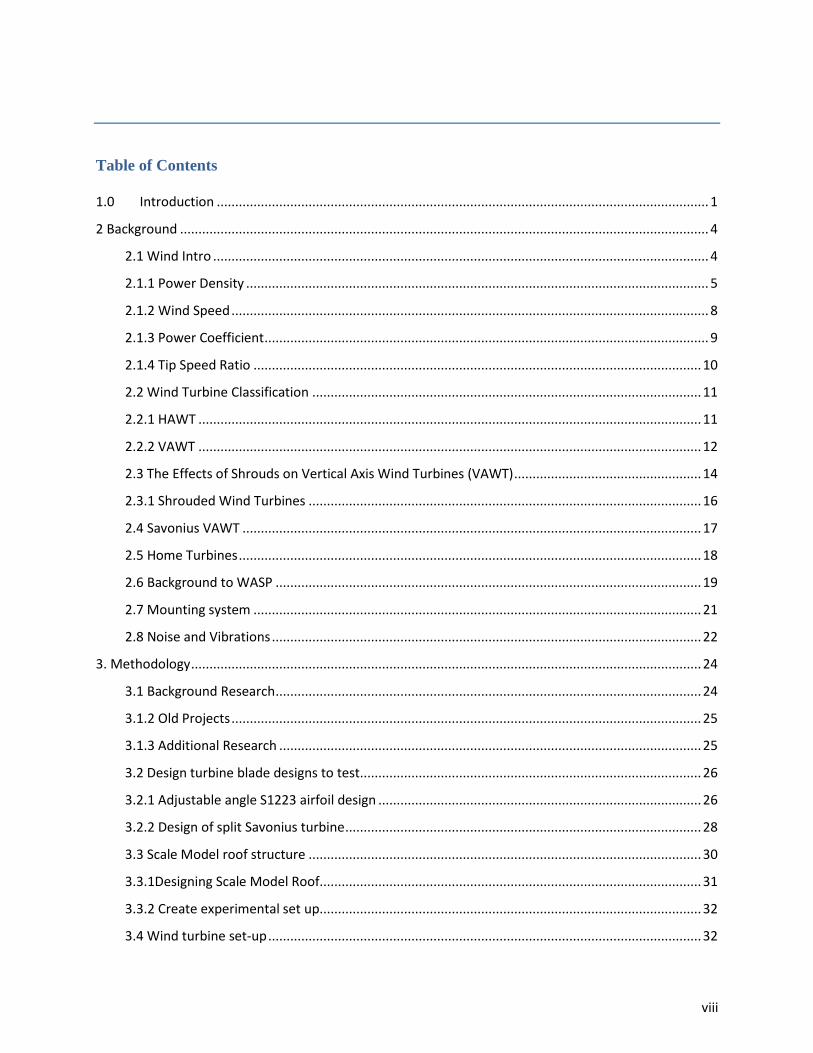
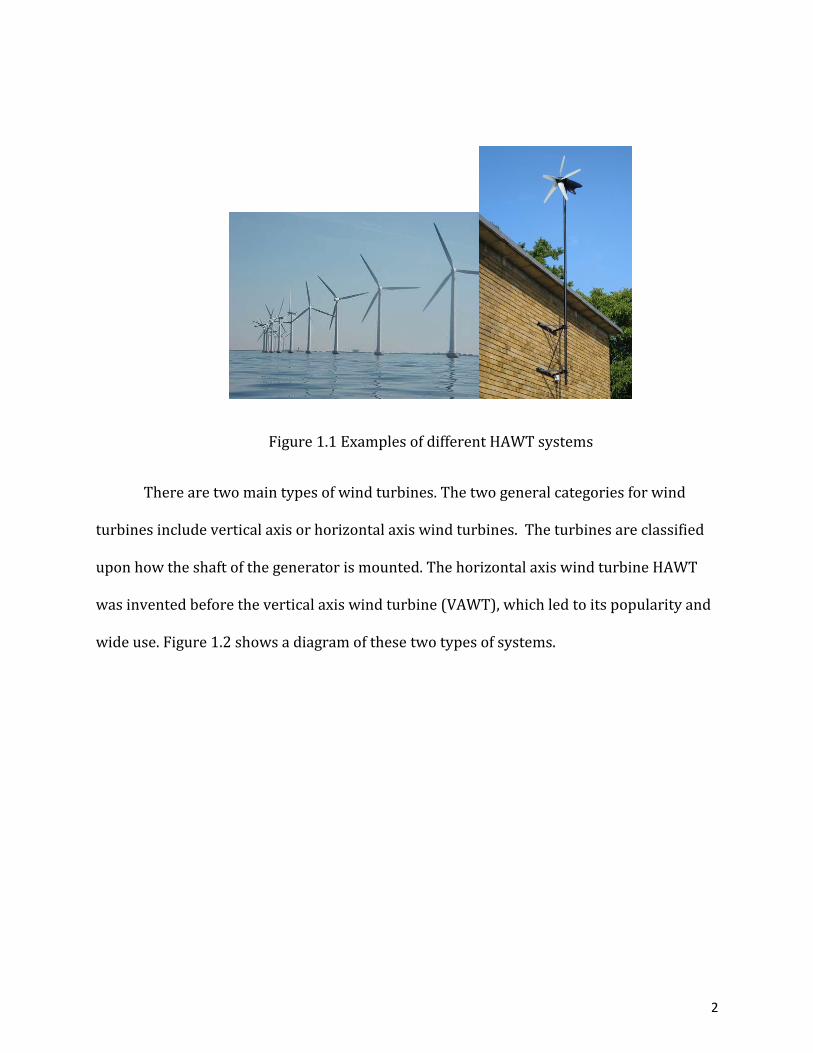
Figure 1.1 Examples of different HAWT systems
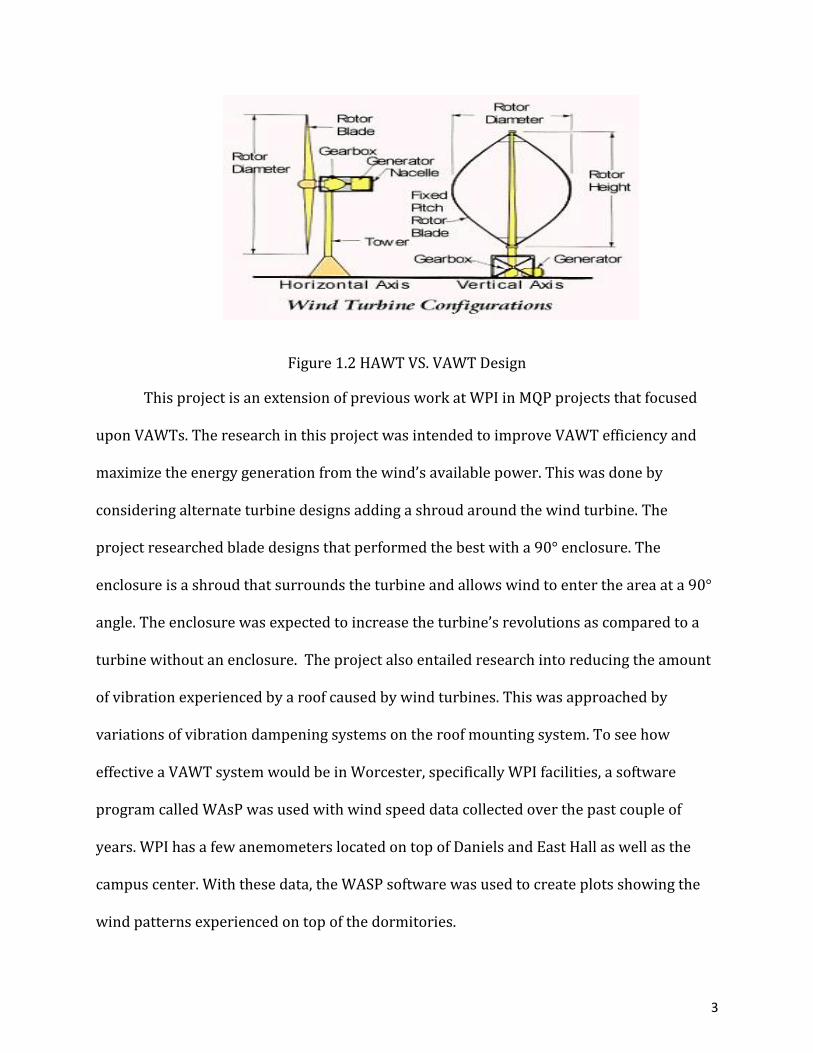
There are two main types of wind turbines. The two general categories for wind
turbines include vertical axis or horizontal axis wind turbines. The turbines are classified
upon how the shaft of the generator is mounted. The horizontal axis wind turbine HAWT
was invented before the vertical axis wind turbine (VAWT), which led to its popularity and
wide use. Figure 1.2 shows a diagram of these two types of systems.
3
Figure 1.2 HAWT VS. VAWT Design
This project is an extension of previous work at WPI in MQP projects that focused
upon VAWTs. The research in this project was intended to improve VAWT efficiency and
maximize the energy generation from the wind’s available power. This was done by
considering alternate turbine designs adding a shroud around the wind turbine. The
project researched blade designs that performed the best with a 90° enclosure. The
enclosure is a shroud that surrounds the turbine and allows wind to enter the area at a 90°
angle. The enclosure was expected to increase the turbine’s revolutions as compared to a
turbine without an enclosure. The project also entailed research into reducing the amount
of vibration experienced by a roof caused by wind turbines. This was approached by
variations of vibration dampening systems on the roof mounting system. To see how
effective a VAWT system would be in Worcester, specifically WPI facilities, a software
program called WAsP was used with wind speed data collected over the past couple of
years. WPI has a few anemometers located on top of Daniels and East Hall as well as the
campus center. With these data, the WASP software was used to create plots showing the
wind patterns experienced on top of the dormitories.
4
2 Background
As world population and standards of living increase there is an ever growing
demand for energy. This increase in energy creates significant demand for energy created
by fossil fuels, which the world has a limited amount of and carbon emissions can lead to
global warming. The fears of diminishing natural resources and concern of significant
climate change as a result of the burning of fossil fuels has created great worldwide interest
in clean renewable energy that can meet the electrical demands of the world. One common
strategy is to use wind turbines that generate electricity from wind.
2.1 Wind Intro
Wind is generated from solar energy unevenly heating the earth. This uneven
heating creates pressure changes in the atmosphere, generating wind. This wind can then
be harnessed by a wind turbine. As the wind pushes the blades of a turbine, a generator
attached to the axis of the shaft and when spun creates electricity that can be sent to the
grid and used in households for electricity. (windies.gov, 2012)
Wind turbines are a clean way to generate power, yet there are many significant
problems with them as well. One problem is that they are extremely expensive to design
and install, and in order to generate enough energy for communities and cities require
space for wind farms. Another issue is that they have to be created in locations where there
is enough wind energy to generate enough electricity to justify the cost of the machine.
(windies.gov, 2012)
5
2.1.1 Power Density
Geography can greatly effect wind speed, and in effect the power from the wind.
Knowing this information prior to setting up a wind turbine is imperative. Calculating the
average power from wind is a simple equation:
AVP 3
2
1 Equation 1
Equation 1 indicates the importance of wind speed in power generation because power
generation increases proportionally as wind increases to the third power. Knowing the
power density will allow wind turbines to be placed in efficient locations for generating
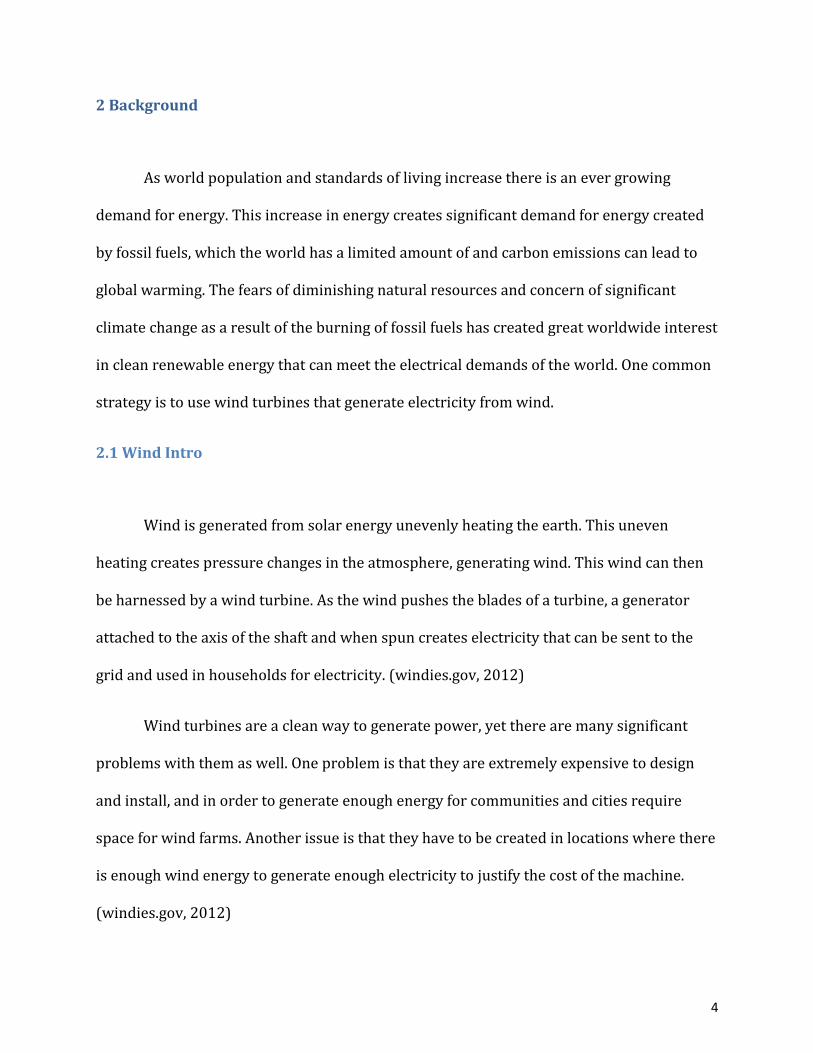
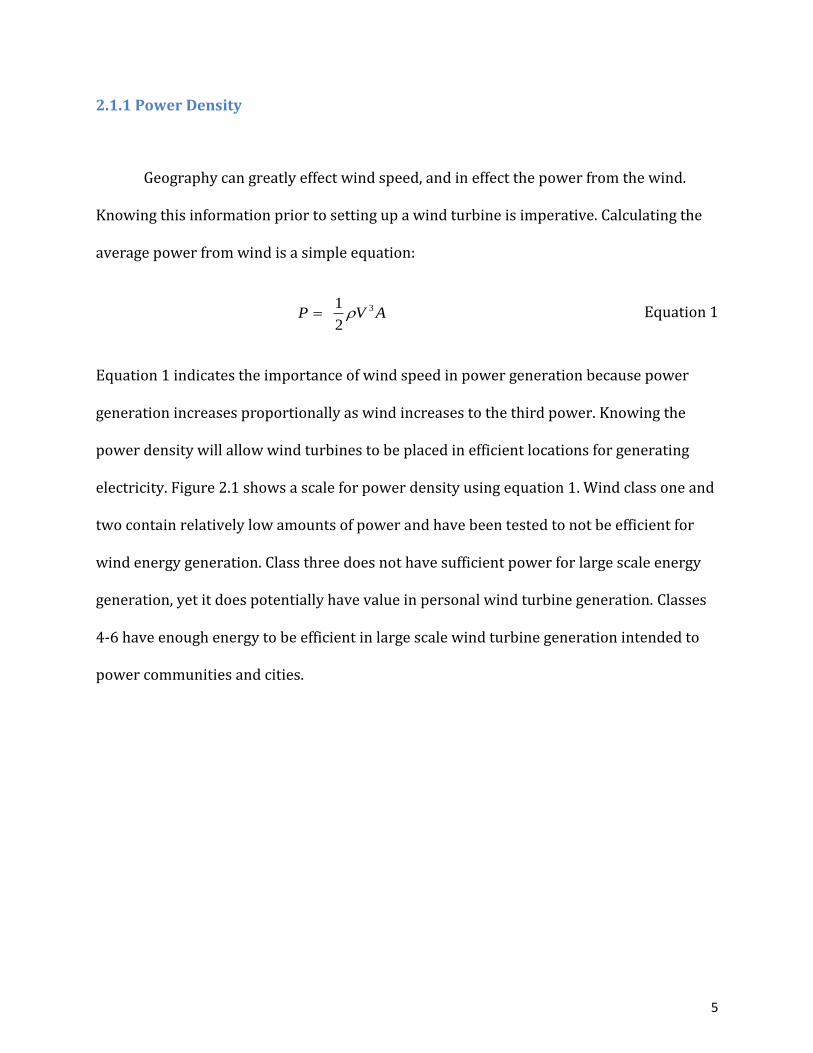
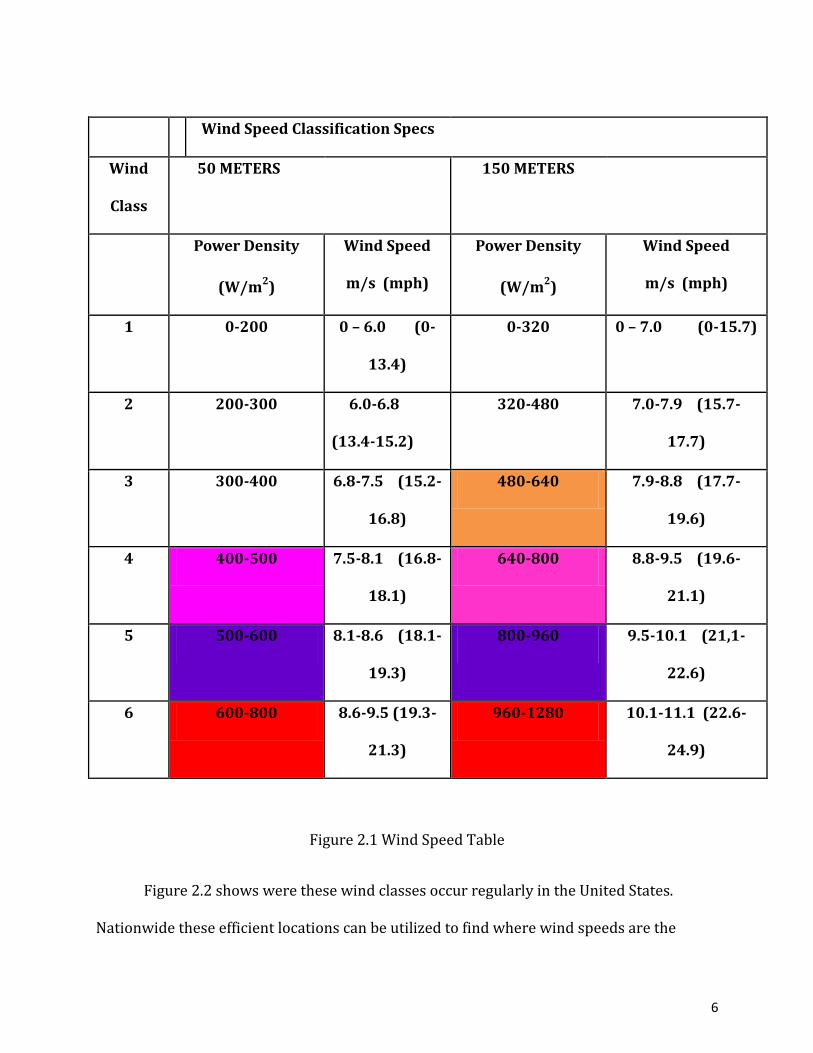
electricity. Figure 2.1 shows a scale for power density using equation 1. Wind class one and
two contain relatively low amounts of power and have been tested to not be efficient for
wind energy generation. Class three does not have sufficient power for large scale energy
generation, yet it does potentially have value in personal wind turbine generation. Classes
4-6 have enough energy to be efficient in large scale wind turbine generation intended to
power communities and cities.
6
Figure 2.1 Wind Speed Table
Figure 2.2 shows were these wind classes occur regularly in the United States.
Nationwide these efficient locations can be utilized to find where wind speeds are the
Wind Speed Classification Specs
Wind
Class
50 METERS
150 METERS
Power Density
(W/m2)
Wind Speed
m/s (mph)
Power Density
(W/m2)
Wind Speed
m/s (mph)
1 0-200 0 – 6.0 (0-
13.4)
0-320 0 – 7.0 (0-15.7)
2 200-300 6.0-6.8
(13.4-15.2)
320-480 7.0-7.9 (15.7-
17.7)
3 300-400 6.8-7.5 (15.2-
16.8)
480-640 7.9-8.8 (17.7-
19.6)
4 400-500 7.5-8.1 (16.8-
18.1)
640-800 8.8-9.5 (19.6-
21.1)
5 500-600 8.1-8.6 (18.1-
19.3)
800-960 9.5-10.1 (21,1-
22.6)
6 600-800 8.6-9.5 (19.3-
21.3)
960-1280 10.1-11.1 (22.6-
24.9)
7
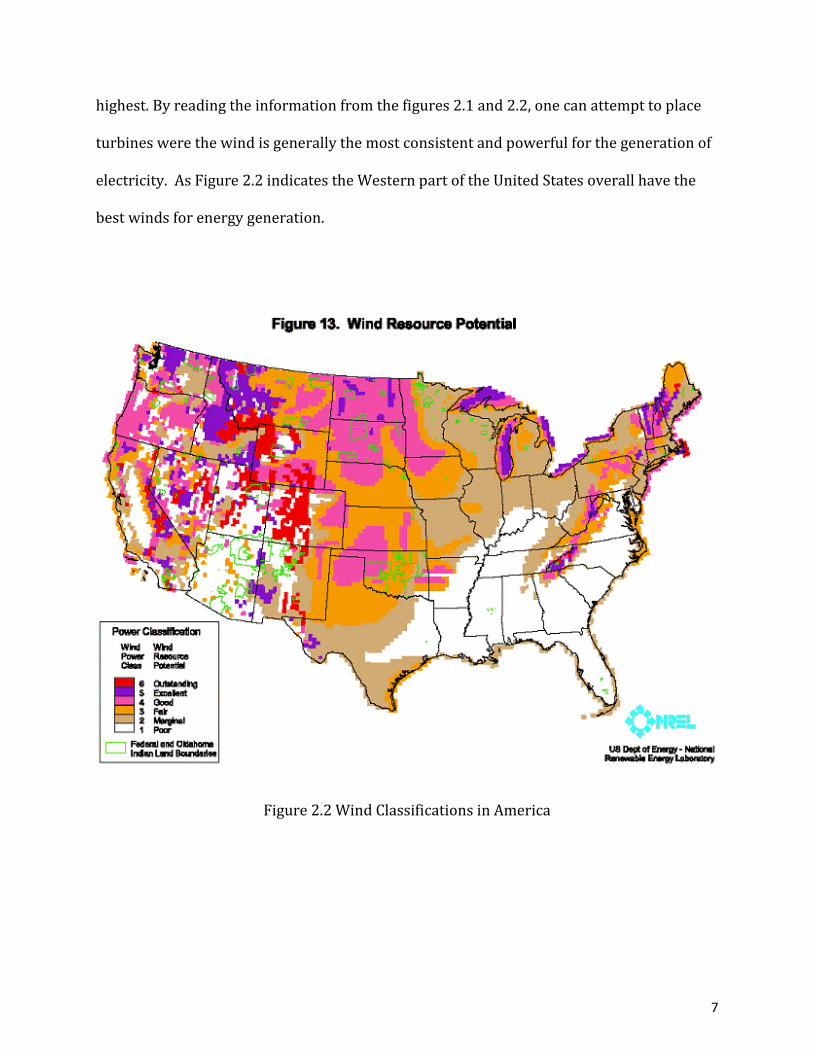
highest. By reading the information from the figures 2.1 and 2.2, one can attempt to place
turbines were the wind is generally the most consistent and powerful for the generation of
electricity. As Figure 2.2 indicates the Western part of the United States overall have the
best winds for energy generation.
Figure 2.2 Wind Classifications in America
8
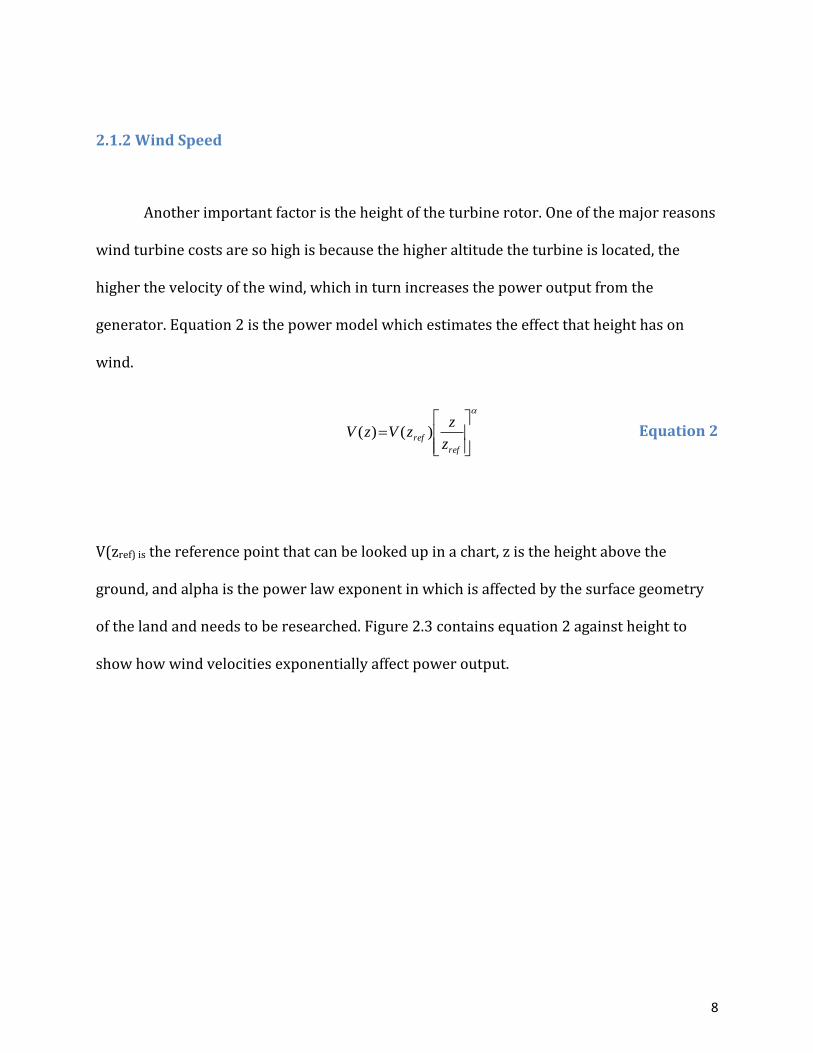
2.1.2 Wind Speed
Another important factor is the height of the turbine rotor. One of the major reasons
wind turbine costs are so high is because the higher altitude the turbine is located, the
higher the velocity of the wind, which in turn increases the power output from the
generator. Equation 2 is the power model which estimates the effect that height has on
wind.
ref
refz
zzVzV )()( Equation 2
V(zref) is the reference point that can be looked up in a chart, z is the height above the
ground, and alpha is the power law exponent in which is affected by the surface geometry
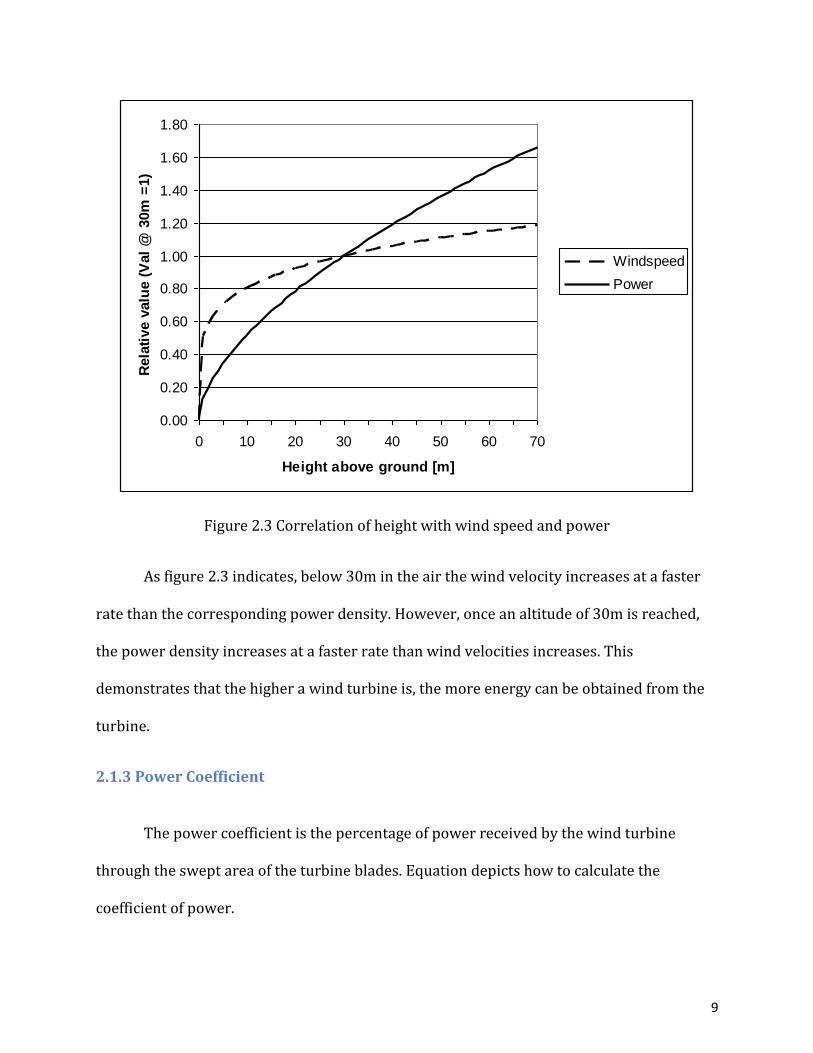
of the land and needs to be researched. Figure 2.3 contains equation 2 against height to
show how wind velocities exponentially affect power output.
9
Figure 2.3 Correlation of height with wind speed and power
As figure 2.3 indicates, below 30m in the air the wind velocity increases at a faster
rate than the corresponding power density. However, once an altitude of 30m is reached,
the power density increases at a faster rate than wind velocities increases. This
demonstrates that the higher a wind turbine is, the more energy can be obtained from the
turbine.
2.1.3 Power Coefficient
The power coefficient is the percentage of power received by the wind turbine
through the swept area of the turbine blades. Equation depicts how to calculate the
coefficient of power.
0.00
0.20
0.40
0.60
0.80
1.00
1.20
1.40
1.60
1.80
0 10 20 30 40 50 60 70
Height above ground [m]
Rela
tive v
alu
e (
Val
@ 3
0m
=1)
Windspeed
Power
10
u
t
u
tP
V
V
V
VC 14
2
2
Equation 3
In equation 3, Vu is the velocity of the wind as it approaches the wind turbine and Vt
is the velocity of the wind as it passes through the swept area of the wind turbine blades.
The maximum theoretically possible coefficient of power is called the Betz limit which is
0.593. Most current turbines today have a power coefficient between 0.3 and 0.4.
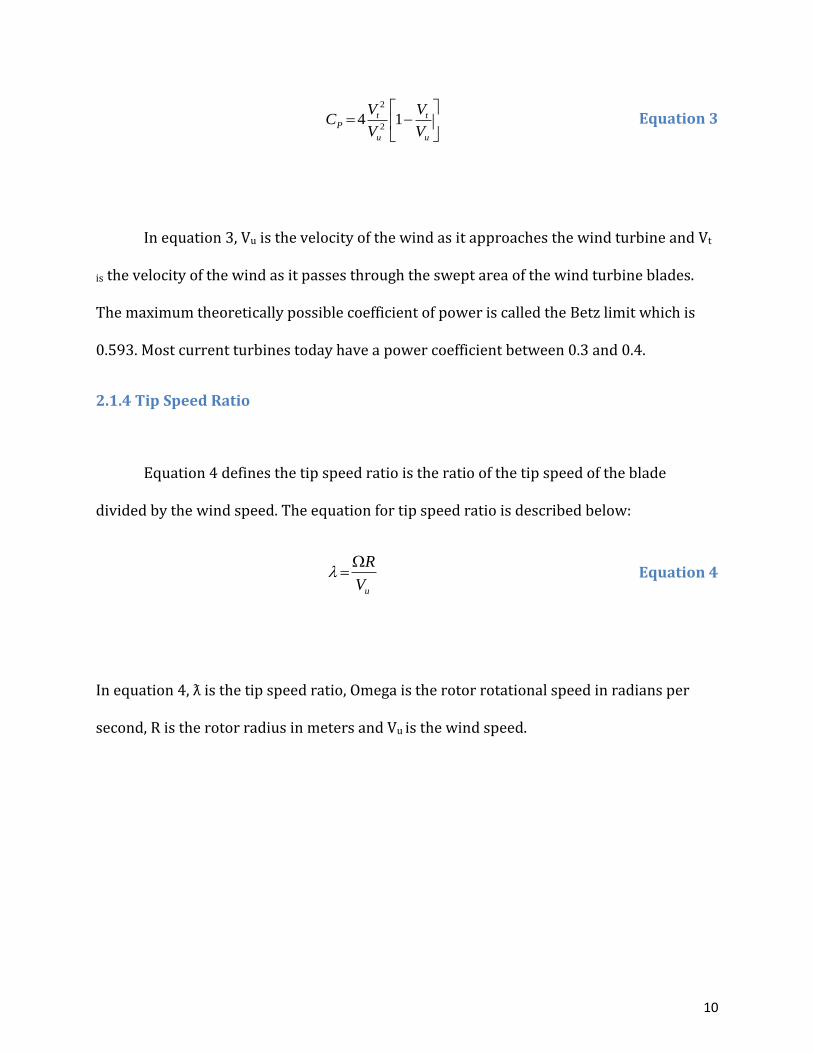
2.1.4 Tip Speed Ratio
Equation 4 defines the tip speed ratio is the ratio of the tip speed of the blade
divided by the wind speed. The equation for tip speed ratio is described below:
uV
R Equation 4
In equation 4, ƛ is the tip speed ratio, Omega is the rotor rotational speed in radians per
second, R is the rotor radius in meters and Vu is the wind speed.
11
2.2 Wind Turbine Classification
The two major classifications of wind turbines are horizontal and vertical axis wind
turbines, (HAWT and VAWT). The horizontal axis wind turbines are the most common and
have blades rotate on an axis parallel to the ground.
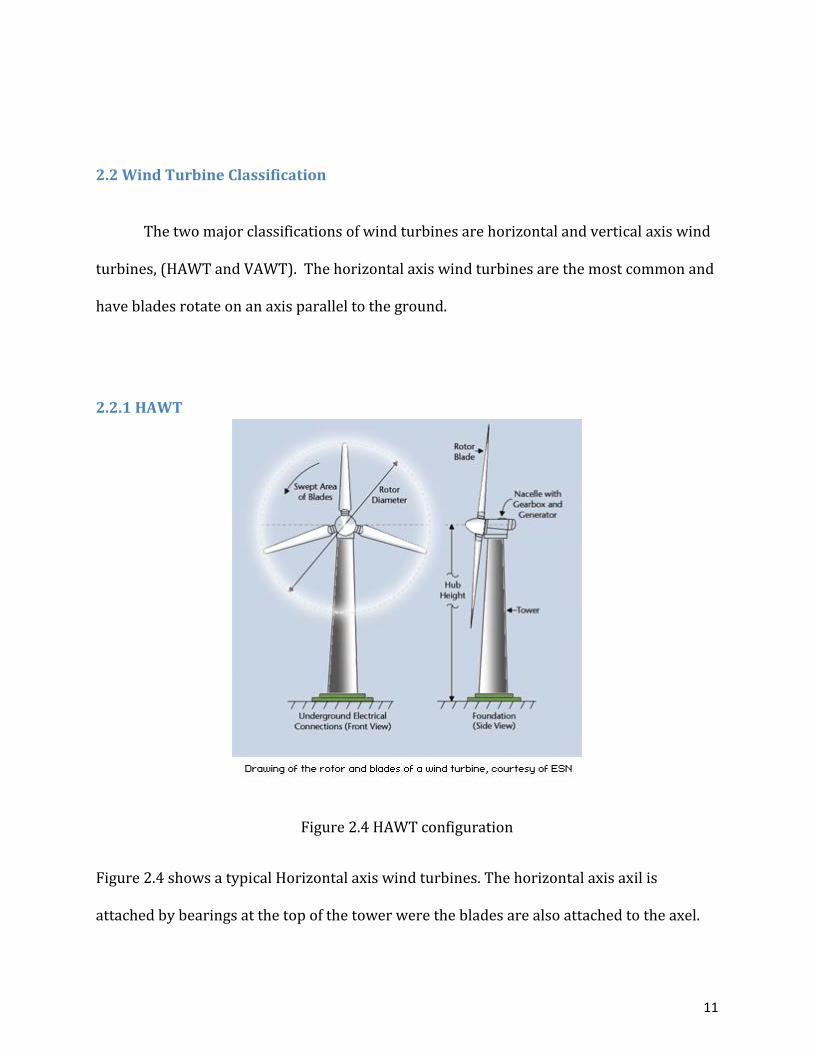
2.2.1 HAWT
Figure 2.4 HAWT configuration
Figure 2.4 shows a typical Horizontal axis wind turbines. The horizontal axis axil is
attached by bearings at the top of the tower were the blades are also attached to the axel.
12
The axil is enclosed in a nacelle. The nacelle is where the gearbox and generator are
located. Horizontal axis wind turbines utilize airfoil design to generate the spinning of the
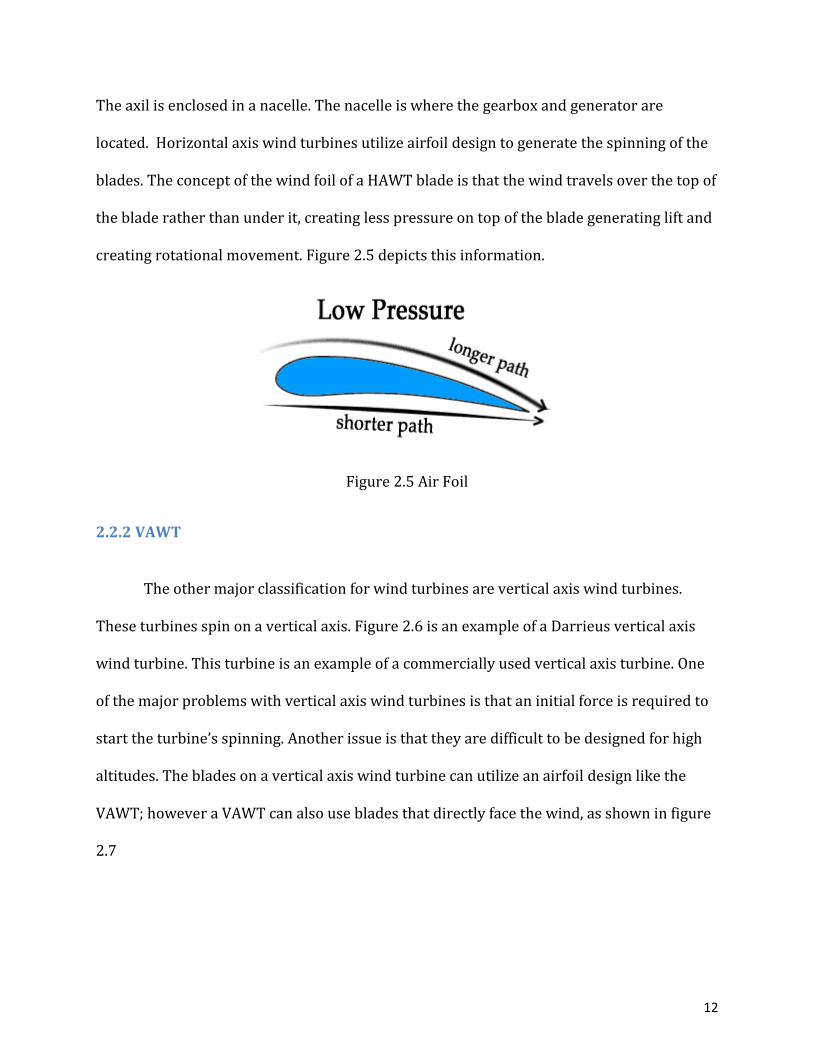
blades. The concept of the wind foil of a HAWT blade is that the wind travels over the top of
the blade rather than under it, creating less pressure on top of the blade generating lift and
creating rotational movement. Figure 2.5 depicts this information.
Figure 2.5 Air Foil
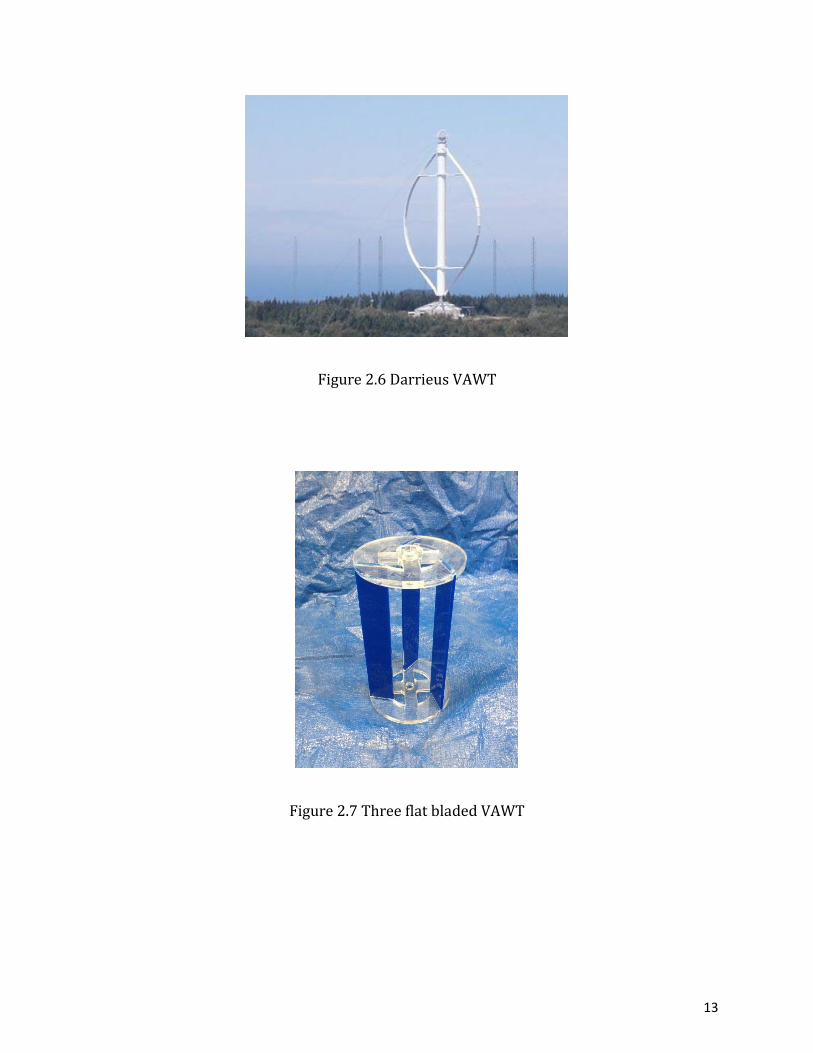
2.2.2 VAWT
The other major classification for wind turbines are vertical axis wind turbines.
These turbines spin on a vertical axis. Figure 2.6 is an example of a Darrieus vertical axis
wind turbine. This turbine is an example of a commercially used vertical axis turbine. One
of the major problems with vertical axis wind turbines is that an initial force is required to
start the turbine’s spinning. Another issue is that they are difficult to be designed for high
altitudes. The blades on a vertical axis wind turbine can utilize an airfoil design like the
VAWT; however a VAWT can also use blades that directly face the wind, as shown in figure
2.7
13
Figure 2.6 Darrieus VAWT
Figure 2.7 Three flat bladed VAWT
14
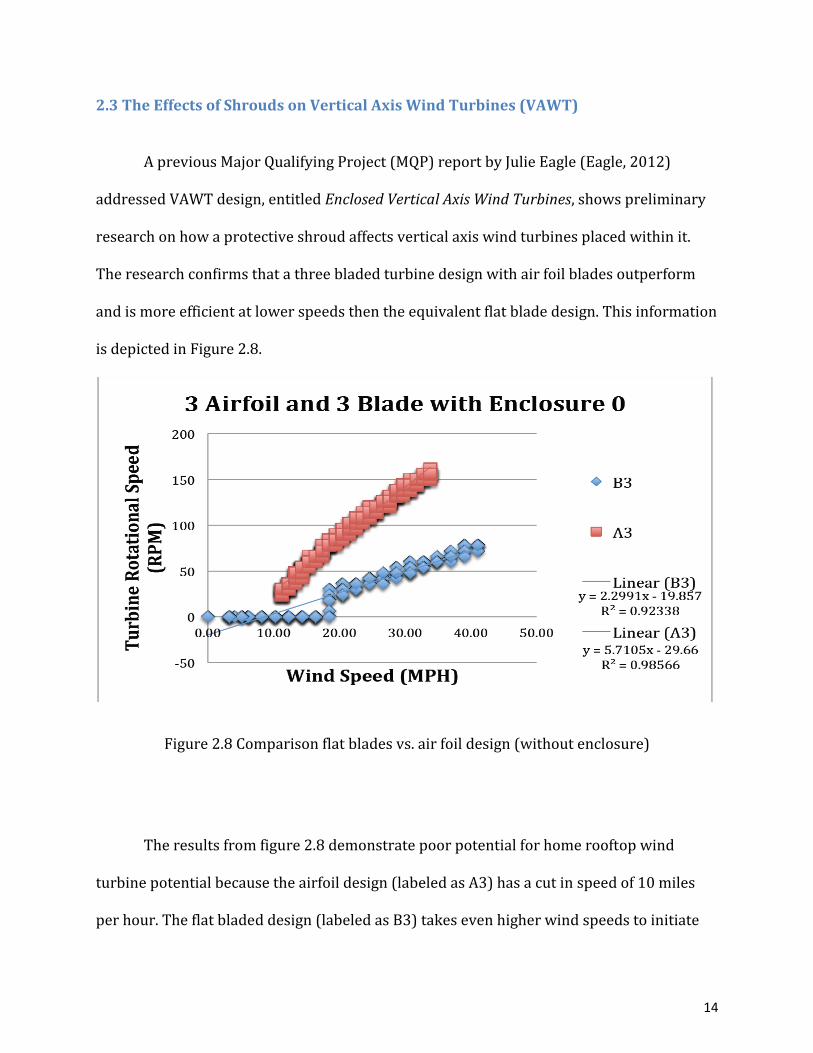
2.3 The Effects of Shrouds on Vertical Axis Wind Turbines (VAWT)
A previous Major Qualifying Project (MQP) report by Julie Eagle (Eagle, 2012)
addressed VAWT design, entitled Enclosed Vertical Axis Wind Turbines, shows preliminary
research on how a protective shroud affects vertical axis wind turbines placed within it.
The research confirms that a three bladed turbine design with air foil blades outperform
and is more efficient at lower speeds then the equivalent flat blade design. This information
is depicted in Figure 2.8.
Figure 2.8 Comparison flat blades vs. air foil design (without enclosure)
The results from figure 2.8 demonstrate poor potential for home rooftop wind
turbine potential because the airfoil design (labeled as A3) has a cut in speed of 10 miles
per hour. The flat bladed design (labeled as B3) takes even higher wind speeds to initiate
15
spinning with a cut in wind speed of 20 miles per hour. The reason these results are poor
for a rooftop wind turbine is because in Massachusetts the estimated wind speed that will
approach a rooftop wind turbine is 6.24 miles per hour indicating that neither of these
designs can be expected to generate significant amounts of energy throughout the year. The
results also do not indicate their real performance because there was no load put on the
turbine system, such as a generator. The wind speeds indicated to spin the turbine are
much lower than actual wind speeds required to rotate a turbine with generator.
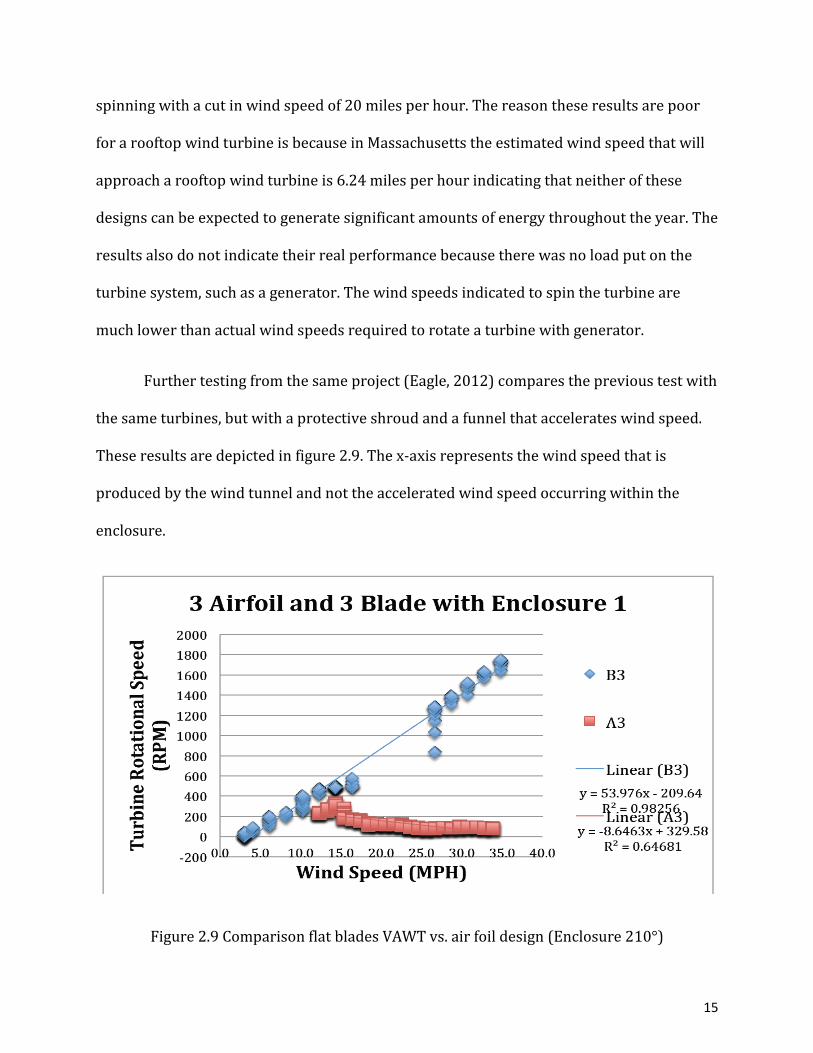
Further testing from the same project (Eagle, 2012) compares the previous test with
the same turbines, but with a protective shroud and a funnel that accelerates wind speed.
These results are depicted in figure 2.9. The x-axis represents the wind speed that is
produced by the wind tunnel and not the accelerated wind speed occurring within the
enclosure.
Figure 2.9 Comparison flat blades VAWT vs. air foil design (Enclosure 210°)
16
The results in figures 2.8 and 2.9, from Julie Eagles report, primarily indicate that
funneling wind into an enclosure increases the rotation rate of the turbines significantly.
This leads to a promising potential for vertical axis rooftop wind turbines. An unexpected
result from this test is that the flat bladed design (B3) performed better than the airfoil
design (A3) in this test. This is very surprising because without the funnel and shroud the
airfoil design performed better than the flat bladed design.
Similarly during the test shown in figure 2.8, the airfoil design had a cut in speed
around 10 miles per hour in the test depicted in figure 2.9. However, the design peaked at
about 15 miles per hour and had a decrease in its rotation rate as speed increased
thereafter. This still leaves these VAWTs at below performance levels for the wind speed
expected on roof tops in the Worcester area. The flat bladed design performed better than
expected and outperformed the airfoil design in this test. The decrease in speed was at
about 2.5 miles per hour which is below the expected wind speed the product would
encounter. The results are also encouraging because at 6.24 miles per hour the flat bladed
design had a similar rotation rate to the airfoil designs without a shroud at over 35 miles
per hour. Again, this is without a load attached so we can expect when attaching a load that
the rotation rate will decrease as a resistance is applied.
2.3.1 Shrouded Wind Turbines
Currently there is not much research about how a shroud will affect a vertical axis
wind turbine. Still, the funneled shroud concept has been used since the 1920’s for
horizontal axis wind turbines. While there is supporting facts that a funneled shroud does
increase airspeed to the turbine, it does also increase the size, weight, and cost of the
17
project. These negative factors deter large wind turbines from having a funnel, as well as
the fact that none have been commercially used that can compete with a modern 3 bladed
horizontal axis wind turbine. However, current research shows a promising future for
shrouded horizontal axis wind turbines with some currently being tested with claims of a
2-5 times increase in power generation in comparison to similarly sized non shrouded
horizontal axis wind turbines.
2.4 Savonius VAWT
The Savonius VAWT design was created by Finnish inventor S.J. Savonius in the
1920’s. The design utilizes an open overlapping two half cup designs that is very beneficial
to wind turbine design. Some of the most appealing benefits of the Savonius design are it
simple and cheap to construct, it has low noise and angular velocity when in use, and it can
accept wind from any direction and can withstand extreme weather conditions without
significant damage. In addition there are multiple variations to the design that change the
performance of the turbine depending on blade configuration. According to Dept. of
Mechanical Engineering at IIT, a split Savonius has a coefficient of power of 0 .35
compared with the simple two half cup design with a coefficient of Power of 0 .15. (Saha,
2008)
Some of the disadvantages of the Savonius design are that the turbine is not a very
stable design. Large scale models of a Savonius are not applicable because the design is not
sturdy enough to handle the heavier weight of the turbine blades for large sizes. Some
additional facts that should be considered when using a Savonius design are that they are

18
most effective at lower speeds rather than high speeds and they can operate in turbulent
winds.
2.5 Home Turbines
Home wind turbines are a relatively new field that companies are looking to
examine. Currently home turbines that can be mounted on the roof of a house are too
expensive and do not generate enough electricity to break even over the machines
expected lifetime. What many companies are currently researching is a way to reduce the
price of personal wind turbines to make it marketable to the average citizen who is on the
grid and is not willing to lose money on a wind turbine just to benefit the environment.
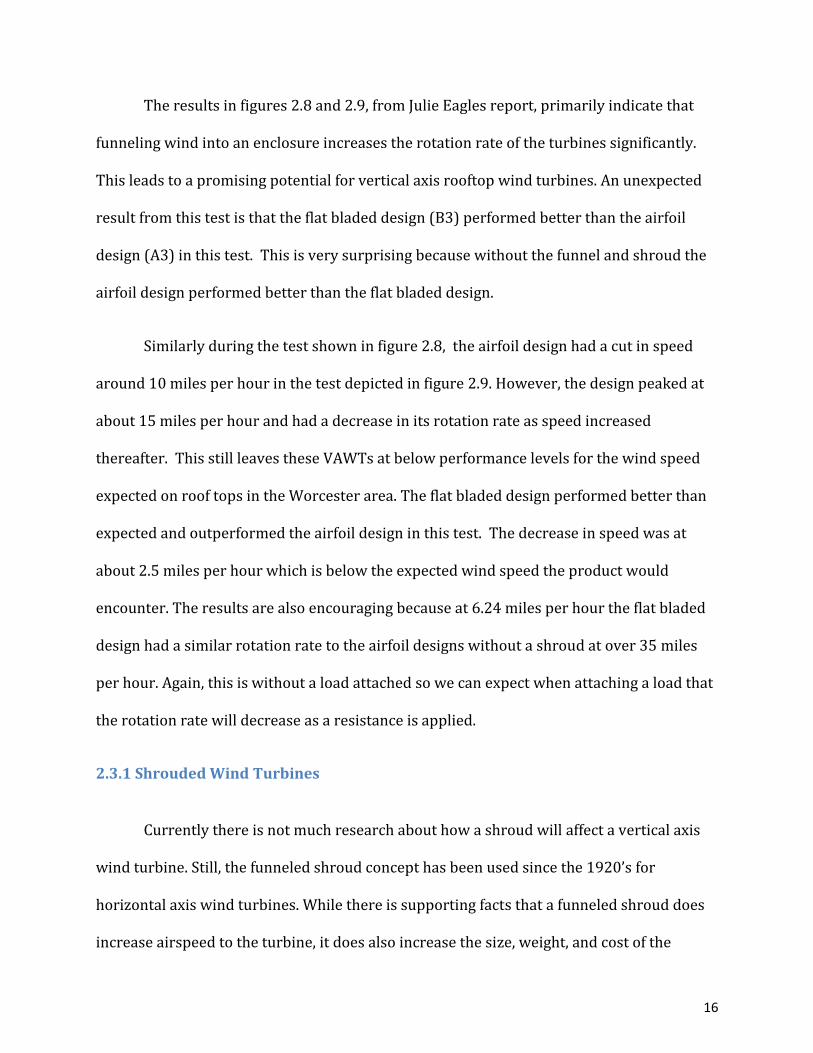
An example of a home wind turbine is the Bergey 1KW system that has an initial
cost of about $6,000 and a 20 year lifespan. An independent study concluded that this
system will on average generate 100KW hours a month. At this rate the citizen using the
system is essentially paying 26 cents a KW over the course of the 20 years of the system
which is more expensive than just purchasing electricity from the grid. The average
household uses about 11,500 KWh a month (eia.gov, 2012), so this system would only
generate 1/12th of the average household system. Even Bergeys 10 KW system with wind
speeds at 10mph only generates about 30,000 KWh a year at a much higher initial cost.
19
Figure 2.11 Bergey 1 KW System
There are personal wind turbines that can be attached to a tower in a yard that are
cost effective, but they require land space and permits. In many towns and urban
communities land space and permits are not an option. (Popular Mechanics, 2009)Placing
wind turbines on roofs is the solution to most permit and space issues. However, like the
Bergey described above, they are not cost efficient and have other issues, this is why only
1% of personal wind turbines have been mounted on roofs. Some of the non-cost related
issues of turbines mounted on roofs are vibrations leading to structural damage of the roof
and noise that bothers occupants in the house. Solving these issues is the future goal for
personal home wind turbine designs.
2.6 Background to WASP
WASP is a PC-program for the vertical and horizontal calculation of wind climate
statistics. It contains different models to describe the wind flow over different areas and
terrains.

20
Analysis of raw data was mainly used in this project. This option enables an analysis
of any time-series of wind measurements to provide a statistical summary of the observed,
site-specific wind climate. This part is implemented in separate software tools: the
Observed Wind Climate (OWC) Wizard and the WAsP Climate Analyst. This part of the
program was a vital part for our research on wind patterns around our campus sites.
This program is mainly for predicting wind climates, wind resources, and power
productions from wind turbines and wind farms. The predictions are based on wind data
measured at meteorological stations in the same region. The program includes a complex
terrain flow model, a roughness change model, a model for sheltering obstacles, and a wake
model. The software package further contains a Climate Analyst for creating the wind-
climatological inputs, a Map Editor for creating and editing the topographical inputs, and a
Turbine Editor for creating the wind turbine inputs to WAsP. The fundamentals of WAsP
and the wind atlas methodology are described in the European Wind Atlas. WAsP is
developed and distributed by the Department of Wind Energy at the Technical University
of Denmark, Denmark as shown in figure 2.12.
21
Figure 2.12 WAsP Climate Analyst
2.7 Mounting system
The most common method for a mounting structure for wind turbines is a
monopole design. This consists of some sort of base, usually concrete, with a steel
structured pole that extends to the owners desired height. As the progression of turbines
has grown there has been desire for roof mounted systems. These roof mounted systems
have not had the amount of research as the traditional monopole design. As the growth of
roof mounted turbines rises there is an urge to design out the flaws that has been
shadowing previous roof mounted systems.
22
2.8 Noise and Vibrations
Wind turbines can create a constant humming noise that is considered an
annoyance as well as produce vibrations that over time can ruin the integrity of a roof. This
has hindered the popularity of consumers wanting to have wind turbines mounted to their
roof. This has limited wind turbines to be mounted on poles next to houses but many city
ordnance laws prohibit this in residential areas. As a wind turbine is spinning and
producing electricity it creates a constant vibration. This constant vibration can damage the
shingles around the base as well as damage the trusses around the area where they are
mounted. These vibrations are very difficult to prevent, so it is important to have a
mounting system that will disperse the vibrations before reaching the actual structure of
the house. Many roofing companies do not put a warrantee on the roof if there is a wind
turbine due to the result of the vibrations. . This will dissuade a consumer away from
having a wind turbine mounted on the roof. Another issue that dissuades a consumer from
using wind turbines is the constant humming noise produced when a turbine is generating
electricity. A VAWT as opposed to a horizontal axis turbine does not produce as much noise
as the traditional turbines due to design differences of the turbines as well as the path of
motion of the blade. Another reason that VAWT are more for residential areas is their
ability to operate at peak efficiency with turbulence that is produced by roof contours.
When wind is traveling over roof peaks and different slopes of roofs they produce a
turbulent wind pattern that actually disrupts horizontal axis turbines from producing
electricity. This turbulent wind pattern caused by roof peaks does not disrupt the
functioning of VAWTs, as well as produce as loud of noise compared to HAWT systems.
23
The rise in popularity of roof mounted VAWTs is opening research into a way to
eliminate harmful vibrations from turbines that cause roof damage. This project goes into
solving and improving the flaws of roof mounting systems as well as improvements to the
overall design of the VAWT blade design in methodical steps that can be seen in the next
chapter.
24
3. Methodology
The goal of this project was to design a vertical axis wind turbine (VAWT) that could
generate power under relatively low wind velocities. To accomplish this goal, the
objectives were to (1) analyze how different geometry of the wind turbines within various
enclosures affect wind turbine power output (2) test how the vibrations caused from the
rotations of the wind turbine affect the structural integrity of various aspects housing
structures, and (3) compare the operation of VAWTs that are directly placed in the wind
with VAWTs that placed within an enclosure.
To meet these objectives, the tasks were to:
-Complete background research on wind turbine data
-Design turbine blade designs for testing
- Design model roof structure
-Create experimental set up
-Manufacture parts and build model house
-Develop future design recommendations
3.1 Background Research
Background research included reviewing a previous project, Enclosed Vertical Axis
Wind Turbines, by Julie Eagle, which provided a foundation for the current project. Using
that information, we then studied new areas in order to complete our research.
25
3.1.2 Old Projects
Analyzing previous research allowed us to determine that the use of a funneled
shroud allowed the vertical axis wind turbine had higher potential to generate more energy
than a vertical axis wind turbine without a shroud. The tests also demonstrated that airfoil
designs potentially do not perform as well as flat bladed designs perform in the enclosure.
The reports indicate that flat bladed designs perform poorly in non-enclosed
situations but they have increased performance in enclosures. The report test results state
that the flat bladed designs enclosed in 90° shroud perform better than airfoil designs in
the 90° enclosure and they also outperform the airfoil design without a shroud.
3.1.3 Additional Research
Research started with basic aerodynamic principles and different blade designs that
have potential to work effectively in an enclosure. Research showed that aerodynamically
efficient blades have great potential to work for a vertical axis wind turbine. (Ponta, Otero,
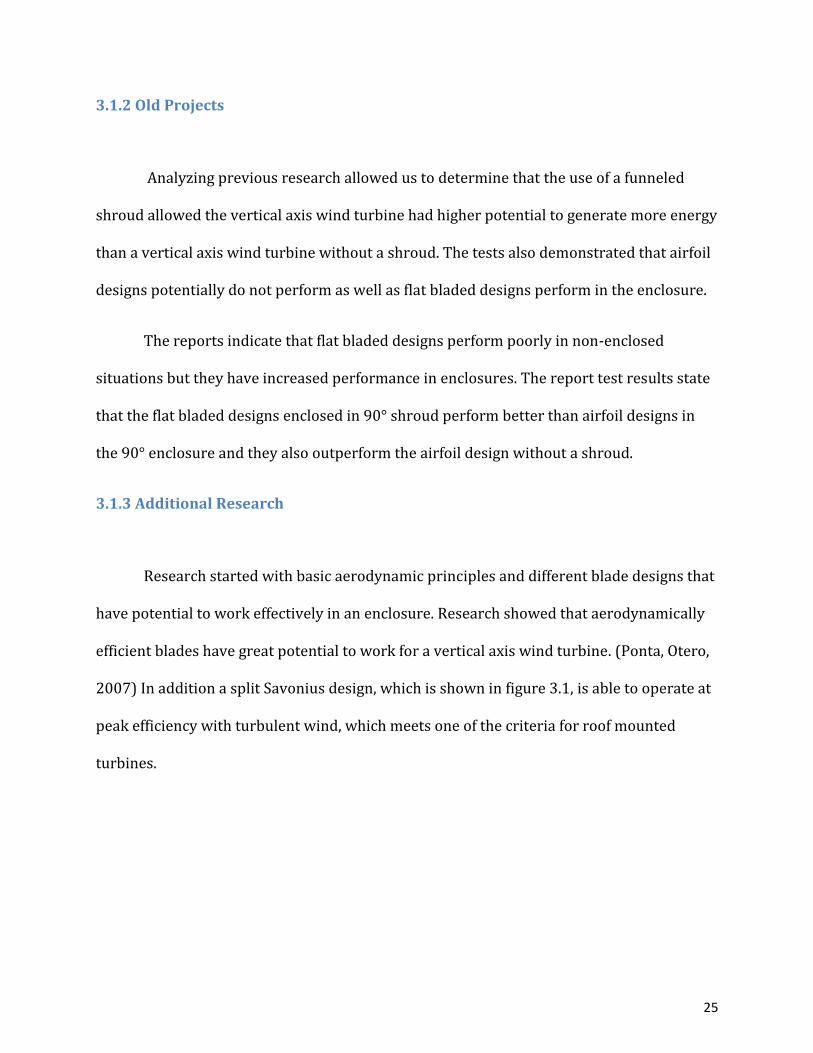
2007) In addition a split Savonius design, which is shown in figure 3.1, is able to operate at
peak efficiency with turbulent wind, which meets one of the criteria for roof mounted
turbines.
26
Figure 3.1 Split Savonius top view
3.2 Design turbine blade designs to test
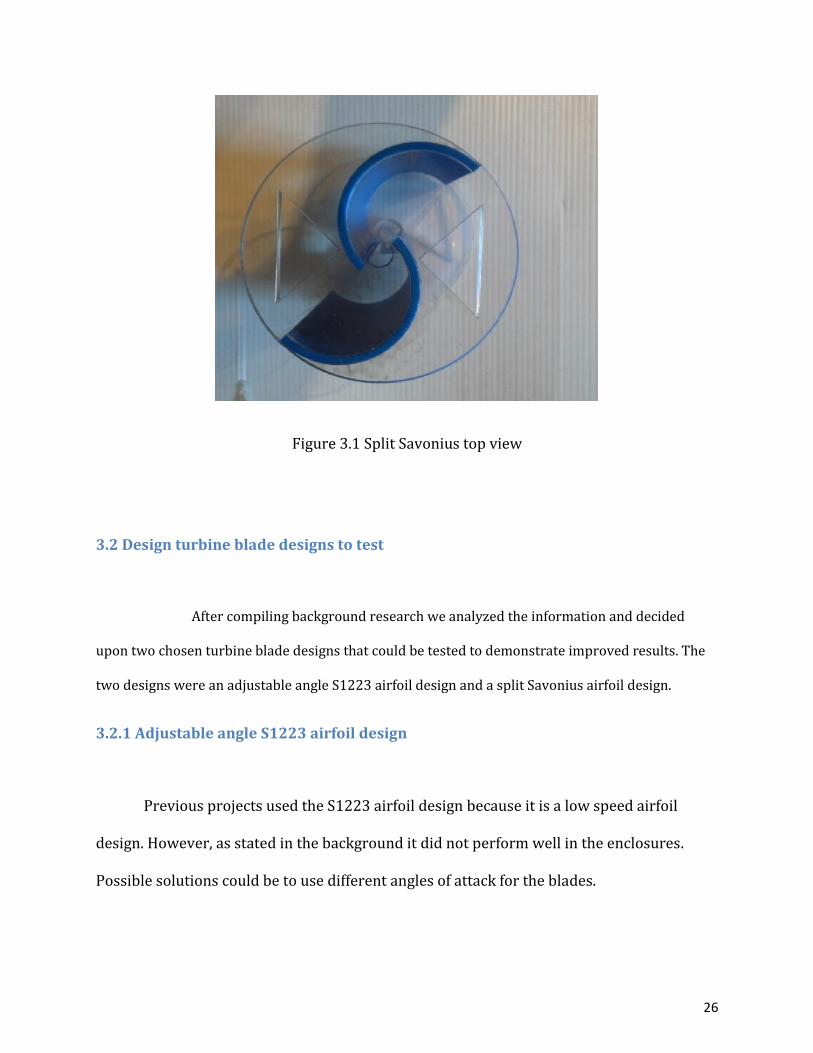
After compiling background research we analyzed the information and decided
upon two chosen turbine blade designs that could be tested to demonstrate improved results. The
two designs were an adjustable angle S1223 airfoil design and a split Savonius airfoil design.
3.2.1 Adjustable angle S1223 airfoil design
Previous projects used the S1223 airfoil design because it is a low speed airfoil
design. However, as stated in the background it did not perform well in the enclosures.
Possible solutions could be to use different angles of attack for the blades.
27
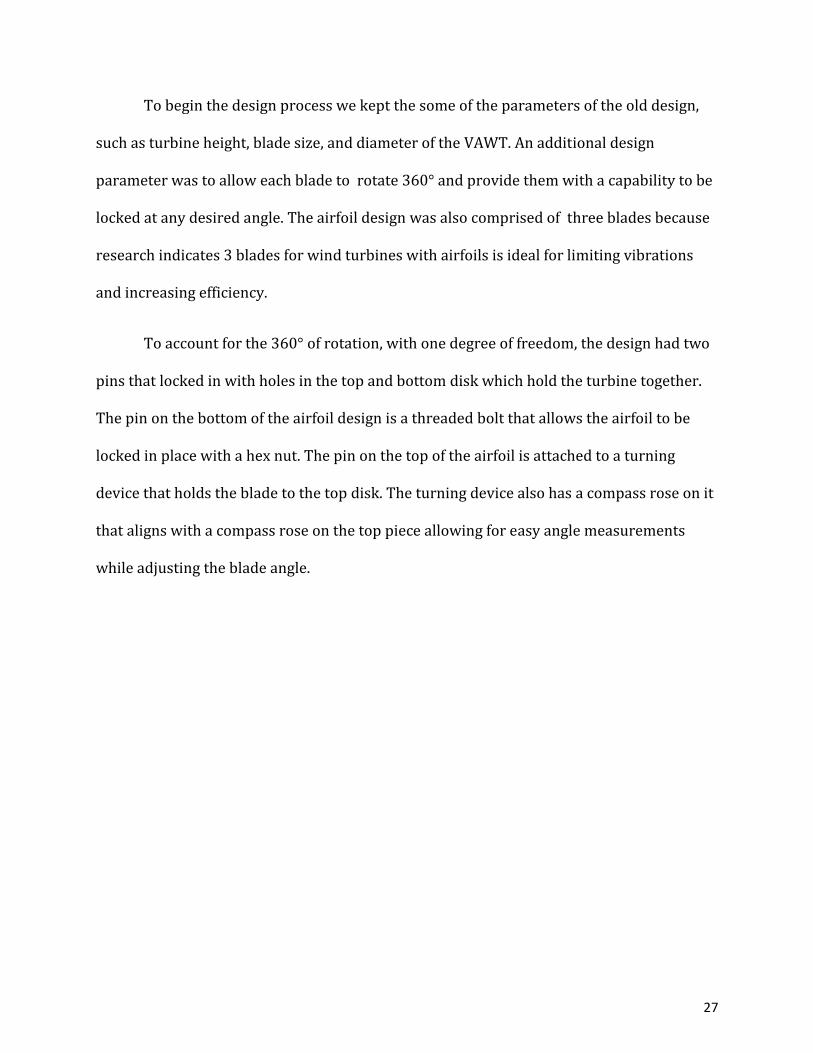
To begin the design process we kept the some of the parameters of the old design,
such as turbine height, blade size, and diameter of the VAWT. An additional design
parameter was to allow each blade to rotate 360° and provide them with a capability to be
locked at any desired angle. The airfoil design was also comprised of three blades because
research indicates 3 blades for wind turbines with airfoils is ideal for limiting vibrations
and increasing efficiency.
To account for the 360° of rotation, with one degree of freedom, the design had two
pins that locked in with holes in the top and bottom disk which hold the turbine together.
The pin on the bottom of the airfoil design is a threaded bolt that allows the airfoil to be
locked in place with a hex nut. The pin on the top of the airfoil is attached to a turning
device that holds the blade to the top disk. The turning device also has a compass rose on it
that aligns with a compass rose on the top piece allowing for easy angle measurements
while adjusting the blade angle.
28
Figure 3.2 Airfoil s1223 diagram
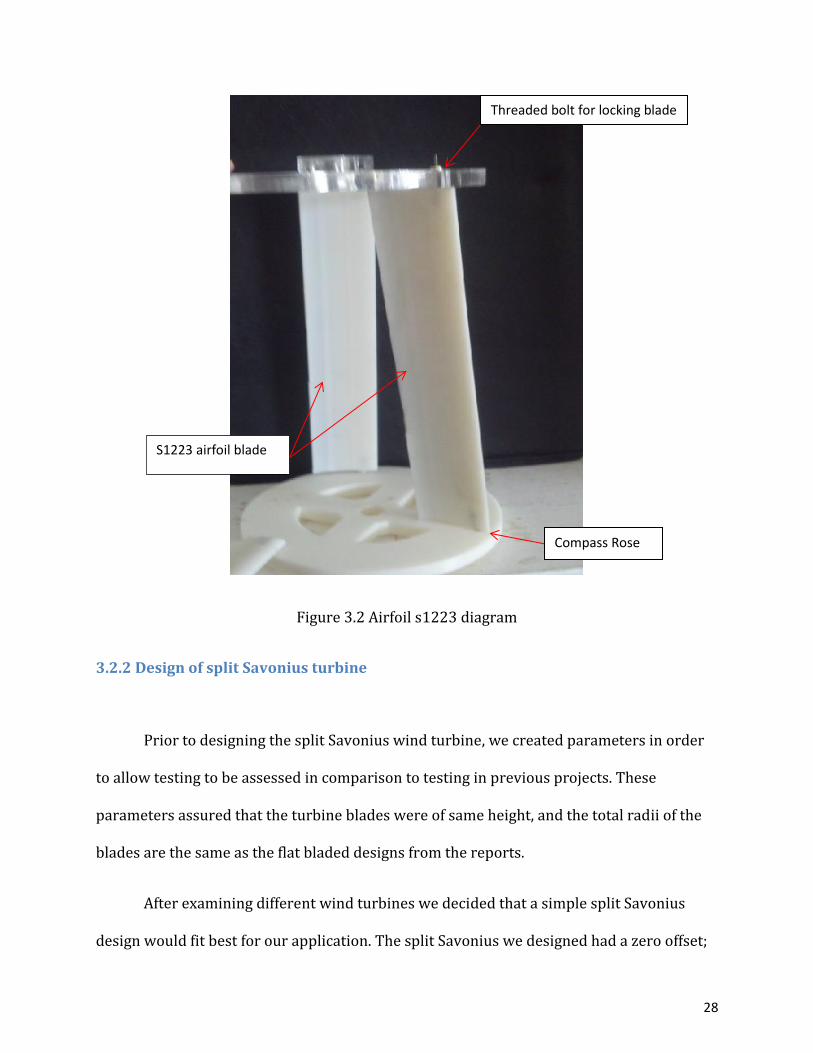
3.2.2 Design of split Savonius turbine
Prior to designing the split Savonius wind turbine, we created parameters in order
to allow testing to be assessed in comparison to testing in previous projects. These
parameters assured that the turbine blades were of same height, and the total radii of the
blades are the same as the flat bladed designs from the reports.
After examining different wind turbines we decided that a simple split Savonius
design would fit best for our application. The split Savonius we designed had a zero offset;
Compass Rose
Threaded bolt for locking blade
S1223 airfoil blade
29
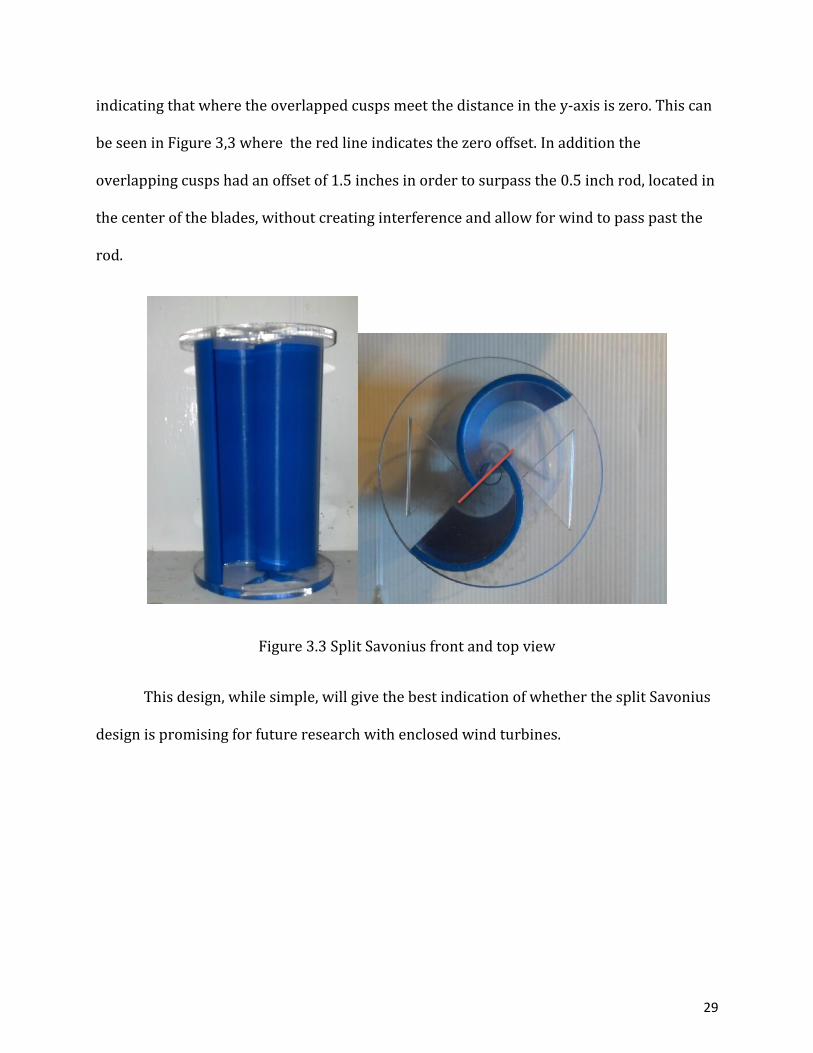
indicating that where the overlapped cusps meet the distance in the y-axis is zero. This can
be seen in Figure 3,3 where the red line indicates the zero offset. In addition the
overlapping cusps had an offset of 1.5 inches in order to surpass the 0.5 inch rod, located in
the center of the blades, without creating interference and allow for wind to pass past the
rod.
Figure 3.3 Split Savonius front and top view
This design, while simple, will give the best indication of whether the split Savonius
design is promising for future research with enclosed wind turbines.
30
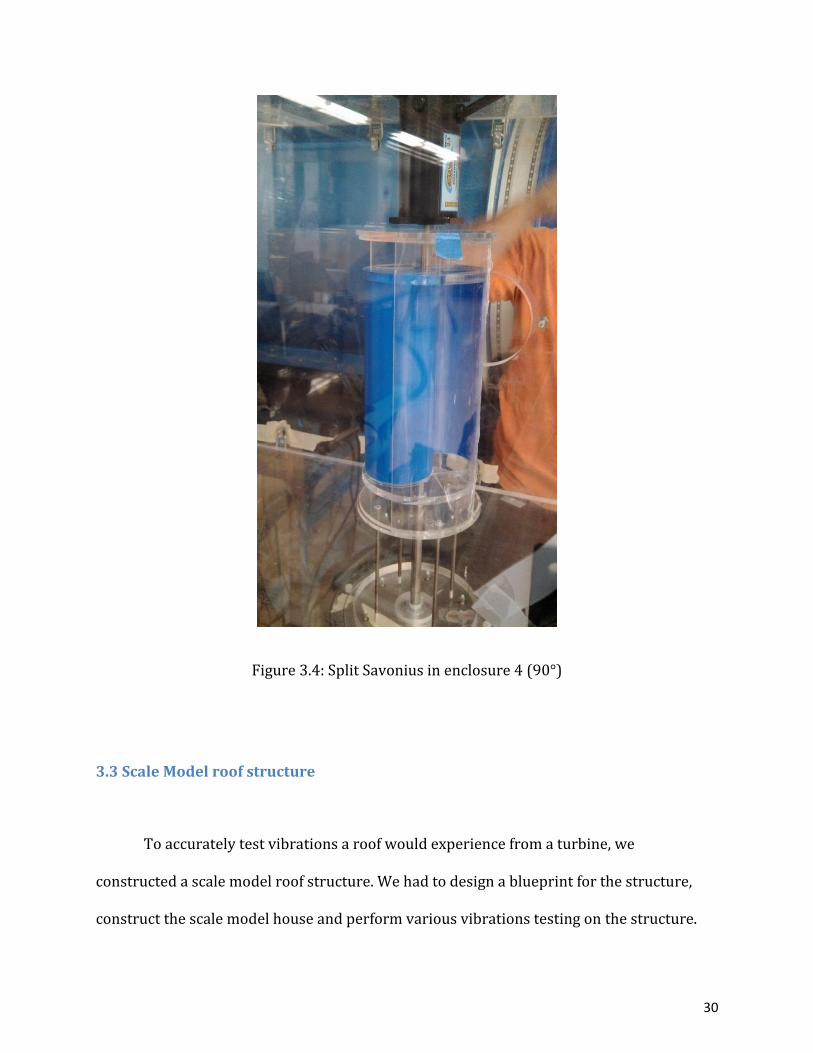
Figure 3.4: Split Savonius in enclosure 4 (90°)
3.3 Scale Model roof structure
To accurately test vibrations a roof would experience from a turbine, we
constructed a scale model roof structure. We had to design a blueprint for the structure,
construct the scale model house and perform various vibrations testing on the structure.
31
Testing included sending pulses through the vertical shaft attached to the roof and having
four accelerometers placed on the structure to detect any acceleration.
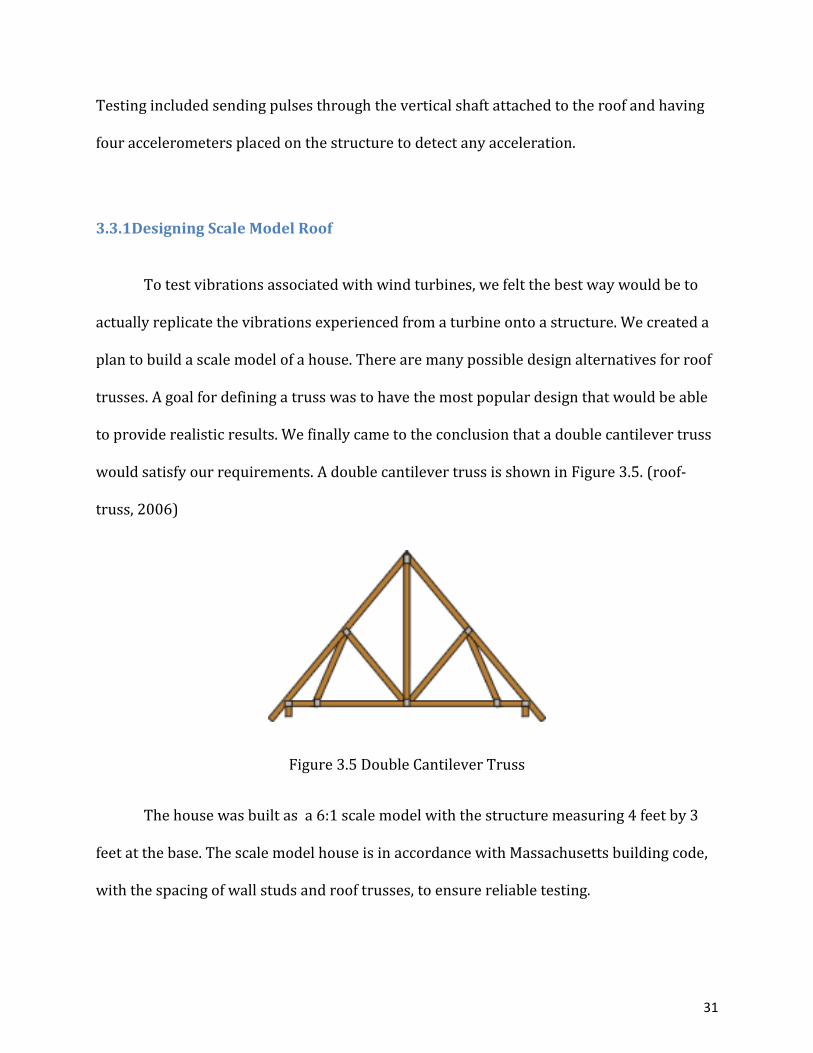
3.3.1Designing Scale Model Roof
To test vibrations associated with wind turbines, we felt the best way would be to
actually replicate the vibrations experienced from a turbine onto a structure. We created a
plan to build a scale model of a house. There are many possible design alternatives for roof
trusses. A goal for defining a truss was to have the most popular design that would be able
to provide realistic results. We finally came to the conclusion that a double cantilever truss
would satisfy our requirements. A double cantilever truss is shown in Figure 3.5. (roof-
truss, 2006)
Figure 3.5 Double Cantilever Truss
The house was built as a 6:1 scale model with the structure measuring 4 feet by 3
feet at the base. The scale model house is in accordance with Massachusetts building code,
with the spacing of wall studs and roof trusses, to ensure reliable testing.
32
3.3.2 Create experimental set up
After designing the components and structures desired for testing power output for
wind turbine designs and the structures desired to be tested, we created the experimental
set-ups required to test the prototypes and structures.
3.4 Wind turbine set-up
The test set up was in Higgins Laboratory Room 016 Wind Tunnel. When the
turbine is set up in the wind tunnel it is located directly in the middle of the cross section of
the tunnel. The turbine is attached to a stainless steel rod by using a set screw. At the top,
the rod is pressure fitted into a step generator keeping the shaft stable. At the bottom the
base is secured into the tunnel as well as being connected to an anemometer. An
anemometer is a device that collects the turbines rotation rate in units of rpm. The
generator is a 443540 Low RPM Permanent Magnet DC Generator and is attached to the
wind tunnel as depicted in figure 3.6. The quarter inch shaft is attached to the generator
with a press fit and a set screw to the shaft of the generator.

33
Figure 3.6 Securely Fastened Generator
The anemometer is measured through a Texas Instrument DAQ box. The generator
voltage is measured through a Labview vi. and current is measured by hand with an
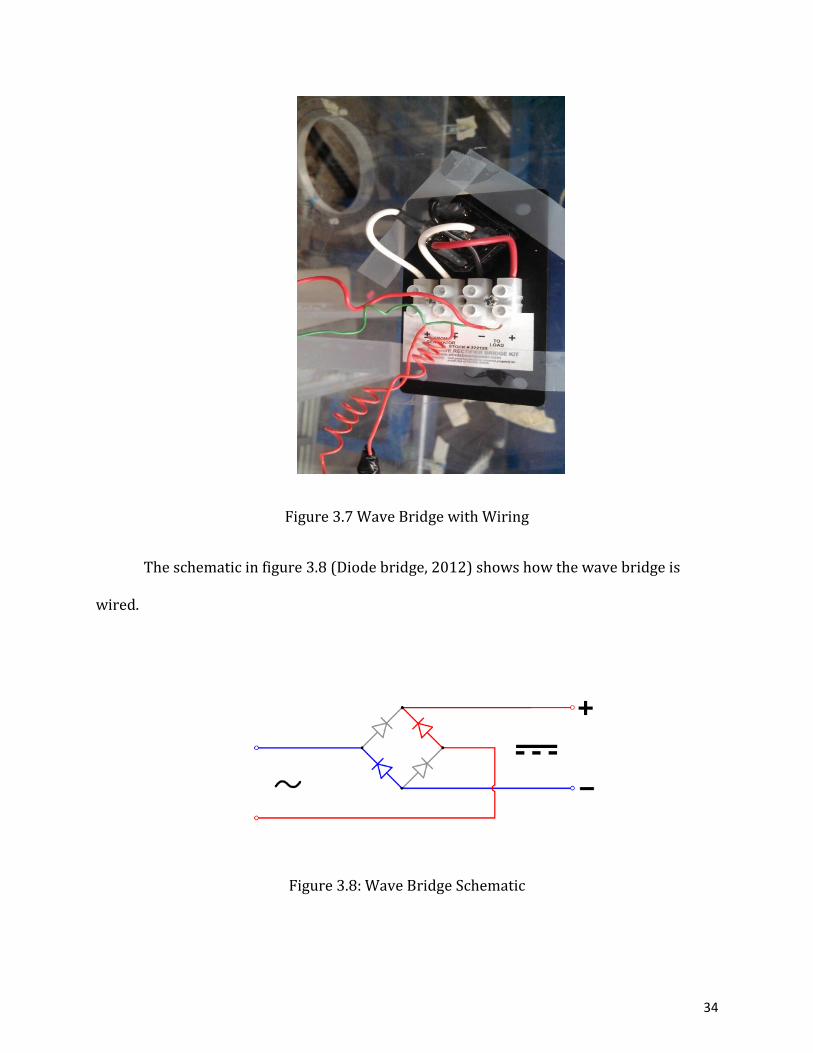
ohmmeter. The generator’s current is managed by a full wave bridge. The wave bridge is
wired as depicted in Figure 3.7.
34
Figure 3.7 Wave Bridge with Wiring
The schematic in figure 3.8 (Diode bridge, 2012) shows how the wave bridge is
wired.
Figure 3.8: Wave Bridge Schematic
35
In addition to test the vibrations of the wind turbine we attached an accelerometer
at the base of the turbine. The wiring from the accelerometer is attached to a DAQ box in
order to record the data on a Labview virtual instruments or vi. The schematics of this can
be seen in figure 3.8.
3.4.1 Generators
The generator used for the prototype is the 443540 Low RPM permanent magnet
DC generator created by Wind Stream Power and is a 12 volt step generator. The generator
has an internal resistance of 21ohms, yet it requires an additional load in order to produce
power. Without an additional load no power can be generated. The additional load is a
Wheatstone bridge called a wave bridge. This can be created with regular resistors.
However, if the objective is to store energy rather than record it, the Wheatstone bridge
must be made of single direction resistors to prevent the voltage from the battery from
reversing direction back into the generator.
The current generator can only operate continuously with a current of 1.5 amperes
and at a max of 1.5 minutes with a current of 3 amperes. To control the amperage the wave
bridge described in the equation above must act as a load and control the amperage of the
system.
36
3.4.2 Data Acquisition
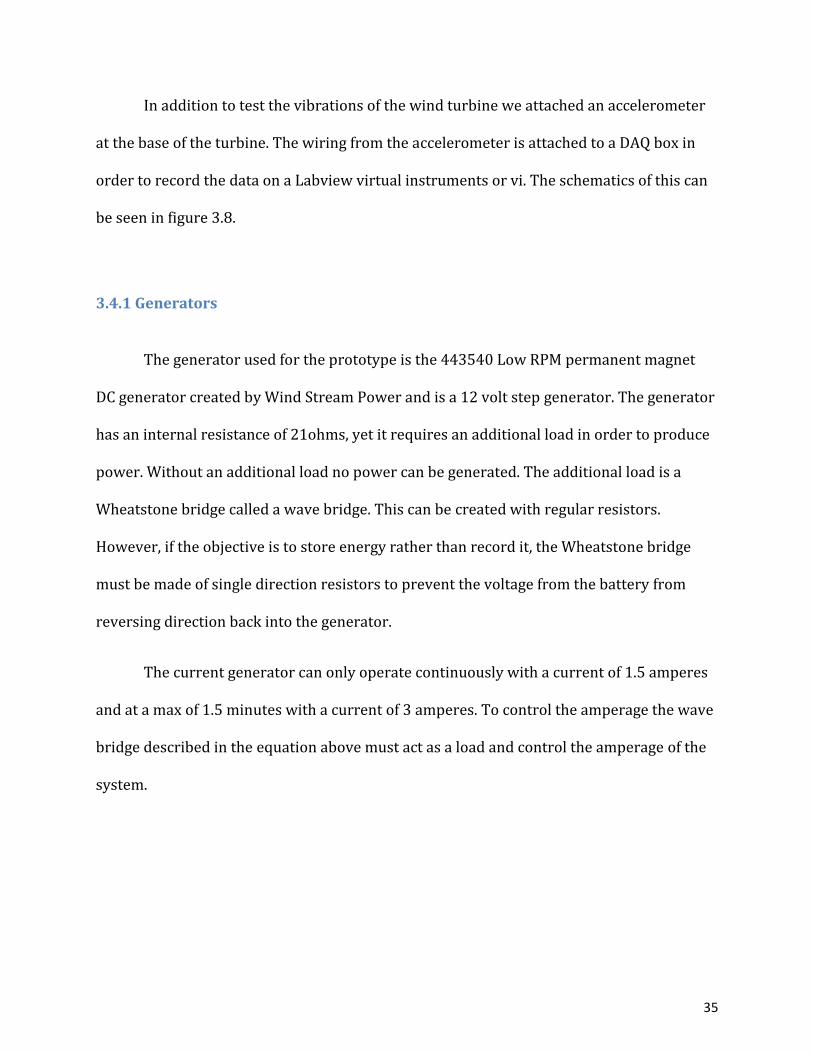
In order to record all of the testing we created Labview vi.’s. The vi.’s recorded
voltage from the generator, amplitude and period of the vibrations from the accelerometer
on the turbine, and on the model house .These vi.’s are shown in Figure 3.9.
Figure 3.9 Labview vi
37
3.4.3 Power output from the generator
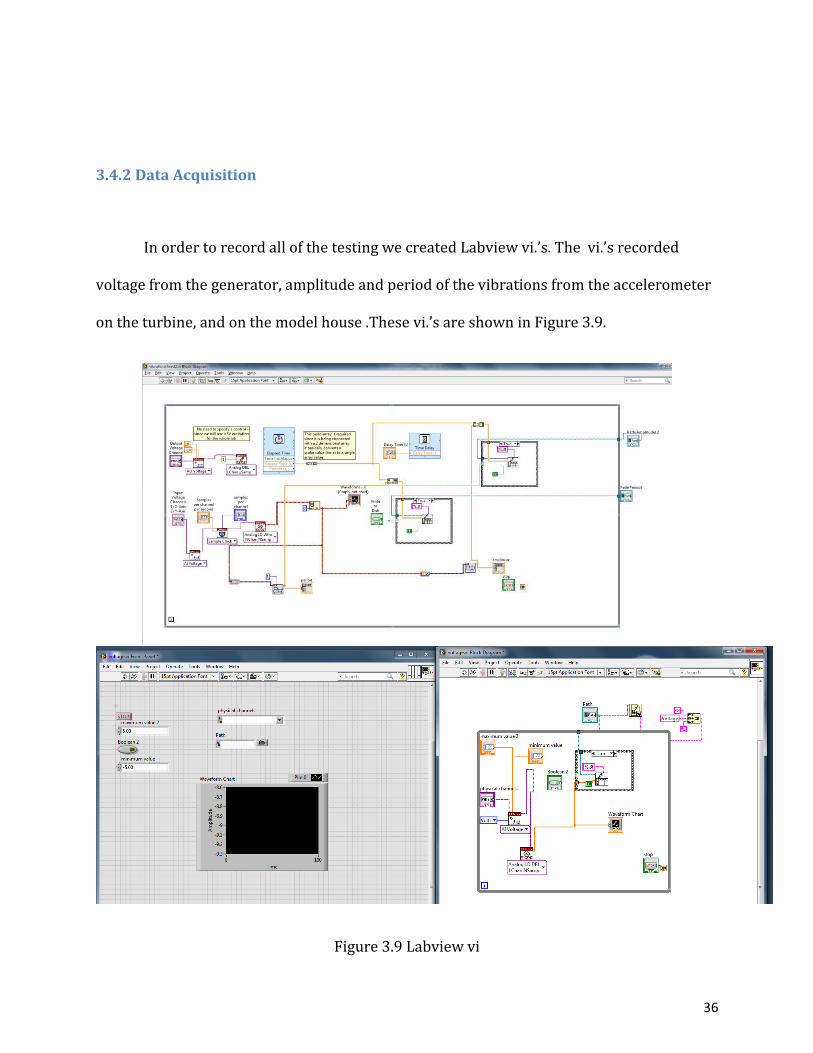
Power output tests included recording power from the split Savonius and the four
flat bladed turbines. The first test is the split Savonius. We tested the turbine first without
an enclosure and then with the 90° enclosure. We ran the wind tunnel at 22, 25, and 30
hertz.
Figure 3.10 Split Savonius Set up with 90° enclosure and 90° enclosure on right
The adjustable angle wind turbine followed similar testing procedures as the
Savonius, although we started with the blades at a zero degree angle of attack and
increased the angle of attack by 4 degree increments up to 28 degrees. Then, we analyzed
the data and performed further testing with the most effective angle of attack. We also
included an orientation with the blades inverted on the adjustable angle turbine, since a
few studies suggest that this could potentially improve efficiency as well.
38
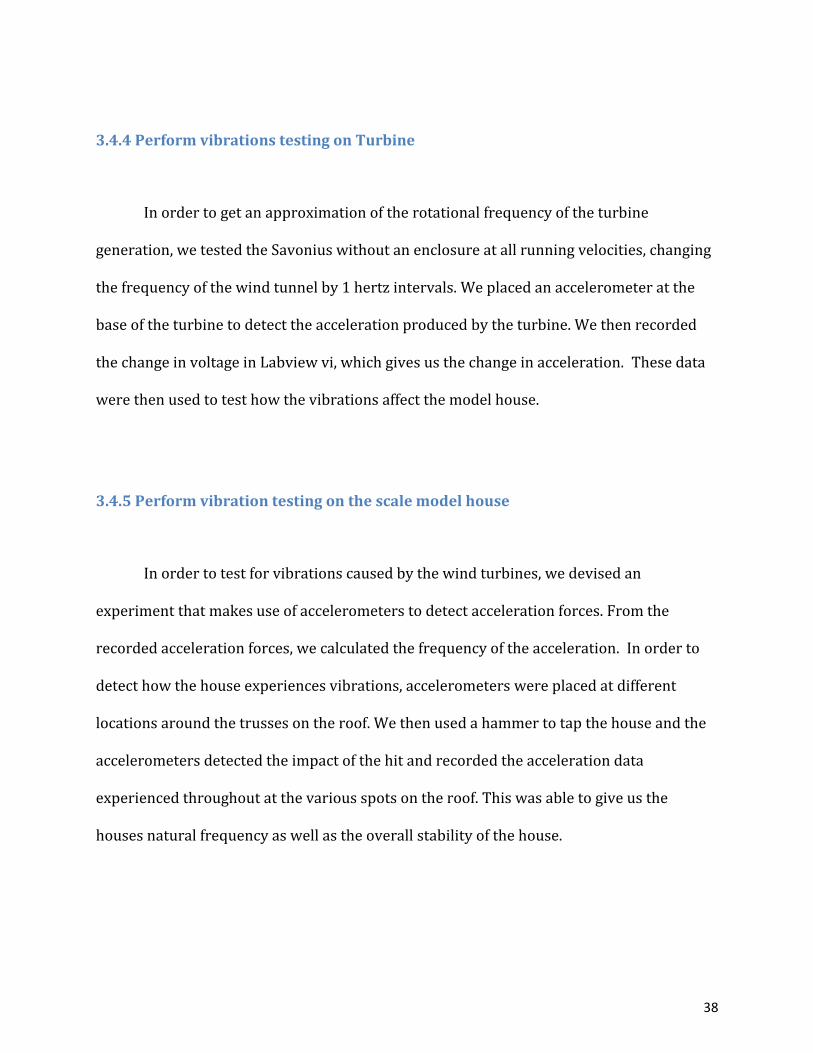
3.4.4 Perform vibrations testing on Turbine
In order to get an approximation of the rotational frequency of the turbine
generation, we tested the Savonius without an enclosure at all running velocities, changing
the frequency of the wind tunnel by 1 hertz intervals. We placed an accelerometer at the
base of the turbine to detect the acceleration produced by the turbine. We then recorded
the change in voltage in Labview vi, which gives us the change in acceleration. These data
were then used to test how the vibrations affect the model house.
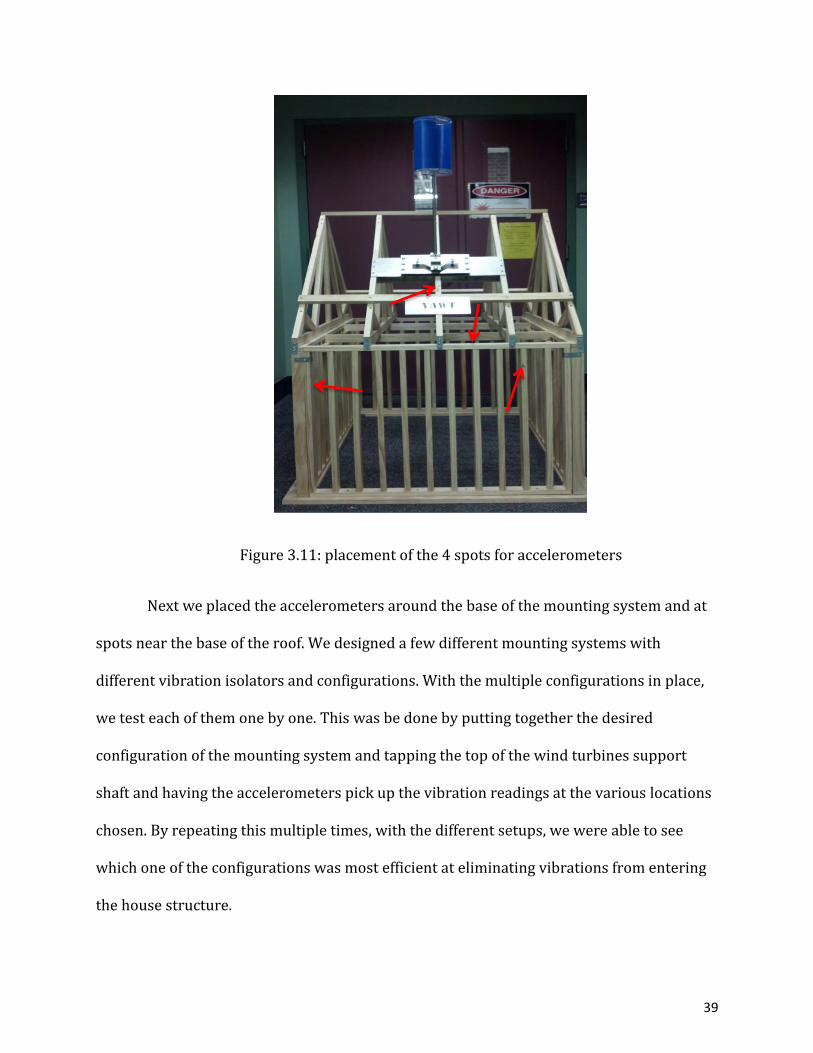
3.4.5 Perform vibration testing on the scale model house
In order to test for vibrations caused by the wind turbines, we devised an
experiment that makes use of accelerometers to detect acceleration forces. From the
recorded acceleration forces, we calculated the frequency of the acceleration. In order to
detect how the house experiences vibrations, accelerometers were placed at different
locations around the trusses on the roof. We then used a hammer to tap the house and the
accelerometers detected the impact of the hit and recorded the acceleration data
experienced throughout at the various spots on the roof. This was able to give us the
houses natural frequency as well as the overall stability of the house.
39
Figure 3.11: placement of the 4 spots for accelerometers
Next we placed the accelerometers around the base of the mounting system and at
spots near the base of the roof. We designed a few different mounting systems with
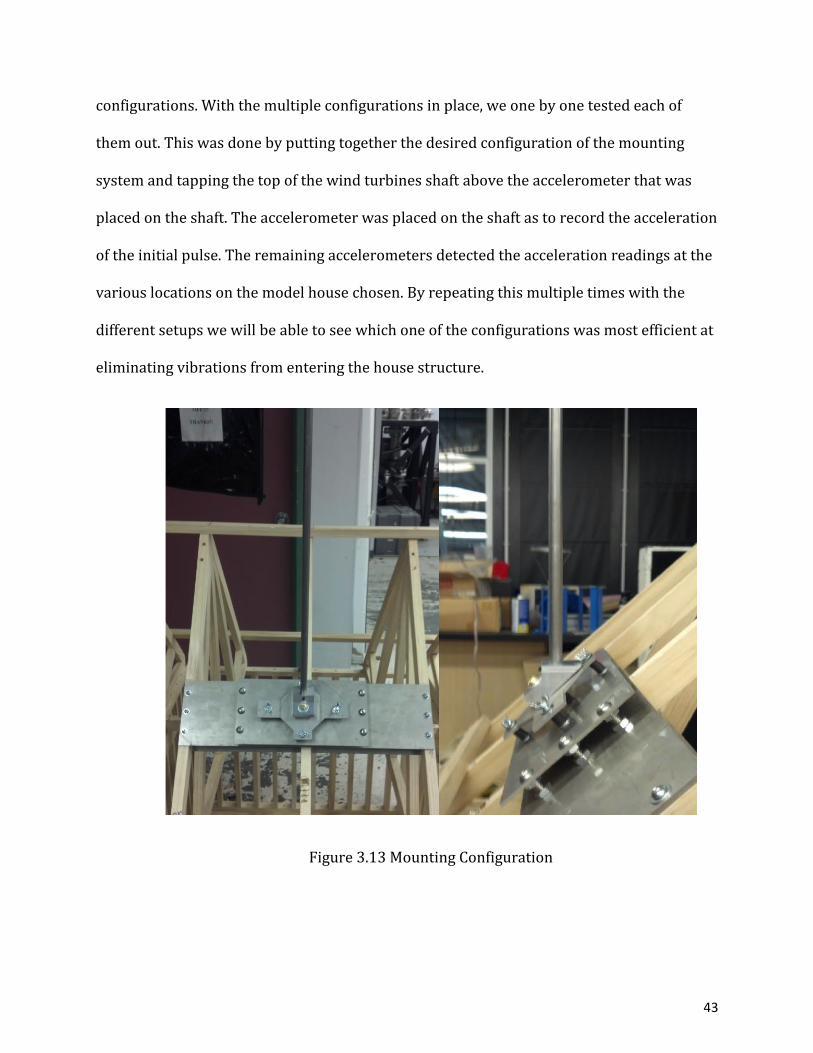
different vibration isolators and configurations. With the multiple configurations in place,
we test each of them one by one. This was be done by putting together the desired
configuration of the mounting system and tapping the top of the wind turbines support
shaft and having the accelerometers pick up the vibration readings at the various locations
chosen. By repeating this multiple times, with the different setups, we were able to see
which one of the configurations was most efficient at eliminating vibrations from entering
the house structure.
40
3.5 Manufacturing of turbine blades and rod.
The vertical shaft that held the turbine was manufactured out of quarter inch
stainless steel with press fits designed to attach to the generator and the anemometer. It
also had two set screws which kept the shaft connected to both instruments as well as a set
screw in the middle to lock turbine in place.
The split Savonius blade was manufactured in the Stratysys Dimension FDM Rapid
Prototyping 3d printer. The top and bottom pieces were cut out of 3/8th inch acrylic and
then glued together.
The adjustable angle wind turbine was mostly manufactured in the 3-d printer. The
metal rods used to lock the adjustable blade to the top and bottom pieces were glued
together with epoxy.
3.5.1 Building of model house
The purpose of the model house was to replicate an actual structure for vibrational
testing. Replication of the actual structural design of a house was a crucial component
when constructing the model house. The model house was constructed from 1”x2” native
pine studs. This is able to properly replicate studs used in residential buildings. The walls
have 64 three-foot tall studs to hold up the roof that is comprised of five double cantilever
trusses. These trusses are secured to the walls by metal brackets and two support wood
beams that run through the center of the house. The base of the house is secured to a

41
square frame of 1”x4” native pine boards. This is able to give the structure a sturdier
foundation that better replicates a true foundation. The house in midst of construction can
be seen in figure 3.12.
Figure 3.12 Construction of model house
3.6 Testing
In order to determine the effectiveness of the products that were manufactured, we
performed tests to evaluate them. We also tested the power output of the turbine blades
and evaluated how the vibrations from the turbine affect the stress and strain on a housing
structure.
42
3.6.1 Turbine testing
To test the effectiveness of the turbines, we tested each turbine: split Savonius and
adjustable angle, without an enclosure and with a 90° enclosure. We ran each turbine in the
wind tunnel for the maximum range, which was run at 22, 25, and 30 Hz. We recorded both
power output and the rate of revolutions to compare the data with the adjustable angle
wind turbine. We tested the turbine at various angles of attack, testing to determine the
most efficient angle, with the same process as previously described.
3.6.2 Vibration testing
First, we placed multiple accelerometers around the base of the turbine to figure out
the vibration frequency of the turbine while in the wind tunnel.
Second, after collecting series of data from this experiment, we examined the
mounting system on top of the model roof. In order to detect how the house experiences
vibrations, accelerometers were placed upon different parts of the trusses on the roof. We
then used a hammer to send a pulse through the house. The accelerometers detected the
impact of the hit and recorded the acceleration experienced at the various spots on the
roof.
After recording data on the structure of the roof, next we place the accelerometers
around the base of the mounting system and at spots near the base of the roof. We have
designed a few different mounting systems with different vibration isolators and
43
configurations. With the multiple configurations in place, we one by one tested each of
them out. This was done by putting together the desired configuration of the mounting
system and tapping the top of the wind turbines shaft above the accelerometer that was
placed on the shaft. The accelerometer was placed on the shaft as to record the acceleration
of the initial pulse. The remaining accelerometers detected the acceleration readings at the
various locations on the model house chosen. By repeating this multiple times with the
different setups we will be able to see which one of the configurations was most efficient at
eliminating vibrations from entering the house structure.
Figure 3.13 Mounting Configuration

44
3.7 Develop future design recommendations
Using the data received we made recommendations for future studies regarding the
potential of commercial rooftop wind turbines. These recommendations will hopefully aid
in the development of a technology that would allow green energy to reduce energy costs
in the average household and better the environment. Future tests could help determine
the feasibility of houses, neighborhoods, or cities powered by wind turbines and being able
to run off of renewable energy.
45
4 Results
This section describes the results of our testing and shows how we compared our
split Savonius design with the previous 4 flat bladed design and airfoil designs. The results
also address the use of having funnels attached to shrouds, in hope of increasing power
output. Lastly, the results will show the analysis of the vibration testing performed on the
model house.
4.1 Turbine Data
The turbine data were taken at three different frequencies from the wind tunnel.
These were at 22, 25, 30 Hz. The lack of data points and the need to resort to the use of high
speeds for testing were a result of our large 12V generator. This made it impractical to
accurately relate our power output results with realistic wind speeds that a turbine would
expect to encounter. However, it did exhibit differences in each the performance for each
set up, whether it was one of the various blade designs or enclosures.
4.1.1 Use of Funnels
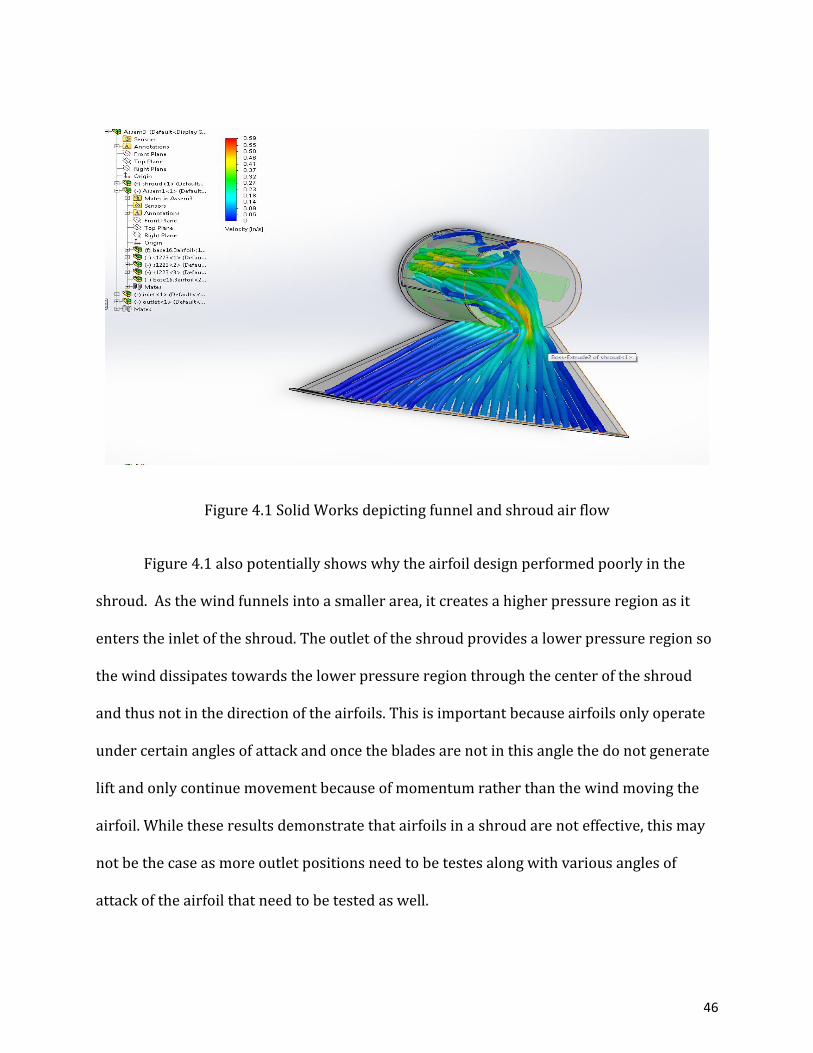
The computer simulation indicates a lot about the funneled shroud design. First it
reconfirms the theory that the funnel will increase wind speeds into the funnel as the color
coded bars representing wind in the system above indicates.
46
Figure 4.1 Solid Works depicting funnel and shroud air flow
Figure 4.1 also potentially shows why the airfoil design performed poorly in the
shroud. As the wind funnels into a smaller area, it creates a higher pressure region as it
enters the inlet of the shroud. The outlet of the shroud provides a lower pressure region so
the wind dissipates towards the lower pressure region through the center of the shroud
and thus not in the direction of the airfoils. This is important because airfoils only operate
under certain angles of attack and once the blades are not in this angle the do not generate
lift and only continue movement because of momentum rather than the wind moving the
airfoil. While these results demonstrate that airfoils in a shroud are not effective, this may
not be the case as more outlet positions need to be testes along with various angles of
attack of the airfoil that need to be tested as well.
47
Our testing with various funnels attached to our enclosures was not successful and
was not able to turn the generator, even when a load was not applied. The reason for this is
because the wind accelerated around the funnel rather than flowing through the funnel.
This is due to the fact that the funnel creates a higher pressure air system inside the funnel
and the wind moved around it. Using funnels in this fashion proved to be an ineffective
strategy.
4.1.2 Air Foil Design
The adjustable airfoil design we used was not able to spin the generator under load
with or without the enclosure. Even though we tested at speeds 35 percent higher than all
other airfoil tests, this design remained unsuccessful. This design proved to be an
inefficient design for the vertical axis wind turbine.
4.1.3 Turbine Results
Final testing resulted in effective, informative results using the split Savonius with
and without an enclosure. For comparison, we tested a flat four bladed design that had
been used in a previous project by Julie Eagle.
48
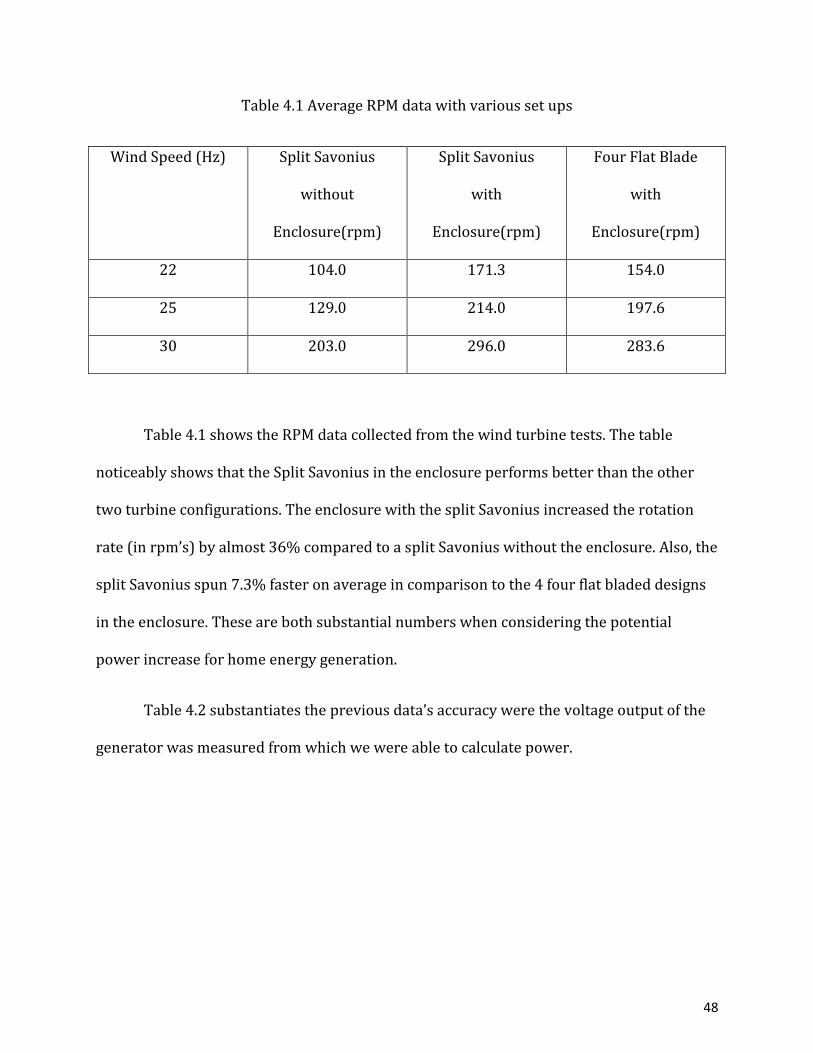
Table 4.1 Average RPM data with various set ups
Wind Speed (Hz) Split Savonius
without
Enclosure(rpm)
Split Savonius
with
Enclosure(rpm)
Four Flat Blade
with
Enclosure(rpm)
22 104.0 171.3 154.0
25 129.0 214.0 197.6
30 203.0 296.0 283.6
Table 4.1 shows the RPM data collected from the wind turbine tests. The table
noticeably shows that the Split Savonius in the enclosure performs better than the other
two turbine configurations. The enclosure with the split Savonius increased the rotation
rate (in rpm’s) by almost 36% compared to a split Savonius without the enclosure. Also, the
split Savonius spun 7.3% faster on average in comparison to the 4 four flat bladed designs
in the enclosure. These are both substantial numbers when considering the potential
power increase for home energy generation.
Table 4.2 substantiates the previous data’s accuracy were the voltage output of the
generator was measured from which we were able to calculate power.
49
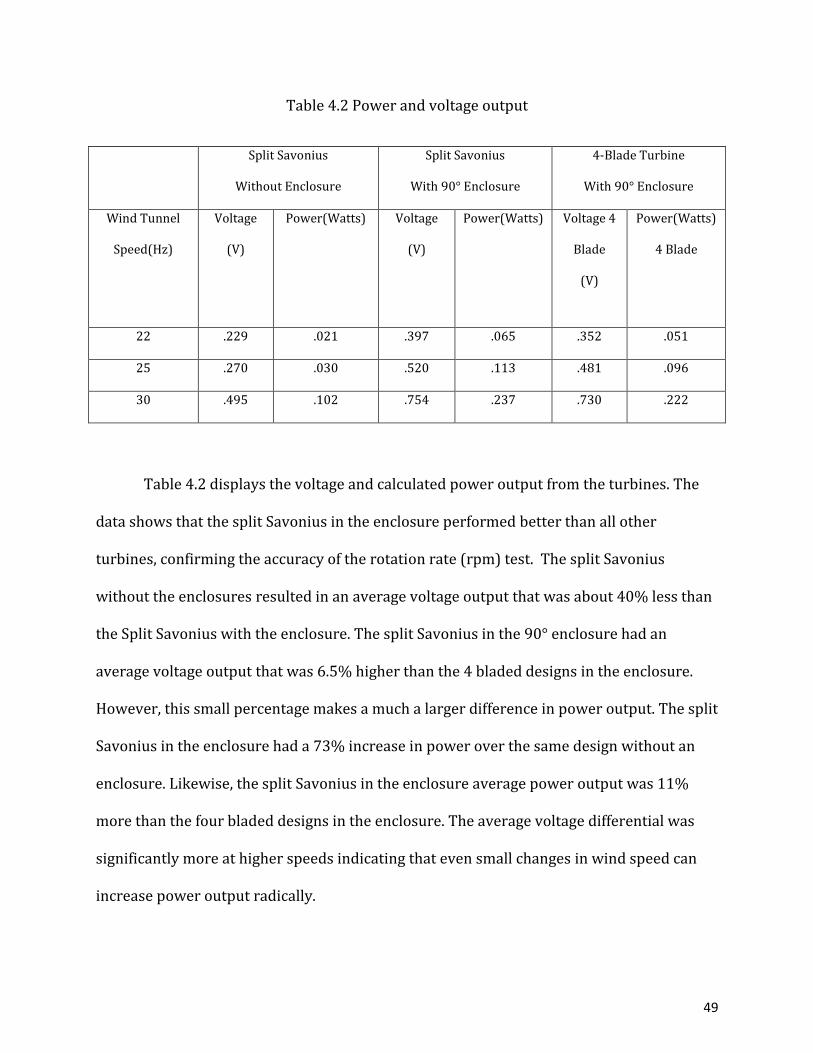
Table 4.2 Power and voltage output
Split Savonius
Without Enclosure
Split Savonius
With 90° Enclosure
4-Blade Turbine
With 90° Enclosure
Wind Tunnel
Speed(Hz)
Voltage
(V)
Power(Watts)
Voltage
(V)
Power(Watts)
Voltage 4
Blade
(V)
Power(Watts)
4 Blade
22 .229 .021 .397 .065 .352 .051
25 .270 .030 .520 .113 .481 .096
30 .495 .102 .754 .237 .730 .222
Table 4.2 displays the voltage and calculated power output from the turbines. The
data shows that the split Savonius in the enclosure performed better than all other
turbines, confirming the accuracy of the rotation rate (rpm) test. The split Savonius
without the enclosures resulted in an average voltage output that was about 40% less than
the Split Savonius with the enclosure. The split Savonius in the 90° enclosure had an
average voltage output that was 6.5% higher than the 4 bladed designs in the enclosure.
However, this small percentage makes a much a larger difference in power output. The split
Savonius in the enclosure had a 73% increase in power over the same design without an
enclosure. Likewise, the split Savonius in the enclosure average power output was 11%
more than the four bladed designs in the enclosure. The average voltage differential was
significantly more at higher speeds indicating that even small changes in wind speed can
increase power output radically.
50
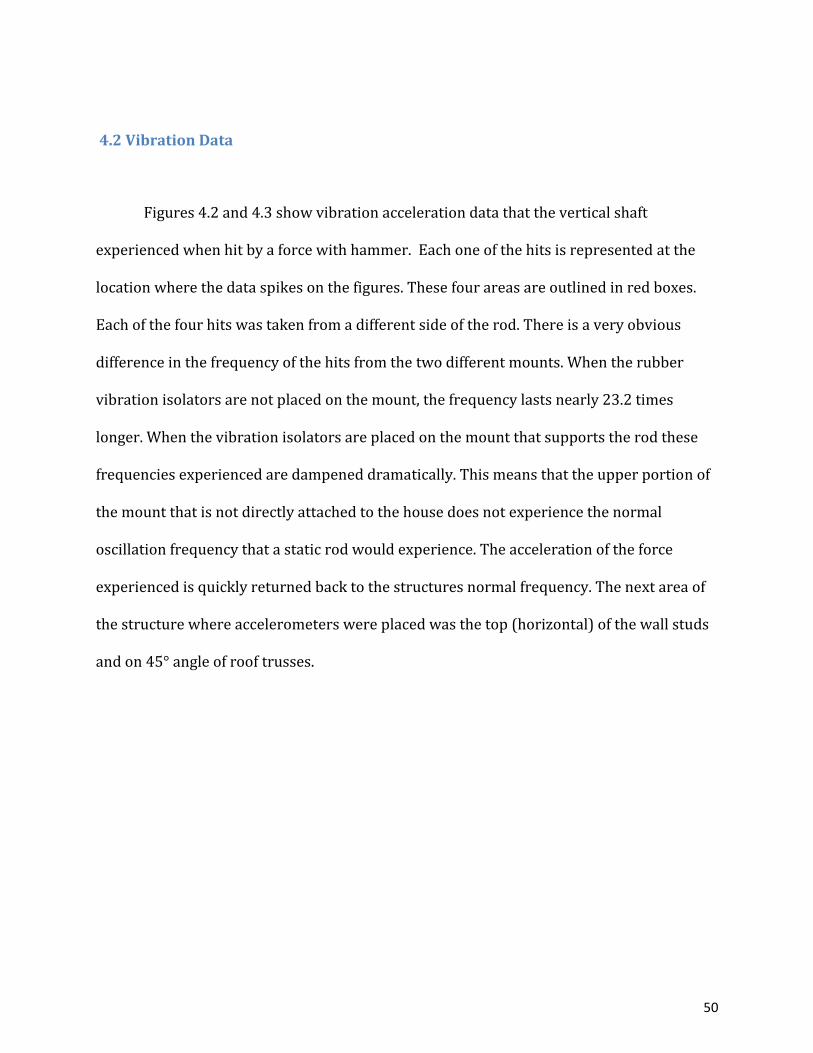
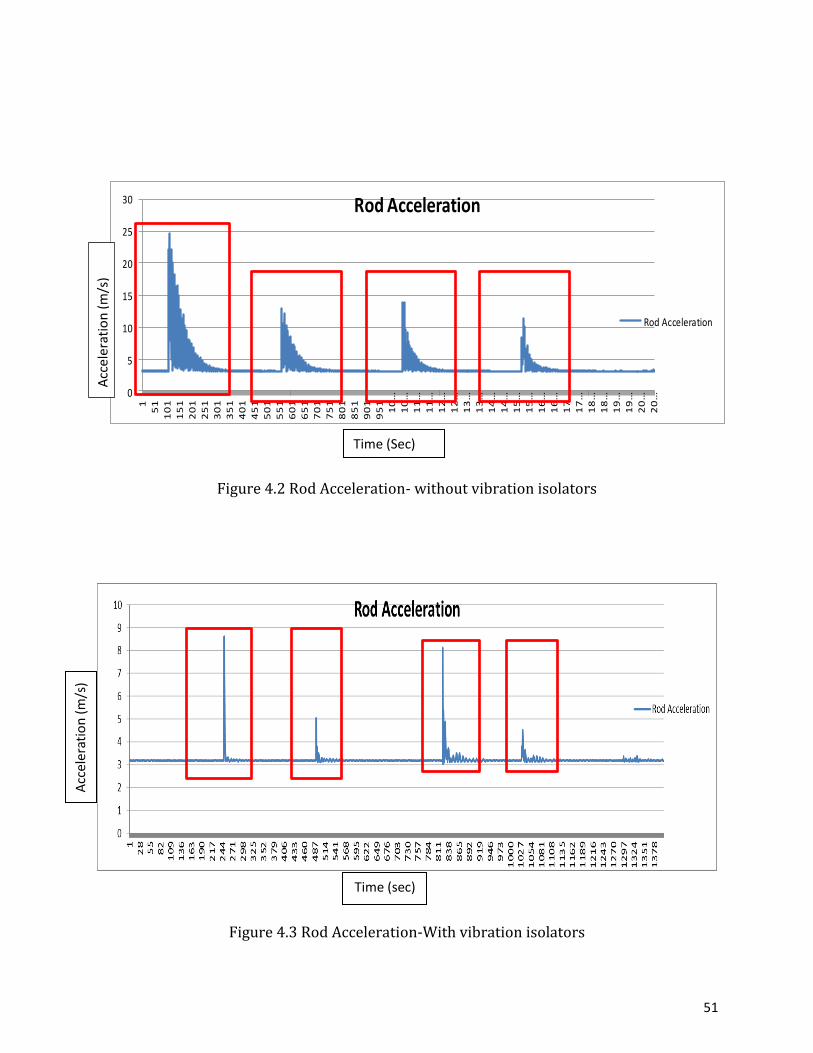
4.2 Vibration Data
Figures 4.2 and 4.3 show vibration acceleration data that the vertical shaft
experienced when hit by a force with hammer. Each one of the hits is represented at the
location where the data spikes on the figures. These four areas are outlined in red boxes.
Each of the four hits was taken from a different side of the rod. There is a very obvious
difference in the frequency of the hits from the two different mounts. When the rubber
vibration isolators are not placed on the mount, the frequency lasts nearly 23.2 times
longer. When the vibration isolators are placed on the mount that supports the rod these
frequencies experienced are dampened dramatically. This means that the upper portion of
the mount that is not directly attached to the house does not experience the normal
oscillation frequency that a static rod would experience. The acceleration of the force
experienced is quickly returned back to the structures normal frequency. The next area of
the structure where accelerometers were placed was the top (horizontal) of the wall studs
and on 45° angle of roof trusses.
51
Figure 4.2 Rod Acceleration- without vibration isolators
Figure 4.3 Rod Acceleration-With vibration isolators
0
5
10
15
20
25
30
1
51
10
1
15
1
20
1
25
1
30
1
35
1
40
1
45
1
50
1
55
1
60
1
65
1
70
1
75
1
80
1
85
1
90
1
95
1
10
…
10
…
11
…
11
…
12
…
12
…
13
…
13
…
14
…
14
…
15
…
15
…
16
…
16
…
17
…
17
…
18
…
18
…
19
…
19
…
20
…
20
…
Rod Acceleration
Rod Acceleration
Acc
eler
atio
n (
m/s
)
Time (sec)
Time (Sec)
Acc
eler
atio
n (
m/s
)
52
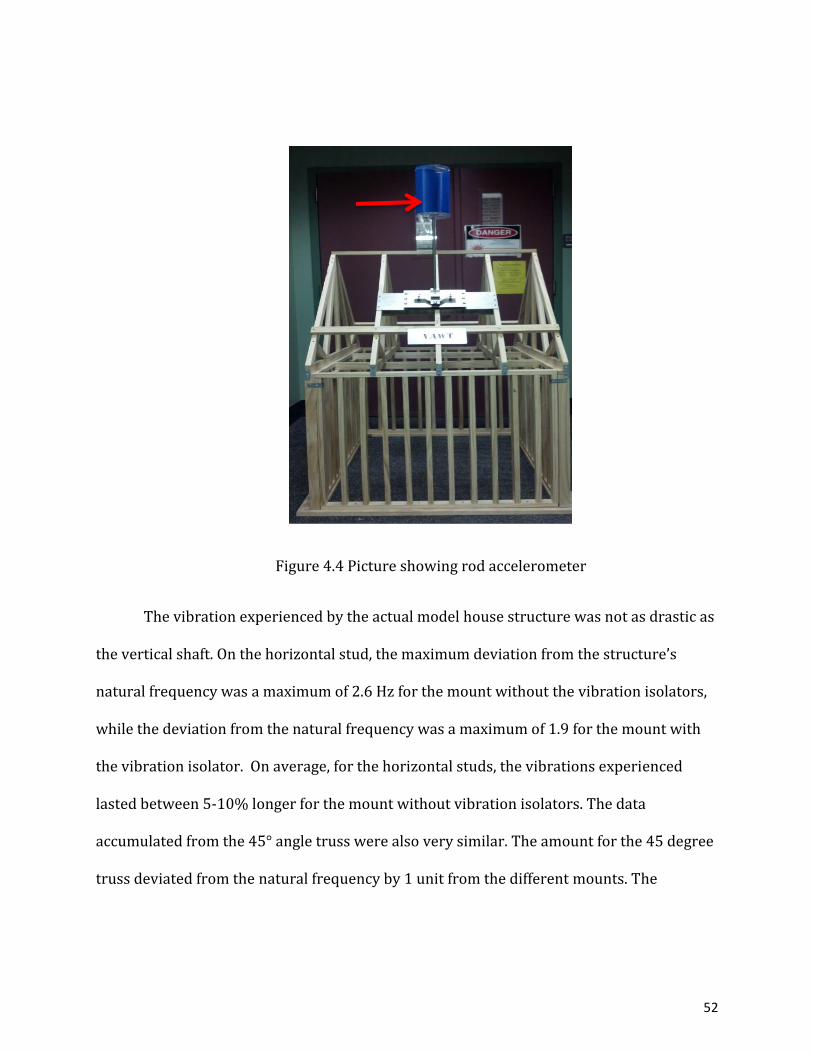
Figure 4.4 Picture showing rod accelerometer
The vibration experienced by the actual model house structure was not as drastic as
the vertical shaft. On the horizontal stud, the maximum deviation from the structure’s
natural frequency was a maximum of 2.6 Hz for the mount without the vibration isolators,
while the deviation from the natural frequency was a maximum of 1.9 for the mount with
the vibration isolator. On average, for the horizontal studs, the vibrations experienced
lasted between 5-10% longer for the mount without vibration isolators. The data
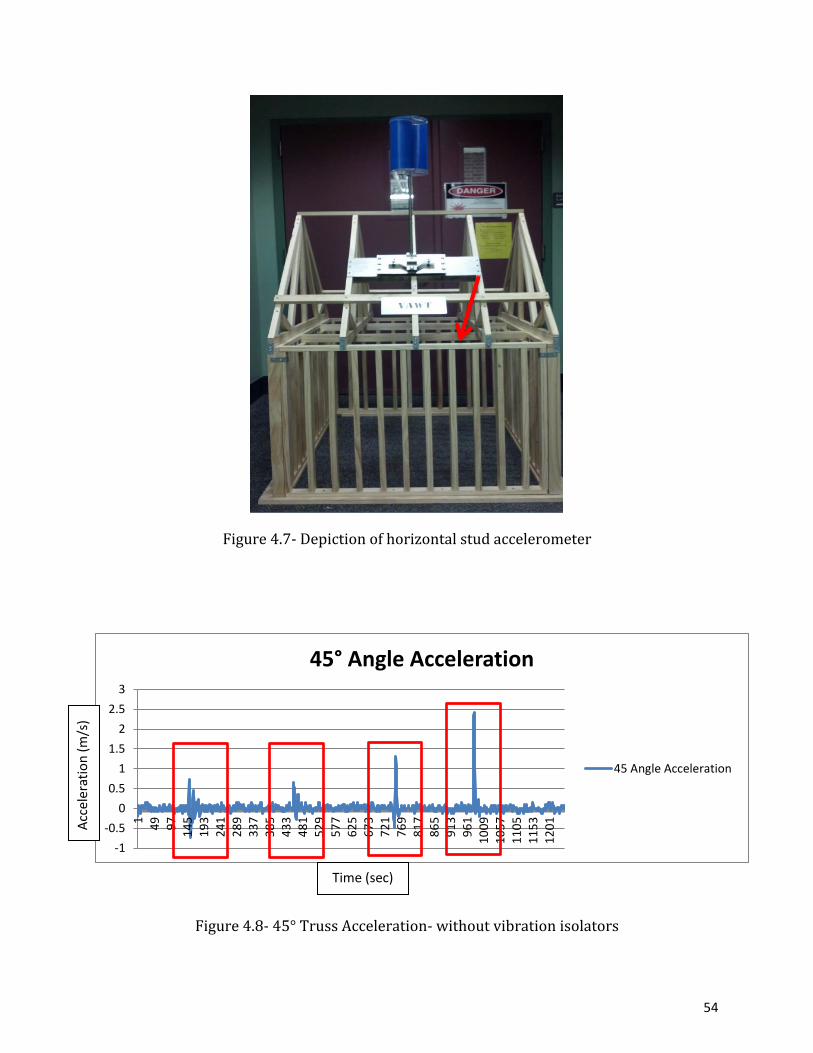
accumulated from the 45° angle truss were also very similar. The amount for the 45 degree
truss deviated from the natural frequency by 1 unit from the different mounts. The
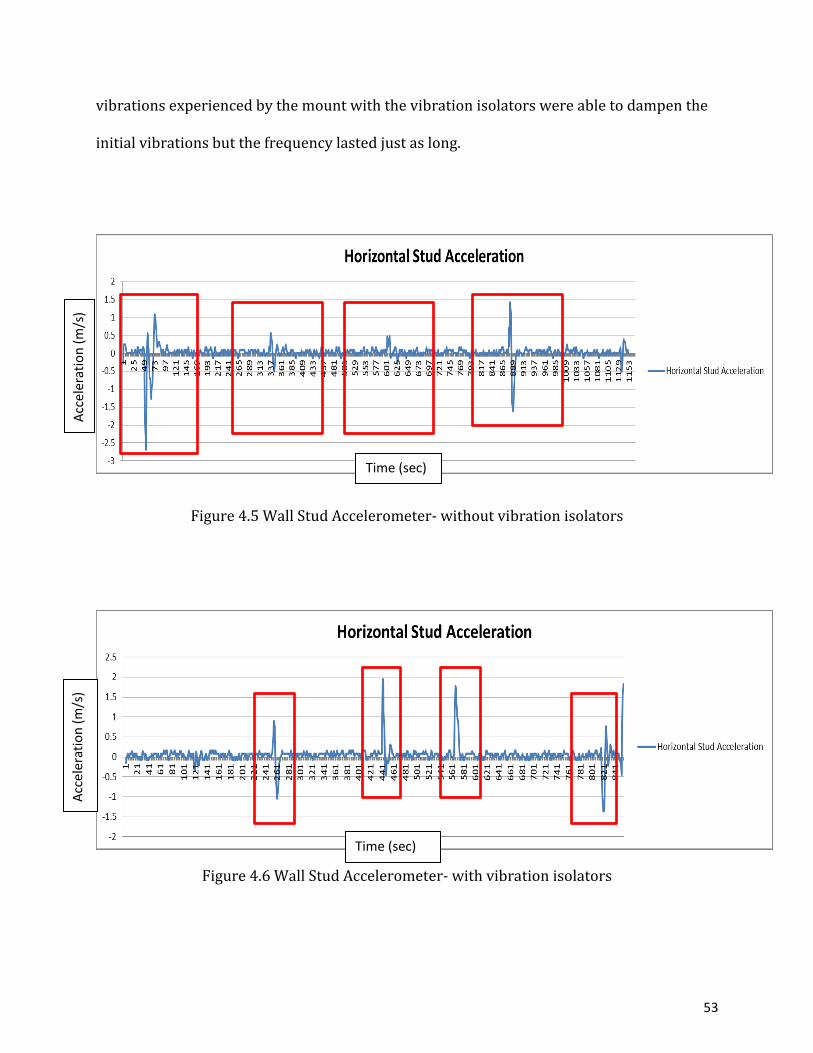
53
vibrations experienced by the mount with the vibration isolators were able to dampen the
initial vibrations but the frequency lasted just as long.
Figure 4.5 Wall Stud Accelerometer- without vibration isolators
Figure 4.6 Wall Stud Accelerometer- with vibration isolators
Acc
eler
atio
n (
m/s
)
Time (sec)
Acc
eler
atio
n (
m/s
)
Time (sec)
54
Figure 4.7- Depiction of horizontal stud accelerometer
Figure 4.8- 45° Truss Acceleration- without vibration isolators
-1
-0.5
0
0.5
1
1.5
2
2.5
3
14
99
71
45
19
32
41
28
93
37
38
54
33
48
15
29
57
76
25
67
37
21
76
98
17
86
59
13
96
11
00
91
05
71
10
51
15
31
20
1
45° Angle Acceleration
45 Angle Acceleration
Acc
eler
atio
n (
m/s
)
Time (sec)
55
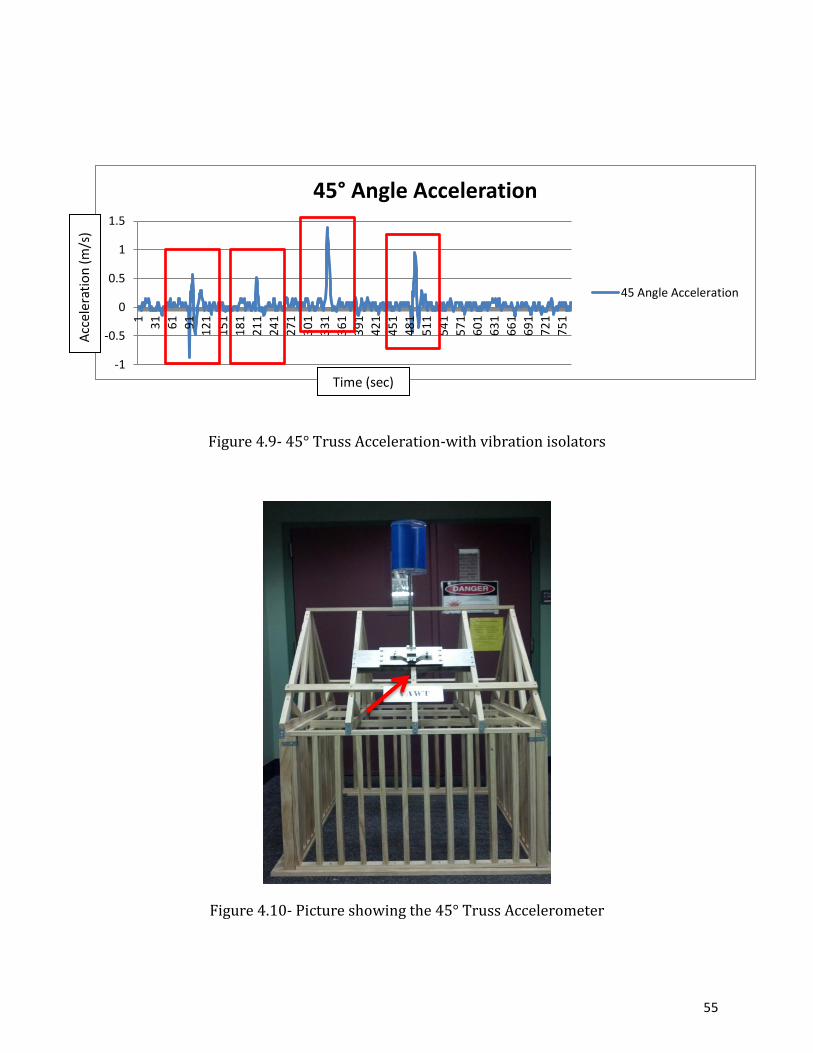
Figure 4.9- 45° Truss Acceleration-with vibration isolators
Figure 4.10- Picture showing the 45° Truss Accelerometer
-1
-0.5
0
0.5
1
1.5
1
31
61
91
12
1
15
1
18
1
21
1
24
1
27
1
30
1
33
1
36
1
39
1
42
1
45
1
48
1
51
1
54
1
57
1
60
1
63
1
66
1
69
1
72
1
75
1
45° Angle Acceleration
45 Angle Acceleration
Acc
eler
atio
n (
m/s
)
Time (sec)
56
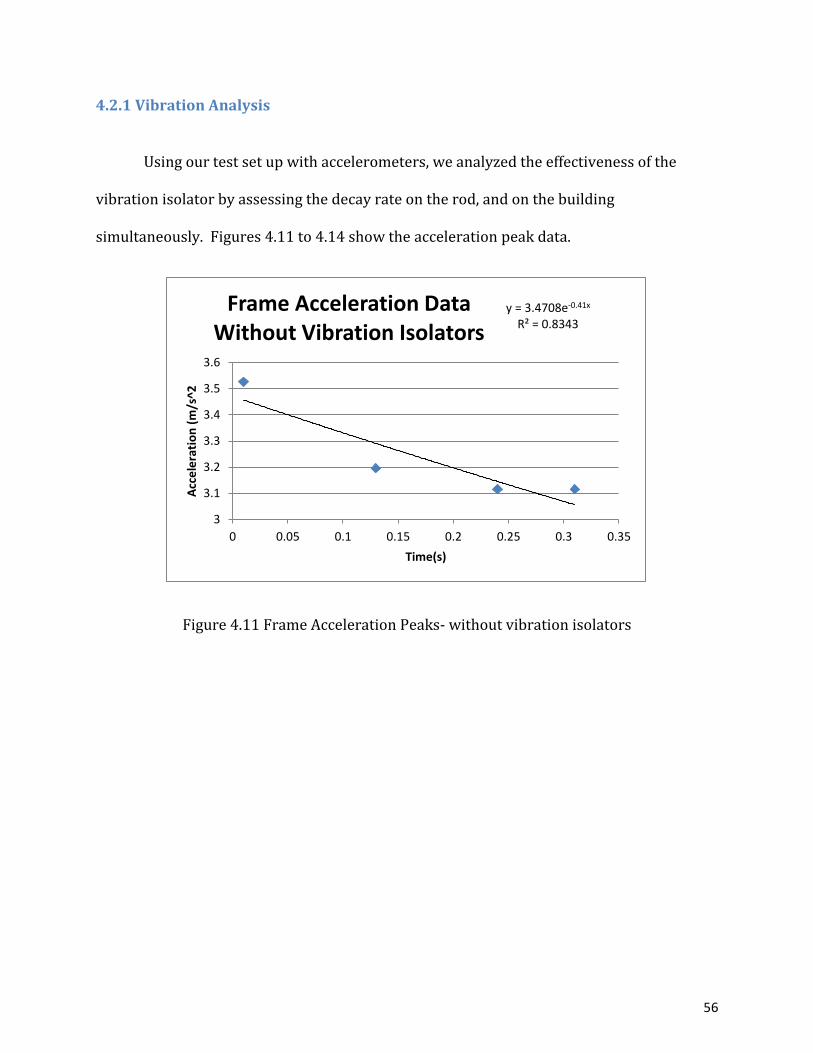
4.2.1 Vibration Analysis
Using our test set up with accelerometers, we analyzed the effectiveness of the
vibration isolator by assessing the decay rate on the rod, and on the building
simultaneously. Figures 4.11 to 4.14 show the acceleration peak data.
Figure 4.11 Frame Acceleration Peaks- without vibration isolators
y = 3.4708e-0.41x R² = 0.8343
3
3.1
3.2
3.3
3.4
3.5
3.6
0 0.05 0.1 0.15 0.2 0.25 0.3 0.35
Acc
ele
rati
on
(m
/s^2
Time(s)
Frame Acceleration Data Without Vibration Isolators
57
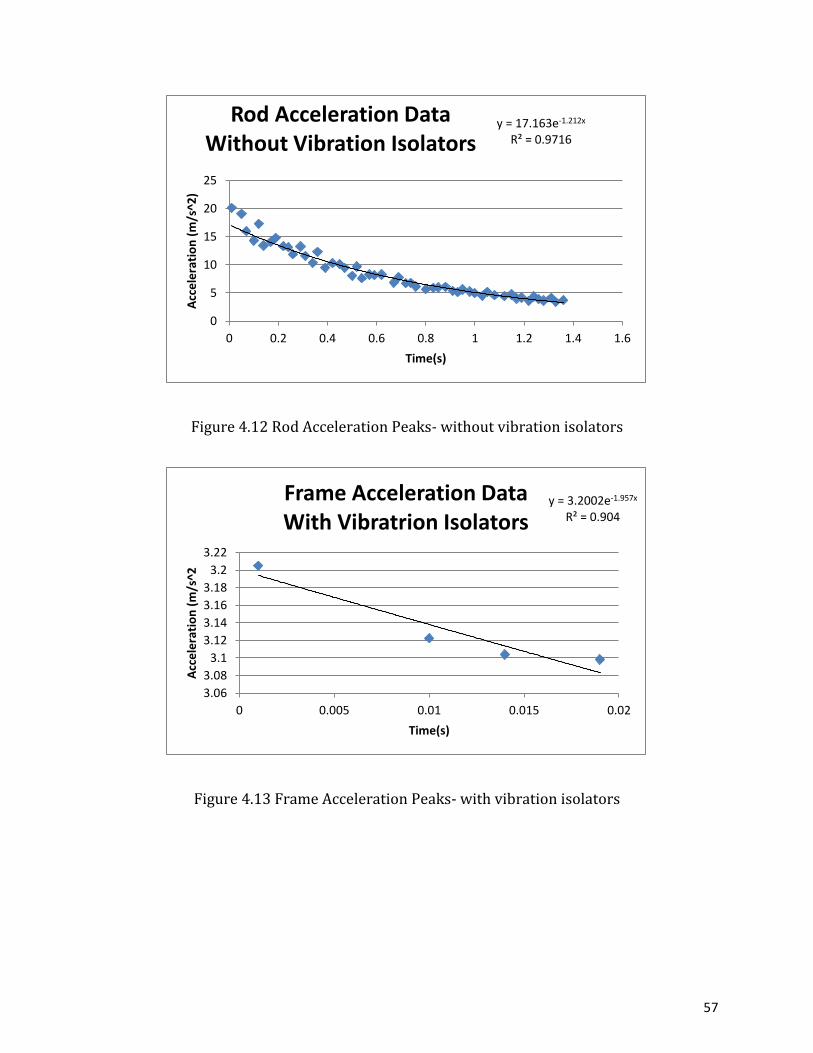
Figure 4.12 Rod Acceleration Peaks- without vibration isolators
Figure 4.13 Frame Acceleration Peaks- with vibration isolators
y = 17.163e-1.212x R² = 0.9716
0
5
10
15
20
25
0 0.2 0.4 0.6 0.8 1 1.2 1.4 1.6
Acc
ele
rati
on
(m
/s^2
)
Time(s)
Rod Acceleration Data Without Vibration Isolators
y = 3.2002e-1.957x R² = 0.904
3.06
3.08
3.1
3.12
3.14
3.16
3.18
3.2
3.22
0 0.005 0.01 0.015 0.02
Acc
ele
rati
on
(m
/s^2
Time(s)
Frame Acceleration Data With Vibratrion Isolators
58
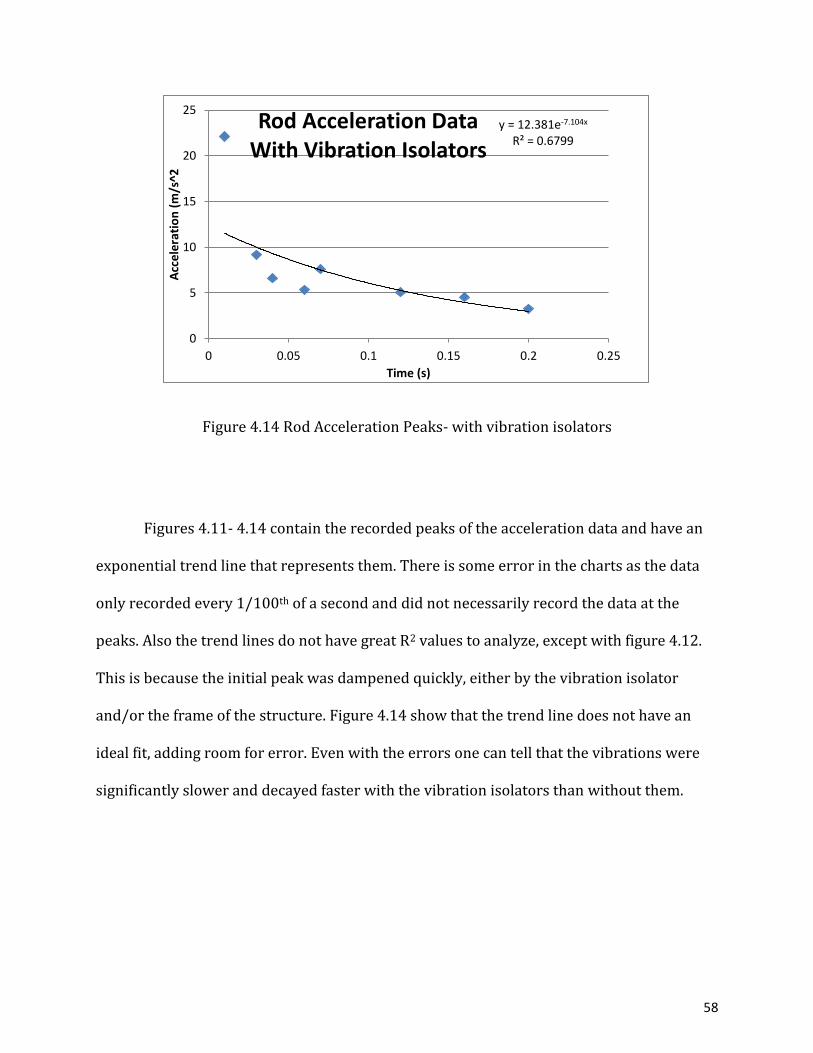
Figure 4.14 Rod Acceleration Peaks- with vibration isolators
Figures 4.11- 4.14 contain the recorded peaks of the acceleration data and have an
exponential trend line that represents them. There is some error in the charts as the data
only recorded every 1/100th of a second and did not necessarily record the data at the
peaks. Also the trend lines do not have great R2 values to analyze, except with figure 4.12.
This is because the initial peak was dampened quickly, either by the vibration isolator
and/or the frame of the structure. Figure 4.14 show that the trend line does not have an
ideal fit, adding room for error. Even with the errors one can tell that the vibrations were
significantly slower and decayed faster with the vibration isolators than without them.
y = 12.381e-7.104x R² = 0.6799
0
5
10
15
20
25
0 0.05 0.1 0.15 0.2 0.25
Acc
ele
rati
on
(m
/s^2
Time (s)
Rod Acceleration Data With Vibration Isolators
59
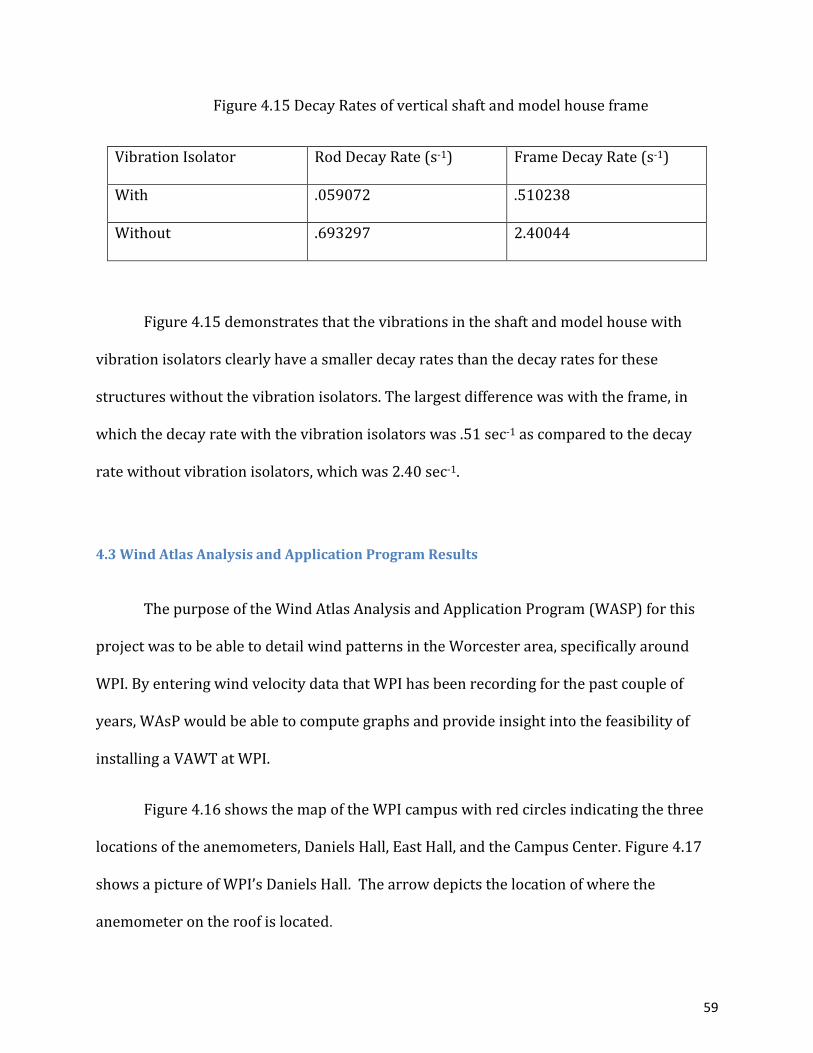
Figure 4.15 Decay Rates of vertical shaft and model house frame
Vibration Isolator Rod Decay Rate (s-1) Frame Decay Rate (s-1)
With .059072 .510238
Without .693297 2.40044
Figure 4.15 demonstrates that the vibrations in the shaft and model house with
vibration isolators clearly have a smaller decay rates than the decay rates for these
structures without the vibration isolators. The largest difference was with the frame, in
which the decay rate with the vibration isolators was .51 sec-1 as compared to the decay
rate without vibration isolators, which was 2.40 sec-1.
4.3 Wind Atlas Analysis and Application Program Results
The purpose of the Wind Atlas Analysis and Application Program (WASP) for this
project was to be able to detail wind patterns in the Worcester area, specifically around
WPI. By entering wind velocity data that WPI has been recording for the past couple of
years, WAsP would be able to compute graphs and provide insight into the feasibility of
installing a VAWT at WPI.
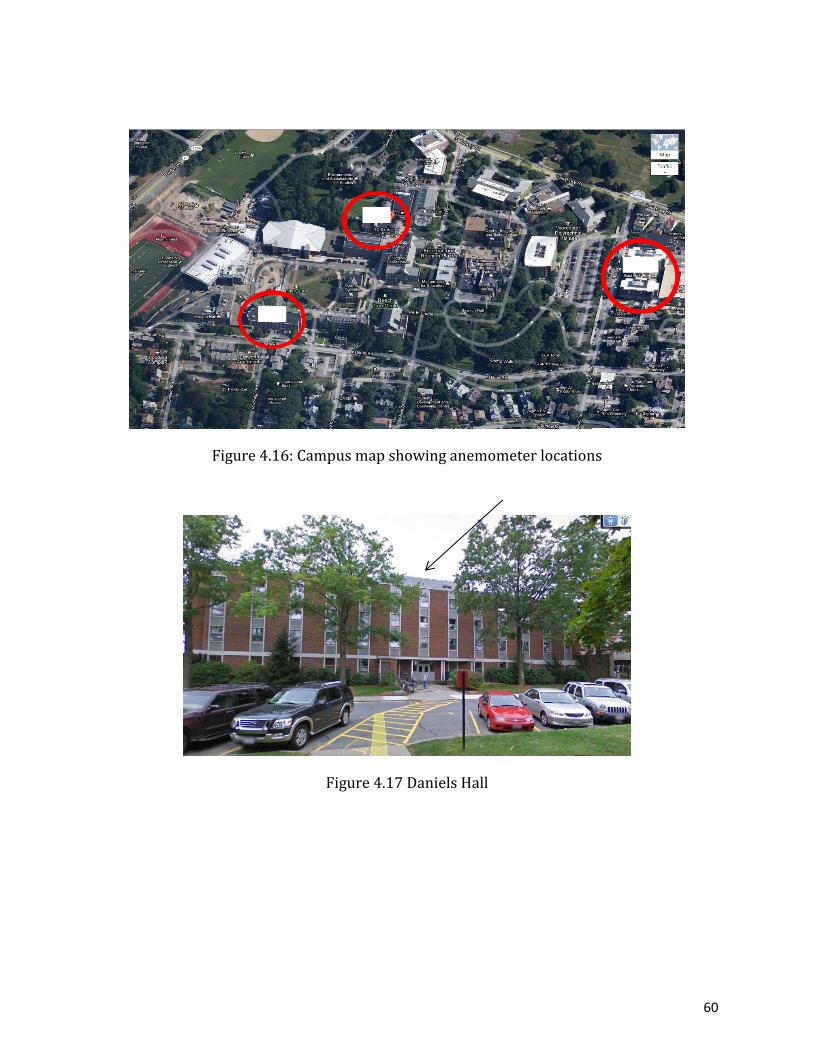
Figure 4.16 shows the map of the WPI campus with red circles indicating the three
locations of the anemometers, Daniels Hall, East Hall, and the Campus Center. Figure 4.17
shows a picture of WPI’s Daniels Hall. The arrow depicts the location of where the
anemometer on the roof is located.
60
Figure 4.16: Campus map showing anemometer locations
Figure 4.17 Daniels Hall
61
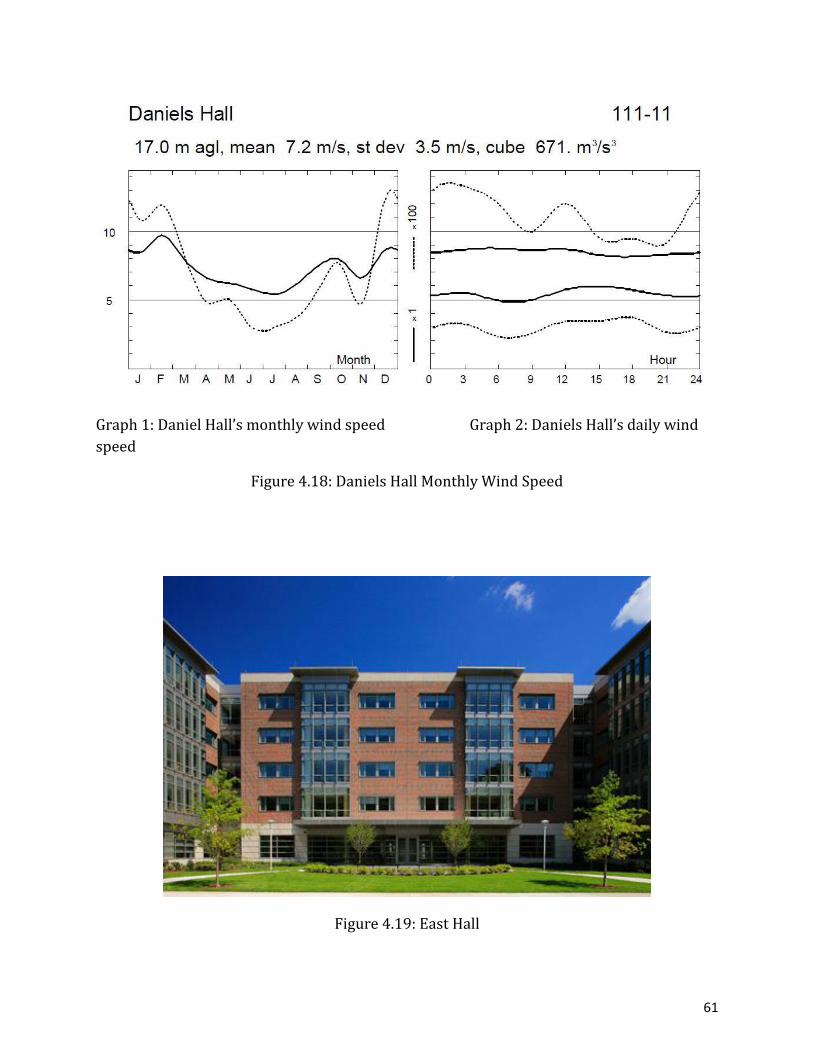
Graph 1: Daniel Hall’s monthly wind speed Graph 2: Daniels Hall’s daily wind
speed
Figure 4.18: Daniels Hall Monthly Wind Speed
Figure 4.19: East Hall
62
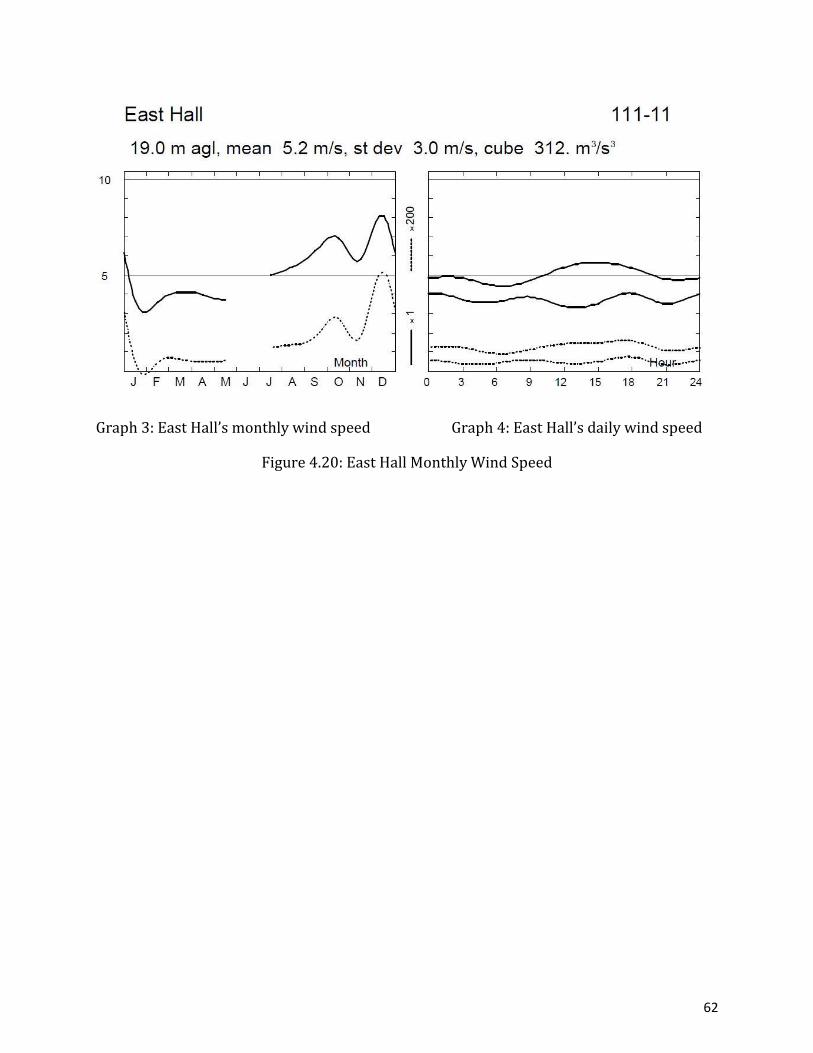
Graph 3: East Hall’s monthly wind speed Graph 4: East Hall’s daily wind speed
Figure 4.20: East Hall Monthly Wind Speed
63
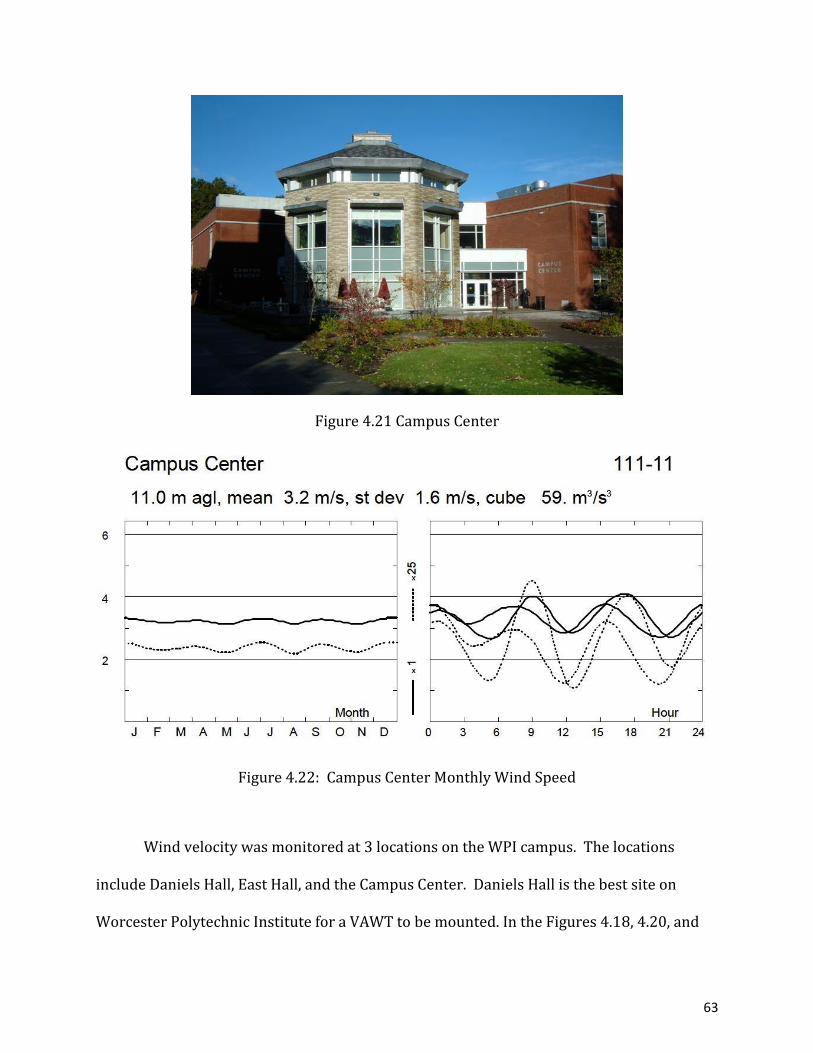
Figure 4.21 Campus Center
Figure 4.22: Campus Center Monthly Wind Speed
Wind velocity was monitored at 3 locations on the WPI campus. The locations
include Daniels Hall, East Hall, and the Campus Center. Daniels Hall is the best site on
Worcester Polytechnic Institute for a VAWT to be mounted. In the Figures 4.18, 4.20, and
64
4.22, WASP was used to develop plots of the wind data. These data are shown as dotted
lines and black lines. The dotted lines are the different wind speeds recorded in meters per
second and the black line are the average wind speeds in meters per second. In Figure 4.18;
Graph 1, shows the wind speeds throughout the year of 2011 and how the speeds change
over the months and Graph 2, shows the wind speeds on a daily basis. From the average
wind speed we can determine the average wind classifications and wind power, based on
the height of the anemometers. Daniels Hall’s wind speed average of 7.2 m/s is a class 3
wind speed. However, this value is very close to class 4 with an average wind density
around 400 W/m^2. This value is extremely promising for home wind turbine use.
East Hall falls into the wind class rating of 2 and the Campus Center has a rating of 1.
These are not good results for typical wind power production since class 4 is normally the
lowest class considered to have potential for typical home wind power generation. The
data show that improved enclosure and funnel design can be important since velocities in
these areas do not have substantial wind power generation potential.
65
5.0 Conclusions and Suggestions
From our research we were able to come up with many important conclusions and
suggestions which will benefit the future development of personal vertical axis wind
turbines. We were able to design a VAWT system that improved power output by 70% as
compared to the previous project. From our results we were able to recommend new
design aspects to improve the system and efficiency.
5.1 Turbine Design
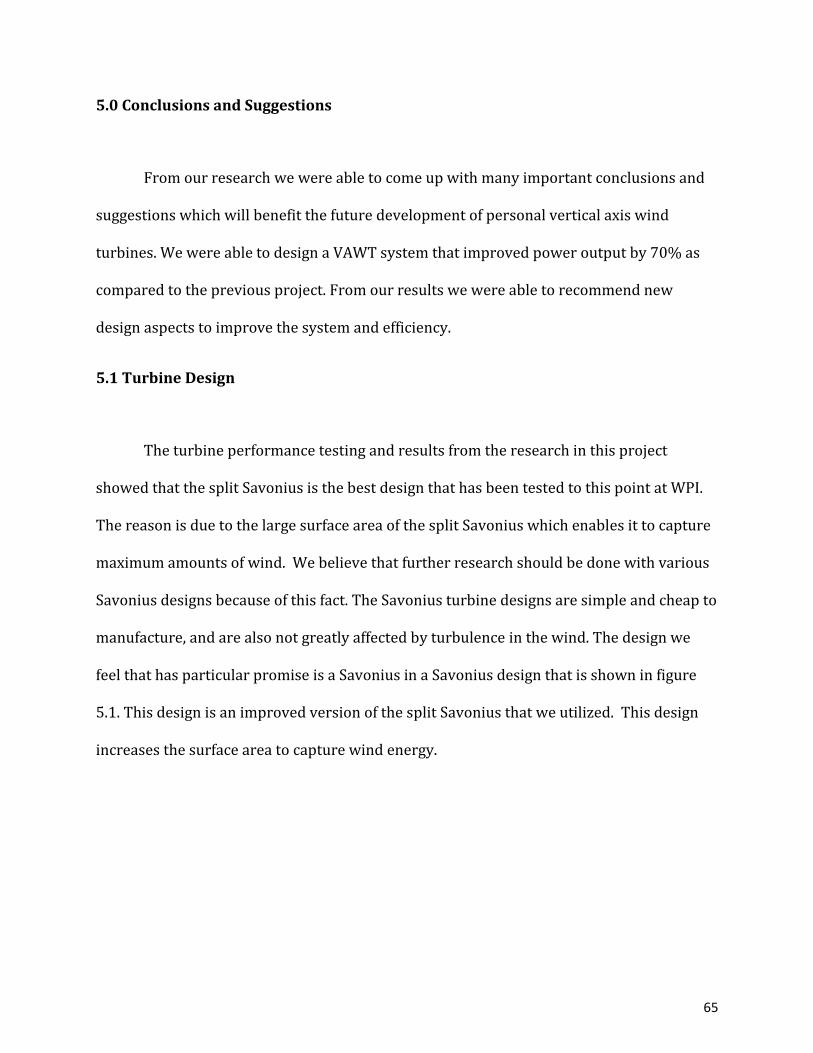
The turbine performance testing and results from the research in this project
showed that the split Savonius is the best design that has been tested to this point at WPI.
The reason is due to the large surface area of the split Savonius which enables it to capture
maximum amounts of wind. We believe that further research should be done with various
Savonius designs because of this fact. The Savonius turbine designs are simple and cheap to
manufacture, and are also not greatly affected by turbulence in the wind. The design we
feel that has particular promise is a Savonius in a Savonius design that is shown in figure
5.1. This design is an improved version of the split Savonius that we utilized. This design
increases the surface area to capture wind energy.
66
Figure 5.1 Savonius in Savonius design
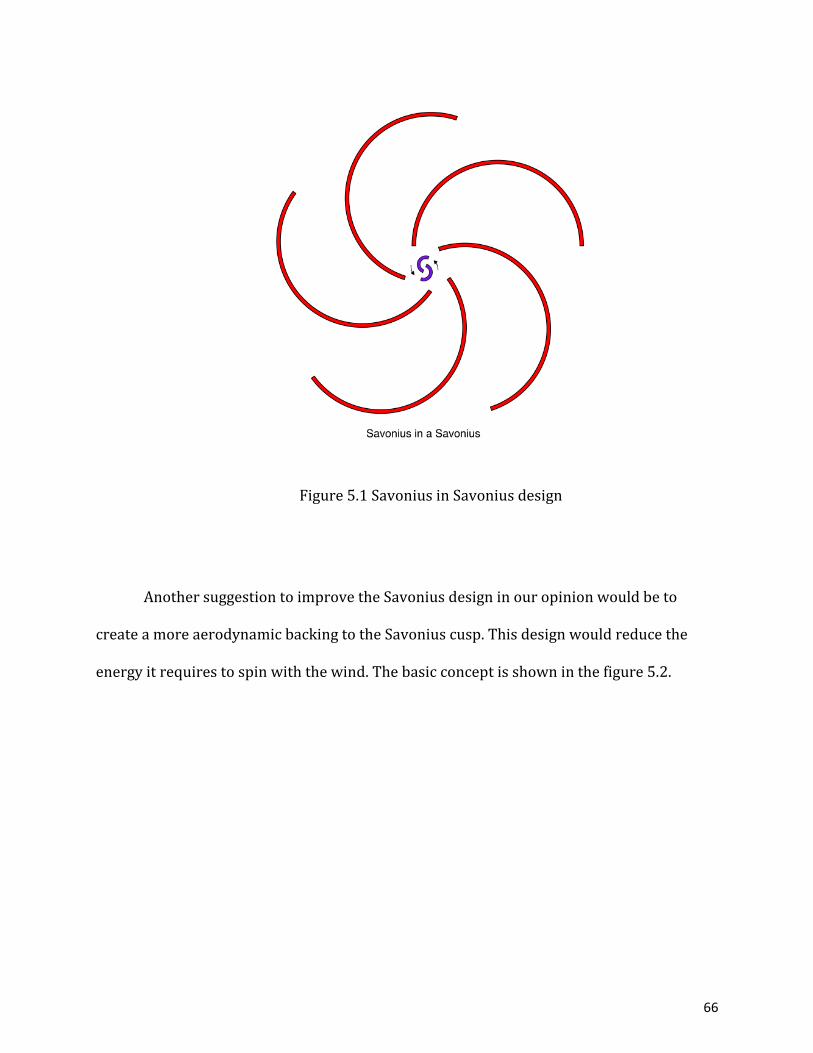
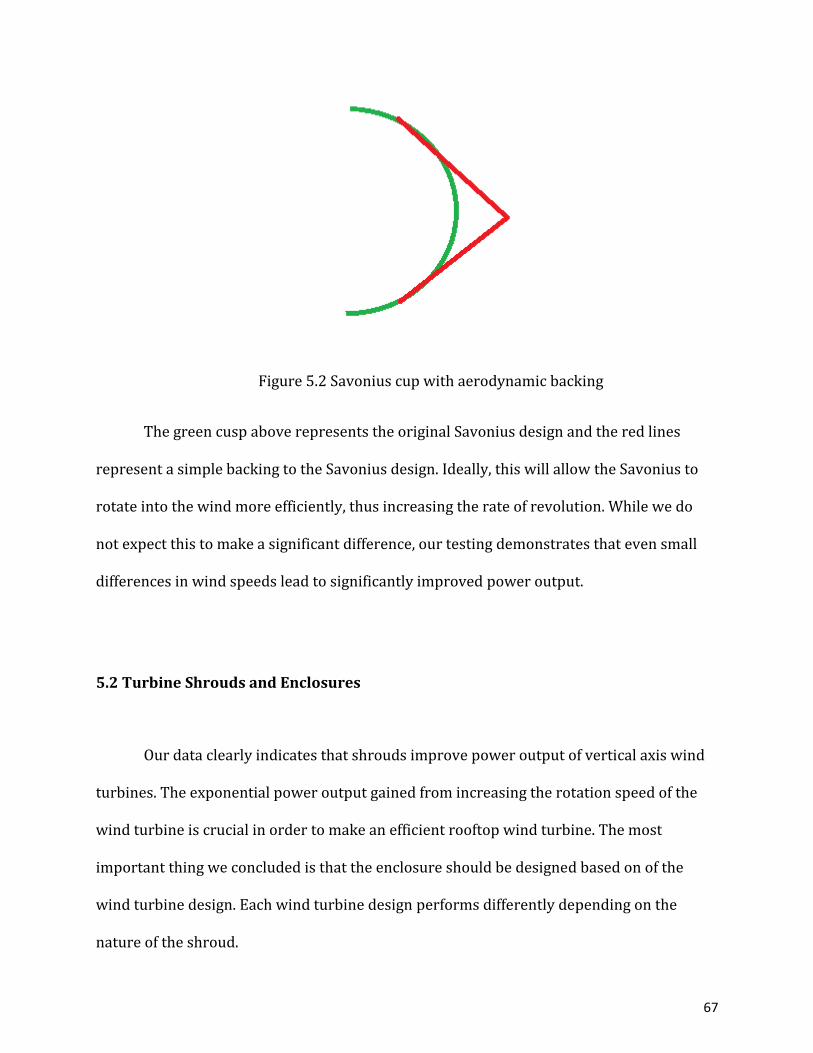
Another suggestion to improve the Savonius design in our opinion would be to
create a more aerodynamic backing to the Savonius cusp. This design would reduce the
energy it requires to spin with the wind. The basic concept is shown in the figure 5.2.
67
Figure 5.2 Savonius cup with aerodynamic backing
The green cusp above represents the original Savonius design and the red lines
represent a simple backing to the Savonius design. Ideally, this will allow the Savonius to
rotate into the wind more efficiently, thus increasing the rate of revolution. While we do
not expect this to make a significant difference, our testing demonstrates that even small
differences in wind speeds lead to significantly improved power output.
5.2 Turbine Shrouds and Enclosures
Our data clearly indicates that shrouds improve power output of vertical axis wind
turbines. The exponential power output gained from increasing the rotation speed of the
wind turbine is crucial in order to make an efficient rooftop wind turbine. The most
important thing we concluded is that the enclosure should be designed based on of the
wind turbine design. Each wind turbine design performs differently depending on the
nature of the shroud.
68
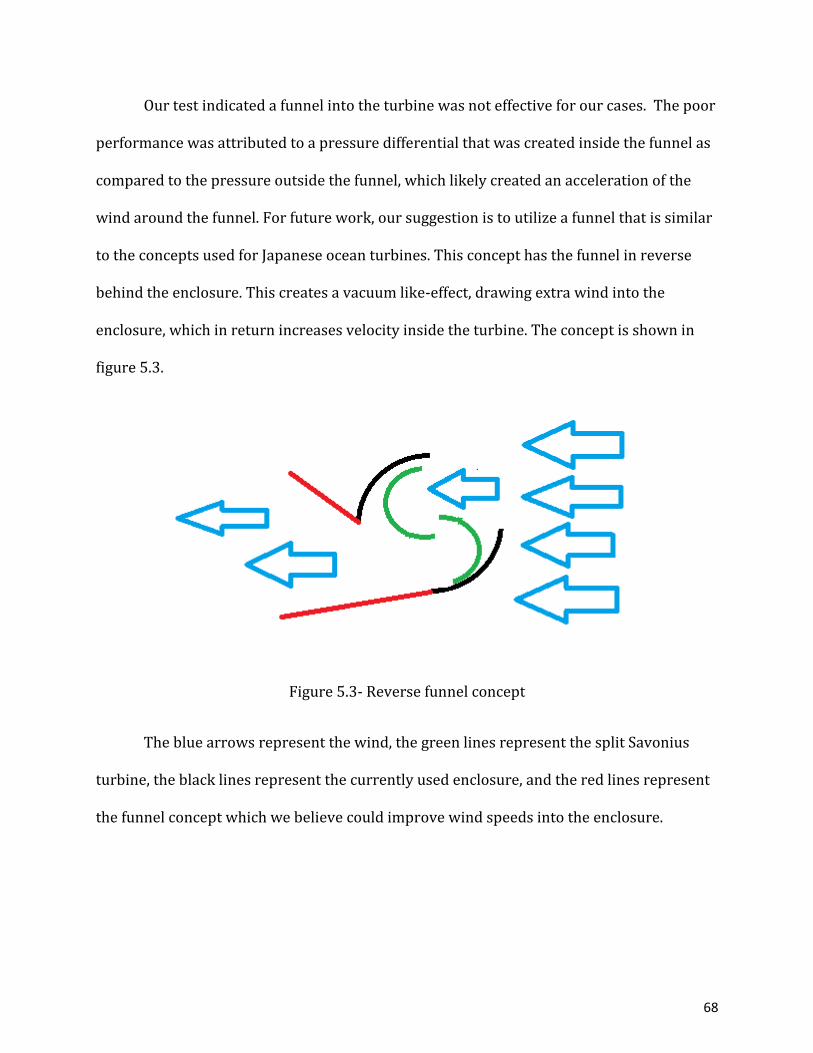
Our test indicated a funnel into the turbine was not effective for our cases. The poor
performance was attributed to a pressure differential that was created inside the funnel as
compared to the pressure outside the funnel, which likely created an acceleration of the
wind around the funnel. For future work, our suggestion is to utilize a funnel that is similar
to the concepts used for Japanese ocean turbines. This concept has the funnel in reverse
behind the enclosure. This creates a vacuum like-effect, drawing extra wind into the
enclosure, which in return increases velocity inside the turbine. The concept is shown in
figure 5.3.
Figure 5.3- Reverse funnel concept
The blue arrows represent the wind, the green lines represent the split Savonius
turbine, the black lines represent the currently used enclosure, and the red lines represent
the funnel concept which we believe could improve wind speeds into the enclosure.
69
5.3 Mounting System
The mounting system that this project used is considered a proactive design. This
means that the system tends to reduce vibrations after a vibration pulse is produced.
Future testing can be completed with a proactive design, which can include adding a
dampening system to turbine itself and trying to prevent the vibrations from occurring at
the source. Another suggestion is to consider different materials, such as neoprene or
silicon, which might be superior to a rubber vibration dampening system. The design used
in this project was a single stage dampening system, with the only dampening source
located at the base of the mount. Other research might want to consider multiple stages of
dampening at various sections of the mount.
A more advanced approach to completely eliminate vibrations would be using a
type of active vibration dampening system. This would be a very sophisticated system that
would actively eliminate vibrations from occurring in the system. This approach would
likely require some sort of energy to function and could possibly use more energy than the
wind turbine produces. Systems like this are being researched into but have not been used
on turbines. This would require a turbine that maximizes performance so it could
overcome the energy required to run an active vibration dampening system.
70
5.4 WAsP and Wind Power Potential
The WASP software package provided an approach for assessing wind velocities and
wind energy resource potential. An anemometer is a device for measuring wind speed, and
is a common weather station instrument. The WASP Climate Analyst can import data that
has been recorded from an anemometer to display these graphs. Throughout the year of
2011 the data collected from the anemometer stationed on top of Daniels Hall and East Hall
was provided to analyze wind patterns for potential VAWT installation. For future
recommendations, the data collected from the anemometer should be formatted to the
WASP software. If the format is set up correctly it can save time on converting the values
recorded. An anemometer that can measure direction can unlock the true potential of this
program because without it the WASP software. With the data, this software package can
also be used to develop more complete distributions of wind velocity and wind energy
resource potential.
5.4 Overview
Even though we were able to make improvements to the previous work that was
handed down to our group, there is a never ending process to always improve upon
inventions and new designs. Wind turbines are a start for society to lessen the damage
done to the earth by not using energy sources that produces pollution. Hopefully this
project was able to advance research and testing on VAWT systems and give insight for
other groups to complete further testing and improve efficiency and performance of
vertical axis wind turbines.
71
References
Saha, U. K., S. Thotla, and D. Maity. "Optimum design configuration of Savonius rotor through wind tunnel experiments." Journal of Wind Engineering and Industrial Aerodynamics 96.8 (2008): 1359-1375. F.L. Ponta, J.J. Seminara, A.D. Otero On the aerodynamics of variable-geometry oval-trajectory Darrieus wind turbines Renewable Energy, 32 (2007) J.D.K. Bishop, G.A.J. Amaratunga Evaluation of small wind turbines in distributed arrangement as sustainable wind energy option Energy Conversion and Management, 49 (2008), pp. 1652–1661 M.H. Mohamed, G. Janiga, E. Pap, D. Thévenin Optimal blade shape of a modified Savonius turbine using an obstacle shielding the returning blade Energy Conversion and Management, 52 (2011) Rehan Jamil, Zahid Hussain, Vertical axis wind turbine – A review of various configurations and design techniques, Renewable and Sustainable Energy Reviews, Volume 16, Issue 4, May 2012, (http://www.sciencedirect.com/science/article/pii/S136403211100596X) Tetsuya Wakui, Ryohei Yokoyama, Wind speed sensorless performance monitoring based on operating behavior for stand-alone vertical axis wind turbine, Renewable Energy, May 2013 (http://www.sciencedirect.com/science/article/pii/S0960148112006970) Daegyoum Kim, Morteza Gharib, Efficiency improvement of straight-bladed vertical-axis wind turbines with an upstream deflector, Journal of Wind Engineering and Industrial Aerodynamics, Volume 115, April 2013 (http://www.sciencedirect.com/science/article/pii/S0167610513000354) Islam Abohela, Neveen Hamza, Steven Dudek, Effect of roof shape, wind direction, building height and urban configuration on the energy yield and positioning of roof mounted wind turbines, Renewable Energy, Volume 50, February 2013 (http://www.sciencedirect.com/science/article/pii/S0960148112005381) Windterra, 2012 http://www.windterra.com/Windterra%20V5_files/Page429.htm Howard, Clark National Geographic Daily News, August 20, 2012 http://news.nationalgeographic.com/news/energy/2012/08/120820-helix-wind-collapse/
72
Rao, Singiresu S., and Fook Fah Yap. Mechanical vibrations. Vol. 4. Reading, MA: Addison Wesley, 1995. Jureczko, M. E. Z. Y. K., M. Pawlak, and A. Mężyk. "Optimisation of wind turbine blades." Journal of Materials Processing Technology 167.2 (2005): 463-471. Lu, Lin, Hongxing Yang, and John Burnett. "Investigation on wind power potential on Hong Kong islands—an analysis of wind power and wind turbine characteristics." Renewable Energy 27.1 (2002): 1-12. Ciang, Chia Chen, Jung-Ryul Lee, and Hyung-Joon Bang. "Structural health monitoring for a wind turbine system: a review of damage detection methods." Measurement Science and Technology 19.12 (2008): 122001.