
Ventilation System Effectiveness and Tested Indoor Air ... · Ventilation System Effectiveness and...
100
Ventilation System Effectiveness and Tested Indoor Air Quality Impacts Armin Rudd and Daniel Bergey Building Science Corporation February 2014
Transcript of Ventilation System Effectiveness and Tested Indoor Air ... · Ventilation System Effectiveness and...

Ventilation System Effectiveness and Tested Indoor Air Quality Impacts
Armin Rudd and Daniel Bergey Building Science Corporation
February 2014

NOTICE
This report was prepared as an account of work sponsored by an agency of the United States government. Neither the United States government nor any agency thereof, nor any of their employees, subcontractors, or affiliated partners makes any warranty, express or implied, or assumes any legal liability or responsibility for the accuracy, completeness, or usefulness of any information, apparatus, product, or process disclosed, or represents that its use would not infringe privately owned rights. Reference herein to any specific commercial product, process, or service by trade name, trademark, manufacturer, or otherwise does not necessarily constitute or imply its endorsement, recommendation, or favoring by the United States government or any agency thereof. The views and opinions of authors expressed herein do not necessarily state or reflect those of the United States government or any agency thereof.
Available electronically at http://www.osti.gov/bridge
Available for a processing fee to U.S. Department of Energy and its contractors, in paper, from:
U.S. Department of Energy Office of Scientific and Technical Information
P.O. Box 62 Oak Ridge, TN 37831-0062
phone: 865.576.8401 fax: 865.576.5728
email: mailto:[email protected]
Available for sale to the public, in paper, from: U.S. Department of Commerce
National Technical Information Service 5285 Port Royal Road Springfield, VA 22161 phone: 800.553.6847
fax: 703.605.6900 email: [email protected]
online ordering: http://www.ntis.gov/ordering.htm
Printed on paper containing at least 50% wastepaper, including 20% postconsumer waste

iii
Ventilation System Effectiveness and
Tested Indoor Air Quality Impacts
Prepared for:
The National Renewable Energy Laboratory
On behalf of the U.S. Department of Energy’s Building America Program
Office of Energy Efficiency and Renewable Energy
15013 Denver West Parkway
Golden, CO 80401
NREL Contract No. DE-AC36-08GO28308
Prepared by:
Armin Rudd and Daniel Bergey
Building Science Corporation
30 Forest Street
Somerville, MA 02143
NREL Technical Monitor: Cheryn Metzger
Prepared under Subcontract No. KNDJ-0-40337-03
February 2014
iv
[This page left blank]

v
Contents List of Figures .......................................................................................................................... vi List of Tables .......................................................................................................................... viii Definitions ................................................................................................................................ ix Acknowledgments .................................................................................................................... x Executive Summary ................................................................................................................. xi 1 Problem Statement .............................................................................................................. 1
1.1 Introduction ...................................................................................................................................... 1 1.2 Background ...................................................................................................................................... 1
1.2.1 Research Questions ............................................................................................................. 3 1.3 Relevance to Building America’s Goals .......................................................................................... 3 1.4 Cost Effectiveness ............................................................................................................................ 4 1.5 Tradeoffs and Other Benefits ........................................................................................................... 8
2 Previous Research .............................................................................................................. 9 3 Test and Analysis Method ................................................................................................ 10
3.1 Description of the Test Houses ...................................................................................................... 10 3.2 HVAC System Modifications and Pretesting ................................................................................ 13 3.3 Testing Approach ........................................................................................................................... 15
3.3.1 Baseline Test ..................................................................................................................... 18 3.3.2 Exhaust Test ...................................................................................................................... 18 3.3.3 Exhaust With Mixing Test ................................................................................................ 18 3.3.4 Central Fan Integrated Supply Test .................................................................................. 19 3.3.5 Energy Recovery Ventilator Test ...................................................................................... 19
3.4 Building Enclosure, Central Air Distribution System, and Ventilation Systems Characterization 19 3.5 Per-Fluorocarbon Tracer Gas Testing ............................................................................................ 19 3.6 Airborne Particulate Sampling ....................................................................................................... 22 3.7 Volatile Organic Compound Sampling .......................................................................................... 24 3.8 Formaldehyde Sampling ................................................................................................................ 25
4 Discussion of Results ....................................................................................................... 26 4.1 Building Air Leakage Characterization ......................................................................................... 26
4.1.1 Fan Pressurization Tests ................................................................................................... 26 4.2 HVAC Characterization ................................................................................................................. 26 4.3 Per-Fluorocarbon Tracer Gas testing ............................................................................................. 29
4.3.1 Zone Air Change Rates ..................................................................................................... 29 4.3.2 Interzonal Airflows ........................................................................................................... 33
4.4 Airborne Particulate Sampling ....................................................................................................... 42 4.5 Formaldehyde Sampling ................................................................................................................ 53 4.6 Volatile Organic Compound Sampling .......................................................................................... 56
5 Summary of Results .......................................................................................................... 67 6 Author Recommendations ................................................................................................ 70
6.1 Relevant Issues With ASHRAE Standard 62.2 ............................................................................. 70 6.1.1 Source of Outside Air ....................................................................................................... 70 6.1.2 Ventilation Effectiveness .................................................................................................. 71
6.2 Recommendations for Ventilation Rates ....................................................................................... 72 References .............................................................................................................................. 76 Appendix A: Listing of All Top 20 Volatile Organic Compounds Found, and Their
Functional Descriptions.................................................................................................... 78 Appendix B: Preliminary CONTAM Model ............................................................................. 82

vi
List of Figures Figure 1. Energy savings and costs: vented attic, 5% duct leakage ..................................................... 7 Figure 2. Energy savings and costs: vented attic, no duct leakage ...................................................... 7 Figure 3. Energy savings and costs: unvented attic, no duct leakage ................................................. 8 Figure 5. Location and directions to the test homes at University of Texas-Tyler ............................ 10 Figure 5. House 1 vented attic (left) and House 2 unvented attic (right) ............................................. 11 Figure 6. Exterior photos of the test homes at the UT-Tyler; House 1 has the darker roof ............. 11 Figure 7. Energy recovery ventilator (ERV) installed in House 1 to match that of House 2 ............. 12 Figure 9. Wye'd outside air duct, airflow stations, and inline fan for retrofitting a central fan
integrated supply (CFIS) ventilation system in each attic (left); setting the CFIS airflow rate with Iris damper airflow station (top); fan timer and relay arrangement (bottom) ...................... 13
Figure 9. Test house floor plan ................................................................................................................ 14 Figure 10. House 1 temperature and RH in indoor zones and outdoors during each test period .... 16 Figure 11. House 2 temperature and RH in indoor zones and outdoors during each test period .... 17 Figure 12. Wind speed during each of the test periods; green and red markers indicate start and
stop of the 12-hour sampling periods .............................................................................................. 17 Figure 13. House 2 main zone with PFT source tripod on left and sampling station tripod on right21 Figure 14. PFT source (left) and primary and backup CATS (right) .................................................... 22 Figure 15. Cumulative particle counts for six particle sizes during the baseline test in House 2,
main zone; results show impact on large particle counts due to human disturbance 1.5 hours before end of sampling period .......................................................................................................... 23
Figure 16. Test fixture tripod holding (left to right in photos) HCHO sample pump, temperature and relative humidity data logger, PFT sample tubes (CATS), airborne particulate counter, and VOC sampling pump .......................................................................................................................... 23
Figure 17. VOC sampling pump and solid sorbent sample tube; airborne particulate counter on top of sampling fixture ....................................................................................................................... 24
Figure 18. Air change rates in the living space zones for House 1, for the baseline test and four different ventilation systems ............................................................................................................. 30
Figure 19. Measured air change rates in the garage and attic zones for House 1, for different ventilation systems ............................................................................................................................ 31
Figure 20. Air change rates in the living space zones for House 2 (unvented attic), for the baseline test and four different ventilation systems, showing the same trends as House 1 .................... 32
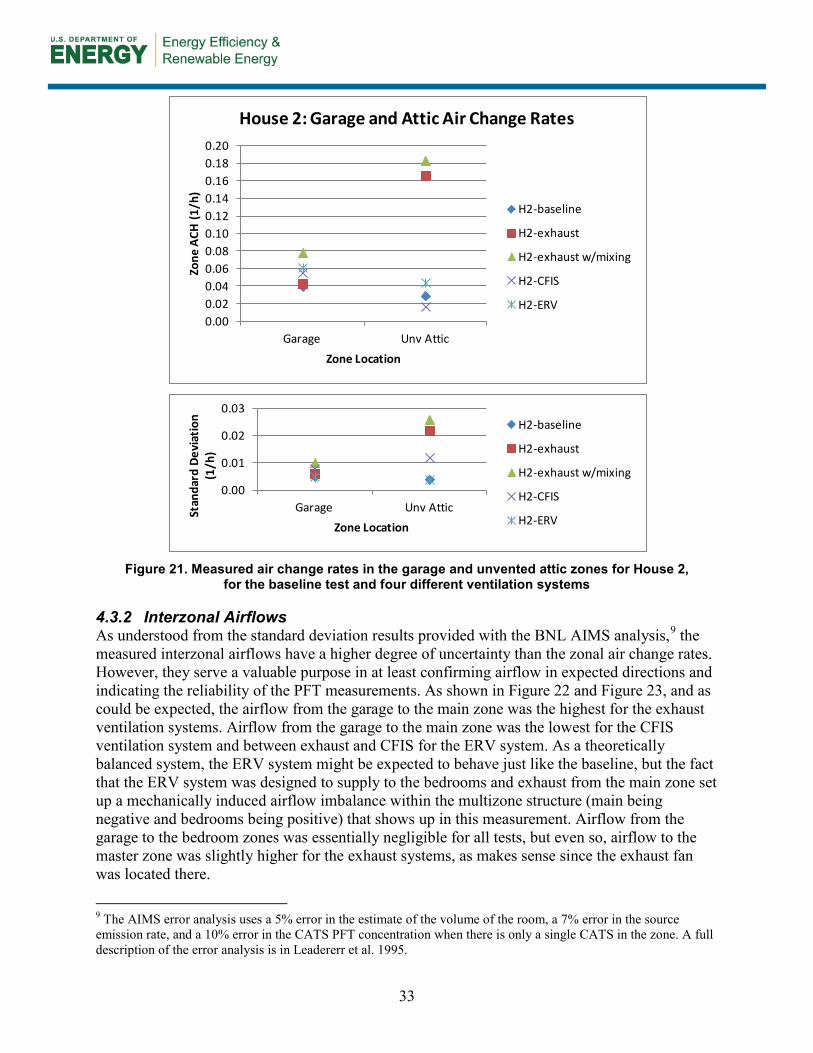
Figure 21. Measured air change rates in the garage and unvented attic zones for House 2, for the baseline test and four different ventilation systems ...................................................................... 33
Figure 22. Airflow from garage to living area zones in House 1, for the baseline test and four different ventilation systems ............................................................................................................. 34
Figure 23. Airflow from garage to living area zones in House 2, for the baseline test and four different ventilation systems, showing the same trends as House 1 ........................................... 35
Figure 24. Airflow from attic to living area zones in House 1, for the baseline test and four different ventilation systems ............................................................................................................. 36
Figure 25. Airflow from attic to living area zones in House 2, for the baseline test and four different ventilation systems ............................................................................................................. 37
Figure 26. Backup CATS analyzed for QA/QC check; House 2, Test 2 (exhaust) .............................. 38 Figure 27. House 1 interzonal airflows for living space zones ............................................................. 39 Figure 28. House 1 reverse direction interzonal airflows for living space zones .............................. 40 Figure 29. House 2 interzonal airflows for living space zones ............................................................. 41 Figure 30. House 2 reverse direction interzonal airflows for living space zones .............................. 42 Figure 31. Cumulative particle counts for six particle sizes (0.3–10 micrometer) for the House1
main and master zones ...................................................................................................................... 45 Figure 32. Cumulative particle counts for six particle sizes (0.3–10 micrometer) for the House 2
main and master zones ...................................................................................................................... 47 Figure 33. Cumulative particle counts for six particle sizes (0.3–10 micrometer) for the attic and
garage zones for House 1 and House 2 ........................................................................................... 51 Figure 34. Cumulative particle counts for six particle sizes (0.3–10 micrometer) sampled outside

vii
on the first and last test days (test day 1 and test day 6) .............................................................. 52 Figure 35. Cumulative particle counts for six particle sizes (0.3–10.0 micron) for simultaneous
measurements made outside and inside during the H2 baseline test .......................................... 53 Figure 36. HCHO concentration measured in the main and master zones of House 1 and House 2
during the baseline test and four ventilation system tests ............................................................ 55 Figure 37. Attic and garage HCHO concentrations for both houses ................................................... 55 Figure 38. Concentrations of the top 11 VOCs found in the main zone of House 1, for the baseline
test and four different ventilation systems ...................................................................................... 57 Figure 39. Concentrations of the top 11 VOCs found in the master zone of House 1, for the
baseline test and four different ventilation systems ...................................................................... 57 Figure 40. Concentrations of the top 10 VOCs found in the main zone of House 2, for the baseline
test and four different ventilation systems ...................................................................................... 58 Figure 41. Concentrations of the top 10 VOCs found in House 2 master zone, for the baseline test
and four different ventilation systems ............................................................................................. 58 Figure 42. VOCs found in the attics of House 1 and House 2 .............................................................. 63 Figure 43. VOCs found in the garages of House 1 and House 2 .......................................................... 66 Figure 44 CONTAM Model of House 1 .................................................................................................... 86 Figure 45. CONTAM Model of House 2 ................................................................................................... 86
Unless otherwise noted, all figures were created by BSC.

viii
List of Tables Table 1. Calculations Showing That ASHRAE Standard 62.2-2013 Ventilation Fan Airflow Rates Are
About 40% Higher Than ASHRAE Standard 62.2-2010, Averaged Over a Range of Climates, Building Archetypes, and Building Airtightness ............................................................................... 2
Table 2. BEopt Simulations of the UT-Tyler Houses With Unvented Attic and Vented Attic, Showing Energy Consumption by End Use for Different Ventilation Systems and Ventilation Airflow Rates ...................................................................................................................................................... 5
Table 3. Test Number, Name, and Description of the Five Tests Conducted in Each House ........... 16 Table 4. Type and Number of Tracer Gas Sources Used in Each House and Test ............................ 20 Table 5. Physical Characteristics of the Test Houses ........................................................................... 26 Table 6. Typically Reported Blower Door Test Results For Each Test House ................................... 27 Table 7. Duct Leakage Tests .................................................................................................................... 28 Table 8. Central Air Distribution System (Heat Pump) Cooling Supply Airflows ............................... 28 Table 9. Ventilation System Airflow and Runtime Setup ...................................................................... 28 Table 10. Calculation of Differential Particle Counts Over the Range of 0.3–2.0 Micron; the Percent
Differences in Differential Counts Are Shown Compared to the Exhaust Ventilation System .. 48 Table 11. Cumulative Particle Counts Measured Outdoors and in the House 1 and House 2 Attics49 Table 12. Cumulative and Differential Particle Counts Measured Outdoors During Baseline Tests
on the First and Last Test Days ........................................................................................................ 50 Table 13. HCHO Concentrations in House 1 and House 2, for the Baseline Test and Four Different
Ventilation Systems ........................................................................................................................... 54 Table 14. TVOC by House, Zone, and Ventilation System .................................................................... 59 Table 15. TVOC Measurements in the Attic and Garage Zones of Both Houses ............................... 60 Table 16. VOCs Found in Both Attics, Sorted by High to Low Concentration in the House 2
Unvented Attic .................................................................................................................................... 61 Table 17. VOCs Found in Both Garages, Sorted by Highest to Lowest in the House 1 Garage ....... 64 Table 18. Recommended System Factors To Reduce Ventilation Fan Airflow Rates Relative to
ASHRAE Standard 62.2-2013 ............................................................................................................. 73 Table 19. Numerical Basis for the System Factors Shown in Table 18, Given as Percent Airflow
Rate Reduction for Each System Factor Category ......................................................................... 75 Table 20. Listing of All Top 20 Volatile Organic Compounds Found, and Their Functional
Descriptions ........................................................................................................................................ 79 Table 21. House 1 Guarded and Unguarded Fan Pressurization Test Results .................................. 83 Table 22. House 2 (Unvented Attic) Guarded and Unguarded Fan Pressurization Test Results ..... 84 Table 23. House 1 CONTAM Model Inputs .............................................................................................. 85 Table 24. House 2 CONTAM Model Inputs .............................................................................................. 86
Unless otherwise noted, all tables were created by BSC.

ix
Definitions
ach Air changes per hour ach50 Air changes per hour at 50 Pascal pressure differential AIMS Air Infiltration Measurement System ASHRAE American Society of Heating, Refrigerating and Air-Conditioning
Engineers ASTM American Society for Testing And Materials BeOpt™ Building Energy Optimization Program BNL Brookhaven National Laboratory BSC Building Science Corporation CATS Capillary Adsorption Tube Sampler CFIS Central fan integrated supply ventilation CFM 50 Cubic feet per minute at 50 Pascal test pressure differential CONTAM Contaminant transport computer program DOE U.S. Department of Energy EPA U.S. Environmental Protection Agency ERV Energy recovery ventilator HCHO Formaldehyde HUD U.S. Department of Housing and Urban Development HVAC Heating, ventilation, and air conditioning IMC International Mechanical Code MBC Minnesota Building Code MERV Minimum Efficiency Rating Value MPR Microparticle Performance Rating NBC National Building Code of Canada NREL National Renewable Energy Laboratory Pa Pascal; SI unit of pressure (equivalent to one newton/m2) PFT Per-Fluorocarbon Tracer QA Quality assurance QC Quality control RH Relative humidity UL-AQS Underwriters Laboratory - Air Quality Sciences Division UT-Tyler University of Texas-Tyler WAVIAQ Washington State Ventilation and Indoor Air Quality Code

x
Acknowledgments
The Texas Allergy, Indoor Environment, & Energy Institute at The University of Texas-Tyler, under direction of Roy Crawford, Ph.D. and John Vasselli, provided the two lab houses for this research. Dr. Crawford also participated in our efforts.
Appreciation is also extended to Fluke Corporation and Underwriters Laboratories Air Quality Sciences, Inc. for assisting financially with the airborne particle counting and volatile organic compound (VOC)/formaldehyde phases of the project. Thanks to Terry Sullivan at Brookhaven National Laboratory for his technical guidance with the Passive Fluorocarbon Tracer testing, and to Colin Olson of the Energy Conservatory for his consultations concerning the multizone fan pressurization testing.

xi
Executive Summary
Airtightness of new homes is critical to achieving low-energy consumption, healthy and comfortable spaces, and durability. Airtight homes require rational and predictable ventilation. A key gap and area of ongoing research is to allow credit for better performing ventilation systems. Building on previous research dealing with ventilation air distribution, this study added new elements of ventilation effectiveness research, accounting for source of outside air, particle contaminants, and VOC contaminants.
The study focused on the in-situ impacts of various ventilation systems, including the impacts of differing sources of outside air and the spatial distribution and filtration of ventilation air. The project involved testing two unoccupied, single-family, detached homes in Tyler, Texas that were constructed as lab homes at the University of Texas-Tyler.1 These twin lab homes offered a unique opportunity for the direct comparison of nearly identical homes except for one having a vented attic and the other having an unvented attic assembly (also known as sealed cathedralized attic).
Exhaust ventilation testing showed lower uniformity of outdoor air exchange rate between living space zones, and higher concentrations of particulates, formaldehyde, and other Top 20 VOCs than did the supply and balanced ventilation systems. This showed that single-point exhaust ventilation was inferior as a whole-house ventilation strategy because the source of outside air was not directly from outside (much of it came from the attic), the ventilation air was not distributed, and no provision existed for air filtration. Indoor air recirculation by a central air distribution system can help improve the exhaust ventilation system by way of air mixing and filtration. In contrast, the supply and balanced ventilation systems showed that there is a significant benefit to drawing outside air from a known outside location, and filtering and fully distributing that air.
The central fan integrated supply (CFIS) ventilation system showed an 85% and 73% reduction in 0.3–2.0 micron particles for House 1 and House 2, respectively, attributable to recirculation air filtration by operation of the central air distribution system.
Total volatile organic compound (TVOC) data showed that, compared to the exhaust system, the CFIS and energy recovery ventilation systems reduced TVOCs by 47% and 57%, respectively, averaged between the two houses. Compared to the baseline tests, the exhaust system increased TVOCs by 37% in the House 1 main zone, and increased TVOCs by 18% in the House 2 master zone. This highlights that the unknown air path, or source of outside air, for the exhaust ventilation system can cause indoor air to be more contaminated depending on what contaminants are picked up on the way in.
The author of this report believes that these new data support ventilation rate credits for better performing ventilation systems. The recommendations in this report for the ASHRAE 62.2 committee intend to provide specific guidance for understanding whole-building ventilation system effectiveness, which is critical to promoting the best low energy and high value ventilation solutions.
1 Learn more at www.UT Tyler.edu/TxAIRE/Technology/Houses

xii
Ventilation system factors recommended by the author, based on the results of this study could be applied to ASHRAE 62.2 standards to account for ventilation system attributes that improve the system’s performance. Application of these recommendations would yield energy savings and reduced moisture control risk in humid climates, without compromising indoor air quality relative to the exhaust systems (currently allowed by ASHRAE Standard 62.2-2013). Such ventilation rate credits would also benefit the U.S. Environmental Protection Agency Indoor Air Program and the U.S. Department of Energy Challenge Home.

1
1 Problem Statement
1.1 Introduction This study focuses on the in-situ impacts of various ventilation systems, including the impacts of differing sources of outside air and the spatial distribution and filtration of ventilation air. The project involved testing two unoccupied, single-family, detached homes in Tyler, Texas that were constructed as lab homes at the University of Texas-Tyler (UT-Tyler).2 These twin lab homes offered a unique opportunity for the direct comparison of nearly identical homes except for one having a vented attic and the other having an unvented attic assembly (also known as sealed cathedralized attic).
1.2 Background The residential building sector consumes approximately 21% of the primary energy used in the United States. Energy consumption due to ventilation needs is increasingly becoming a high percentage of total space conditioning energy consumption. Accounting for better performing ventilation systems is a reasonable step in the effort to reduce energy consumption without compromising indoor air quality, comfort, or durability.
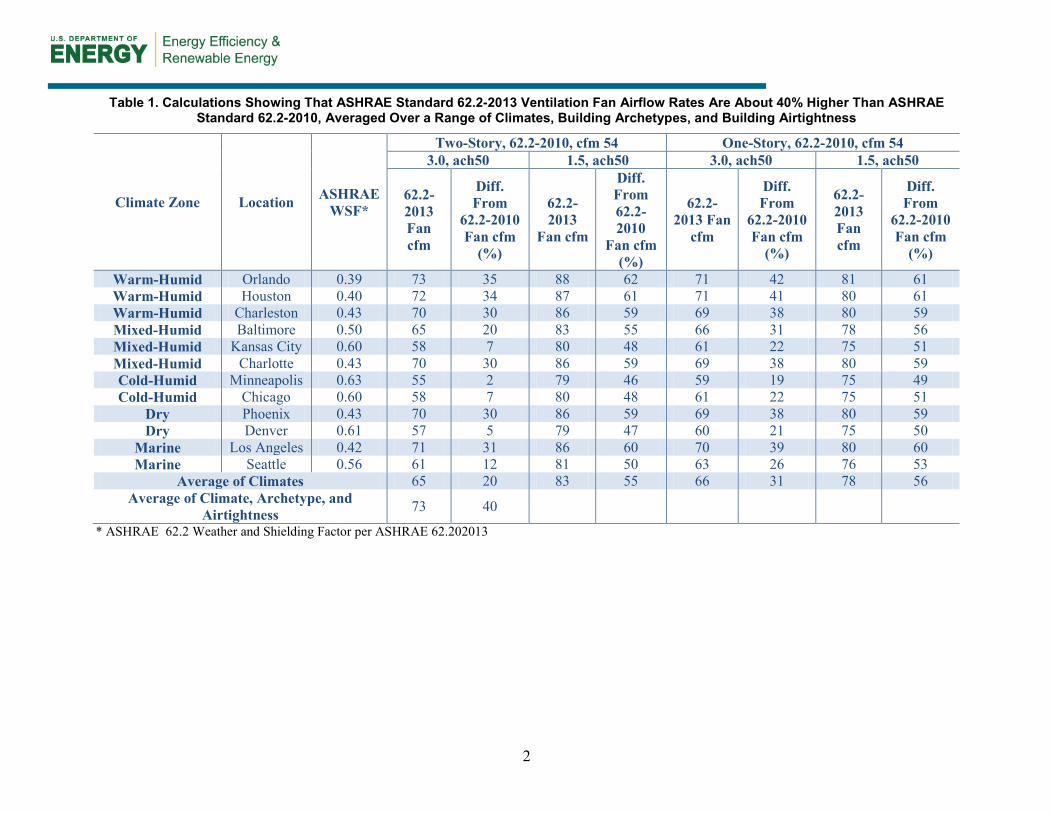
Airtightness of new homes is critical to achieving low energy consumption, healthy spaces, and durability. Airtight homes require rational and predictable ventilation. A key area of ongoing research is the ventilation airflow rates of the ASHRAE Standard 62.2-2013, having about 40% higher airflow requirement relative to ASHRAE Standard 62.2-2010; see ). Identifying methods to reduce energy consumption, improve humidity control performance, and improve indoor air quality would benefit the U.S. Environmental Protection Agency (EPA) Indoor Air Program required by the U.S. Department of Energy (DOE) Challenge Home. This author believes that research should be conducted into methods that include considerations for:
• Accounting for the quality of the source of outside air for different ventilation systems types.
• Accounting for ventilation air distribution effectiveness.
• Managing hazardous indoor air pollutants in ways other than air change.
2 Learn more at www.UT Tyler.edu/TxAIRE/Technology/Houses
2
Table 1. Calculations Showing That ASHRAE Standard 62.2-2013 Ventilation Fan Airflow Rates Are About 40% Higher Than ASHRAE Standard 62.2-2010, Averaged Over a Range of Climates, Building Archetypes, and Building Airtightness
Climate Zone Location ASHRAE WSF*
Two-Story, 62.2-2010, cfm 54 One-Story, 62.2-2010, cfm 54 3.0, ach50 1.5, ach50 3.0, ach50 1.5, ach50
62.2-2013 Fan cfm
Diff. From
62.2-2010 Fan cfm
(%)
62.2-2013
Fan cfm
Diff. From 62.2-2010
Fan cfm (%)
62.2-2013 Fan
cfm
Diff. From
62.2-2010 Fan cfm
(%)
62.2-2013 Fan cfm
Diff. From
62.2-2010 Fan cfm
(%)
Warm-Humid Orlando 0.39 73 35 88 62 71 42 81 61 Warm-Humid Houston 0.40 72 34 87 61 71 41 80 61 Warm-Humid Charleston 0.43 70 30 86 59 69 38 80 59 Mixed-Humid Baltimore 0.50 65 20 83 55 66 31 78 56 Mixed-Humid Kansas City 0.60 58 7 80 48 61 22 75 51 Mixed-Humid Charlotte 0.43 70 30 86 59 69 38 80 59 Cold-Humid Minneapolis 0.63 55 2 79 46 59 19 75 49 Cold-Humid Chicago 0.60 58 7 80 48 61 22 75 51
Dry Phoenix 0.43 70 30 86 59 69 38 80 59 Dry Denver 0.61 57 5 79 47 60 21 75 50
Marine Los Angeles 0.42 71 31 86 60 70 39 80 60 Marine Seattle 0.56 61 12 81 50 63 26 76 53
Average of Climates 65 20 83 55 66 31 78 56 Average of Climate, Archetype, and
Airtightness 73 40
* ASHRAE 62.2 Weather and Shielding Factor per ASHRAE 62.202013

3
1.2.1 Research Questions The research presented in this report is intended to help develop a better understanding of whole-building ventilation system effectiveness and distribution in low energy homes, which is critical to promoting the best low-energy and high-value ventilation solutions. Building Science Corporation (BSC) seeks to address the following research questions:
1. Do different whole-building ventilation systems perform significantly differently in terms of their ability to deliver uncontaminated ventilation air to the occupants?
2. What measurements and testing protocols are needed to appropriately account for the source of outside air relevant to occupant exposure to chemical and particulate contaminants and their expected satisfaction with indoor air in residential environments?
3. What is the overall indoor air quality impact of operating an exhaust whole-building ventilation system versus supply and balanced ventilation?
4. For whole-building ventilation systems that do not draw outside air directly from a known fresh air source, how much of the ventilation air is drawn through potentially contaminated adjacent spaces such as garages and vented attics?
5. What is the impact of drawing outdoor air through the building enclosure and adjacent unoccupied spaces on the level of particulate contaminants within the conditioned space?
6. What is the level of chemical contaminants within the conditioned space and adjacent spaces, and the impact of drawing outdoor air through the building enclosure and adjacent unoccupied spaces? What is the impact of drawing outdoor air through the building enclosure and adjacent unoccupied spaces on the level of chemical contaminants within the conditioned space?
1.3 Relevance to Building America’s Goals Overall, the goal of the DOE Building America program is to “reduce home energy use by 30%–50% (compared to 2009 energy codes for new homes and pre-retrofit energy use for existing homes).” To this end, we conduct research to “develop market-ready energy solutions that improve efficiency of new and existing homes in each U.S. climate zone, while increasing comfort, safety, and durability.”3
The combination of air-sealed building enclosures and controlled mechanical ventilation is an effective means to reduce energy consumption while providing improved indoor air quality and comfort in residential buildings. The results of this research project will further inform the residential building community on how effective different whole-building ventilation systems are in meeting these necessary goals. The results presented here provide new data on in-field performance of mechanical ventilations systems. The data provide further understanding regarding whole-building ventilation system effectiveness, including the impacts of ventilation air distribution, the source of outside air, and particulate and VOC contaminant levels. This information is critical for developing strategies to encourage the lowest energy and highest value ventilation solutions.
3 www1.eere.energy.gov/buildings/building_america/program_goals.html

4
1.4 Cost Effectiveness Ventilation energy consumption is a significant part of the energy consumption and energy cost of low energy homes. Understanding whole-building ventilation system performance in low energy homes is critical to promoting the highest value ventilation solutions for reducing energy consumption while providing good indoor air quality and comfort for the occupants. Overventilation unnecessarily consumes energy and raises the risk of comfort and indoor air quality problems due to elevated indoor humidity in warm-humid climates. Higher performing ventilation systems may be able to eliminate unnecessary overventilation, thereby providing equal or improved indoor air quality and comfort at lower cost.
The BEopt™ (Building Energy Optimization) software provides capabilities to evaluate residential building designs and identify cost-optimal efficiency packages at various levels of whole-house energy savings (Christensen et al. 2006). Table 2 shows results from BEopt simulations of the 1475 ft2 UT-Tyler houses with an unvented attic and a vented attic. Energy consumption is listed by end use for different ventilation systems, and for ventilation airflow rates equal to the ASHRAE Standard 62.2-2010 rate and 50% of that for systems that draw the outside air from a known fresh air location, filter, and fully distribute that ventilation air to the breathing zone of the occupants. Energy cost was calculated at a rate of $0.103/kWh.
BEopt simulations for the UT-Tyler houses projected that ventilation accounts for 4%–6% of total energy consumption, and that ventilation accounts for 12%–22% of heating, ventilation, and air conditioning (HVAC) energy consumption. Reducing the ASHRAE 62.2-2010 ventilation rate by 50% (the basis for this is provided in Section 5) was projected to reduce HVAC energy used for conditioning ventilation air by 8% to 10%, and was projected to reduce total energy consumption by 2% to 3%. With ASHRAE 62.2-2013 ventilation rates being about 40% higher than ASHRAE Standard 62.2-2010, if ENERGY STAR® and the DOE Challenge Home programs were to reference the 2013 rates, then the savings would be higher.

5
Table 2. BEopt Simulations of the UT-Tyler Houses With Unvented Attic and Vented Attic, Showing Energy Consumption by End Use for Different Ventilation Systems and Ventilation Airflow Rates
1—Exhaust 100% 62.2
2—Supply 100% 62.2
3—ERV 100% 62.2
4—Supply 50% 62.2
5—ERV 50% 62.2
6—No Ventilation
Unvented Attic, No Duct Losses Source Energy Use (MBtu/yr) Miscellaneous (E) 37.56 37.56 37.56 37.56 37.56 37.56
Ventilation Fan (E) 1.66 1.66 4.97 0.96 2.62 0.25 Large Appliances (E) 20.25 20.25 20.25 20.25 20.25 20.25
Lights (E) 11.42 11.42 11.42 11.42 11.42 11.42 HVAC Fan/Pump (E) 2.81 2.84 2.79 2.69 2.72 2.61
Cooling (E) 16.73 16.79 16.61 16.07 16.18 15.53 Heating (E) 17.76 17.49 17.23 16.35 16.77 15.84
Hot Water (E) 26.05 26.05 26.05 26.05 26.05 26.05 Total 134.25 134.06 136.89 131.36 133.57 129.52
Ventilation % Total 4% 4% 6% 1% 3% 0% Diff 50% 62.2 Versus 100% 62.2 2% 3%
HVAC Subtotal 38.96 38.78 41.6 36.07 38.29 34.23 Ventilation % HVAC 14% 13% 22% 5% 12% 0%
Diff 50% 62.2 Versus 100% 62.2 8% 10% Vented Attic, 5% Duct Leakage Source Energy Use (MBtu/yr)
Miscellaneous (E) 37.56 37.56 37.56 37.56 37.56 37.56 Ventilation Fan (E) 1.66 1.66 4.97 0.96 2.62 0.25
Large Appliances (E) 20.25 20.25 20.25 20.25 20.25 20.25 Lights (E) 11.42 11.42 11.42 11.42 11.42 11.42
HVAC Fan/Pump (E) 3.34 3.48 3.27 3.2 3.21 3.08 Cooling (E) 18.47 18.8 18.46 17.98 18.04 17.41 Heating (E) 23.93 24.19 23.13 22.32 22.65 21.54
Hot Water (E) 26.05 26.05 26.05 26.05 26.05 26.05 Total 142.69 143.41 145.12 139.75 141.81 137.56
Ventilation % Total 4% 4% 5% 2% 3% 0% Diff 50% 62.2 Versus 100% 62.2 3% 2%
HVAC Subtotal 47.4 48.13 49.83 44.46 46.52 42.28 Ventilation % HVAC 12% 14% 18% 5% 10% 0%
Diff 50% 62.2 Versus 100% 62.2 9% 8%

6
Vented Attic, No Duct Losses Source Energy Use (MBtu/yr)
1—Exhaust 100% 62.2
2—Supply 100% 62.2
3—ERV 100% 62.2
4—Supply 50% 62.2
5—ERV 50% 62.2
6—No Ventilation
Miscellaneous (E) 37.56 37.56 37.56 37.56 37.56 37.56 Ventilation Fan (E) 1.66 1.66 4.97 0.96 2.62 0.25
Large Appliances (E) 20.25 20.25 20.25 20.25 20.25 20.25 Lights (E) 11.42 11.42 11.42 11.42 11.42 11.42
HVAC Fan/Pump (E) 2.5 2.53 2.47 2.37 2.4 2.28 Cooling (E) 13.78 13.88 13.73 13.22 13.32 12.72 Heating (E) 17.52 17.3 16.97 16.07 16.5 15.55
Hot Water (E) 26.05 26.05 26.05 26.05 26.05 26.05 Total 130.75 130.66 133.43 127.9 130.12 126.09
Ventilation % Total 4% 4% 6% 1% 3% 0% Diff 50% 62.2 Versus 100% 62.2 2% 3%
HVAC Subtotal 35.46 35.37 38.14 32.62 34.84 30.8 Ventilation % HVAC 15% 15% 24% 6% 13% 0%
Diff 50% 62.2 Versus 100% 62.2 9% 11%

7
Figure 1. Energy savings and costs: vented attic, 5% duct leakage
Figure 2. Energy savings and costs: vented attic, no duct leakage
Exhaust 100% 62.2
Supply 100% 62.2
ERV 100% 62.2
Supply 50% 62.2
ERV 50% 62.2
No Ventilation
1100
1150
1200
1250
1300
1350
1400
1450
-2 -1 0 1 2 3 4
Annu
alize
d En
ergy
Rel
ated
Cos
ts [$
]
Source Energy Savings [%/yr]
Exhaust 100% 62.2
Supply 100% 62.2
ERV 100% 62.2
Supply 50% 62.2
ERV 50% 62.2
No Ventilation1100
1150
1200
1250
1300
1350
1400
1450
-3 -2 -1 0 1 2 3 4
Annu
alize
d En
ergy
Rel
ated
Cos
ts [$
]
Source Energy Savings [%/yr]

8
Figure 3. Energy savings and costs: unvented attic, no duct leakage
1.5 Tradeoffs and Other Benefits Overventilation unnecessarily consumes energy and raises the risk of comfort and indoor air quality complaint problems due to elevated indoor humidity in warm-humid climates (Rudd and Henderson 2007). Higher performing ventilation systems may be able to eliminate unnecessary overventilation, thereby providing equal or improved indoor air quality and comfort at lower cost.
Exhaust 100% 62.2
Supply 100% 62.2
ERV 100% 62.2
Supply 50% 62.2
ERV 50% 62.2
No Ventilation
1000
1050
1100
1150
1200
1250
1300
1350
1400
1450
-3 -2 -1 0 1 2 3 4
Annu
alize
d En
ergy
Rel
ated
Cos
ts [$
]
Source Energy Savings [%/yr]

9
2 Previous Research
Significant work has been done by the BSC and others in the area of ventilation air distribution effectiveness under past Building America work, which has been directed toward changes to ASHRAE Standard 62.2. Field testing and CONTAM (Walton and Dols 2010) modeling associated with that work has shown that ventilation air distribution effectiveness varies widely between ventilation systems (Rudd and Lstiburek 2000; Rudd and Lstiburek 2001; Hendron et al. 2006; Hendron et al. 2007; Rudd and Lstiburek 2008; Townsend et al. 2009a; Townsend et al. 2009b). This author has found that utilizing high performing systems that draw outside air from a known fresh air location, and filter and fully distribute that air to the occupants breathing zone (including bedrooms where occupants spend the most continuous time), allows for optimization of the ventilation rate to avoid problems of overventilation.

10
3 Test and Analysis Method
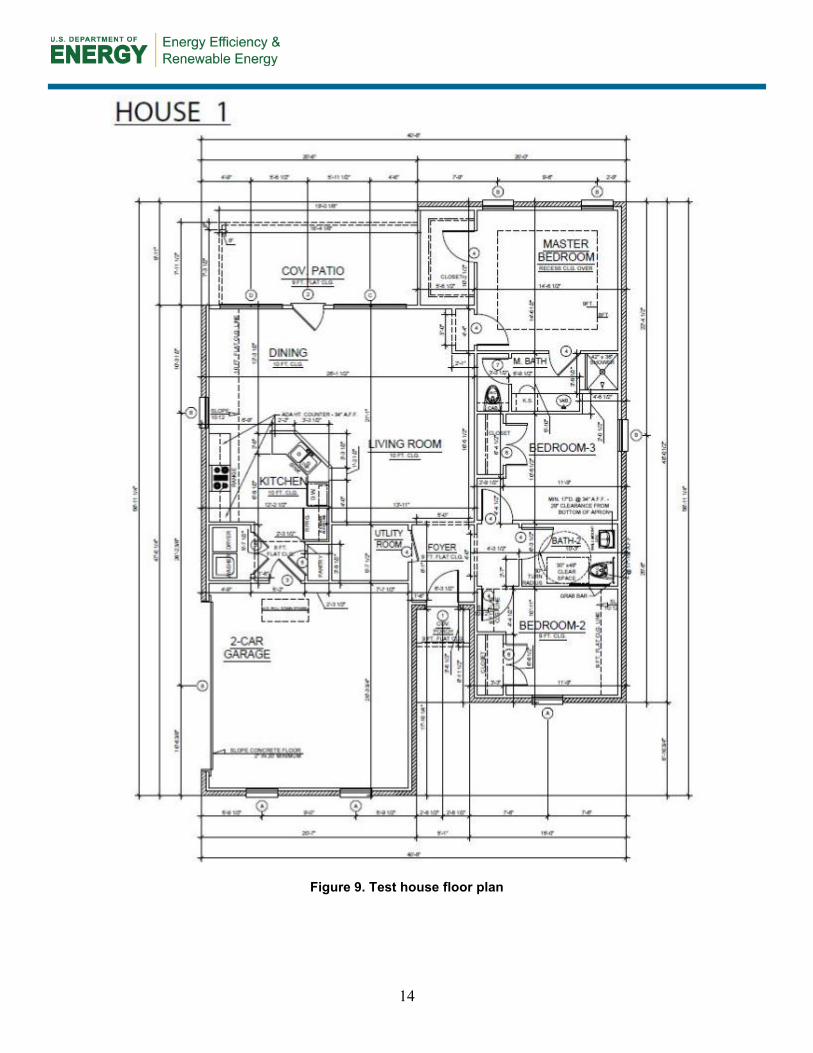
3.1 Description of the Test Houses The project involved testing at two unoccupied, single-family, detached homes in Tyler, Texas that were constructed as lab homes at UT-Tyler.4 Figure 5 shows the campus location and directions to the test homes. The twin lab homes offered a unique opportunity for the direct comparison of nearly identical homes except for House 1 having a vented attic (see Figure 5) and House 2 having an unvented attic assembly5 (also known as sealed cathedralized attic). House 1 had 2 × 4 frame walls with netted and blown fiberglass insulation, and loose blown fiberglass insulation on the floor of the attic. House 2 had 2 × 6 advanced-framed walls with low-density spray foam insulation in the walls and under the attic roof deck. The homes were completely finished, with kitchen and bathroom cabinets, but were unfurnished. This allowed an evaluation focus on the building elements themselves, avoiding conflation with items particular individuals bring into their homes (Hodgson et al. 2000). Figure 6 shows exterior views of the test homes. House 1 has the darker colored roof and House 2 the lighter colored roof. Figure 9 shows the House 1 floor plan layout, which applies to both houses since the plans are simply flipped (mirrored) with respect to each other.
Figure 4. Location and directions to the test homes at University of Texas-Tyler
4 Learn more at www.UT Tyler.edu/TxAIRE/Technology/Houses 5 Refer to International Residential Code section R806.4

11
Figure 5. House 1 vented attic (left) and House 2 unvented attic (right)
Figure 6. Exterior photos of the test homes at the UT-Tyler;
House 1 has the darker roof

12
Zone designations for the testing were as follows:
• Main zone included the kitchen, dining area, living area, foyer, and family bathroom.
• Master zone included the master bedroom, master bathroom, and walk-in closet.
• Front zone was the bedroom on the front side of the house (labeled Bedroom 2 in Figure 9).
• Middle zone was the bedroom between the master bathroom and the family bathroom (labeled Bedroom 3 in Figure 9).
• Attic zone was the vented attic for House 1 (including the vented attic over the garage) and the unvented attic for House 2 (the vented attic over the garage for House 2 was separate from the unvented attic and the garage but was not monitored as a separate zone).
• Garage zone was the two-car garage.
Figure 7. Energy recovery ventilator (ERV) installed in House 1 to match that of House 2

13
Figure 8. Wye'd outside air duct, airflow stations, and inline fan for retrofitting a central fan
integrated supply (CFIS) ventilation system in each attic (left); setting the CFIS airflow rate with Iris damper airflow station (top); fan timer and relay arrangement (bottom)
3.2 HVAC System Modifications and Pretesting In order to test both houses with the same ventilation systems, the following HVAC system modifications were made prior to testing:
• An ERV system was installed in House 1 to be identical to the one installed in House 2 (see Figure 7).
• Provisions were made with a 6-in. wye fitting and damper arrangement such that the outside air duct serving each ERV could be switched to serve as the outside air duct for a newly installed CFIS ventilation system. A timer and relay arrangement was installed that controlled the central system fan and an inline supply fan to provide the desired supply ventilation airflow at the desired fan duty cycle . The outside airflow was set by a balancing damper and calibrated flow measuring station (see Figure 9).
• The same timer that controlled the central fan for the CFIS system was used to control the central fan for the exhaust with mixing system.
14
Figure 9. Test house floor plan

15
3.3 Testing Approach The objective of the test program was to compare the whole-building, multizone, indoor air quality performance of continuous exhaust ventilation, CFIS ventilation, and ERV. The homes were completely finished, with kitchen and bathroom cabinets, but were unfurnished and unoccupied. This allowed an evaluation focus on the building elements themselves, avoiding conflation with occupant activities and items particular individuals bring into their homes. The testing approach taken was a combination of:
• Building enclosure and building mechanical systems characterization by measurement of building enclosure air leakage, central air distribution system airflows, and ventilation system airflows.
• Field tracer gas work using per-fluorocarbon tracer gases (PFTs) to determine zone air change rates and interzonal airflows with different ventilation systems operating.
• Multizone sampling of volatile organic compounds (VOCs), formaldehyde (HCHO), and airborne particulates to determine indoor air quality impacts as a function of ventilation system operation.
• A preliminary CONTAM airflow network simulation model constructed from the detailed building enclosure and building mechanical systems characterization testing (see Appendix B).
Table 3 provides a listing of the five tests conducted in each house, showing the designated test number, test name, and brief description. The test configurations were intended to represent normal limiting case conditions for most homes whereby space conditioning equipment may not operate for long periods (overnight to days long) and bedroom doors are closed at night.
The testing was originally planned for end of May to early June in order to avoid unreasonable indoor conditions without space conditioning operating, but that schedule could not be met, so the testing was delayed until early October. Figure 10 through Figure 12 show the indoor and outdoor conditions during each test period. Temperature and relative humidity (RH) in each zone and outside were measured with new HOBO U12-011 data loggers recording on a 5-minute interval. Wind direction and average and maximum values of wind speed were recorded on 5-minute intervals by the data collection system that existed at the houses. The pole-mounted anemometer and wind vane were mounted on the roof of House 2.

16
Table 3. Test Number, Name, and Description of the Five Tests Conducted in Each House
Test Number Test Name Test Description
1 Baseline No ventilation, bedroom doors closed, no central fan operation
2 Exhaust Exhaust ventilation from master bathroom, bathroom door
open to bedroom, bedroom doors closed, no central fan operation
3 Exhaust with mixing
Exhaust ventilation from master bathroom, bathroom door open to bedroom, bedroom doors closed, 20% central fan
operation (48 off/12 on)
4 CFIS CFIS ventilation, bedrooms closed, 33% central fan duty cycle (20 off/10 on)
5 ERV Balanced (ERV) ventilation, bedrooms closed, no central fan operation, 50% runtime (30 on/30 off)
Figure 10. House 1 temperature and RH in indoor zones and outdoors during each test period
40
50
60
70
80
90
100
110
Tem
pera
ture
[°F] Outdoor
Main
Master
Middle
Front
Garage
Attic
20
30
40
50
60
70
80
90
100
Rela
tive
Hum
idity Outdoor
Main
Master
Middle
Front
Garage
Attic

17
Figure 11. House 2 temperature and RH in indoor zones and outdoors during each test period
Figure 12. Wind speed during each of the test periods; green and red markers indicate start and
stop of the 12-hour sampling periods
40
50
60
70
80
90
Tem
pera
ture
[°F] Outdoor
Main
Master
Middle
Front
Garage
Attic
30
40
50
60
70
80
90
100
Rela
tive
Hum
idity Outdoor
Main
Master
Middle
Front
Garage
Attic
0
2
4
6
8
10
12
Win
d Sp
eed
(mph
)

18
The first 12-hour period of each test was to achieve steady-state for the purposes of PFT, particulate, VOC, and HCHO sampling in the second 12-hour period of each test. The test sequence was scheduled such that the 12-hour period for sampling would be overnight. The PFT source emission rates are coarsely temperature dependent, which was accounted for in the analysis, but since we were not conditioning the buildings during the testing, we did not want to risk solar heating effects having an impact on the sources. We also wanted to limit wind as a potentially confounding factor by taking advantage of generally lower wind conditions at night. The overnight ventilation condition is a normal and important condition in homes and there was no need to complicate the testing and data analysis with external factors of daytime solar heating and wind. Figure 12 shows the start (green triangle marker) and stop (red triangle marker) times of the 12-hour sampling period of each test period, being evening to morning. The sixth test period shown in that Figure 12 is a retest of the House 2 baseline test.
A general note for all tests is that all closet doors were left open to allow that air volume to fully interact with the adjoining space, and all bedroom doors were configured to have the same ½ in. undercut above the decoratively stained concrete floors throughout the houses.
The central system return air filters were new, 1-in. thick 3M Filtrete 700 filters, being given a “Better” ranking by the manufacturer (in a field of Good, Better, Best) and a Microparticle Performance Rating (MPR) of 700 (in a field of 300, 600, 700, 800, 1000, 1085, 1200, 1500, 1900, and 2200). The MPR measures a filter’s ability to capture particles between 0.3 and 1.0 micron. The manufacturer states that the Filtrete 700 used in this testing is intended for attracting and capturing some microscopic allergens like smoke and smog particles and large allergens like dust, mold spores, and pet dander from the air passing through the filter. The ASHRAE Minimum Efficiency Reporting Value (MERV) reports a filter’s ability to capture particles between 3 and 10 microns. Manufacturer literature has related the Filtrete 600 roughly to a MERV 8, the 1000 to a MERV 11, and the 1250 to a MERV 12 (IAQ Source 2013).
3.3.1 Baseline Test The baseline test was conducted to benchmark all measured parameters with no ventilation system or space conditioning system operating.
3.3.2 Exhaust Test The exhaust test was conducted using the master bathroom fan because BSC experience has been that that fan is most often the larger and better of the bathroom and toilet room fans in new houses. For testing, the continuous exhaust ventilation flow was adjusted to 45 cfm to meet the ASHRAE Standard 62.2-2010 continuous fan flow rate for the 1,475 ft2, three-bedroom houses.
3.3.3 Exhaust With Mixing Test The exhaust with mixing test was the same as the exhaust test except with a central system fan cycle of 48 minutes off and 12 minutes on. It was conducted to see the effects of trying to achieve better ventilation air distribution effectiveness via whole-house mixing of ventilation air drawn in by the exhaust fan through unknown locations in the building enclosure. The intent of the central system mixing was to achieve a 0.7 recirculation turnover factor which BSC has worked with the ASHRAE 62.2 Standard committee to implement. Additional exhaust ventilation testing was contemplated, using the lavatory bathroom off of the main area, but was eliminated due to budget constraints.

19
3.3.4 Central Fan Integrated Supply Test The CFIS ventilation system test was conducted to evaluate the performance effects of drawing outside air from a planned outdoor air location, and filtering and fully distributing that air to each conditioned space zone. The outside air ventilation supply airflow was set at 135 cfm by means of a calibrated flow station (Iris damper), and the central system fan was controlled to operate on a 33% duty cycle, 20 minutes off/10 minutes on.
3.3.5 Energy Recovery Ventilator Test The ERV test was conducted with a system independently ducted from the central air distribution system. The ERV ductwork in these houses was configured to exhaust from two locations in the main area and supply to all bedrooms. The ERV total supply airflow was measured to be 96 cfm so the ERV timer control was set for 50% runtime. The ERV included a washable course filter at the inlet of the heat and moisture energy recovery core within the unit. That filter was cleaned before testing began.
3.4 Building Enclosure, Central Air Distribution System, and Ventilation Systems Characterization
For each of the two test houses, the building enclosure, central air duct system, and the ventilation systems were characterized by the following procedures to facilitate PFT data interpretation and CONTAM modeling:
• Multipoint fan pressurization testing to establish the overall building enclosure air leakage rate.
• Multipoint, guarded and unguarded air leakage testing by fan pressurization of individual zones to determine the air leakage of the zone to exterior and zone-to-zone.
• Total duct leakage and duct leakage to outside testing.
• Central space conditioning system airflows.
• Local exhaust and whole-building ventilation system flow rates.
3.5 Per-Fluorocarbon Tracer Gas Testing Each of the two houses was tested with six different tracer gas sources, one for each of the six designated zones. The type and number of tracer gas sources used in each house and test are shown in Table 4. The PFT testing part of the project was set up and executed in consultation with Brookhaven National Laboratory (BNL) staff6 and in accordance with the prepared instructions provided by BNL (Dietz 2006) for the Air Infiltration Measurement System (AIMS). Detailed explanation and statistical support for the PFT methods and AIMS analysis is provided in Leaderer et al. 1995 and Dodson et al. 2007.
6 Terry Sullivan, PhD, Deputy Division Head, Environmental Research and Technology Division, Brookhaven National Laboratory, 75 Rutherford Drive, Building 815, Upton, NY 11973

20
Table 4. Type and Number of Tracer Gas Sources Used in Each House and Test
Zone Name Floor Area (ft2)
Height (ft)
Volume (ft3) PFT Color RSS Qty Resulting
RSS Comment
House 1, Test 1 (10/3) H1 Attic, Vented 1,463 9.2 13,507 PDCB Brown 1 1 1.00
H2 Attic, Unvented 1,463 9.2 13,507 PDCB Brown 1 1 1.00 Main 738 9.8 7,220 PMCH Red 0.93 1 0.93
Garage 419 9 3,771 PMCP Gold 0.62 1 0.62 Master Bedroom 337 8.2 2,766 ocPDCH Blue 0.16 5 0.80 Front Bedroom 165 9 1,485 1-2PTCH Silver 0.12 6 0.72
Middle Bedroom 159 8 1,272 iPPCH Purple 0.25 3 0.75 ½ Bath (Open to Main) 64 8 512
House 2, Test 1 (10/3) H1 Attic, Vented 1,463 9.2 13,507 PDCB Brown 1 1 1.00
H2 Attic, Unvented 1,463 9.2 13,507 PDCB Brown 1 1 1.00 Main 738 9.8 7,220 PMCH Red 0.93 1 0.93
Garage 419 9 3,771 PMCP Gold 0.62 1 0.62
Master Bedroom 337 8.2 2,766 1-2PTCH Silver 0.12 6 0.72 Master and front reversed relative to H1 for Test 1
Front Bedroom 165 9 1,485 ocPDCH Blue 0.16 5 0.80 Middle Bedroom 159 8 1,272 iPPCH Purple 0.25 3 0.75
½ Bath (Open to Main) 64 8 512 House 1 and House 2 Tests 2–5, And House 2 Test 6 (Beginning 10/4) (Re-Assigned To Optimize by Volume and Resulting Relative Source Strength)
H1 Attic, Vented 1,463 9.2 13,507 PDCB Brown 1 1 1.00 H2 Attic, Unvented 1,463 9.2 13,507 PDCB Brown 1 1 1.00
Main 738 9.8 7220 PMCH Red 0.93 1 0.93 Garage 419 9 3,771 ocPDCH Blue 0.16 5 0.80
Master Bedroom 337 8.2 2,766 iPPCH Purple 0.25 3 0.75 Front Bedroom 165 9 1,485 1-2PTCH Silver 0.12 6 0.72
Middle Bedroom 159 8 1,272 PMCP Gold 0.62 1 0.62 ½ Bath (Open to Main) 64 8 512

21
The PFT sources supplied by BNL were contained in a metal tube (see Figure 14) and were always emitting gas at a predictable rate through a stopper at the top. The emission rate of the PFT sources is affected by temperature, so temperature and RH were monitored in each zone and used by BNL in the analysis. Zone temperature and RH measurement was by new HOBO U12-011 data loggers recording on a 5-minute interval. Per BNL instructions, a box fan placed in the attics was used to facilitate mixing within that zone (see Figure 5). That is especially important in vented attics to minimize wind-driven effects that could bias normal gas diffusion distribution of PFT source, where prevailing winds can dominate by pushing air in one side of the attic and out the other.
Between each test the PFT sources were sealed in doubled, heavy-duty resealable bags (bag within another bag) and left in their respective zones while the house was flushed with outdoor air to a minimum of 10 complete air changes using a blower door and open windows and doors. An exhaust fan in the unvented attic aided flushing of that space to the garage attic and to outside.
To start each test, the PFT sources were opened in their respective zones for 12 hours with the appropriate ventilation system operating to approach steady-state conditions. The PFT samplers (CATS [Capillary Adsorption Tube Sampler]) were not deployed (capped and not near any sources) during that initial 12-hour period. Then, the samplers were placed in each zone and uncapped for the next 12 hours to complete the test.
A total of 60 primary samples were taken (two houses, five tests, six zones per test), and a total of 60 backup samplers were taken to be analyzed if data from any primary samples were suspect or for general quality assurance (QA) and quality control (QC) purposes. All six backup samplers were analyzed for one test (H2-Test 2) based on an observation question (we wanted to verify the result that the attic to main airflow was low in House 2 compared to House 1) and for a general QA/QC check. The results showed only minor differences between the two sets of data and the AIMS airflow analysis (refer to Figure 26). Figure 14 shows primary and backup CATS mounted on the sampling fixture.
Figure 13. House 2 main zone with PFT source tripod on left and sampling station tripod on right

22
Figure 14. PFT source (left) and primary and backup CATS (right)
3.6 Airborne Particulate Sampling During the 12-hour quasi steady-state period of each PFT test period, air sampling for airborne particulates was conducted in the main (common area) and master bedroom zones (see Figure 16 and Figure 17). During some tests, additional particulate sampling was done outdoors, and in the garage and attic of each house. Particulates were monitored at six particle sizes (0.3, 0.5, 1.0, 2.0, 5.0, and 10.0 micrometer) with a Fluke model 985 laser airborne particle counter. The meter has a counting efficiency of 50% @ 0.3 μm and 100 % for particles > 0.45 μm. The sample flow rate was 0.1 cfm (2.83 L/min). The meter was programmed to complete 48 cycles of 15-minute samples over the second 12-hour period of each test, gathering a sample volume of 1.5 ft3 (42.45 L) each cycle. Data were recorded electronically and imported into a worksheet for analysis. Only the last 21 15-minute particle counting cycles (cycles 20–40), or the last 5.25 hours before researchers re-entered the houses were used for analysis. This was to analyze the data closest to steady-state and to isolate the particle load attributable to the operation of different ventilation systems from any occupant (researcher) interaction. Occupant interaction can be significant, especially in the larger particle sizes as shown at the beginning and end of the test in Figure 15.

23
Figure 15. Cumulative particle counts for six particle sizes during the baseline test in House 2, main zone; results show impact on large particle counts due to human disturbance 1.5 hours
before end of sampling period
Figure 16. Test fixture tripod holding (left to right in photos) HCHO sample pump, temperature and relative humidity data logger, PFT sample tubes (CATS), airborne particulate counter, and VOC
sampling pump
1
10
100
1,000
10,000
100,000
1,000,000
10,000,000
1 5 9 13 17 21 25 29 33 37 41 45
Cum
ulat
ive
Part
icle
Cou
nts
nth 15 minute sampling cycle
Particulate Levels, House 2, Main zone, Baseline
H2 Main 0.3 micron
H2 Main 0.5 micron
H2 Main 1.0 micron
H2 Main 2.0 micron
H2 Main 5.0 micron
H2 Main 10.0 micron

24
3.7 Volatile Organic Compound Sampling Ninety minutes before the end of the 12-hour steady-state period of each PFT test period, volatile organic compound (VOC) sampling was conducted in the main (common area) and master bedroom zones (see Figure 17). During some tests, additional VOC sampling was done in the garage and attic of each house. An 18-L air sample was collected in each case. The solid sorbent samplers and the calibrated low-flow sample pumps (0.2 L/min) were provided by Air Quality Sciences division of Underwriters Laboratory (UL-AQS). Laboratory analysis of the samples was also conducted by UL-AQS, with a report identifying the “Top 20” VOCs (by concentration) identified in each sample for each test.7
Figure 17. VOC sampling pump and solid sorbent sample tube;
airborne particulate counter on top of sampling fixture
7 VOC samples collected on solid sorbents and analyzed by thermal desorption/mass spectrometry according to AQS Method CLI023 (based on EPA Compendium Method TO-17 and ASTM 6196). Individual compounds and TVOCs (total volatile organic compounds) are calibrated relative to toluene. Values below 2.0 µg/m³ are for information purposes only. Chemical was detected, but below the quantifiable level of 0.04 µg based on a standard of 18 L air collection volume. AQS’ quality assurance program monitors blank sorbent media to ensure that the residual background does not exceed AQS’ quality objective of ≤ 36 ng of total VOC. Quality Assurance Report available at www.aqs.com.

25
3.8 Formaldehyde Sampling Sixty minutes before the end of the 12-hour steady-state period of each PFT test period, HCHO sampling was conducted in the main (common area) and master bedroom zones (see Figure 16). During some tests, additional VOC sampling was done in the garage and attic of each house. A 60 L air sample was collected in each case. The DNPH samplers and the calibrated sample pumps (1.0 L/min) were provided by UL-AQS. Laboratory analysis of the samples was also conducted by UL-AQS, with a report identifying the HCHO concentration identified in each sample for each test.8
8 Analysis by DNPH/HPLC according to AQS Method CLI022 (based on ASTM Method D5197). Any values below 2.0 µg/m³ are for information purposes only; chemical was detected, but below the quantifiable level of 0.12 µg based on a standard of 60 L air collection volume. Reported concentrations based on 60.0 L of volume sampled. Field blanks are not intended to have a measurable amount of air sampled. Quality Assurance Report available at www.aqs.com.
26
4 Discussion of Results
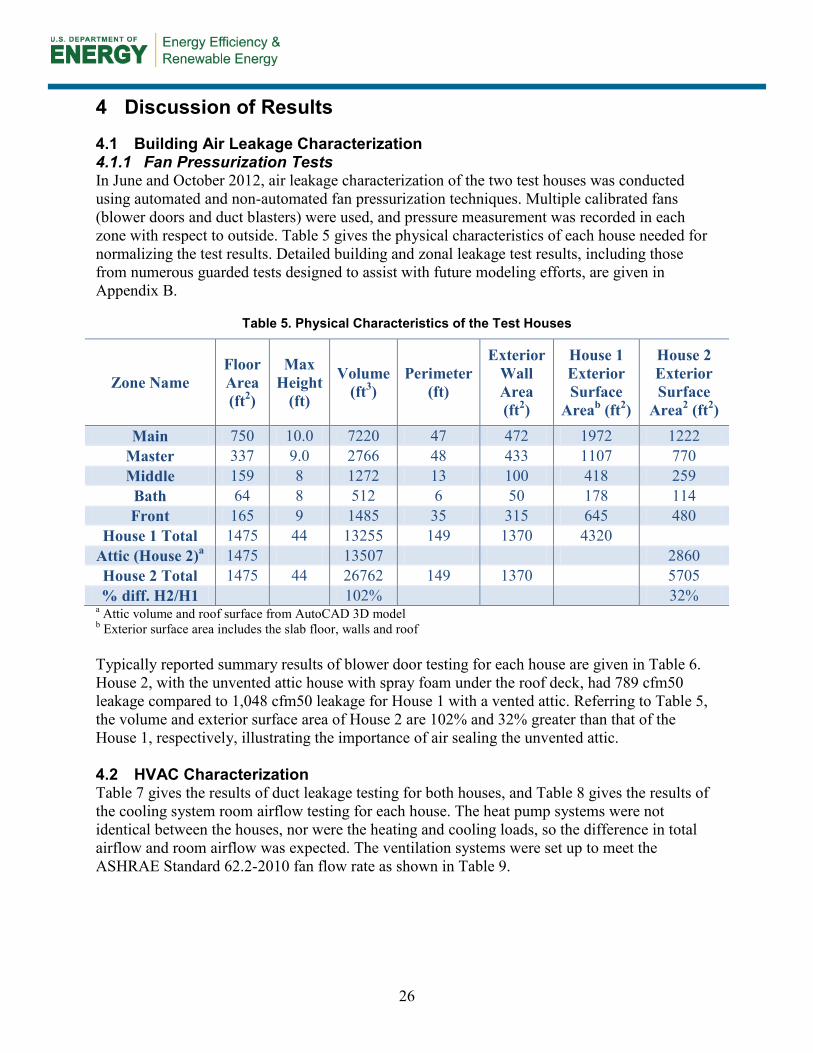
4.1 Building Air Leakage Characterization 4.1.1 Fan Pressurization Tests In June and October 2012, air leakage characterization of the two test houses was conducted using automated and non-automated fan pressurization techniques. Multiple calibrated fans (blower doors and duct blasters) were used, and pressure measurement was recorded in each zone with respect to outside. Table 5 gives the physical characteristics of each house needed for normalizing the test results. Detailed building and zonal leakage test results, including those from numerous guarded tests designed to assist with future modeling efforts, are given in Appendix B.
Table 5. Physical Characteristics of the Test Houses
Zone Name Floor Area (ft2)
Max Height
(ft)
Volume (ft3)
Perimeter (ft)
Exterior Wall Area (ft2)
House 1 Exterior Surface
Areab (ft2)
House 2 Exterior Surface
Area2 (ft2) Main 750 10.0 7220 47 472 1972 1222
Master 337 9.0 2766 48 433 1107 770 Middle 159 8 1272 13 100 418 259 Bath 64 8 512 6 50 178 114 Front 165 9 1485 35 315 645 480
House 1 Total 1475 44 13255 149 1370 4320 Attic (House 2)a 1475 13507 2860 House 2 Total 1475 44 26762 149 1370 5705 % diff. H2/H1 102% 32%
a Attic volume and roof surface from AutoCAD 3D model b Exterior surface area includes the slab floor, walls and roof Typically reported summary results of blower door testing for each house are given in Table 6. House 2, with the unvented attic house with spray foam under the roof deck, had 789 cfm50 leakage compared to 1,048 cfm50 leakage for House 1 with a vented attic. Referring to Table 5, the volume and exterior surface area of House 2 are 102% and 32% greater than that of the House 1, respectively, illustrating the importance of air sealing the unvented attic. 4.2 HVAC Characterization Table 7 gives the results of duct leakage testing for both houses, and Table 8 gives the results of the cooling system room airflow testing for each house. The heat pump systems were not identical between the houses, nor were the heating and cooling loads, so the difference in total airflow and room airflow was expected. The ventilation systems were set up to meet the ASHRAE Standard 62.2-2010 fan flow rate as shown in Table 9.

27
Table 6. Typically Reported Blower Door Test Results For Each Test House
Conditioned Floor
Area (ft2)
Conditioned Volume
(ft3)a
Surface Areab C n CFM50 ACH50
CFM50/ft2 Surface
Area
EqLAc (in.2)
ELAd (in.2) SLAe
House 1 1,475 13,255 4,320 66.2 0.706 1048 4.74 0.24 99 49.94 2.35
House 2 1,475 26,762 5,705 67.1 0.63 789 1.77 0.14 84 45.56 2.14
a For House 2, volume includes the unvented attic which is inside the thermal enclosure but not actively conditioned b Exterior surface area includes the slab floor, walls, and ceiling (House 1) or roof (House 2) c Equivalent leakage area; EqLA = CFM10 * 0.2939 d Effective leakage area; ELA = CFM4 * 0.2835 e Specific leakage area; SLA = ELA / 144 / floor area * 10,000

28
Table 7. Duct Leakage Tests
Duct Leakage
House 1
(CFM25) % of Total
Airflow House 2
(CFM25) % of Total
Airflow
Total to Outside* 182 16% 217 31% 56 5% 30 4%
* Leakage to outside for House 2 is realistically zero. It is a typical artifact of that test that shows a non-zero value, due to the unvented attic “buffer zone” not being completely nulled to the duct pressure.
Table 8. Central Air Distribution System (Heat Pump) Cooling Supply Airflows
Central AC Supply Room House 1 (CFM) House 2 (CFM)
Living Room
89 43 104 44 122 60 97 59 134 82 98 125
Mechanical Room 69 26 Master Bedroom 187 64
Master Bath 74 20 Master Closet 33 21
Middle Bedroom 63 67 Bath 2 42 21
Front Bedroom 25 75 Supply Total 1137 707
Table 9. Ventilation System Airflow and Runtime Setup
Exhaust (100% Runtime)
Room House 1 (CFM) House 2 (CFM)
Master Bathroom 45 45 CFIS (33% Runtime)
Flow Station 135 135 Outside Air Intake 109 100
ERV (50% Runtime) Master Supply 36 47 Middle Supply 27 25 Front Supply 30 24 Supply Total 93 96
Outside Air Intake 116 96 Exhaust Foyer 58 48
Exhaust Kitchen 80 75 Exhaust Total 138 123

29
4.3 Per-Fluorocarbon Tracer Gas testing PFT testing provided detailed information separately on individual zone outside air change rates and interzonal airflows. The testing materials were provided by BNL, the testing was done by BSC, the AIMS analysis was done by BNL, and the analysis and presentation of the AIMS results was done by BSC.
4.3.1 Zone Air Change Rates Figure 18 shows the individual zone air change rates for different ventilation systems in House 1. The air change rates were averaged over the final 12 hours of each 24-hour test. Infiltration and mechanically induced air change were combined in the PFT outside air change rate measurements. Fortunately, temperature differentials and wind speed were reasonably stable and similar during the testing periods so as to allow good comparison of zonal air change rates between the ventilation systems. The baseline test (no mechanical ventilation) showed low air change rates throughout all zones, with the lowest being the master and middle bedroom zones. Continuous exhaust ventilation from the master bathroom increased the air exchange by about 0.1 ach over baseline in the main and master zones, but the increase was less in the middle and front zones where the total air exchange rate remained below 0.1 ach. Exhaust with mixing (12 min/h via the central air distribution system) significantly improved the air change rate over exhaust-only in the middle and front zones. CFIS showed a significant improvement in air change rate over exhaust-only in all but the main zone. CFIS showed an improvement over exhaust with mixing only in the master zone. The balanced ERV showed huge air change rate increases in the bedrooms but was about the same as the other ventilation systems in the main zone. That was by design since the ERV supplied fresh air only to the bedrooms and exhausted air only from the main zone.

30
Figure 18. Air change rates in the living space zones for House 1,
for the baseline test and four different ventilation systems
Figure 19 shows the measured air change rates in the garage and vented attic zones for House 1. The garage air change rate for all tests, regardless of ventilation system, was similar to the baseline rates in the living space zones. The vented attic air change rate was about 0.65 ach for all tests except it was double that for the exhaust with mixing test. That can be explained by referring to Figure 12 and observing the wind speed during the sampling part (last 12 hours) of each test. The wind speed was 4–8 mph for the exhaust with mixing test whereas it was 0–2 mph for all the other tests.
0.00.10.20.30.40.50.60.70.80.9
Main Master Middle Front
Zone
ACH
(1/h
)
Zone Location
House 1: Living Space Air Change Rates
H1-baseline
H1-exhaust
H1-exhaust w/mixing
H1-CFIS
H1-ERV
0.00
0.05
0.10
0.15
Main Master Middle Front
Star
dard
Dev
iatio
n (1
/h)
Zone Location
H1-baseline
H1-exhaust
H1-exhaust w/mixing
H1-CFIS
H1-ERV

31
Figure 19. Measured air change rates in the garage and attic zones for House 1,
for different ventilation systems
Comparing Figure 18 and Figure 20, it is evident that the living zone air change rates exhibit the same trends for both houses, confirming the reliability of the test methods. Comparing Figure 19 and Figure 21, the same is true for the garage zones.
As expected, the attic zones respond differently between the houses. In the unvented attic of House 2, the air change rates were very low, between about 0.02 and 0.04, for the baseline, CFIS, and ERV tests. The air change rate increased fivefold, to between 0.16 and 0.18 ach, for both the exhaust and the exhaust with mixing ventilation systems. That points to the exhaust ventilation system drawing ventilation air from the attic.
0.0
0.2
0.4
0.6
0.8
1.0
1.2
1.4
Garage Vented Attic
Zone
ACH
(1/h
)
Zone Location
House 1: Garage and Attic Air Change Rates
H1-baseline
H1-exhaust
H1-exhaust w/mixing
H1-CFIS
H1-ERV
0.000.050.100.150.20
Garage Vented Attic
Stan
dard
Dev
iatio
n (1
/h)
Zone Location
H1-baseline
H1-exhaust
H1-exhaust w/mixing
H1-CFIS
H1-ERV

32
Figure 20. Air change rates in the living space zones for House 2 (unvented attic), for the baseline
test and four different ventilation systems, showing the same trends as House 1
0.0
0.1
0.2
0.3
0.4
0.5
0.6
0.7
Main Master Middle Front
Zone
ACH
(1/h
)
Zone Location
House 2: Living Space Air Change Rates
H2-baseline
H2-exhaust
H2-exhaust w/mixing
H2-CFIS
H2-ERV
0.00
0.05
0.10
Main Master Middle FrontStan
dard
Dev
iatio
n (1
/h)
Zone Location
H2-baseline
H2-exhaust
H2-exhaust w/mixing
H2-CFIS
H2-ERV
33
Figure 21. Measured air change rates in the garage and unvented attic zones for House 2,
for the baseline test and four different ventilation systems
4.3.2 Interzonal Airflows As understood from the standard deviation results provided with the BNL AIMS analysis,9 the measured interzonal airflows have a higher degree of uncertainty than the zonal air change rates. However, they serve a valuable purpose in at least confirming airflow in expected directions and indicating the reliability of the PFT measurements. As shown in Figure 22 and Figure 23, and as could be expected, the airflow from the garage to the main zone was the highest for the exhaust ventilation systems. Airflow from the garage to the main zone was the lowest for the CFIS ventilation system and between exhaust and CFIS for the ERV system. As a theoretically balanced system, the ERV system might be expected to behave just like the baseline, but the fact that the ERV system was designed to supply to the bedrooms and exhaust from the main zone set up a mechanically induced airflow imbalance within the multizone structure (main being negative and bedrooms being positive) that shows up in this measurement. Airflow from the garage to the bedroom zones was essentially negligible for all tests, but even so, airflow to the master zone was slightly higher for the exhaust systems, as makes sense since the exhaust fan was located there.
9 The AIMS error analysis uses a 5% error in the estimate of the volume of the room, a 7% error in the source emission rate, and a 10% error in the CATS PFT concentration when there is only a single CATS in the zone. A full description of the error analysis is in Leadererr et al. 1995.
0.000.020.040.060.080.100.120.140.160.180.20
Garage Unv Attic
Zone
ACH
(1/h
)
Zone Location
House 2: Garage and Attic Air Change Rates
H2-baseline
H2-exhaust
H2-exhaust w/mixing
H2-CFIS
H2-ERV
0.00
0.01
0.02
0.03
Garage Unv AtticStan
dard
Dev
iatio
n (1
/h)
Zone Location
H2-baseline
H2-exhaust
H2-exhaust w/mixing
H2-CFIS
H2-ERV

34
Figure 22. Airflow from garage to living area zones in House 1, for the baseline test and four
different ventilation systems
-0.5
0.0
0.5
1.0
1.5
2.0
2.5
3.0
Garage to Main
Garage to Master
Garage to Middle
Garage to Front
Inte
rzon
al A
irflo
w (f
t3 /m
in)
Garage to Living Zones Airflow for House 1
H1-baseline
H1-exhaust
H1-exhaust w/mixing
H1-CFIS
H1-ERV
0.00.20.40.60.81.01.2
Garage to Main
Garage to Master
Garage to Middle
Garage to Front
Stan
dard
Dev
iatio
n (ft
3 /m
in)
H1-baseline
H1-exhaust
H1-exhaust w/mixing
H1-CFIS
H1-ERV

35
Figure 23. Airflow from garage to living area zones in House 2, for the baseline test and four
different ventilation systems, showing the same trends as House 1
Airflow from the attic (vented) to the living space zones for House 1 is shown in Figure 24. The Exhaust with mixing system consistently shows the highest airflow from the attic, followed by exhaust, CFIS, ERV, and baseline. By comparing the results for House 1 (Figure 24) with House 2 (Figure 25), it becomes clear that:
• The exhaust system was moving 20% of its ventilation air (10 cfm) from the vented attic in House 1 to the main zone. About 7 cfm or another 14% of the exhaust ventilation air in House 1 was moving from the attic to the bedroom zones. A total of 34% (17 cfm out of 50) of the ventilation air for the exhaust system in House 1 was coming from the vented attic. In comparison, for the unvented attic of House 2, the exhaust system moved only 2% of its ventilation air from the attic to the main zone. This indicates that the exhaust makeup air path to outside was more resistive through the unvented attic spray-foamed roof than through the vented attic ceiling with recessed light penetrations. Because of this, the exhaust ventilation system performed somewhat better in the unvented attic house.
-0.5
0.0
0.5
1.0
1.5
2.0
2.5
3.0
Garage to Main
Garage to Master
Garage to Middle
Garage to Front
Inte
rzon
al A
irflo
w (f
t3 /m
in)
Garage to Living Zones Airflow for House 2
H2-baseline
H2-exhaust
H2-exhaust w/mixing
H2-CFIS
H2-ERV
0.0
0.2
0.4
0.6
0.8
Garage to Main
Garage to Master
Garage to Middle
Garage to Front
Stan
dard
Dev
iatio
n (ft
3 /m
in) H2-baseline
H2-exhaust
H2-exhaust w/mixing
H2-CFIS
H2-ERV

36
• In both houses, some central air distribution system return side leakage is causing the CFIS and exhaust with mixing ventilation systems to move about 10 cfm of attic air to the main zone. However, there is a big difference in ventilation effectiveness between the 10 cfm in a) and the 10 cfm in b). In a), it is 10 cfm out of 50 cfm of what was expected to be good ventilation air, whereas in b) it is 10 cfm out of 1000 cfm of recirculated and conditioned/filtered air. For the CFIS system, the full amount of expected outside air was still being delivered from a known outdoor intake location, whereas for the exhaust system of House 1, 34% of the expected outside air was from the vented attic.
Figure 24. Airflow from attic to living area zones in House 1, for the baseline test and four different ventilation systems
0
2
4
6
8
10
12
14
Attic to Main
Attic to Master
Attic to Middle
Attic to Front
Inte
rzon
al A
irflo
w (f
t3 /m
in)
Attic to Living Zones Airflow for House 1
H1-baseline
H1-exhaust
H1-exhaust w/mixing
H1-CFIS
H1-ERV
01234567
Attic to Main
Attic to Master
Attic to Middle
Attic to Front
Stan
dard
Dev
iatio
n (ft
3 /m
in)
H1-baseline
H1-exhaust
H1-exhaust w/mixing
H1-CFIS
H1-ERV

37
Figure 25. Airflow from attic to living area zones in House 2, for the baseline test and four different ventilation systems
Figure 26 shows interzonal airflows for a single case—House 2, Test 2 (exhaust)—where the backup CATS were analyzed as a quality assurance/quality control check on the PFT test and analysis method. There was a strong showing of consistency in results between the two sets of simultaneous samples.
0
2
4
6
8
10
12
14
Attic to Main
Attic to Master
Attic to Middle
Attic to Front
Inte
rzon
al A
irflo
w (f
t3 /m
in)
Attic to Living Zones Airflow for House 2
H2-baseline
H2-exhaust
H2-exhaust w/mixing
H2-CFIS
H2-ERV
0
1
2
3
4
5
Attic to Main
Attic to Master
Attic to Middle
Attic to Front
Stan
dard
Dev
iatio
n (ft
3 /m
in)
H2-baseline
H2-exhaust
H2-exhaust w/mixing
H2-CFIS
H2-ERV

38
Figure 26. Backup CATS analyzed for QA/QC check; House 2, Test 2 (exhaust)
Figure 27 through Figure 30 show interzonal airflows for the living space zones in both directions. In terms of internal air distribution, the baseline system showed little interzonal airflow in all cases, which was expected and confirmed that at least the trends indicated by the interzonal airflow results were reliable. All systems showed little interzonal airflow between bedrooms. As expected with the largest central air distribution system return air inlet in the main zone, the most interzonal airflow was between the main zone and bedroom zones for the CFIS and exhaust with mixing cases. The exhaust cases showed significant airflow (about 15 cfm) from main to master and no airflow in the reverse direction, as expected with the exhaust fan located in the master zone. Otherwise, the exhaust systems showed little interzonal airflow and distribution of ventilation air. The ERV system showed little airflow from main to bedrooms and between bedrooms, but relatively high airflow (10–20 cfm) from bedrooms to the main zone, as
-1.00.01.02.03.04.05.0
Mas
ter t
o M
ain
Mid
dle
to M
ain
Fron
t to
Mai
nM
iddl
e to
Mas
ter
Fron
t to
Mas
ter
Fron
t to
Mid
dle
Gara
ge to
Mai
nGa
rage
to M
aste
rGa
rage
to M
iddl
eGa
rage
to F
ront
Attic
to M
ain
Attic
to M
aste
rAt
tic to
Mid
dle
Attic
to F
ront
Inte
rzon
al A
irflo
w (f
t3 /m
in)
Backup CATS analyzed for QA/QC for House 2, Test 2
H2-exhaust H2-exhaust backups
0.000.100.200.300.400.500.600.700.800.901.00
Mas
ter t
o M
ain
Mid
dle
to M
ain
Fron
t to
Mai
nM
iddl
e to
Mas
ter
Fron
t to
Mas
ter
Fron
t to
Mid
dle
Gara
ge to
Mai
nGa
rage
to M
aste
rGa
rage
to M
iddl
eGa
rage
to F
ront
Attic
to M
ain
Attic
to M
aste
rAt
tic to
Mid
dle
Attic
to F
rontSt
anda
rd D
evia
tion
(ft3 /
min
)
H2-exhaust H2-exhaust backups

39
expected since the ERV system supplied fresh air to the bedrooms and exhausted stale air from the main zone.
Figure 27. House 1 interzonal airflows for living space zones
-505
10152025303540
Main to
Master
Main to
Middle
Main to
Front
Master to
Middle
Master to
Front
Middle to
Front
Inte
rzon
al A
irflo
w (f
t3 /m
in)
Interzonal Airflows for House 1
H1-baseline
H1-exhaust
H1-exhaust w/mixing
H1-CFIS
H1-ERV
0
5
10
15
20
25
Main to
Master
Main to
Middle
Main to
Front
Master to
Middle
Master to
Front
Middle to
Front
Stan
dard
Dev
iatio
n (ft
3 /m
in)
H1-baselineH1-exhaustH1-exhaust w/mixingH1-CFISH1-ERV

40
Figure 28. House 1 reverse direction interzonal airflows for living space zones
-10
0
10
20
30
40
50
60
Master to
Main
Middle to
Main
Front to
Main
Middle to
Master
Front to
Master
Front to
Middle
Inte
rzon
al A
irflo
w (f
t3 /m
in)
Interzonal Airflows for House 1 (rev. direction)
H1-baseline
H1-exhaust
H1-exhaust w/mixing
H1-CFIS
H1-ERV
05
1015202530
Master to
Main
Middle to
Main
Front to
Main
Middle to
Master
Front to
Master
Front to
Middle
Stan
dard
Dev
iaio
n (ft
3 /m
in)
H1-baselineH1-exhaustH1-exhaust w/mixingH1-CFISH1-ERV

41
Figure 29. House 2 interzonal airflows for living space zones
-202468
101214161820
Main to Master
Main to Middle
Main to Front
Master to
Middle
Master to
Front
Middle to
Front
Inte
rzon
al A
irflo
w (f
t3 /m
in)
Interzonal Airflows for House 2
H2-baseline
H2-exhaust
H2-exhaust w/mixing
H2-CFIS
H2-ERV
01234567
Main to
Master
Main to
Middle
Main to
Front
Master to
Middle
Master to
Front
Middle to
Front
Stan
dard
Dev
iatio
n (ft
3 /m
in)
H2-baselineH2-exhaustH2-exhaust w/mixingH2-CFISH2-ERV

42
Figure 30. House 2 reverse direction interzonal airflows for living space zones
4.4 Airborne Particulate Sampling As mentioned above, only the last 21 15-minute particle counting cycles before researchers re-entered the houses, or the last 5¼ hours of the 12-hour sampling period, were used for analysis presentation. This was to isolate the particle load due to the operation of different ventilation system from any occupant (researcher) interaction. Occupant interaction was easy to see in the full set of data, having a large impact on large particles but little impact on the smallest particles.
As mentioned above, particulates were monitored at six particle sizes (0.3, 0.5, 1.0, 2.0, 5.0, 10.0 micrometer) with a Fluke model 985 laser airborne particle counter. The meter has a counting efficiency of 50 % @ 0.3 μm and 100 % for particles > 0.45 μm. The sample flow rate was 0.1 cfm (2.83 L/min). The meter was programmed to complete 48 cycles of 15-minute samples over the second 12-hour period of each test, gathering a sample volume of 1.5 ft3 (42.45 L) each cycle. Data were recorded electronically and imported into a worksheet for analysis. Only the last 21 15-minute particle counting cycles, or the last 5¼ hours before anyone re-entered the houses were used for analysis. This was to analyze the data closest to steady-state and to isolate the particle load due to the operation of different ventilation system from any occupant interaction. Occupant interaction was easy to observe in the full set of data, having a large impact on the largest particles but little impact on the smallest particles.
-505
10152025303540
Master to
Main
Middle to
Main
Front to
Main
Middle to
Master
Front to
Master
Front to
Middle
Inte
rzon
al A
irflo
w (f
t3 /m
in)
Interzonal Airflows for House 2 (rev. direction)
H2-baseline
H2-exhaust
H2-exhaust w/mixing
H2-CFIS
H2-ERV
012345678
Master to
Main
Middle to
Main
Front to
Main
Middle to
Master
Front to
Master
Front to
Middle
Stan
dard
Dev
iatio
n (ft
3 /m
in)
H2-baselineH2-exhaustH2-exhaust w/mixingH2-CFISH2-ERV

43
While this report is not intended to address the detailed human health concerns related to particle contaminants, a little background is useful here. Small particles are considered hazardous to human health. Particle sizes of 10 micrometers (micron or μm) or less are generally not filtered by the nose and throat and reach the lungs. Particle sizes of 2.5 micrometers and less can enter into the gas exchange region of the lung. Particles sizes of 0.1 micrometer and less can pass through the lung to organs, including the heart and brain.
In rough perspective, bacteria, mold spores, and dust mite allergens can all be 10 microns or less. Cat allergens, tobacco smoke, soot, and smog can all be 1 micron or less. Viruses, tobacco smoke, soot, and smog can all be 0.1 micron or less.
Figure 31 shows plots of the cumulative10 particle counts for House 1, for all six particle sizes and ventilation systems, for the main and master zones side-by-side. Figure 32 shows the same thing for House 2. There was not an important difference in particulate levels between the main and master zones, but there was an important and consistent difference found between the ventilation systems. The highest levels were found for the exhaust system, followed by the baseline or ERV, followed by the exhaust with mixing and CFIS. CFIS always showed the lowest particle counts regardless of particle size. As would be expected, this indicated that the Filtrete 700 filters (700 MPR and roughly MERV 9) in the central air distribution system return air grilles were removing a significant amount of particle contaminant 0.3 micron and larger.
10 The cumulative particle count reported throughout this study gives the sum of particles counted that were greater than or equal to threshold particle size given. For example, a cumulative particle count of 1,000 for the 2.0 micron size means that there were 1,000 particles of size ≥ 2.0 micron. Differential particle size can be calculated by subtracting the cumulative particle count of the next larger size from the cumulative particle count of the smaller size. For example, if the cumulative particle count was 1,000 and 10,000 for particle sizes 2.0 micron and 1.0 micron, respectively, then the differential particle count would be 9,000 particles between 1.0 and 2.0 micron size.

44
0
1,000,000
2,000,000
3,000,000
4,000,000
5,000,000
6,000,000
20 22 24 26 28 30 32 34 36 38 40
Cum
ulat
ive
Part
icle
Cou
nts
nth 15 minute sampling cycle
0.3 μm Particle Size, House 1, Main
H1 Main exhaust
H1 Main ERV
H1 Main baseline
H1 Main exh w/mixing
H1 Main CFIS
0
1,000,000
2,000,000
3,000,000
4,000,000
5,000,000
6,000,000
20 22 24 26 28 30 32 34 36 38 40
Cum
ulat
ive
Part
icle
Cou
nts
nth 15 minute sampling cycle
0.3 μm Particle Size, House 1, Master
H1 Master exhaust
H1 Master ERV
H1 Master baseline
H1 Master exh w/mixingH1 Master CFIS
0
50,000
100,000
150,000
200,000
250,000
300,000
20 22 24 26 28 30 32 34 36 38 40
Cum
ulat
ive
Part
icle
Cou
nts
nth 15 minute sampling cycle
0.5 μm Particle Size, House 1, Main
H1 Main exhaust
H1 Main ERV
H1 Main baseline
H1 Main exh w/mixing
H1 Main CFIS
0
50,000
100,000
150,000
200,000
250,000
300,000
20 22 24 26 28 30 32 34 36 38 40
Cum
ulat
ive
Part
icle
Cou
nts
nth 15 minute sampling cycle
0.5 μm Particle Size, House 1, Master
H1 Master exhaust
H1 Master ERV
H1 Master baseline
H1 Master exh w/mixingH1 Master CFIS
0
2,000
4,000
6,000
8,000
10,000
12,000
14,000
20 22 24 26 28 30 32 34 36 38 40
Cum
ulat
ive
Part
icle
Cou
nts
nth 15 minute sampling cycle
1.0 μm Particle Size, House 1, Main
H1 Main exhaust
H1 Main ERV
H1 Main baseline
H1 Main exh w/mixing
H1 Main CFIS
0
2,000
4,000
6,000
8,000
10,000
12,000
14,000
20 22 24 26 28 30 32 34 36 38 40
Cum
ulat
ive
Part
icle
Cou
nts
nth 15 minute sampling cycle
1.0 μm Particle Size, House 1, Master
H1 Master exhaust
H1 Master ERV
H1 Master baseline
H1 Master exh w/mixingH1 Master CFIS
0
500
1,000
1,500
2,000
2,500
3,000
3,500
4,000
20 22 24 26 28 30 32 34 36 38 40
Cum
ulat
ive
Part
icle
Cou
nts
nth 15 minute sampling cycle
2.0 μm Particle Size, House 1, Main
H1 Main exhaust
H1 Main ERV
H1 Main baseline
H1 Main exh w/mixing
H1 Main CFIS
0
500
1,000
1,500
2,000
2,500
3,000
3,500
4,000
20 22 24 26 28 30 32 34 36 38 40
Cum
ulat
ive
Part
icle
Cou
nts
nth 15 minute sampling cycle
2.0 μm Particle Size, House 1, Master
H1 Master exhaust
H1 Master ERV
H1 Master baseline
H1 Master exh w/mixingH1 Master CFIS

45
Figure 31. Cumulative particle counts for six particle sizes (0.3–10 micrometer) for the House1
main and master zones
0
10
20
30
40
50
60
70
80
90
100
20 22 24 26 28 30 32 34 36 38 40
Cum
ulat
ive
Part
icle
Cou
nts
nth 15 minute sampling cycle
5.0 μm Particle Size, House 1, Main
H1 Main exhaust
H1 Main ERV
H1 Main baseline
H1 Main exh w/mixing
H1 Main CFIS
0
10
20
30
40
50
60
70
80
90
100
20 22 24 26 28 30 32 34 36 38 40
Cum
ulat
ive
Part
icle
Cou
nts
nth 15 minute sampling cycle
5.0 μm Particle Size, House 1, Master
H1 Master exhaust
H1 Master ERV
H1 Master baseline
H1 Master exh w/mixingH1 Master CFIS
0
2
4
6
8
10
12
20 22 24 26 28 30 32 34 36 38 40
Cum
ulat
ive
Part
icle
Cou
nts
nth 15 minute sampling cycle
10.0 μm Particle Size, House 1, Main
H1 Main exhaust
H1 Main ERV
H1 Main baseline
H1 Main exh w/mixing
H1 Main CFIS
0
2
4
6
8
10
12
20 22 24 26 28 30 32 34 36 38 40
Cum
ulat
ive
Part
icle
Cou
nts
nth 15 minute sampling cycle
10.0 μm Particle Size, House 1, Master
H1 Master exhaust
H1 Master ERV
H1 Master baseline
H1 Master exh w/mixingH1 Master CFIS
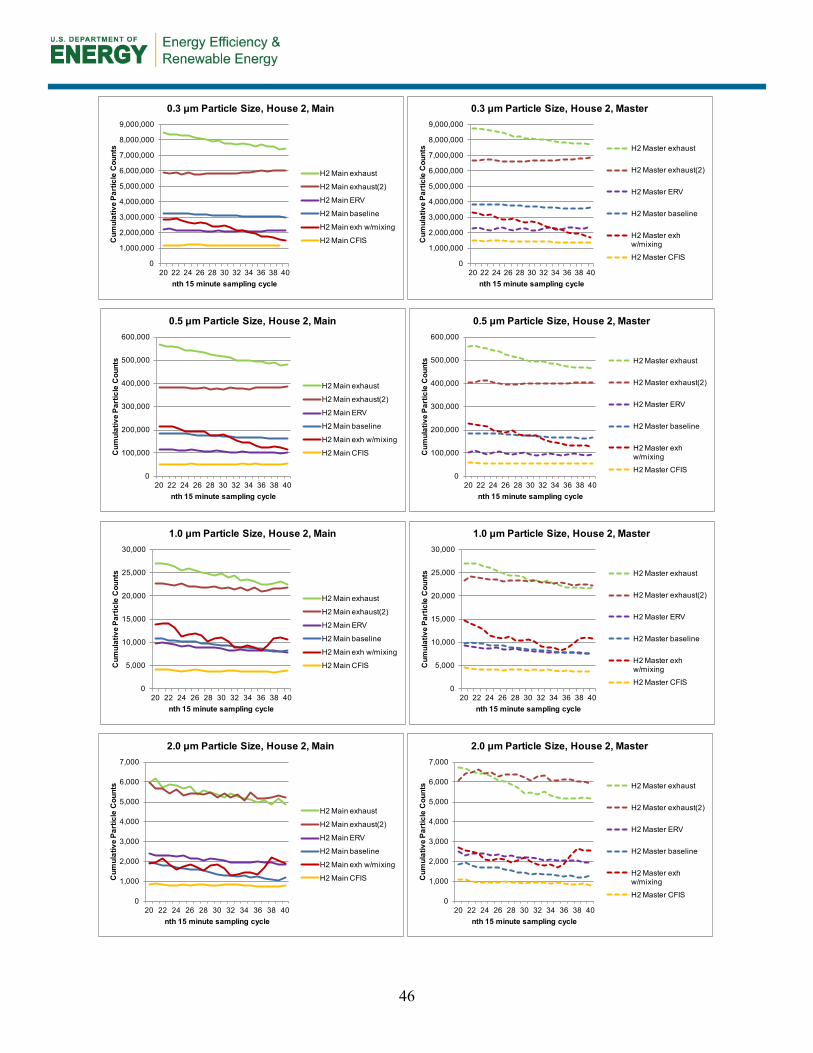
46
0
1,000,000
2,000,000
3,000,000
4,000,000
5,000,000
6,000,000
7,000,000
8,000,000
9,000,000
20 22 24 26 28 30 32 34 36 38 40
Cum
ulat
ive
Part
icle
Cou
nts
nth 15 minute sampling cycle
0.3 μm Particle Size, House 2, Main
H2 Main exhaust
H2 Main exhaust(2)
H2 Main ERV
H2 Main baseline
H2 Main exh w/mixing
H2 Main CFIS
0
1,000,000
2,000,000
3,000,000
4,000,000
5,000,000
6,000,000
7,000,000
8,000,000
9,000,000
20 22 24 26 28 30 32 34 36 38 40
Cum
ulat
ive
Part
icle
Cou
nts
nth 15 minute sampling cycle
0.3 μm Particle Size, House 2, Master
H2 Master exhaust
H2 Master exhaust(2)
H2 Master ERV
H2 Master baseline
H2 Master exh w/mixing
H2 Master CFIS
0
100,000
200,000
300,000
400,000
500,000
600,000
20 22 24 26 28 30 32 34 36 38 40
Cum
ulat
ive
Part
icle
Cou
nts
nth 15 minute sampling cycle
0.5 μm Particle Size, House 2, Main
H2 Main exhaust
H2 Main exhaust(2)
H2 Main ERV
H2 Main baseline
H2 Main exh w/mixing
H2 Main CFIS
0
100,000
200,000
300,000
400,000
500,000
600,000
20 22 24 26 28 30 32 34 36 38 40
Cum
ulat
ive
Part
icle
Cou
nts
nth 15 minute sampling cycle
0.5 μm Particle Size, House 2, Master
H2 Master exhaust
H2 Master exhaust(2)
H2 Master ERV
H2 Master baseline
H2 Master exh w/mixing
H2 Master CFIS
0
5,000
10,000
15,000
20,000
25,000
30,000
20 22 24 26 28 30 32 34 36 38 40
Cum
ulat
ive
Part
icle
Cou
nts
nth 15 minute sampling cycle
1.0 μm Particle Size, House 2, Main
H2 Main exhaust
H2 Main exhaust(2)
H2 Main ERV
H2 Main baseline
H2 Main exh w/mixing
H2 Main CFIS
0
5,000
10,000
15,000
20,000
25,000
30,000
20 22 24 26 28 30 32 34 36 38 40
Cum
ulat
ive
Part
icle
Cou
nts
nth 15 minute sampling cycle
1.0 μm Particle Size, House 2, Master
H2 Master exhaust
H2 Master exhaust(2)
H2 Master ERV
H2 Master baseline
H2 Master exh w/mixing
H2 Master CFIS
0
1,000
2,000
3,000
4,000
5,000
6,000
7,000
20 22 24 26 28 30 32 34 36 38 40
Cum
ulat
ive
Part
icle
Cou
nts
nth 15 minute sampling cycle
2.0 μm Particle Size, House 2, Main
H2 Main exhaust
H2 Main exhaust(2)
H2 Main ERV
H2 Main baseline
H2 Main exh w/mixing
H2 Main CFIS
0
1,000
2,000
3,000
4,000
5,000
6,000
7,000
20 22 24 26 28 30 32 34 36 38 40
Cum
ulat
ive
Part
icle
Cou
nts
nth 15 minute sampling cycle
2.0 μm Particle Size, House 2, Master
H2 Master exhaust
H2 Master exhaust(2)
H2 Master ERV
H2 Master baseline
H2 Master exh w/mixing
H2 Master CFIS

47
Figure 32. Cumulative particle counts for six particle sizes (0.3–10 micrometer) for the House 2
main and master zones
Table 10 provides a more detailed analysis of the particle count data in the range of 0.3–2.0 micron. Differential particle counts over the range of 0.3–2.0 micron were calculated from the cumulative particle counts for the main and master zones. The percent difference in differential particle counts was shown compared to the exhaust ventilation system. The average percent difference showed a 69%–85% reduction in small particles over the exhaust-only system in House 1, and a 52%–73% reduction in House 2. The CFIS ventilation system showed the greatest reduction in small particles for both houses, attributable to recirculation air filtration by operation of the central air distribution system.
0
20
40
60
80
100
120
140
160
180
200
20 22 24 26 28 30 32 34 36 38 40
Cum
ulat
ive
Part
icle
Cou
nts
nth 15 minute sampling cycle
5.0 μm Particle Size, House 2, Main
H2 Main exhaust
H2 Main exhaust(2)
H2 Main ERV
H2 Main baseline
H2 Main exh w/mixing
H2 Main CFIS
0
20
40
60
80
100
120
140
160
180
200
20 22 24 26 28 30 32 34 36 38 40
Cum
ulat
ive
Part
icle
Cou
nts
nth 15 minute sampling cycle
5.0 μm Particle Size, House 2, Master
H2 Master exhaust
H2 Master exhaust(2)
H2 Master ERV
H2 Master baseline
H2 Master exh w/mixing
H2 Master CFIS
0
2
4
6
8
10
12
14
16
20 22 24 26 28 30 32 34 36 38 40
Cum
ulat
ive
Part
icle
Cou
nts
nth 15 minute sampling cycle
10.0 μm Particle Size, House 2, Main
H2 Main exhaust
H2 Main exhaust(2)
H2 Main ERV
H2 Main baseline
H2 Main exh w/mixing
H2 Main CFIS
0
2
4
6
8
10
12
14
16
20 22 24 26 28 30 32 34 36 38 40
Cum
ulat
ive
Part
icle
Cou
nts
nth 15 minute sampling cycle
10.0 μm Particle Size, House 2, Master
H2 Master exhaust
H2 Master exhaust(2)
H2 Master ERV
H2 Master baseline
H2 Master exh w/mixing
H2 Master CFIS

48
Table 10. Calculation of Differential Particle Counts Over the Range of 0.3–2.0 Micron; the Percent Differences in Differential Counts Are Shown Compared to the Exhaust Ventilation System
Test #
Main Zone Master Zone
Ventilation System
Cumulative Counts* at
0.3 μm
Cumulative Counts* at
2.0 μm
Differential Counts
0.3–2.0 μm
% Diff. From
Exhaust
Cumulative Counts* at
0.3 μm
Cumulative Counts* at
2.0 μm
Differential Counts
0.3–2.0 μm
% Diff. From
Exhaust
Average % Diff.
House 1 1 Baseline 2,764,437 2,992 2,761,446 –47% 2,453,086 1,871 2,451,215 –47% –47% 2 Exhaust 5,223,259 3,917 5,219,341 – 4,654,361 3,087 4,651,275 – –
3 Exhaust w/mixing 1,407,415 1,557 1,405,858 –73% 1,299,948 1,066 1,298,882 –72% –73%
4 CFIS 730,706 1,209 729,497 –86% 774,120 942 773,178 –83% –85% 5 ERV 1,522,578 2,120 1,520,458 –71% 1,572,288 2,652 1,569,636 –66% –69%
House 2 1(6) Baseline 3,171,002 2,611 3,168,391 –39% 3,745,584 2,061 3,743,523 –20% –29%
2 Exhaust 8,009,169 7,086 8,002,084 – 8,279,091 7,795 8,271,296 – –
3 Exhaust w/mixing 2,582,948 4,536 2,578,411 –51% 2,887,309 4,900 2,882,409 –38% –44%
4 CFIS 1,221,080 2,258 1,218,822 –77% 1,445,509 2,130 1,443,379 –69% –73% 5 ERV 2,277,061 2,882 2,274,178 –56% 2,396,952 2,935 2,394,018 –49% –52%
* Cumulative counts per 15-minute sample, averaged over 21 samples starting at hour 16.75 and ending at hour 22 of each 24 hour test period

49
Particulate measurements in the attics and garages are shown in Figure 33. For House 1, the measurements were taken in the attic during the ERV test, and in the garage during the CFIS test. For House 2, the measurements were taken in the attic and the garage during two different baseline tests. The levels of particulate were reasonably close between the attic and garage of each individual house. House 1 had somewhat lower particulate levels than House 2 in the smallest particle sizes, they were nearly the same for the 1.0 micron size, then House 2 had lower levels in the 2.0 micron size and larger. The attic and garage in both houses had somewhat lower particulate levels than outside (Figure 34), particularly in the larger particle sizes.
The two outside tests were made outside of House 2 during two baseline tests. The second baseline test was made for House 2 because of inadvertent exhaust fan usage during the first baseline test. Indoor and outdoor temperature and relative humidity were similar during both tests. Wind speed was a little higher during the second test but the outside sample location was somewhat sheltered from wind. The particle count results of the two outside tests show remarkable consistency in Figure 34 and Table 11, indicating good measurement repeatability. We did not have enough meters to measure outdoor particulate for each test, however, the measurements from these two tests, bracketing the entire testing period, were consistent with each other and essentially unchanging for 12 hours at a time. There were no obvious sources nearby in this suburban location, or weather disturbances that would give particular reason to think that outdoor particulate conditions would have changed much between test day 1 and test day 6 any more than they did on test day 1 and test day 6.
Table 11. Cumulative Particle Counts Measured Outdoors and in the House 1 and House 2 Attics
Particle Size (µm)
Cumulative Particle Counts
Outdoor Day 1
Outdoor Day 6
Outdoor Average H1 Attic
H1 Attic % Diff From
Outdoor Average
H2 Attic
H2 Attic % Diff From
Outdoor Average
H2 Attic
% Diff
From H1
Attic 0.3 4,995,436 4,432,017 4,713,727 1,051,088 –78% 3,322,588 –30% 216% 0.5 316,595 363,054 339,824 55,715 –84% 179,863 –47% 223% 1.0 47,818 39,839 43,829 8,898 –80% 5,550 –87% –38% 2.0 24,710 13,569 19,140 2,871 –85% 797 –96% –72% 5.0 2,063 1,409 1,736 121 –93% 41 –98% –66%
10.0 294 291 292 15 –95% 8 –97% –49% Cumulative particle counts, measured twice outdoors and in each attic, are shown in Table 11. The House 2 unvented attic air had an average of 220% more particles in the 0.3–0.5 micron range, but an average of 55% less particles in the 1.0–2.0 micron range. The air sampled in both attics had fewer particles than outdoors for all particle sizes. The air in the vented attic may continue to have fewer particles than outdoors because the attic is sheltered from wind, however, over time, the vented attic floor will accumulate particles much faster than the unvented attic floor. Where exhaust ventilation systems draw air from the attic, that air should pick up fewer particles from the unvented attic floor than from the more dirty vented attic floor.

50
Table 12. Cumulative and Differential Particle Counts Measured Outdoors During Baseline Tests on the First and Last Test Days
Outside
Test #
Ventilation System
Cumulative Counts at 0.3 μm
Cumulative Counts at 2.0 μm
Differential Counts 0.3–2.0 μm
1 Baseline 4,995,436 24,710 4,970,725
1(6) Baseline 4,432,017 13,569 4,418,448 Figure 35 shows the particle count measurements during the second Baseline test, comparing the coincident outside and inside results for the main and master zones, respectively. In both cases, the inside and outside particle counts are nearly the same for the 0.3 and 0.5 micron particle sizes. For 1.0 micron particles, the inside counts were about 5 times lower than outside. That trend increased progressively to about 100 times lower for inside counts compared to outside counts at the 10.0 micron size.

51
Figure 33. Cumulative particle counts for six particle sizes (0.3–10 micrometer) for the attic and
garage zones for House 1 and House 2
1
10
100
1,000
10,000
100,000
1,000,000
10,000,000
20 22 24 26 28 30 32 34 36 38 40
Cum
ulat
ive
Part
icle
Cou
nts
nth 15 minute sampling cycle
Particle Size, H1, Attic (ERV) and Garage (CFIS)
H1 Attic 0.3 micron
H1 Garage 0.3 micron
H1 Attic 0.5 micron
H1 Garage 0.5 micron
H1 Attic 1.0 micron
H1 Garage 1.0 micron
H1 Attic 2.0 micron
H1 Garage 2.0 micron
H1 Attic 5.0 micron
H1 Garage 5.0 micron
H1 Attic 10.0 micron
H1 Garage 10.0 micron
1
10
100
1,000
10,000
100,000
1,000,000
10,000,000
20 22 24 26 28 30 32 34 36 38 40
Cum
ulat
ive
Part
icle
Cou
nts
nth 15 minute sampling cycle
Particle Size, H2, Attic and Garage (Baseline)
H2 Attic 0.3 micron
H2 Garage 0.3 micron
H2 Attic 0.5 micron
H2 Garage 0.5 micron
H2 Attic 1.0 micron
H2 Garage 1.0 micron
H2 Attic 2.0 micron
H2 Garage 2.0 micron
H2 Attic 5.0 micron
H2 Garage 5.0 micron
H2 Attic 10.0 micron
H2 Garage 10.0 micron

52
Figure 34. Cumulative particle counts for six particle sizes (0.3–10 micrometer) sampled outside
on the first and last test days (test day 1 and test day 6)
1
10
100
1,000
10,000
100,000
1,000,000
10,000,000
20 22 24 26 28 30 32 34 36 38 40
Cum
ulat
ive
Part
icle
Cou
nts
nth 15 minute sampling cycle
Outside, Two Separate Tests (Day 1, Day 6)Outside1 0.3 micron
Outside2 0.3 micron
Outside1 0.5 micron
Outside2 0.5 micron
Outside1 1.0 micron
Outside2 1.0 micron
Outside1 2.0 micron
Outside2 2.0 micron
Outside1 5 micron
Outside2 5.0 micron
Outside1 10.0 micron
Outside2 10.0 micron

53
Figure 35. Cumulative particle counts for six particle sizes (0.3–10.0 micron) for simultaneous
measurements made outside and inside during the H2 baseline test
4.5 Formaldehyde Sampling HCHO was sampled in the main and master zones in the last hour of each 24-hour test period. Table 13 provides the numerical results and Figure 36 graphically illustrates the relative concentrations during the baseline test and the four ventilation system tests. Outside HCHO concentration was not measured at this location, but can generally be taken to be 2–3 ppb (2.5–3.7 μg/m3) for this region of Texas (EPA 1991).
In House 1, all ventilation systems reduced the HCHO concentration over the indoor baseline concentration which was roughly 20 times higher than what would be expected outdoors.
1
10
100
1,000
10,000
100,000
1,000,000
10,000,000
20 22 24 26 28 30 32 34 36 38 40
Cum
ulat
ive
Part
icle
Cou
nts
nth 15 minute sampling cycle
Coincident Outside and H2 Main baselineH2 Main 0.3
Outside2 0.3 micron
H2 Main 0.5
Outside2 0.5 micron
H2 Main 1.0
Outside2 1.0 micron
H2 Main 2.0
Outside2 2.0 micron
H2 Main 5.0
Outside2 5.0 micron
H2 Main 10.0
Outside2 10.0 micron
1
10
100
1,000
10,000
100,000
1,000,000
10,000,000
20 22 24 26 28 30 32 34 36 38 40
Cum
ulat
ive
Part
icle
Cou
nts
nth 15 minute sampling cycle
Coincident Outside and H2 Master baselineH2 Master 0.3
Outside2 0.3 micron
H2 Master 0.5
Outside2 0.5 micron
H2 Master 1.0
Outside2 1.0 micron
H2 Master 2.0
Outside2 2.0 micron
H2 Master 5.0
Outside2 5.0 micron
H2 Master 10.0
Outside2 10.0 micron

54
Exhaust-only ventilation reduced the indoor HCHO concentration the least, followed by exhaust with mixing, CFIS, and ERV. Exhaust with mixing likely reduced the concentration over exhaust-only because exhaust-only interacted more with the main and master zones than with the front and middle bedroom zones. Whole-house mixing averaged conditions such that concentrations in the main and master zones were lower.
In House 2, the exhaust systems either increased or did not appreciably change the HCHO concentration in the main and master zones. The CFIS and ERV systems showed a significant reduction in HCHO concentration over the baseline, and exhaust tests. In general for both houses, the CFIS and ERV systems showed a 60%–70% reduction in HCHO concentration over exhaust.
Table 13. HCHO Concentrations in House 1 and House 2, for the Baseline Test and Four Different Ventilation Systems
Description HCHO Concentration ug/m3 ppb
H1 Baseline Main 68 56 H1 Baseline Master 71 58 H1 Exhaust Main 51 42
H1 Exhaust Master 53 44 H1 Exhaust W/Mixing Main 42 34
H1 Exhaust W/Mixing Master 40 33 H1 CFIS Main 19 15
H1 CFIS Master 17 14 H1 ERV Main 16 13
H1 ERV Master 11 9 H1 Exhaust W/Mixing Attic 9 8
H1 Exhaust W/Mixing Garage 25 21 H2 Baseline Main 40 33
H2 Baseline Master 23 19 H2 Exhaust Main 39 32
H2 Exhaust Master 37 30 H2 Exhaust W/Mixing Main 36 29
H2 Exhaust W/Mixing Master 32 26 H2 CFIS Main 22 18
H2 CFIS Master 20 16 H2 ERV Main 17 14
H2 ERV Master 11 9 H2 Exhaust W/Mixing Attic 23 18
H2 Exhaust W/Mixing Garage 35 29

55
Figure 36. HCHO concentration measured in the main and master zones of House 1 and House 2
during the baseline test and four ventilation system tests
As shown in Figure 37, HCHO concentration was measured in the vented attic of House 1 and the unvented attic of House 2, as well as both garages during the exhaust with mixing test. The exhaust with mixing test was a period with somewhat higher wind than for the other test periods (4–8 mph versus 0–2 mph) as shown in Figure 12. The vented attic concentration was about 3 times higher than what would be expected for outdoors (~3 μg/m3), while the unvented attic was about 8 times higher. The garages of House 1 and House 2 showed 25 μg/m3 and 35 μg/m3, respectively.
Figure 37. Attic and garage HCHO concentrations for both houses
0
10
20
30
40
50
60
70
80
baseline exhaust exh w/mixing
CFIS ERV
Conc
entr
atio
n (μ
g/m
3 )
Formaldehyde Concentrationby Ventilation System Type
H1 Main
H1 Master
H2 Main
H2 Master
0
5
10
15
20
25
30
35
40
Attic Garage
Conc
entr
atio
n (μ
g/m
3 )
Formaldehyde Concentrationin Attic and Garage
H2
H1
vented
unvented

56
4.6 Volatile Organic Compound Sampling Sampling for VOCs was done during the last 1½ hour of each 24-hour test period. Concentrations of the Top 20 VOCs were reported by the testing lab. The top half of those are shown in Figure 38 through Figure 41. The trend was that the baseline test showed the highest VOC concentrations, followed by the exhaust and exhaust with mixing ventilation systems, then the CFIS and ERV ventilation systems. In a few cases the order was different, and in some cases the results for all systems were relatively close to each other.
A full list of the functional descriptions of the VOCs found in the living zones, attics, and garages is given in Appendix A The highest concentrations found in House 1 were for xylene and benzene, solvents used in sealing the decoratively stained concrete floors throughout both houses. In House 2, a floor sealer was used that was designed to be lower emitting than the sealer used in House 1, and it apparently worked as advertised. House 2 also used a special gypsum board reported to absorb VOCs. Two of the top three compounds found in the House 2 unvented attic were related to the foam insulation used in the walls and unvented attic. Besides the xylene, benzene, and toluene solvents used in finishing the stained concrete floors in House 1, the predominant compounds found in both houses were:
• Pinene—used as a fragrance chemical
• Limonene—used in flavor, fragrance, cosmetics, and cleaning products
• Hexanal—used in flavor products
• Carene—used in flavor and fragrance products; occurs naturally in turpentine, rosemary, cedar, pine
• Phellandrene—used in fragrances.
Some of the same compounds found in this study were also found in a prior study by Hodgson et al. (2000), where in both manufactured and site-built houses, the predominant airborne compounds were a-pinene, HCHO, hexanal, and acetic acid.
Objectionable odor thresholds for the variety of VOCs measured in this study, many of which were found to be intentional fragrance or flavor products, are unknown. That was not a goal of this study. However, people generally know by experience about objectionable odors due to general living activities, often just called “stuffiness.” While even in that case constituent chemical odor thresholds are not known, surrogate thresholds have been found to make sense, such as tracking and adjusting ventilation to carbon dioxide levels when people are the predominant source of the odor. Controlling ventilation to avoid the “stuffiness” odor complaint is a practical objective in building management. The metric of annual average relative dose of any chemical contaminant is meaningless to this objective because the time scale is completely inappropriate. For general odor control, a ventilation time scale of a few hours is appropriate. After proper local exhaust of concentrated sources, dilution of indoor odors by full distribution of ventilation air, and recirculation mixing to homogenize larger low concentration areas with smaller high concentration areas, is a practical and reasonable approach to indoor air odor control.

57
Figure 38. Concentrations of the top 11 VOCs found in the main zone of House 1, for the baseline
test and four different ventilation systems
Figure 39. Concentrations of the top 11 VOCs found in the master zone of House 1, for the
baseline test and four different ventilation systems
0 20 40 60 80 100 120 140 160 180
Xylene (para and/or meta)
Xylene, ortho
Benzene, ethyl
Hexanal
3-Carene
-Phellandrene*
Cyclopentasiloxane, decamethyl
Limonene (Dipentene; 1-Methyl-4-(1-methylethyl)cyclohexene)
Benzene, 1-methylethyl (Cumene)
Pinene, (6,6-Dimethyl-2-methylene-bicyclo[3.1.1]heptane)
Nonyl aldehyde (Nonanal)
Concentration (μg/m3)
H1 baseline, Main
H1 exhaust, Main
H1 exh w/mix, Main
H1 CFIS, Main
H1 ERV, Main
0 50 100 150 200
Xylene (para and/or meta)
Xylene, ortho
Benzene, ethyl
Hexanal
3-Carene
-Phellandrene*
Cyclopentasiloxane, decamethyl
Limonene (Dipentene; 1-Methyl-4-(1-methylethyl)cyclohexene)
Benzene, 1-methylethyl (Cumene)
Pinene, (6,6-Dimethyl-2-methylene-bicyclo[3.1.1]heptane)
Nonyl aldehyde (Nonanal)
Concentration (μg/m3)
H1 baseline, Master
H1 exhaust, Master
H1 exh w/mix, Master
H1 CFIS, Master
H1 ERV, Master

58
Figure 40. Concentrations of the top 10 VOCs found in the main zone of House 2, for the baseline
test and four different ventilation systems
Figure 41. Concentrations of the top 10 VOCs found in House 2 master zone, for the baseline test
and four different ventilation systems
0 20 40 60 80 100
Pinene, (2,6,6-Trimethyl-bicyclo[3.1.1]hept-2-ene)
Hexanal
Limonene (Dipentene; 1-Methyl-4-(1-methylethyl)cyclohexene)
3-Carene
-Phellandrene*
Pinene, (6,6-Dimethyl-2-methylene-bicyclo[3.1.1]heptane)
Cyclopentasiloxane, decamethyl
Pentanal
1-Pentanol (N-Pentyl alcohol)
Nonyl aldehyde (Nonanal)
Concentration (μg/m3)
H2 baseline, Main
H2 exhaust, Main
H2 exh w/mix, Main
H2 CFIS, Main
H2 ERV, Main
0 20 40 60 80 100
Pinene, (2,6,6-Trimethyl-bicyclo[3.1.1]hept-2-ene)
Hexanal
Limonene (Dipentene; 1-Methyl-4-(1-methylethyl)cyclohexene)
3-Carene
-Phellandrene*
Pinene, (6,6-Dimethyl-2-methylene-bicyclo[3.1.1]heptane)
Cyclopentasiloxane, decamethyl
Pentanal
1-Pentanol (N-Pentyl alcohol)
Nonyl aldehyde (Nonanal)
Concentration (μg/m3)
H2 baseline, Master
H2 exhaust, Master
H2 exh w/mix, Master
H2 CFIS, Master
H2 ERV, Master

59
Table 16 shows the VOC concentrations measured in the attics of both houses and provides a description of the typical functional use of each compound, as researched on the Internet. Once again, the solvents used in finishing the decorative concrete floors in the living space show up in the House 1 attic. The remaining compounds were mostly seemingly low-risk fragrance and flavor products. Figure 42 shows the data from Table 6 in graphical form.
Total volatile organic compound (TVOC) measurements are reported in Table 14 by house, zone, and ventilation system. The TVOC data showed that, compared to the exhaust system, the CFIS and ERV ventilation systems reduced TVOCs by 47% and 57%, respectively, averaged between the two houses. Compared to the baseline tests, the exhaust system increased TVOC by 37% in the House 1 main zone, and increased TVOC by 18% in the House 2 master zone. This highlights that the unknown air path, or source of outside air, for the exhaust ventilation system can cause indoor air to be more contaminated depending on what contaminants are picked up on the way in.
Table 14. TVOC by House, Zone, and Ventilation System
Test #
Ventilation System
Main Zone Master Zone TVOC μg/m³
% Diff. From
Exhaust
TVOC μg/m³
% Diff. From
Exhaust
Average % Diff.
House 1 1 Baseline 690 –37% 1,310 123% 43% 2 Exhaust 1100 – 588 – – 3 Exhaust w/mixing 820 –25% 865 47% 11% 4 CFIS 459 –58% 458 –22% –40% 5 ERV 357 –68% 271 –54% –61%
House 2 1(6) Baseline 519 6% 511 –18% –6%
2 Exhaust 491 – 622 – – 3 Exhaust w/mixing 477 –3% 438 –30% –16% 4 CFIS 264 –46% 252 –59% –53% 5 ERV 295 –40% 209 –66% –53%
Combined 1 Baseline 18% 2 Exhaust – 3 Exhaust w/mixing –3% 4 CFIS –47% 5 ERV –57%
TVOC measurements in the attic and garage zones of both houses were taken at the same time during the exhaust with mixing test. These values are shown in Table 15. The TVOC measurement in the unvented attic of House 2 was slightly higher than the baseline test measurements in the main and master zones, and, as expected, the unvented attic of House 2 showed higher TVOC than the vented attic of House 1. Neither of the garages had any vehicles
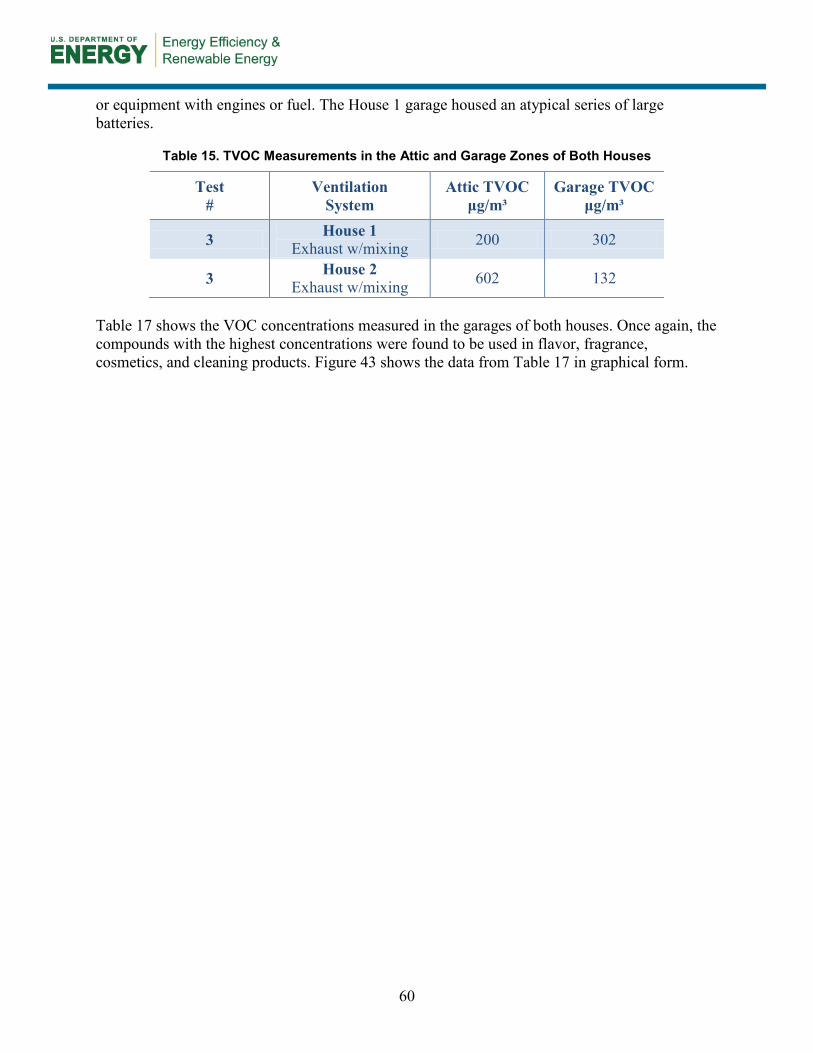
60
or equipment with engines or fuel. The House 1 garage housed an atypical series of large batteries.
Table 15. TVOC Measurements in the Attic and Garage Zones of Both Houses
Test #
Ventilation System
Attic TVOC μg/m³
Garage TVOC μg/m³
3 House 1 Exhaust w/mixing 200 302
3 House 2 Exhaust w/mixing 602 132
Table 17 shows the VOC concentrations measured in the garages of both houses. Once again, the compounds with the highest concentrations were found to be used in flavor, fragrance, cosmetics, and cleaning products. Figure 43 shows the data from Table 17 in graphical form.

61
Table 16. VOCs Found in Both Attics, Sorted by High to Low Concentration in the House 2 Unvented Attic
CAS Number VOC
H1-T3 ATTIC
H2-T3 ATTIC Functional Description
μg/m³ ppb μg/m³ ppb
3033-62-3 Ethanamine, 2,2'-oxybis[N,N-dimethyl- 62.3 9.5 Used in 2-component polyurethane foam
66-25-1 Hexanal 16.1 3.9 46.6 11.4 Flavor products
13674-84-5 Tris(1-chloro-2-propyl)phosphate 44.9 3.4 Flame retardant in polyurethane foams
138-86-3 Limonene (Dipentene; 1-
Methyl-4-(1-methylethyl)cyclohexene)
7.9 1.4 37.2 6.7 Used in flavor, fragrance, cosmetics, and cleaning products
555-10-2 -Phellandrene* 7.4 1.3 34.0 6.1 Phellandrenes are used in fragrances because of their pleasing aromas
80-56-8 Pinene, (2,6,6-Trimethyl-bicyclo[3.1.1]hept-2-ene) 11.1 2.0 30.0 5.4 Fragrance chemical
13466-78-9 3-Carene 7.9 1.4 27.3 4.9 Flavor and fragrance products; occurs naturally in turpentine, rosemary, cedar, pine
127-91-3 Pinene, (6,6-Dimethyl-2-
methylene-bicyclo[3.1.1]heptane)
6.1 1.1 22.2 4.0 Fragrance chemical
124-19-6 Nonyl aldehyde (Nonanal) 6.6 1.1 20.7 3.6 Flavor and fragrance products. 124-13-0 Octanal 4.2 0.8 15.0 2.9 Flavor and fragrance products
71-41-0 1-Pentanol (N-Pentyl alcohol) 3.2 0.9 14.7 4.1 Food additive: functional use(s) - flavor and fragrance agents; also
used in paper products in contact with dry food
110-62-3 Pentanal 3.7 1.1 12.0 3.4 Flavor, rubber accelerator 111-71-7 Heptanal (Heptaldehyde) 2.8 0.6 10.9 2.3 Flavor and fragrance products
111-70-6 1-Heptanol 10.9 2.3 Food additive: functional use(s) - flavor and fragrance agents
140-67-0 Estragole (4-Allylanisole) 8.2 1.4 Flavor and fragrance; distilled from basil
111-87-5 1-Octanol 7.1 1.3 Food additive: functional use(s) - flavor and fragrance agents
123-35-3 1,6-Octadiene,7-methyl-3-methylene (Myrcene) 6.4 1.1 Fragrance chemical

62
CAS Number VOC
H1-T3 ATTIC
H2-T3 ATTIC Functional Description
μg/m³ ppb μg/m³ ppb
99-83-2 -Phellandrene* 6.1 1.1 Phellandrenes are used in fragrances because of their pleasing aromas
100-52-7 Benzaldehyde 2.1 0.5 5.9 1.4 Almond flavor
541-02-6 Cyclopentasiloxane, decamethyl 1.7 0.1 5.7 0.4 Cosmetics, personal-care products, manufacture of silicone polymers
106-42-3 Xylene (para and/or meta) 33.8 7.8 Solvent, paint and varnish thinner 95-47-6 Xylene, ortho 28.7 6.6 Solvent, paint and varnish thinner
100-41-4 Benzene, ethyl 6.6 1.5 Used in the production of (poly)styrene, and in some paints
3221-61-2 Octane, 2-methyl 4.3 0.7 Hydrocarbon fuel, solvent
64-19-7 Acetic acid 2.2 0.9 Vinegar, food additive; also used industrially in the production of
wood glue, synthetic fabrics
1120-21-4 Undecane 2.1 0.3 Hydrocarbon fuel, solvent
108-88-3 Toluene (Methylbenzene) 1.9 0.5 Solvent, paint thinner; also used in adhesives and fuels

63
Figure 42. VOCs found in the attics of House 1 and House 2
0.0 20.0 40.0 60.0 80.0
Ethanamine, 2,2'-oxybis[N,N-dimethyl-
Hexanal
Tris(1-chloro-2-propyl)phosphate
Limonene (Dipentene; 1-Methyl-4-(1-methylethyl)cyclohexene)
-Phellandrene*
Pinene, (2,6,6-Trimethyl-bicyclo[3.1.1]hept-2-ene)
3-Carene
Pinene, (6,6-Dimethyl-2-methylene-bicyclo[3.1.1]heptane)
Nonyl aldehyde (Nonanal)
Octanal
1-Pentanol (N-Pentyl alcohol)
Pentanal
Heptanal (Heptaldehyde)
1-Heptanol
Estragole (4-Allylanisole)
1-Octanol
1,6-Octadiene,7-methyl-3-methylene (Myrcene)
-Phellandrene*
Benzaldehyde
Cyclopentasiloxane, decamethyl
Xylene (para and/or meta)
Xylene, ortho
Benzene, ethyl
Octane, 2-methyl
Acetic acid
Undecane
Toluene (Methylbenzene)
Concentration (μg/m3)
H1 Attic
H2 attic
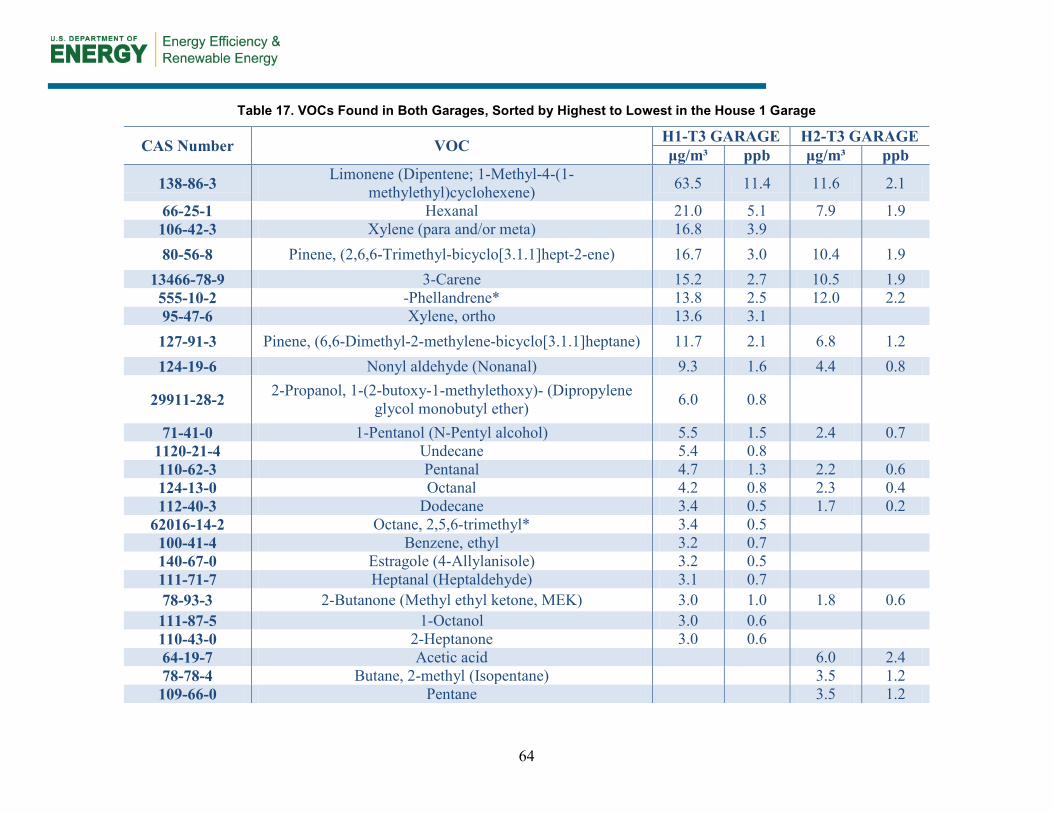
64
Table 17. VOCs Found in Both Garages, Sorted by Highest to Lowest in the House 1 Garage
CAS Number VOC H1-T3 GARAGE H2-T3 GARAGE μg/m³ ppb μg/m³ ppb
138-86-3 Limonene (Dipentene; 1-Methyl-4-(1-methylethyl)cyclohexene) 63.5 11.4 11.6 2.1
66-25-1 Hexanal 21.0 5.1 7.9 1.9 106-42-3 Xylene (para and/or meta) 16.8 3.9 80-56-8 Pinene, (2,6,6-Trimethyl-bicyclo[3.1.1]hept-2-ene) 16.7 3.0 10.4 1.9
13466-78-9 3-Carene 15.2 2.7 10.5 1.9 555-10-2 -Phellandrene* 13.8 2.5 12.0 2.2 95-47-6 Xylene, ortho 13.6 3.1 127-91-3 Pinene, (6,6-Dimethyl-2-methylene-bicyclo[3.1.1]heptane) 11.7 2.1 6.8 1.2 124-19-6 Nonyl aldehyde (Nonanal) 9.3 1.6 4.4 0.8
29911-28-2 2-Propanol, 1-(2-butoxy-1-methylethoxy)- (Dipropylene glycol monobutyl ether) 6.0 0.8
71-41-0 1-Pentanol (N-Pentyl alcohol) 5.5 1.5 2.4 0.7 1120-21-4 Undecane 5.4 0.8 110-62-3 Pentanal 4.7 1.3 2.2 0.6 124-13-0 Octanal 4.2 0.8 2.3 0.4 112-40-3 Dodecane 3.4 0.5 1.7 0.2
62016-14-2 Octane, 2,5,6-trimethyl* 3.4 0.5 100-41-4 Benzene, ethyl 3.2 0.7 140-67-0 Estragole (4-Allylanisole) 3.2 0.5 111-71-7 Heptanal (Heptaldehyde) 3.1 0.7 78-93-3 2-Butanone (Methyl ethyl ketone, MEK) 3.0 1.0 1.8 0.6 111-87-5 1-Octanol 3.0 0.6 110-43-0 2-Heptanone 3.0 0.6 64-19-7 Acetic acid 6.0 2.4 78-78-4 Butane, 2-methyl (Isopentane) 3.5 1.2 109-66-0 Pentane 3.5 1.2

65
CAS Number VOC H1-T3 GARAGE H2-T3 GARAGE μg/m³ ppb μg/m³ ppb
108-88-3 Toluene (Methylbenzene) 2.6 0.7 108-94-1 Cyclohexanone 2.5 0.6 109-99-9 Furan, tetrahydro (THF) 1.8 0.6 100-52-7 Benzaldehyde 1.6 0.4 586-62-9 Cyclohexene, 1-methyl-4-(1-methylethylidene)* 1.5 0.3 100-42-5 Styrene 1.5 0.2
*Indicates best NIST/EPAINIH library match only.

66
Figure 43. VOCs found in the garages of House 1 and House 2
0.0 10.0 20.0 30.0 40.0 50.0 60.0 70.0
Limonene (Dipentene; 1-Methyl-4-(1-…
Hexanal
Xylene (para and/or meta)
Pinene, (2,6,6-Trimethyl-bicyclo[3.1.1]hept-2-…
3-Carene
-Phellandrene*
Xylene, ortho
Pinene, (6,6-Dimethyl-2-methylene- …
Nonyl aldehyde (Nonanal)
2-Propanol, 1-(2-butoxy-1-methylethoxy)- …
1-Pentanol (N-Pentyl alcohol)
Undecane
Pentanal
Octanal
Dodecane
Octane, 2,5,6-trimethyl*
Benzene, ethyl
Estragole (4-Allylanisole)
Heptanal (Heptaldehyde)
2-Butanone (Methyl ethyl ketone, MEK)
1-Octanol
2-Heptanone
Acetic acid
Butane, 2-methyl (Isopentane)
Pentane
Toluene (Methylbenzene)
Cyclohexanone
Furan, tetrahydro (THF)
Benzaldehyde
Cyclohexene, 1-methyl-4-(1-methylethylidene)*
Styrene
Concentration (μg/m3)
H1 Garage
H2 Garage

67
5 Summary of Results
The research presented here was intended to develop a better understanding of whole-building ventilation system effectiveness and distribution in low energy homes which is critical to promoting the best low-energy and high-value ventilation solutions. Through this research project BSC sought to address the following research questions. The answers to those questions are provided below in the form of conclusions and recommendations:
1. Do different whole-building ventilation systems perform significantly differently in terms of their ability to deliver uncontaminated ventilation air to the occupants?
The testing showed that source of the single-point exhaust ventilation was not direct from outside (much of it came from the attic), the ventilation air was not distributed, and no provision existed for air filtration. Indoor air recirculation by a central air distribution system can help improve the exhaust ventilation system by way of air mixing and filtration. In contrast, the supply and balanced ventilation systems showed that there is a significant benefit to drawing outside air from a known outside location, and filtering and distributing that air.
In terms of internal air distribution, the baseline system showed little inter-zonal airflow in all cases, which confirmed that the trends indicated by the interzonal airflow results were reliable. All systems showed little interzonal airflow between bedrooms. The most interzonal airflow was between the main zone and bedroom zones for the CFIS and exhaust with mixing cases. The Exhaust cases showed significant airflow from main to master and no airflow in the reverse direction, as expected with the exhaust fan located in the master zone. Otherwise, the Exhaust systems showed little inter-zonal airflow and distribution of ventilation air. The ERV system showed little airflow from Main to bedrooms and between bedrooms, but relatively high airflow from bedrooms to the Main zone, as expected since the ERV system supplied fresh air to the bedrooms and exhausted stale air from the Main zone.
2. What measurements and testing protocols are needed to appropriately account for the source of outside air relevant to occupant exposure to chemical and particulate contaminants in residential environments?
The full test battery applied in this research project was utilized to answer the research questions posed. The PFT testing and analysis was required to identify and compare zone air change rates and inter-zonal airflow which informed the ventilation air distribution question. The interzonal airflow results also helped inform the finding of a relative average of 70% higher particle counts in the 0.3–2.0 micron range using exhaust ventilation where a substantial amount of the ventilation air came across the dirty attic floor environment. The particulate, HCHO, and other VOC measurements taken in more than one zone supported the consistency and reliability of the measurement and analysis methods, and showed clear differences in the resulting indoor air quality between ventilation systems. Indoor and outdoor temperature and RH temperature, and wind speed measurements provided assurance that significant differences would not be related to those factors. The extensive building characterization measurements made sure that there were not large anomalies in building enclosure air leakage, or mechanical system operation and allowed for future modeling to expand the findings beyond the measured test results.

68
3. What is the overall indoor air quality impact of operating an exhaust whole-building ventilation system versus supply and balanced ventilation?
Exhaust ventilation testing showed lower uniformity of outdoor air exchange rate between living space zones, and higher concentrations of particulates, HCHO, and other Top 20 VOCs than did the supply and balanced ventilation systems.
4. For whole-building ventilation systems that do not draw outside air directly from a known fresh air source, how much of the ventilation air is drawn through potentially contaminated adjacent spaces such as garages and vented attics?
For the two houses studied, exhaust ventilation testing showed that only a small amount of air was drawn from the garage while a considerable amount was drawn from the attics, more so from the vented attic. The exhaust ventilation system in House 1 was moving approximately 20% of its air ventilation air from the vented attic to the main zone. Approximately 14% of the exhaust ventilation air in House 1 was moving from the attic to the bedroom zones. In comparison, for the unvented attic of House 2, the Exhaust system moved approximately 2% of its ventilation air from the attic to the main zone. This indicates that the exhaust makeup air resistance path to outside was greater through the unvented attic than through the vented attic and an Exhaust ventilation system may perform better in an unvented attic house.
5. What is the impact of drawing outdoor air through the building enclosure and adjacent unoccupied spaces on the level of particulate contaminants within the conditioned space?
Drawing air through the building enclosure and adjacent spaces via exhaust ventilation showed approximately 70% higher concentrations of particulates on average relative to ventilation systems that had direct outside air intake and filtered that air. The highest particulate levels were found for the exhaust system, followed by the baseline or ERV, followed by the exhaust with mixing and CFIS. CFIS always showed the lowest particle counts regardless of particle size. This indicated that the filters in the central air distribution system were removing a significant amount of particle contaminant 0.3 micron and larger. The CFIS ventilation system showed an approximate 85% and 73% reduction in 0.3–2.0 micron particles for House 1 and House 2, respectively, attributable to recirculation air filtration by operation of the central air distribution system.
6. What is the impact of drawing outdoor air through the building enclosure and adjacent unoccupied spaces on the level of chemical contaminants within the conditioned space?
Drawing air through the building enclosure and adjacent spaces via exhaust ventilation showed higher concentrations of formaldehyde and other Top 20 VOCs.
In House 1, all ventilation systems reduced the HCHO concentration over the baseline concentration, which was roughly 15–20 times higher than what would be expected outdoors. Exhaust-only ventilation reduced the indoor HCHO concentration the least, followed by exhaust with mixing, CFIS, and ERV. In House 2, the exhaust systems either increased or did not appreciably change the HCHO concentration in the main and master zones. The CFIS and ERV
69
systems showed a significant reduction in HCHO concentration over the baseline and exhaust tests. In general for both houses, the CFIS and ERV systems showed a 60%–70% reduction in HCHO concentration over exhaust.
HCHO concentration was also measured in the attics and garages of both houses during the exhaust with mixing test. The vented attic concentration was about 3 times higher than what would be expected for outdoors, while the unvented attic and the garages were about 8–10 times higher.
Concentrations of the Top 20 VOCs were reported by the lab analysis. The trend found in the main and master zones was that the baseline test tended to show the highest VOC concentrations, followed by the exhaust and exhaust with mixing ventilation systems, then the CFIS and ERV ventilation systems. In a few cases the order was different, and in some cases the results for all systems were relatively close to each other.
The highest VOC concentrations found in House 1 were for xylene and benzene, solvents used in sealing the decoratively stained concrete floors throughout both houses. In House 2, a floor sealer was used that was designed to be lower emitting than the sealer used in House 1, and it apparently worked as advertised. House 2 also used a special gypsum board reported to absorb VOCs. Besides the xylene, benzene, and toluene solvents used in finishing the stained concrete floors in House 1, the seemingly harmless balance of predominant compounds found in both houses were:
• Pinene—used as a fragrance chemical
• Limonene—used in flavor, fragrance, cosmetics, and cleaning products
• Hexanal—used in flavor products
• Carene—used in flavor and fragrance products; occurs naturally in turpentine, rosemary, cedar, pine
• Phellandrene— used in fragrances.
TVOC data showed that, compared to the exhaust system, the CFIS and ERV ventilation systems reduced TVOCs by approximately 47% and 57%, respectively, averaged between the two houses. Compared to the baseline tests, the exhaust system increased TVOC by approximately 37% in the House 1 main zone, and increased TVOC by approximately 18% in the House 2 master zone. This highlights that the unknown air path, or source of outside air, for the exhaust ventilation system can cause indoor air to be more contaminated depending on what contaminants are picked up on the way in.

70
6 Author Recommendations
The following thoughts and recommendations are presented by the primary author, based on the results of this study. This section is based on the experience of the author and does not necessarily reflect the recommendations of the Building America Program or DOE.
6.1 Relevant Issues With ASHRAE Standard 62.2 ASHRAE Standard 62.2-2010 may be considered to currently contain the “standard of care” for ventilation system design and operation in residential buildings, yet some believe there are some technology gaps with that Standard. ASHRAE Standard 62.2 uses a catch-all approach that assumes that the entire house is a single, well-mixed zone and that there is no difference between different whole-building ventilation systems in providing effective ventilation. To try to facilitate that assumption, the ventilation rate has to be high enough to accommodate the worst performing system, which is single point exhaust. Utilizing high performing systems that draw outside air from a known fresh air location and filter and fully distribute that air to the occupants’ breathing zone (including bedrooms where occupants spend the most continuous time) should allow optimization of the ventilation rate to avoid the energy consumption and moisture control problems of overventilation.
The ventilation rates in ASHRAE Standard 62.2 are currently based on the collective engineering judgment of the committee members. To the knowledge of this author, there is no published basis for the rates in any health or medical study. Therefore, this author believes that the numerical recommendations established based on the results of this study are appropriate, using similar logic used by the ASHRAE 62.2 committee.
ASHRAE Standard 62.2 uses relative annual average dose to a generic contaminant as the metric to allow for a performance-based compliance approach and to account for intermittent versus continuous ventilation. That metric may be valid for avoiding exposure to contaminants that may cause cancer over 20 years, but that metric ignores shorter term odor, moisture, and sensory irritation effects, which is really the only obvious metric occupants have available to determine their satisfaction level with indoor air. While the available medical science for cancer causing-chemical contaminants at concentrations typically found in residential environments is almost nonexistent, the science for shorter term asthma and allergy response is better known (Bornehag et al. 2004). Occupant observation of objectionable odor, visible moisture, or mold caused by that moisture, and sensory irritation is overt. Those overt objections are what home builders have to deal with even though ASHRAE Standard 62.2 primarily does not.
6.1.1 Source of Outside Air ASHRAE Standard 62.2-2010 requires that supply and balanced ventilation systems draw outside air directly from a known fresh air location but does not include any such requirement for exhaust ventilation systems. Therefore, makeup air for exhaust ventilation air comes from the paths of least resistance, which could be through a garage, attic, crawlspace, basement, or other soil contact location. To be consistent, at the very least the Standard would need to require intentional makeup air inlets, or, much better, require a supply system that provides makeup air from a known fresh air location whenever the whole-building exhaust ventilation system was operating.
71
In contrast, the following building codes have provisions requiring direct outside air for all ventilation systems: the International Mechanical Code (IMC), the Washington State Ventilation and Indoor Air Quality (WAVIAQ) Code, the U. S. Housing and Urban Development (HUD) Code, and the National Building Code (NBC) of Canada. A brief description of those requirements follows:
IMC 2012: The IMC 2012 requires a balanced ventilation system with outdoor supply air approximately equal to exhaust air.
WAVIAQ Code 2009: The WAVIAQ Code 2009 requires that ventilation systems must have direct outdoor air inlets, and that they be screened and located so as not to take air from a list of contaminated areas, including areas where odors may be objectionable, attics, crawlspaces, or garages.
HUD Code 2008: The HUD Code requires that the ventilation system be balanced, and designed to exchange air directly with the exterior of the home. It specifically prohibits air drawn from the space underneath the home, through the floor, walls, or ceiling/roof systems.
NBC 2005: The NBC 2005 stipulates that outside air supply be provided and connected directly to outside.
6.1.2 Ventilation Effectiveness In terms of ventilation effectiveness, ASHRAE Standard 62.2 accounts only for temporal (time based) effectiveness over an annual average; there is no provision for spatial (space-to-space) ventilation distribution effectiveness, or system effects. In other words, ASHRAE Standard 62.2 accounts for ventilation effectiveness only in regards to system runtime. Even so, while the maximum ventilation air delivery cycle time is truncated to one day, the runtime effectiveness values are based on calculations that would allow the ventilation system to be off for months without any decrease in effectiveness, because the evaluation metric is locked to relative annual average exposure to a generic contaminant11. That approach ignores shorter term indoor air quality effects of odor and sensory irritation, which are nevertheless stated parts of an acceptable indoor air quality approach in the ASHRAE Standard 62.2 Scope, and definitions of “acceptable indoor air quality” and “air cleaning.”
In contrast, the following building codes have provisions requiring ventilation air distribution for all whole-building ventilation systems: IMC, Minnesota Building Code, WAVIAQ Code, the HUD Code, and the NBC of Canada. A brief description of those requirements follows:
IMC 2012: The IMC requires an approximately balanced ventilation system with the ventilation supply system designed to deliver the required rate of outdoor airflow to the breathing zone within each occupiable space. The WAVIAQ Code requires the
11 Relative annual average dose is the only metric used in ASHRAE Standard 62.2 for the performance based compliance method and to calculate intermittent ventilation effectiveness factors. The method tracks a generic contaminant (rather than any specific contaminants) and compares the annual average dose of the generic contaminant (in an assumed single-zone, well-mixed building model) using an actual continuous or intermittent ventilation air exchange rate relative to a reference continuous air exchange rate.

72
introduction and distribution of outdoor air and the removal of indoor air by mechanical means. It further requires that outdoor air be distributed to each habitable room by means such as individual inlets, separate duct systems, or a forced-air system.
MBC 2009: The MBC requires ventilation air distribution and circulation such that outdoor air is delivered to each habitable space by a forced air circulation system, separate duct system, individual inlets, or a passive opening. When outside air is directly ducted to a forced air circulation system, circulation of 0.075 cfm/ft2 must be maintained on average each hour. When outside air is not directly ducted to a forced air circulation system, circulation of 0.15 cfm/ft2 must be maintained on average each hour (a 100% increase).
WAVIAQ Code 2009: The WAVIAQ Code requires the introduction and distribution of outdoor air and the removal of indoor air by mechanical means. It further requires that outdoor air be distributed to each habitable room by means such as individual inlets, separate duct systems, or a forced-air system. Conflictingly, in homes with exhaust only ventilation systems without outdoor air inlets the home must have a ducted forced air heating system that communicates with all habitable rooms and the interior doors must be undercut to a minimum of ½ in. above the surface of the finish floor covering; however, nothing is mentioned about a minimum interval of ducted forced air heating system communication with all habitable spaces. This will typically leave days and weeks on end with little or no ventilation air distribution.
HUD Code 2008: The HUD Code requires that ventilation system be designed to ensure that outside air is distributed to all bedrooms and main living areas.
NBC 2005: In the NBC, for ventilation systems not used in conjunction with a forced air heating system, an outside air supply ventilation fan is required with the same rated capacity as the principle [exhaust] ventilation fan to distribute outside air directly to all bedrooms through a system of supply ducts. Where an exhaust-only system is installed via the principal ventilation fan, the exhaust fan control must be wired so that activation of the exhaust fan automatically activates the circulation fan of the forced air distribution system required at its rated capacity but not less than 5 times the rated capacity of the exhaust fan. Alternately, interlocking the forced air distribution system's circulation fan with the principal (exhaust) ventilation fan can be accomplished where the forced air distribution system is equipped with a control that automatically activates the circulation fan at user-selected intervals.
ASHRAE Standard 62.2 does not attempt to address the issue of delivery of outdoor airflow to each space, or to the breathing zone within each occupiable space, or forced air circulation/distribution of ventilation air. It simply makes an overreaching assumption that for all ventilation system cases, the entire house is a single, well-mixed zone, focusing only on relative annual average exposure.
6.2 Recommendations for Ventilation Rates Exhaust ventilation testing showed lower uniformity of outdoor air exchange rate between living space zones, and higher concentrations of particulates, HCHO, and other Top 20 VOCs than did the supply and balanced ventilation systems. This showed that single-point exhaust ventilation

73
was inferior as a whole-house ventilation strategy. It was inferior because the source of outside air was not direct from outside (much of it came from the attic), the ventilation air was not distributed, and no provision existed for air filtration. Indoor air recirculation by a central air distribution system can help improve the exhaust ventilation system by way of air mixing and filtration. In contrast, the supply and balanced ventilation systems showed that there is a significant benefit to drawing outside air from a known outside location, and filtering and distributing that air.
ASHRAE Standard 62.2 has set a ventilation airflow rate method that does not differentiate between better and worse performing whole-building ventilation systems. The rates set are inferred to be adequate for the worst performing system. System factors as shown in Table 18 could be applied to allow accounting for ventilation system attributes that improve a system’s performance. The system factors are based on engineering judgment resulting from this study and previous studies (Hendron et al. 2006, 2007; Rudd and Lstiburek 2000, 2001, 2008; Townsend et al. 2009a, 2009b), and extensive work with the ASHRAE Standard 62.2 committee on this subject since 2006. Engineering judgment is valid here since the ASHRAE Standard 62.2 ventilation rates are themselves based only on the engineering judgment and experience of the committee members, not on any health or medical studies. In terms of multizone ventilation air change effectiveness, the cited previous research found that fully distributed supply ventilation, operating at half the airflow of single-point exhaust, uniformly ventilated all spaces to a level that equaled or exceeded the ventilation level of the lesser ventilated spaces using the exhaust system. This study added new elements of ventilation effectiveness research, accounting for source of outside air, particle contaminants, and VOC contaminants. These new data give further support for ventilation rate credit for better performing ventilation systems, such as supply and balanced ventilation compared to exhaust, and systems with predictable filtration of outside air and recirculation filtration. The Table 18 System Factors are recommended for consideration in the Building America program (including the DOE Challenge Home) to allow credit for better performing ventilation systems. This would yield energy savings and reduced moisture control risk in humid climates, without compromising indoor air quality relative to the worst performing system allowed by ASHRAE Standard 62.2.
Table 18. Recommended System Factors To Reduce Ventilation Fan Airflow Rates Relative to ASHRAE Standard 62.2-2013
Mechanical Ventilation System Type
With Central Filtration Recirculation*
Without Central Filtration Recirculation
Balanced 0.5 0.7 Unbalanced Supply 0.55 0.75 Unbalanced Exhaust 0.7 1.0
* Requires minimum whole-house recirculation turnover of 0.7 ach with minimum MPR 700 or MERV 9 filter. Minimum whole-house recirculation turnover defined as: (AHU cfm)(minimum runtime min/h) / (conditioned floor area*8 ft).
The numerical basis for the system factors shown inTable 18 is given in Table 19. The values shown in Table 19 are percentage reductions, based on engineering judgment from this and previous studies, for each system improvement that exists for a given ventilation system based on the four System Factor Categories of Balance, Distribution, Outdoor Air Source, and

74
Recirculation Filtration. Balance is where the mechanical ventilation system supplies to the house substantially the same amount of air that it exhausts from the house. That generally increases total air exchange somewhat since, with balanced ventilation, mechanical ventilation mostly sums with natural infiltration. Distribution is where direct outside air is supplied to at least all of the bedrooms, where occupants typically spend the most continuous time. Outdoor Air Source is where outside air comes directly from a known fresh air source, not drawn through potentially contaminated building enclosure elements or adjacent spaces such as garages, attics, and crawlspaces. Recirculation Filtration is where a mechanical system, such as a central heating and cooling system, recirculates a minimum of 70% of the house air volume each hour through an air filter with minimum MPR 700 or MERV 9. The Recirculation Filtration category is given the highest weight in light of recent determinations that particulate contamination presents by far (10 times more than the next closest risk) the greatest risk to human health in residential indoor environments (Logue et al. 2011). Referring again toTable 19, as an example, a Balanced-type ventilation system with whole-building recirculation filtration earns ventilation airflow reduction credit in all four system factor categories. An Unbalanced Exhaust-type ventilation system without whole-building recirculation filtration earns no ventilation airflow reduction credits.

75
Table 19. Numerical Basis for the System Factors Shown in Table 18, Given as Percent Airflow Rate Reduction for Each System Factor Category
Whole-Building Mechanical Ventilation System Type
Percent Reduction in 62.2-2013 Ventilation Rate Due to Listed System Factor Categories
With Whole-Building Recirculation Filtration Without Whole-Building Recirculation Filtration
System Factor Categories System Factor Categories Balance Distribution OA
Source Recirculation
Filtration Total Balance Distribution OA Source
Recirculation Filtration Total
Balanced 5 10 15 20 50 5 10 15 0 30 Unbalanced Supply 0 10 15 20 45 0 10 15 0 25
Unbalanced Exhaust 0 10 0 20 30 0 0 0 0 0

76
References
ASHRAE (2010).Ventilation and Acceptable Indoor Air Quality in Low-rise Residential Buildings. Atlanta, GA: American Society of Heating, Refrigerating and Air-Conditioning Engineers.
ASHRAE (2013).Ventilation and Acceptable Indoor Air Quality in Low-rise Residential Buildings. Atlanta, GA: American Society of Heating, Refrigerating and Air-Conditioning Engineers.
ASHRAE. (2009) Handbook of Fundamentals. Atlanta, GA: American Society of Heating, Refrigerating and Air-Conditioning Engineers, Inc.
Bornehag, C.-J.; Sundell, J.; Weschler, C.J.; Sigsgaard, T.: Lundgren, B.; Hasselgren, M.; Hägerhed-Engman, L. (2004). “The Association between Asthma and Allergic Symptoms in Children and Phthalates in House Dust: A Nested Case–Control Study.” Environmental Health Perspective 112(14): 1393–1397.
Christensen, C.; Anderson, R.; Horowitz, S.; Courtney, A.; Spencer, J. (2006). BEopt™ Software for Building Energy Optimization: Features and Capabilities. Golden, COL National Renewable Energy Laboratory. NREL/TP-550-39929.
Dietz, Russell N. 2006. “Instructions: Brookhaven Air Infiltration Measurement System.” Brookhaven National Laboratory, Upton, NY. Revised: February 2006.
Dodson, R.E.; Levy, J.I.; Shine, J.P.; Spengler, J.D.; Bennett, D.H. (2007). “Multi-Zonal Air Flow Rates in Residences in Boston, Massachusetts.” Atmospheric Environment 41(2007): 3722–3727.
EPA. (1991). EPA Aerometric Information Retrieval System (AIRS).
Hendron, B.; Anderson, R.; Barley, D.; Hancock E. (2006). Building America Field Test and Analysis Report. Draft NREL report.
Hendron, R.; Rudd, A.; Anderson, R.; Barley, D.; Townsend, A. (2007). “Field Test of Room-to-Room Distribution of Outside Air with Two Residential Ventilation Systems.” IAQ 2007: Healthy & Sustainable Buildings Conference Proceedings. American Society of Heating, Refrigerating and Air-Conditioning Engineers, Inc.
Hodgson, A.T.; Rudd, A.; Beal D.; Chandra, S. (2000). “Volatile Organic Compound Concentrations and Emission Rates in New Manufactured and Site-Built Houses.” Indoor Air 10: 178–192.
IAQ Source 2013. http://www.iaqsource.com/article.php/comparing-3m-filtrete-filters/?id=19
Leaderer, B.P.; Schaap, L.; Dietz, R.N. (1995). “Evaluation of the Perfluorocarbon Tracer Technique for Determining Infiltration Rates in Residences.” Environ. Scl. Technol. 19(12): 1225–1232.

77
Logue, J.M.; Price, P.N.; Sherman, M.H.; Singer, B.C. (2001). A Method to Estimate the Chronic Health Impact of Air Pollutants in U.S. Residences. Lawrence Berkeley National Laboratory, Environmental Energy Technologies Division, LBNL Report Number 5267E, November.
Rudd, A.; Henderson, H., Jr. (2007). “Monitored Indoor Moisture and Temperature Conditions in Humid Climate U.S. Residences.” ASHRAE Transactions (17, Dallas 2007). American Society of Heating Refrigeration and Air-Conditioning Engineers, Atlanta, GA.
Rudd, A; Lstiburek, J. (2008). “Systems Research on Residential Ventilation.” Proceedings of the 2008 ACEEE Summer Study on Energy Efficiency in Buildings, Pacific Grove, CA, August. American Council for an Energy Efficient Economy, Washington, D.C.
Rudd, A., Lstiburek J. (2001). “Clean Breathing in Production Homes.” Home Energy Magazine, May/June, Energy Auditor & Retrofiter, Inc., Berkeley, CA.
Rudd, A.; Lstiburek, J. (2000). “Measurement of Ventilation and Inter-zonal Distribution in Single-Family Homes.” ASHRAE Transactions 106(2):709–718, MN-00-10-3, V.106, Pt.2., American Society of Heating Refrigeration and Air-Conditioning Engineers, Atlanta, GA.
Rudd, A.; Lstiburek, J. (1999). “Design Methodology and Economic Evaluation of Central-Fan-Integrated Supply Ventilation Systems.” Indoor Air 5:25-30. Air Infiltration and Ventilation Center, Coventry, United Kingdom.
Townsend, A.; Rudd, A.; Lstiburek, J. (2009a). “Extension of Ventilation System Tracer Gas Testing Using a Calibrated Multi-Zone Airflow Model.” ASHRAE Transactions 115(2).
Townsend, A.; Rudd, A.; Lstiburek, J. (2009b). “A Method for Modifying Ventilation Airflow Rates to Achieve Equivalent Occupant Exposure.” ASHRAE Transactions 115(2).
Walton, G.; Dols, W.S. (2010). “CONTAM User Guide and Program Documentation.” NISTIR 7251, www.bfrl.nist.gov/IAQanalysis/CONTAM/userguide.htm. December.

78
Appendix A: Listing of All Top 20 Volatile Organic Compounds Found, and Their Functional Descriptions
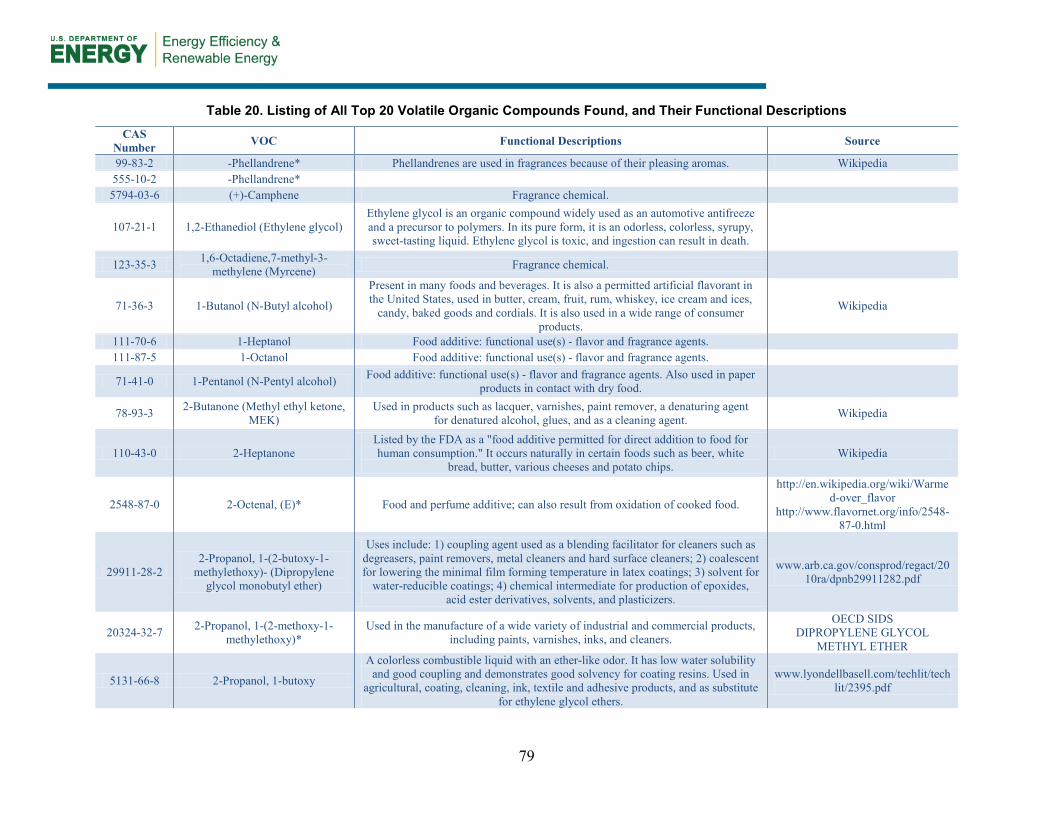
79
Table 20. Listing of All Top 20 Volatile Organic Compounds Found, and Their Functional Descriptions CAS
Number VOC Functional Descriptions Source
99-83-2 -Phellandrene* Phellandrenes are used in fragrances because of their pleasing aromas. Wikipedia 555-10-2 -Phellandrene* 5794-03-6 (+)-Camphene Fragrance chemical.
107-21-1 1,2-Ethanediol (Ethylene glycol) Ethylene glycol is an organic compound widely used as an automotive antifreeze and a precursor to polymers. In its pure form, it is an odorless, colorless, syrupy, sweet-tasting liquid. Ethylene glycol is toxic, and ingestion can result in death.
123-35-3 1,6-Octadiene,7-methyl-3-methylene (Myrcene) Fragrance chemical.
71-36-3 1-Butanol (N-Butyl alcohol)
Present in many foods and beverages. It is also a permitted artificial flavorant in the United States, used in butter, cream, fruit, rum, whiskey, ice cream and ices,
candy, baked goods and cordials. It is also used in a wide range of consumer products.
Wikipedia
111-70-6 1-Heptanol Food additive: functional use(s) - flavor and fragrance agents. 111-87-5 1-Octanol Food additive: functional use(s) - flavor and fragrance agents. 71-41-0 1-Pentanol (N-Pentyl alcohol) Food additive: functional use(s) - flavor and fragrance agents. Also used in paper
products in contact with dry food.
78-93-3 2-Butanone (Methyl ethyl ketone, MEK)
Used in products such as lacquer, varnishes, paint remover, a denaturing agent for denatured alcohol, glues, and as a cleaning agent. Wikipedia
110-43-0 2-Heptanone Listed by the FDA as a "food additive permitted for direct addition to food for human consumption." It occurs naturally in certain foods such as beer, white
bread, butter, various cheeses and potato chips. Wikipedia
2548-87-0 2-Octenal, (E)* Food and perfume additive; can also result from oxidation of cooked food.
http://en.wikipedia.org/wiki/Warmed-over_flavor
http://www.flavornet.org/info/2548-87-0.html
29911-28-2 2-Propanol, 1-(2-butoxy-1-
methylethoxy)- (Dipropylene glycol monobutyl ether)
Uses include: 1) coupling agent used as a blending facilitator for cleaners such as degreasers, paint removers, metal cleaners and hard surface cleaners; 2) coalescent for lowering the minimal film forming temperature in latex coatings; 3) solvent for
water-reducible coatings; 4) chemical intermediate for production of epoxides, acid ester derivatives, solvents, and plasticizers.
www.arb.ca.gov/consprod/regact/2010ra/dpnb29911282.pdf
20324-32-7 2-Propanol, 1-(2-methoxy-1-methylethoxy)*
Used in the manufacture of a wide variety of industrial and commercial products, including paints, varnishes, inks, and cleaners.
OECD SIDS DIPROPYLENE GLYCOL
METHYL ETHER
5131-66-8 2-Propanol, 1-butoxy
A colorless combustible liquid with an ether-like odor. It has low water solubility and good coupling and demonstrates good solvency for coating resins. Used in
agricultural, coating, cleaning, ink, textile and adhesive products, and as substitute for ethylene glycol ethers.
www.lyondellbasell.com/techlit/techlit/2395.pdf
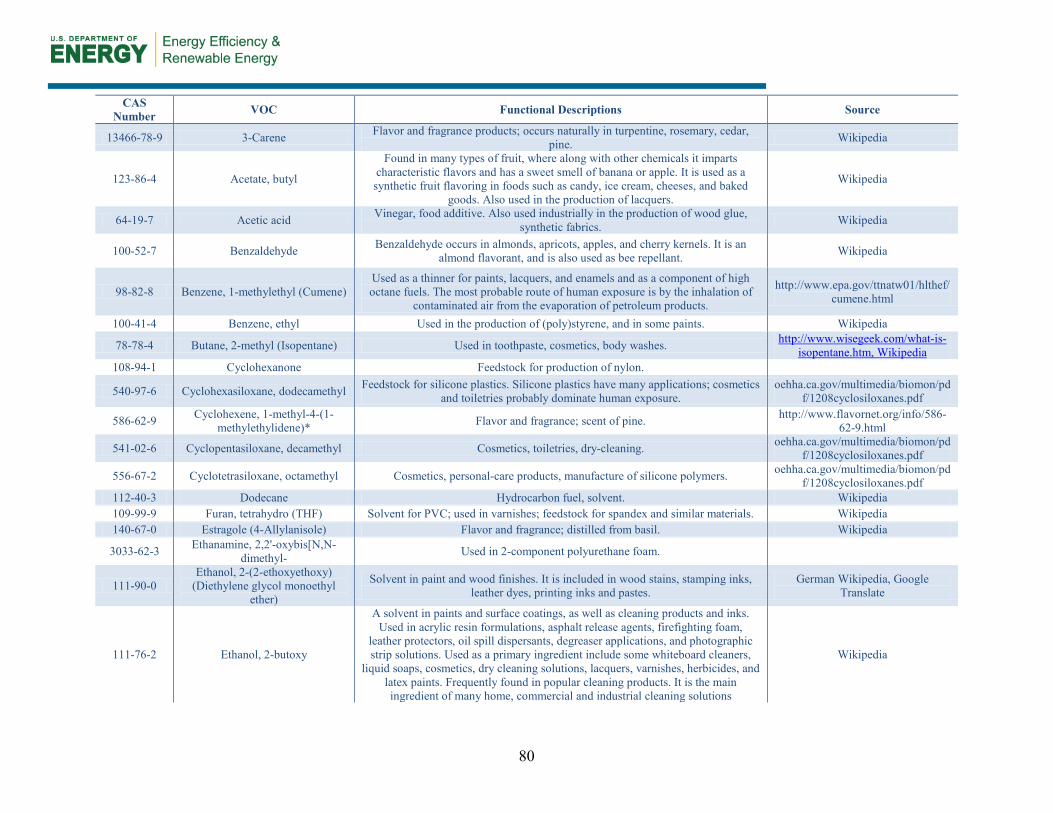
80
CAS Number VOC Functional Descriptions Source
13466-78-9 3-Carene Flavor and fragrance products; occurs naturally in turpentine, rosemary, cedar, pine. Wikipedia
123-86-4 Acetate, butyl
Found in many types of fruit, where along with other chemicals it imparts characteristic flavors and has a sweet smell of banana or apple. It is used as a synthetic fruit flavoring in foods such as candy, ice cream, cheeses, and baked
goods. Also used in the production of lacquers.
Wikipedia
64-19-7 Acetic acid Vinegar, food additive. Also used industrially in the production of wood glue, synthetic fabrics. Wikipedia
100-52-7 Benzaldehyde Benzaldehyde occurs in almonds, apricots, apples, and cherry kernels. It is an almond flavorant, and is also used as bee repellant. Wikipedia
98-82-8 Benzene, 1-methylethyl (Cumene) Used as a thinner for paints, lacquers, and enamels and as a component of high octane fuels. The most probable route of human exposure is by the inhalation of
contaminated air from the evaporation of petroleum products.
http://www.epa.gov/ttnatw01/hlthef/cumene.html
100-41-4 Benzene, ethyl Used in the production of (poly)styrene, and in some paints. Wikipedia
78-78-4 Butane, 2-methyl (Isopentane) Used in toothpaste, cosmetics, body washes. http://www.wisegeek.com/what-is-isopentane.htm, Wikipedia
108-94-1 Cyclohexanone Feedstock for production of nylon. 540-97-6 Cyclohexasiloxane, dodecamethyl Feedstock for silicone plastics. Silicone plastics have many applications; cosmetics
and toiletries probably dominate human exposure. oehha.ca.gov/multimedia/biomon/pd
f/1208cyclosiloxanes.pdf
586-62-9 Cyclohexene, 1-methyl-4-(1-methylethylidene)* Flavor and fragrance; scent of pine. http://www.flavornet.org/info/586-
62-9.html
541-02-6 Cyclopentasiloxane, decamethyl Cosmetics, toiletries, dry-cleaning. oehha.ca.gov/multimedia/biomon/pdf/1208cyclosiloxanes.pdf
556-67-2 Cyclotetrasiloxane, octamethyl Cosmetics, personal-care products, manufacture of silicone polymers. oehha.ca.gov/multimedia/biomon/pdf/1208cyclosiloxanes.pdf
112-40-3 Dodecane Hydrocarbon fuel, solvent. Wikipedia 109-99-9 Furan, tetrahydro (THF) Solvent for PVC; used in varnishes; feedstock for spandex and similar materials. Wikipedia 140-67-0 Estragole (4-Allylanisole) Flavor and fragrance; distilled from basil. Wikipedia
3033-62-3 Ethanamine, 2,2'-oxybis[N,N-dimethyl- Used in 2-component polyurethane foam.
111-90-0 Ethanol, 2-(2-ethoxyethoxy)
(Diethylene glycol monoethyl ether)
Solvent in paint and wood finishes. It is included in wood stains, stamping inks, leather dyes, printing inks and pastes.
German Wikipedia, Google Translate
111-76-2 Ethanol, 2-butoxy
A solvent in paints and surface coatings, as well as cleaning products and inks. Used in acrylic resin formulations, asphalt release agents, firefighting foam,
leather protectors, oil spill dispersants, degreaser applications, and photographic strip solutions. Used as a primary ingredient include some whiteboard cleaners,
liquid soaps, cosmetics, dry cleaning solutions, lacquers, varnishes, herbicides, and latex paints. Frequently found in popular cleaning products. It is the main ingredient of many home, commercial and industrial cleaning solutions
Wikipedia

81
CAS Number VOC Functional Descriptions Source
111-71-7 Heptanal (Heptaldehyde) Flavor and fragrance products. Wikipedia
142-82-5 Heptane
Used in paints and coatings, used as the rubber cement solvent “Bestine,” used as the outdoor stove fuel “Powerfuel” by Primus, used as pure n-Heptane for research and development and pharmaceutical manufacturing and as a minor component of
gasoline.
Wikipedia
66-25-1 Hexanal Flavor products. Wikipedia 589-34-4 Hexane, 3-methyl Hydrocarbon fuel, solvent. Wikipedia
138-86-3 Limonene (Dipentene; 1-Methyl-4-(1-methylethyl)cyclohexene) Used in flavor, fragrance, cosmetics, and cleaning products. Wikipedia
111-84-2 Nonane Hydrocarbon fuel, solvent. Wikipedia 124-19-6 Nonyl aldehyde (Nonanal) Flavor and fragrance products. Wikipedia 124-13-0 Octanal Flavor and fragrance products. Wikipedia
62016-14-2 Octane, 2,5,6-trimethyl* Hydrocarbon fuel, solvent. Wikipedia 3221-61-2 Octane, 2-methyl Hydrocarbon fuel, solvent. Wikipedia 110-62-3 Pentanal Flavor, rubber accelerator. Wikipedia 109-66-0 Pentane Hydrocarbon fuel, solvent. Blowing agent for polystyrene foams. Wikipedia
80-56-8 Pinene, (2,6,6-Trimethyl-bicyclo[3.1.1]hept-2-ene) Fragrance chemical. Wikipedia
127-91-3 Pinene, (6,6-Dimethyl-2-methylene-bicyclo[3.1.1]heptane) Fragrance chemical. Wikipedia
629-59-4 Tetradecane Hydrocarbon fuel, solvent. Wikipedia 100-42-5 Styrene Plastic monomer. Wikipedia 108-88-3 Toluene (Methylbenzene) Solvent, paint thinner. Also used in adhesives and fuels. Wikipedia
13674-84-5 Tris(1-chloro-2-propyl)phosphate Flame retardant in polyurethane foams. www.inchem.org/documents/sids/sids/13674845.pdf
1120-21-4 Undecane Hydrocarbon fuel, solvent. Wikipedia 106-42-3 Xylene (para and/or meta) Solvent, paint and varnish thinner. Wikipedia 95-47-6 Xylene, ortho Solvent, paint and varnish thinner. Wikipedia

82
Appendix B: Preliminary CONTAM Model
CONTAM (Walton and Dols 2010) is a multizone indoor air quality and ventilation analysis computer program designed help determine: (a) airflows in building systems driven by mechanical and natural means; (b) contaminant concentrations transported by these airflows; and (c) personal exposure of occupants to airborne contaminants. In future work, further analysis using the CONTAM model started in this project would allow expansion of this work for evaluating ventilation system impacts over a year-long period, and for different climates. A fully developed model could be calibrated using the tracer gas airflow results, then used to expand the capability to further explore the source of outside air and ventilation air distribution effects over a broader range of conditions, such as: different seasons, climates, enclosure leakage rates, ventilation systems, ventilation control strategies, and air filtration/air cleaning strategies.
B.1 Building and Zonal Leakage Characterization by Fan Pressurization Testing Detailed whole-building and zonal leakage fan pressurization test results, including those from numerous guarded tests are given in Table 21 for House 1 and Table 22 for House 2. Leakage to outside was measured by means of a guarded test on each room/zone. Guarding the test zone was accomplished by using one or two more calibrated fans, and combinations of door opening, to take the pressure of the adjacent zones to the same pressure with respect to outside as the test zone. Total leakage of each zone was measured by exposing all bordering spaces to outdoors. Leakage to inside was calculated as the difference between total leakage and leakage to outside for each zone. The multi-point tests were conducted at pressures between –15 and –50 Pa with respect to outside, enabling determination of a flow exponent and constant from a power-law curve fit to predict flows at different pressures and for modeling.

83
Table 21. House 1 Guarded and Unguarded Fan Pressurization Test Results
Power Law Fit Coefficients
Airflow at Listed Test Pressure Differential (CFM)
C n 15 25 30 40 50 Total Leakage
House 66.2 0.706 448 642 731 895 1048 House + Garage 110.0 0.625 598 822 922 1103 1268
Garage 31.7 0.661 190 266 300 363 421 Master 27.8 0.622 150 206 231 276 317 Middle 8.2 0.639 46 64 72 87 100 Bath 2 4.7 0.612 25 34 38 45 52 Front 10.4 0.615 55 75 84 101 115
Leakage to Outside Master 13.3 0.693 87 124 140 171 200 Middle 2.5 0.824 23 36 41 52 63
Bath 2 Below measurable limit
Front 6.6 0.677 42 59 66 81 94 House to Out 56.9 0.727 407 590 674 830 977 Main to Out 34.8 0.737 255 372 426 526 620
Garage to Out 25.0 0.686 160 227 258 314 366 Leakage to Inside
Master 15.7 0.514 63 82 90 105 117 Middle 7.9 0.397 23 28 30 34 37 Bath 2 4.7 0.612 25 34 38 45 52 Front 4.7 0.390 14 17 18 20 22
Interzonal Leakage Garage to Main 7.4 0.511 30 39 42 49 55

84
Table 22. House 2 (Unvented Attic) Guarded and Unguarded Fan Pressurization Test Results
Power Law Fit Coefficients
Airflow (CFM) at Listed Test Pressure Differential
C n 15 25 30 40 50 Total Leakage
House + Attic 67.1 0.630 370 510 572 686 789 House + Attic +
Garage 83.0 0.667 505 710 802 972 1128
House 136.8 0.613 719 984 1100 1313 1505 Attic 164.5 0.550 729 966 1068 1251 1414
Garage 62.2 0.639 351 486 547 657 758 Master 33.3 0.598 168 228 255 302 345 Middle 38.2 0.560 174 232 257 301 342 Bath 2 4.8 0.610 25 34 38 46 52 Front 13.8 0.590 68 92 103 122 139
Leakage to Outside Master 4.5 0.540 19 25 28 33 37 Middle 0.2 1.000 3 6 7 9 11
Bath 2 Below measurable limit
Front 0.3 0.976 4 6 8 10 13 Attic to Out 105.6 0.558 479 636 705 827 937
Garage to Out 50.7 0.671 312 440 497 603 700 House to Out 68.8 0.677 430 608 688 836 972 Main to Out 64.7 0.676 404 570 645 783 911
Leakage to Inside Master 28.9 0.605 149 203 226 269 308 Middle 38.7 0.549 171 227 250 293 331 Bath 2 4.8 0.610 25 34 38 46 52 Front 14.1 0.560 64 86 95 111 126
Interzonal Leakage Attic to House 59.0 0.534 251 329 363 423 477
Garage to Main 16.2 0.327 39 46 49 54 58 The guarded tests on House 2 were particularly challenging because of the strong interzonal airflow between the house and the unvented attic. Small differences in pressure between the house and attic corresponded to large airflows between the two spaces. The solution was to use more automation in the testing via the cruise control built into some digital manometers and computer software for blower door testing. The guarded testing in House 2 required three fans—one for the room under test, one for the house front door, and one for the unvented attic. One is manually driven to the chosen pressure relative to outside, while the other two zones are matched to that pressure under computer control. A further challenge came from the very low leakage to outside in the secondary bedrooms and hall bathroom, once the attic leakage was eliminated by

85
guarding. At the standard test pressures of 15–50 Pa, the leakage was below measurable limits. Test results were recorded at flows between 20 and 50 CFM, with pressures as high as 150 Pa. The power law flow coefficients were fit from the measured data.
B.2 Leakage Inputs for CONTAM Modeling A preliminary CONTAM model was constructed for each of the houses using the physical characteristics, and the measured air leakage and mechanical airflow characteristics. The CONTAM model of the house includes leaks only between physically adjacent zones. For the six zones in House 1 (where the attic is taken to be outside), this reduces the total number of modeled leaks from 21 to 11. However, with each room being adjacent to two or more others, the guarded tests of total leakage to inside do not uniquely determine the path of measured leakage area to inside. We initially planned that the leakage to inside for each subject room could be distributed proportionally relative to interior wall area, but analysis of the measurements showed that a second weighting may be needed to account for the fact that adjacent rooms can have very different total leakage to inside, biasing the direction of airflow from the subject room. Therefore, initial leakage areas were chosen to limit leakage to be consistent with all the airflow measurements (i.e. more air could not flow in than could flow out). These are estimates, to be refined when the CONTAM model can be fit to the tracer gas measurements. Table 23 and Table 24 show the initial leakage flow coefficients for the CONTAM model. Doors are entered separately, according to their known area.
Table 23. House 1 CONTAM Model Inputs
Leakage Path Power Law Coefficients From To C n Main Out 34.8 0.737 Main Master 14.8 0.514 Main Middle 0.1 0.500 Main Garage 7.4 0.511
Master Out 13.3 0.693 Master Middle 0.9 0.514 Middle Out 2.5 0.824 Middle Bath 6.3 0.500 Bath Front 2.0 0.612 Front Out 6.6 0.677
Garage Out 25.0 0.686

86
Table 24. House 2 CONTAM Model Inputs
Leakage Path Power Law Coefficients From To C n Main Out 64.7 0.676 Main Master 15.2 0.6 Main Middle 18.6 0.5 Main Garage 16.2 0.327
Master Out 4.5 0.54 Master Middle 13.7 0.6 Middle Out 0.22 1.0 Middle Bath 2.40 0.61 Bath Front 2.40 0.61 Front Out 0.28 0.976 Front Main 11.2 0.560
Garage Out 50.7 0.671 Attic Out 105.6 0.558 Attic Main 30.0 0.534 Attic Master 13.5 0.534 Attic Middle 6.4 0.534 Attic Bath 2.6 0.534 Attic Front 6.6 0.534
Figure 44 and Figure 45 show screenshots of the CONTAM interface, showing airflow between each zone and the outside when no wind is included. In future work, the model will be run to simulate each of the PFT tests conducted, and the modeled concentrations of gas compared to those which actually occurred.
Figure 44 CONTAM Model of House 1
Figure 45. CONTAM Model of House 2

87
Specific leakage locations were not defined within each room, rather, diffuse leakage is assumed, but defined leak heights are required for calculating stack-driven flows. For each pair of adjacent zones, the leakage area was divided among five modeled leaks, spaced 2 feet apart vertically. This permits simultaneous bi-directional airflow between the zones. Townsend (2009a, b) found that five leaks spaced this way in CONTAM approximate the condition of diffuse leakage. Under this assumption, the leakage areas in each room are symmetric about the neutral pressure plane. Therefore stack effect does not drive airflow between interior zones. The House 2 unvented attic is modeled, but not fully shown in Figure 45. Showing a summertime example condition, the unvented attic model shows outdoor temperatures warmer than indoor, when unvented attic airflow will be driven by stack effect infiltration into the attic and exfiltration from each occupied zone. The measured HVAC airflows will define the mechanically induced airflows. Weather data will be input to the model for boundary conditions.
B.3 Future Model Refinement The six tracer gasses used in the testing were input to CONTAM as separate contaminants. The time-dependent concentration of each tracer in each zone is calculated by CONTAM. The average concentration of each tracer as measured by the PFT samplers is calculated from these values in postprocessing.
As discussed previously, the fan pressurization testing did not directly measure every partition leakage area. Interior leakage of the bathroom and each bedroom was disaggregated for modeling. For this reason, and due to the limitations of fan pressurization testing for very low airflows, the initial leakage coefficients in the model are not expected to accurately reproduce the results of PFT testing. To improve the predictive value of the model, these uncertain leakage parameters will be adjusted. CONTAM will be called iteratively by a non-linear search algorithm, with the error between modeled and measured results being calculated after each run, and the input parameters improved.
Using all data for calibration would risk overfitting; that is, finding a model which only matches reality for the limited inputs used in calibration. Instead, some test data will be used in model refinement, and the rest used to check the model. The methodology of ASTM D5157-97 will be used to assess the predictions of the model.

buildingamerica.gov
DOE/GO-102014-4362 ▪ February 2014
Printed with a renewable-source ink on paper containing at least 50% wastepaper, including 10% post-consumer waste.


