Vehicular Networks: IEEE 802.11p Analysis and Integration ... · Vehicular Networks: IEEE 802.11p...
122
FACULDADE DE E NGENHARIA DA UNIVERSIDADE DO P ORTO Vehicular Networks: IEEE 802.11p Analysis and Integration into an Heterogeneous WMN Luís Miguel Faria de Oliveira Master in Electrical and Computers Engineering Supervisor: Prof. Manuel Alberto Pereira Ricardo (PhD) Supervisor: Helder Martins Fontes (MSc) June 26, 2012
Transcript of Vehicular Networks: IEEE 802.11p Analysis and Integration ... · Vehicular Networks: IEEE 802.11p...

FACULDADE DE ENGENHARIA DA UNIVERSIDADE DO PORTO
Vehicular Networks: IEEE 802.11pAnalysis and Integration into an
Heterogeneous WMN
Luís Miguel Faria de Oliveira
Master in Electrical and Computers Engineering
Supervisor: Prof. Manuel Alberto Pereira Ricardo (PhD)
Supervisor: Helder Martins Fontes (MSc)
June 26, 2012

© Luís Miguel Faria de Oliveira, 2012


ii

Abstract
In the last decade wireless networks became increasingly popular, such as Wi-Fi, GPRS, or themore recent, UMTS and WiMAX. This succession of technological advancements allowed wire-less access to become economically viable, widely available and easy to use by non-experts intelecommunications. As technology advanced so did the quality of the services that are nowavailable. Providing a service capable of performing a transparent switch between heterogeneoustechnologies, based on coverage limitations and QoS goals, can help to improve its flexibility,minimize deployment and operation costs, and maximize service quality. Unfortunately, whenproviding such services, technical difficulties may arise due to technology limitations (e.g. Mo-bile WiMAX (IEEE 802.16e) and UMTS are ready for vehicular mobility while the Wi-Fi (IEEE802.11bgn) and WiMAX (IEEE 802.16) are not). These limitations are present in the SITMeproject, which integrates the work from this dissertation. SITMe presents a vehicular networkwith an architecture based on a heterogeneous Wireless Mesh Network (WMN). SITMe aims toprovide Internet access and network based services to buses and passengers
This dissertation is focused on studying an emergent wireless technology known as IEEE802.11p and integrating it into SITMe This dissertation specifies a complete solution, based onhardware and software currently available, to integrate the IEEE 802.11p technology support asa module into SITMe. A study divided in three sections was performed: 1) on the network ele-ments that constitute SITMe and how SITMe operates; 2) on some of the technologies that allowfor vehicular mobility; and 3) on the handover schemes capable of performing handover in IEEE802.11p. To evaluate IEEE 802.11p, two testbeds were created to compare the performance ofIEEE 802.11p and IEEE 802.11n in a vehicular mobility scenario. Results obtained from thesetestbeds showed that IEEE 802.11p has better performance in a vehicular mobility scenario whileIEEE 802.11n would perform better in a more static scenario. Finally, a handover testbed was de-veloped to assess whether the handover scheme chosen would work in a network scenario similarto SITMe. Results obtained from this testbed showed that the scheme adopted is promising andworks.
The goals of this dissertation were achieved with results that validate the correct operation ofthe proposed solution and its ability to be integrated into SITMe. In the end, some improvementsto the solution are also proposed to maximize its performance.
iii

iv

Resumo
Nas últimas décadas as redes sem fios têm vindo a tornar-se cada vez mais populares, tais como oWi-Fi, GPRS, ou mais recentemente, o UMTS e o WiMAX. Esta sucessão de avanços tecnológi-cos permitiu que o acesso a tecnologia de redes sem fios seja, agora, largamente disponibilizado,economicamente viável e fácil de usar por pessoas sem conhecimentos profundos na área de tele-comunicações . Como as tecnologias foram evoluindo, também evoluiu a qualidade dos serviçosagora disponíveis. Fornecer um serviço capaz de executar de forma transparente uma troca en-tre tecnologias heterógenas, baseada na área de cobertura ou em objetivos de QoS, pode ajudara melhorar a sua flexibilidade, minimizar os custos de implementação e operação, e maximizar asua qualidade. Infelizmente, quando se fornece serviços deste tipo, algumas dificuldades do forotécnico podem surgir devido a limitações tecnológicas (por exemplo, o Mobile WiMAX (IEEE802.16e) e o UMTS estão prontas para lidar com redes veiculares, mas o Wi-Fi (IEEE 802.11bgn)e o WiMAX (IEEE 802.16) não). Estas limitações estão presentes no projeto SITMe, que se en-contra integrado nesta dissertação. O SITMe é uma rede veicular com uma arquitetura baseadanuma Wireless Mesh Network heterogénea. O SITMe tem como principal objetivo fornecer acessoà Internet e serviços de redes a autocarros e seus passageiros.
Esta dissertação teve como principal foco o estudo de uma tecnologia de redes sem fios emer-gente chamada IEEE 802.11p e a integração desta tecnologia no SITMe. Esta dissertação ap-resenta uma solução completa, baseada em hardware e software presentemente disponível, paraimplementar um módulo IEEE 802.11p no SITMe. Um estudo dividido em três partes foi efe-tuado: 1) sobre os elementos de rede que constituem o SITMe e o seu modo de operação; 2)sobre algumas das tecnologias que permitem mobilidade veicular; e 3) sobre alguns esquemascapazes de realizar handover em IEEE 802.11p. Para avaliar o IEEE 802.11p, duas testbeds foramcriadas para comparar a o desempenho entre IEEE 802.11p e IEEE 802.11n num cenário de mo-bilidade veicular. Os resultados obtidos nestas testbeds mostraram que o IEEE 802.11p tem umdesempenho superior ao IEEE 802.11n num cenário de mobilidade veicular, já o IEEE 802.11ntem melhor desempenho num cenário estático. Finalmente, uma testbed para handover foi desen-volvida para perceber se o esquema de handover escolhido funcionaria num cenário semelhanteao SITMe. Os resultados obtidos nesta testbed mostram que o esquema adotado é promissor efunciona.
Os objetivos desta dissertação foram alcançados através de resultados que validam a corretaoperação da solução proposta e a sua possibilidade em ser integrada no SITMe. Por fim, algumasmelhorias a esta solução são propostas para maximizar a sua performance.
v

vi
Agradecimentos
Primeiramente gostaria de agradecer a todas as pessoas com quem tive o prazer de interagir e queme ajudaram ao longo desta dissertação no centro de investigação do INESC Porto. Gostaria deagradecer especialmente aos meus orientadores, Hélder Martins Fontes e Professor Manuel Ri-cardo assim como à Tânia Calçada por me terem dado a oportunidade única de desenvolver omeu trabalho num ambiente de investigação que não encontraria disponível noutro sítio. Gostariatambém de agradecer a disponibilidade e paciência para me acompanharem ao longo deste per-curso e pelas muitas duvidas que me ajudaram a esclarecer. Os contributos oferecidos por elesencontram-se presentes ao longo de toda esta dissertação. Gostaria também de agradecer aos meusamigos, que me acompanharam ao longo deste percurso universitário. O espirito de entreajuda eamizade foi fulcral para que tenha chegado a este ponto. Finalmente, os meus agradecimentosfinais dirigem-se aos meus pais e irmão por me terem fornecido todas as condições financeiras efamiliares necessárias para desenvolver o meu trabalho com sucesso, é a eles que devo tudo o quetenho e consegui alcançar até ao momento.
Luís Miguel Faria de Oliveira
vii

viii

Contents
1 Introduction 11.1 Motivation . . . . . . . . . . . . . . . . . . . . . . . . . . . . . . . . . . . . . . 11.2 Contextualization . . . . . . . . . . . . . . . . . . . . . . . . . . . . . . . . . . 21.3 Objectives . . . . . . . . . . . . . . . . . . . . . . . . . . . . . . . . . . . . . . 21.4 Requirements . . . . . . . . . . . . . . . . . . . . . . . . . . . . . . . . . . . . 31.5 Results . . . . . . . . . . . . . . . . . . . . . . . . . . . . . . . . . . . . . . . . 31.6 Document Structure . . . . . . . . . . . . . . . . . . . . . . . . . . . . . . . . . 3
2 Vehicular Networks 52.1 Vehicular Network Architectures . . . . . . . . . . . . . . . . . . . . . . . . . . 5
2.1.1 WiMetroNet . . . . . . . . . . . . . . . . . . . . . . . . . . . . . . . . 52.1.2 SITMe Project . . . . . . . . . . . . . . . . . . . . . . . . . . . . . . . 82.1.3 Comparison and Conclusions . . . . . . . . . . . . . . . . . . . . . . . 10
2.2 Vehicular Wireless Technologies . . . . . . . . . . . . . . . . . . . . . . . . . . 112.2.1 Wi-Fi . . . . . . . . . . . . . . . . . . . . . . . . . . . . . . . . . . . . 112.2.2 Wireless Access in Vehicular Environnments . . . . . . . . . . . . . . . 122.2.3 IEEE 802.11p Performance . . . . . . . . . . . . . . . . . . . . . . . . 142.2.4 WiMAX . . . . . . . . . . . . . . . . . . . . . . . . . . . . . . . . . . 152.2.5 UMTS . . . . . . . . . . . . . . . . . . . . . . . . . . . . . . . . . . . 162.2.6 Comparison and Conclusions . . . . . . . . . . . . . . . . . . . . . . . 16
2.3 Handover in IEEE 802.11 Networks . . . . . . . . . . . . . . . . . . . . . . . . 172.3.1 Seamless Handover using RSU IDs . . . . . . . . . . . . . . . . . . . . 182.3.2 Handover under Multi-channel Operation . . . . . . . . . . . . . . . . . 192.3.3 Handover using SITMe WMRP . . . . . . . . . . . . . . . . . . . . . . 202.3.4 Comparison and Conclusions . . . . . . . . . . . . . . . . . . . . . . . 21
3 Integration of the IEEE 802.11p module 233.1 Hardware Selection . . . . . . . . . . . . . . . . . . . . . . . . . . . . . . . . . 23
3.1.1 IEEE 802.11p Cards . . . . . . . . . . . . . . . . . . . . . . . . . . . . 233.1.2 PC Engines Alix3d3 . . . . . . . . . . . . . . . . . . . . . . . . . . . . 253.1.3 Antennas . . . . . . . . . . . . . . . . . . . . . . . . . . . . . . . . . . 253.1.4 Other Equipment . . . . . . . . . . . . . . . . . . . . . . . . . . . . . . 26
3.2 Software Selection . . . . . . . . . . . . . . . . . . . . . . . . . . . . . . . . . 263.2.1 IEEE 802.11p Drivers . . . . . . . . . . . . . . . . . . . . . . . . . . . 273.2.2 Operating System . . . . . . . . . . . . . . . . . . . . . . . . . . . . . . 283.2.3 Compiling and Installing OpenWRT . . . . . . . . . . . . . . . . . . . . 293.2.4 Additional Software . . . . . . . . . . . . . . . . . . . . . . . . . . . . 29
3.3 Changes to SITMe . . . . . . . . . . . . . . . . . . . . . . . . . . . . . . . . . 31
ix

x CONTENTS
3.3.1 Changes to the Network Architecture . . . . . . . . . . . . . . . . . . . 313.3.2 Changes to the Data and Control Planes . . . . . . . . . . . . . . . . . . 33
4 Evaluation of the Solution 354.1 Mobile Testbeds . . . . . . . . . . . . . . . . . . . . . . . . . . . . . . . . . . . 35
4.1.1 First Mobile Testbed . . . . . . . . . . . . . . . . . . . . . . . . . . . . 364.1.2 Second Mobile Testbed . . . . . . . . . . . . . . . . . . . . . . . . . . . 374.1.3 Tests and Metrics . . . . . . . . . . . . . . . . . . . . . . . . . . . . . . 394.1.4 Results . . . . . . . . . . . . . . . . . . . . . . . . . . . . . . . . . . . 404.1.5 Conclusions . . . . . . . . . . . . . . . . . . . . . . . . . . . . . . . . . 60
4.2 Handover in IEEE 802.11p . . . . . . . . . . . . . . . . . . . . . . . . . . . . . 604.2.1 Handover Testbed . . . . . . . . . . . . . . . . . . . . . . . . . . . . . 614.2.2 Results . . . . . . . . . . . . . . . . . . . . . . . . . . . . . . . . . . . 644.2.3 Theoretical Validation . . . . . . . . . . . . . . . . . . . . . . . . . . . 684.2.4 Conclusions . . . . . . . . . . . . . . . . . . . . . . . . . . . . . . . . . 71
5 Conclusions and Future Work 73
References 75
A Configurations 79
B Redundant Results for the Second Mobile Testbed 81
C Network Diagrams for Theoretical Validation of the IEEE 802.11p Handover Scheme 89
D Photographies of the Mobile Testbeds 99
List of Figures
2.1 WiMetroNet Reference Scenario [1] . . . . . . . . . . . . . . . . . . . . . . . . 62.2 SITMe Communication Stack for public Links [1] . . . . . . . . . . . . . . . . . 92.3 SITMe Network Overview [1] . . . . . . . . . . . . . . . . . . . . . . . . . . . 92.4 STCP Bus Line 207 . . . . . . . . . . . . . . . . . . . . . . . . . . . . . . . . . 102.5 WAVE - OSI Model [2] . . . . . . . . . . . . . . . . . . . . . . . . . . . . . . . 122.6 DSRC - Channel Allocation [3] . . . . . . . . . . . . . . . . . . . . . . . . . . . 132.7 Network Architecture for Seamless Handover using RSU IDs [4] . . . . . . . . . 192.8 Message Exchange for Seamless Handover using RSU IDs [4] . . . . . . . . . . 192.9 OBU Operation under multi-channel conditions [5] . . . . . . . . . . . . . . . . 20
3.1 UNEX DCMA-68P2 IEEE 802.11p Card [6] . . . . . . . . . . . . . . . . . . . . 243.2 PC Engines Alix3d3 [7] . . . . . . . . . . . . . . . . . . . . . . . . . . . . . . . 253.3 MINI-BOX for Alix3d3 . . . . . . . . . . . . . . . . . . . . . . . . . . . . . . . 263.4 Patching Ath5k Driver with GCDC patch . . . . . . . . . . . . . . . . . . . . . 273.5 OpenWRT Configuration Menu [8] . . . . . . . . . . . . . . . . . . . . . . . . . 303.6 SITMe Network Architecture V2 . . . . . . . . . . . . . . . . . . . . . . . . . . 323.7 Bus Network Infrastructure . . . . . . . . . . . . . . . . . . . . . . . . . . . . . 32
4.1 FEUPs Student Car Park (Satellite View) . . . . . . . . . . . . . . . . . . . . . . 374.2 Test Network for the First Mobile Testbed . . . . . . . . . . . . . . . . . . . . . 384.3 EN 327, location of RSU, OBU and OBU PATH . . . . . . . . . . . . . . . . . . 384.4 MT1 Goodput for 20 km/h (802.11n) . . . . . . . . . . . . . . . . . . . . . . . . 424.5 MT1 Goodput for 20 km/h (802.11p) . . . . . . . . . . . . . . . . . . . . . . . . 424.6 MT1 Goodput for 30 km/h (802.11n) . . . . . . . . . . . . . . . . . . . . . . . . 434.7 MT1 Goodput for 30 km/h (802.11p) . . . . . . . . . . . . . . . . . . . . . . . . 434.8 MT1 Goodput for 40 km/h (802.11n) . . . . . . . . . . . . . . . . . . . . . . . . 444.9 MT1 Goodput for 40 km/h (802.11p) . . . . . . . . . . . . . . . . . . . . . . . . 444.10 MT1 Frame Loss Ratio for 20 km/h (802.11n) . . . . . . . . . . . . . . . . . . . 454.11 MT1 Frame Loss Ratio for 20 km/h (802.11p) . . . . . . . . . . . . . . . . . . . 464.12 MT1 Frame Loss Ratio for 30 km/h (802.11n) . . . . . . . . . . . . . . . . . . . 464.13 MT1 Frame Loss Ratio for 30 km/h (802.11p) . . . . . . . . . . . . . . . . . . . 474.14 MT1 Frame Loss Ratio for 40 km/h (802.11n) . . . . . . . . . . . . . . . . . . . 474.15 MT1 Frame Loss Ratio for 40 km/h (802.11p) . . . . . . . . . . . . . . . . . . . 484.16 MT1 Data Transferred for 20 km/h (802.11n) . . . . . . . . . . . . . . . . . . . 494.17 MT1 Data Transferred for 20 km/h (802.11p) . . . . . . . . . . . . . . . . . . . 494.18 MT1 Data Transferred for 30 km/h (802.11n) . . . . . . . . . . . . . . . . . . . 504.19 MT1 Data Transferred for 30 km/h (802.11p) . . . . . . . . . . . . . . . . . . . 504.20 MT1 Data Transferred for 40 km/h (802.11n) . . . . . . . . . . . . . . . . . . . 51
xi
xii LIST OF FIGURES
4.21 MT1 Data Transferred for 40 km/h (802.11p) . . . . . . . . . . . . . . . . . . . 514.22 MT2 Coverage Range (802.11n) . . . . . . . . . . . . . . . . . . . . . . . . . . 534.23 MT2 Coverage Range (802.11p) . . . . . . . . . . . . . . . . . . . . . . . . . . 534.24 MT2 Association Time (802.11n) . . . . . . . . . . . . . . . . . . . . . . . . . 544.25 MT2 Association Time (802.11p) . . . . . . . . . . . . . . . . . . . . . . . . . 544.26 MT2 Goodput for 20 km/h (802.11n) . . . . . . . . . . . . . . . . . . . . . . . . 554.27 MT2 Goodput for 20 km/h (802.11p) . . . . . . . . . . . . . . . . . . . . . . . . 564.28 MT2 Frame Loss Ratio for 20 km/h (802.11n) . . . . . . . . . . . . . . . . . . . 574.29 MT2 Frame Loss Ratio for 20 km/h (802.11p) . . . . . . . . . . . . . . . . . . . 584.30 MT2 Data Transferred for 20 km/h (802.11n) . . . . . . . . . . . . . . . . . . . 594.31 MT2 Data Transferred for 20 km/h (802.11p) . . . . . . . . . . . . . . . . . . . 594.32 Scenario 1 (Lack of Coverage between consecutive RSUs) . . . . . . . . . . . . 614.33 Scenario 2 (Coverage Overlap between RSUs) . . . . . . . . . . . . . . . . . . . 614.34 Handover Test Network . . . . . . . . . . . . . . . . . . . . . . . . . . . . . . . 624.35 Location of the RSUs, OBU and OBU path for Handover . . . . . . . . . . . . . 644.36 Goodput with RSU 1 enabled . . . . . . . . . . . . . . . . . . . . . . . . . . . . 654.37 Data Transferred with RSU 1 enabled . . . . . . . . . . . . . . . . . . . . . . . 654.38 Goodput with RSU 2 enabled . . . . . . . . . . . . . . . . . . . . . . . . . . . . 664.39 Data Transferred with RSU 2 enabled . . . . . . . . . . . . . . . . . . . . . . . 664.40 Goodput with Handover . . . . . . . . . . . . . . . . . . . . . . . . . . . . . . . 674.41 Data Transferred with Handover . . . . . . . . . . . . . . . . . . . . . . . . . . 67
B.1 MT2 Goodput for 30 km/h (802.11n) . . . . . . . . . . . . . . . . . . . . . . . . 81B.2 MT2 Goodput for 40 km/h (802.11n) . . . . . . . . . . . . . . . . . . . . . . . . 82B.3 MT2 Frame Loss Ratio for 30 km/h (802.11n) . . . . . . . . . . . . . . . . . . . 82B.4 MT2 Frame Loss Ratio for 40 km/h (802.11n) . . . . . . . . . . . . . . . . . . . 83B.5 MT2 Data Transferred for 30 km/h (802.11n) . . . . . . . . . . . . . . . . . . . 83B.6 MT2 Data Transferred for 40 km/h (802.11n) . . . . . . . . . . . . . . . . . . . 84B.7 MT2 Goodput for 30 km/h (802.11p) . . . . . . . . . . . . . . . . . . . . . . . . 84B.8 MT2 Goodput for 40 km/h (802.11p) . . . . . . . . . . . . . . . . . . . . . . . . 85B.9 MT2 Frame Loss Ratio for 30 km/h (802.11p) . . . . . . . . . . . . . . . . . . . 85B.10 MT2 Frame Loss Ratio for 40 km/h (802.11p) . . . . . . . . . . . . . . . . . . . 86B.11 MT2 Data Transferred for 30 km/h (802.11p) . . . . . . . . . . . . . . . . . . . 86B.12 MT2 Data Transferred for 40 km/h (802.11p) . . . . . . . . . . . . . . . . . . . 87
C.1 HELLO Messages sent in First Phase . . . . . . . . . . . . . . . . . . . . . . . 90C.2 TC Messages sent in First Phase . . . . . . . . . . . . . . . . . . . . . . . . . . 91C.3 MC and IC Messages sent in First Phase . . . . . . . . . . . . . . . . . . . . . . 92C.4 HELLO Messages sent in the Second Phase . . . . . . . . . . . . . . . . . . . . 93C.5 TC Messages for the Second Phase . . . . . . . . . . . . . . . . . . . . . . . . . 94C.6 MC and IC Messages for the Second Phase . . . . . . . . . . . . . . . . . . . . 95C.7 HELLO Messages sent in the Third Phase . . . . . . . . . . . . . . . . . . . . . 96C.8 TC Messages for the Third Phase . . . . . . . . . . . . . . . . . . . . . . . . . . 97C.9 MC and IC Messages for the Third Phase . . . . . . . . . . . . . . . . . . . . . 98
D.1 N 327 - Facing South (Second Mobile Testbed) . . . . . . . . . . . . . . . . . . 99D.2 N 327 - Facing North (Second Mobile Testbed) . . . . . . . . . . . . . . . . . . 100D.3 RSU - (Second Mobile Testbed) . . . . . . . . . . . . . . . . . . . . . . . . . . 100D.4 OBU - Facing North (Second Mobile Testbed) . . . . . . . . . . . . . . . . . . . 101

LIST OF FIGURES xiii
D.5 FEUP student car park - Facing North (First Mobile Testbed) . . . . . . . . . . . 101D.6 FEUP student car park - Facing South (First Mobile Testbed) . . . . . . . . . . . 102

xiv LIST OF FIGURES

List of Tables
2.1 Short comparison between 802.11 amendments [9] . . . . . . . . . . . . . . . . 112.2 Comparison between 802.11a and 802.11p physical layers [10] . . . . . . . . . . 142.3 Contact duration [10] . . . . . . . . . . . . . . . . . . . . . . . . . . . . . . . . 152.4 Short Comparison Between IEEE 802.11p and IEEE 802.11n . . . . . . . . . . . 17
3.1 Technical Details of the UNEX DCMA-68P2 [6] . . . . . . . . . . . . . . . . . 24
4.1 Tests performed in each Mobile Testbed . . . . . . . . . . . . . . . . . . . . . . 414.2 MT1 Maximum Goodput Achieved (Mbit/s) for IEEE 802.11n and IEEE 802.11p 454.3 MT1 Average Goodput Achieved (Mbit/s) for IEEE 802.11n and IEEE 802.11p . 454.4 MT1 Average Frame Loss Ratio for IEEE 802.11n and IEEE 802.11.p . . . . . . 484.5 MT1 Total Data Transferred (MByte) for IEEE 802.11n and IEEE 802.11p . . . . 524.6 MT2 Contact Time (in seconds) for IEEE 802.11n and IEEE 802.11p . . . . . . 534.7 MT2 Maximum Coverage Distance by Technology . . . . . . . . . . . . . . . . 554.8 MT2 Maximum Goodput Achieved (Mbit/s) for IEEE 802.11n and IEEE 802.11p 564.9 MT2 Average Goodput Achieved (Mbit/s) for IEEE 802.11n and IEEE 802.11p . 574.10 MT2 Average Frame Loss Ratio . . . . . . . . . . . . . . . . . . . . . . . . . . 584.11 MT2 Total Data Transferred (MByte) . . . . . . . . . . . . . . . . . . . . . . . 594.12 List of Neighbor MAC addresses by RBridge . . . . . . . . . . . . . . . . . . . 634.13 List of IP Addresses of the Terminal Nodes . . . . . . . . . . . . . . . . . . . . 634.14 Association of RBridge IDs to Neighbor IDs (First Phase) . . . . . . . . . . . . 694.15 TC Tables (First Phase) . . . . . . . . . . . . . . . . . . . . . . . . . . . . . . . 694.16 MC and IC Tables (First Phase) . . . . . . . . . . . . . . . . . . . . . . . . . . . 694.17 Association of RBridge IDs to Neighbor IDs (Second Phase) . . . . . . . . . . . 704.18 TC Tables (Second Phase) . . . . . . . . . . . . . . . . . . . . . . . . . . . . . 70
xv

xvi LIST OF TABLES
Abbreviations
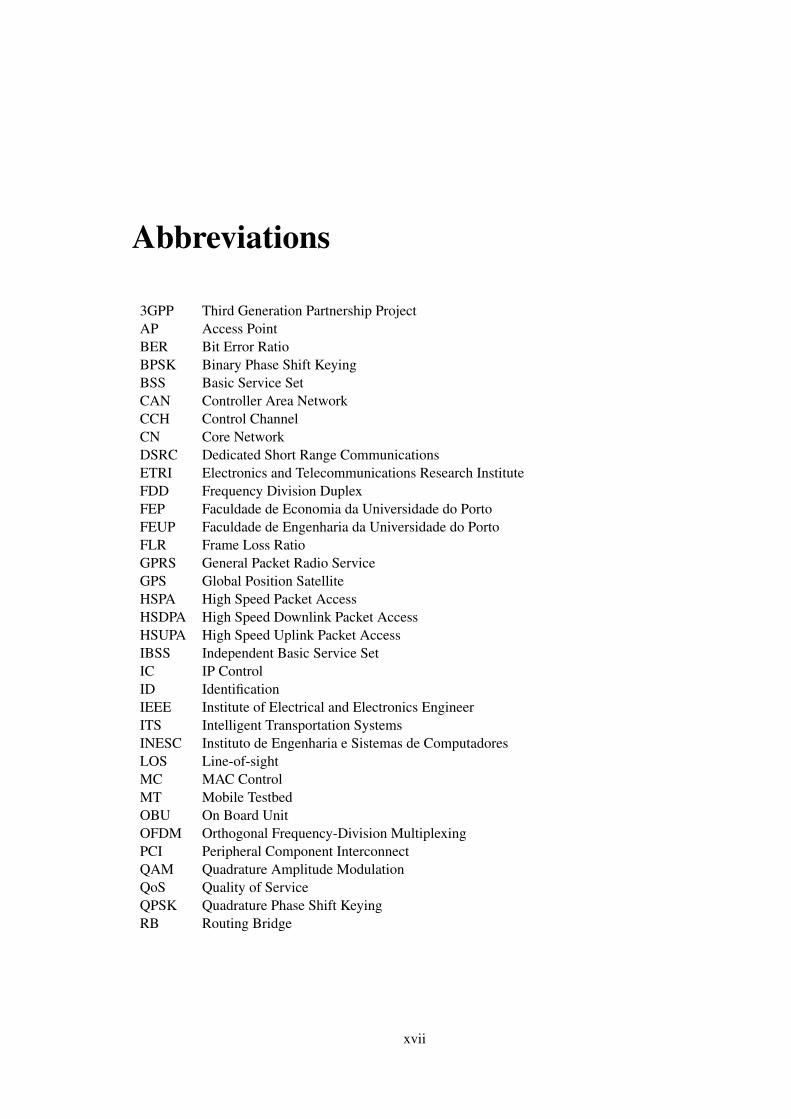
3GPP Third Generation Partnership ProjectAP Access PointBER Bit Error RatioBPSK Binary Phase Shift KeyingBSS Basic Service SetCAN Controller Area NetworkCCH Control ChannelCN Core NetworkDSRC Dedicated Short Range CommunicationsETRI Electronics and Telecommunications Research InstituteFDD Frequency Division DuplexFEP Faculdade de Economia da Universidade do PortoFEUP Faculdade de Engenharia da Universidade do PortoFLR Frame Loss RatioGPRS General Packet Radio ServiceGPS Global Position SatelliteHSPA High Speed Packet AccessHSDPA High Speed Downlink Packet AccessHSUPA High Speed Uplink Packet AccessIBSS Independent Basic Service SetIC IP ControlID IdentificationIEEE Institute of Electrical and Electronics EngineerITS Intelligent Transportation SystemsINESC Instituto de Engenharia e Sistemas de ComputadoresLOS Line-of-sightMC MAC ControlMT Mobile TestbedOBU On Board UnitOFDM Orthogonal Frequency-Division MultiplexingPCI Peripheral Component InterconnectQAM Quadrature Amplitude ModulationQoS Quality of ServiceQPSK Quadrature Phase Shift KeyingRB Routing Bridge
xvii

xviii ABBREVIATIONS
RITA Research and Innovative Technology AdministrationRNC Radio Network ControllerRSSI Received Signal Strength IndicationRSU Road Side UnitSCH Service ChannelSITME Serviços Integrados para Transportes MetropolitanosSMS Short Message ServiceSNR Signal-to-noise RatioSTCP Sociedade de Transportes Colectivos do PortoTC Traffic ControlTDD Time Division DuplexUE User EquipmentUMTS Universal Mobile Telecommunication SystemsUSB Universal Serial BusUTRAN UMTS Terrestrial Radio Access NetworkWAVE Wireless Access in Vehicular EnvironmentsWBSS Wave Basic Service SetW-CDMA Wideband Code Division Multiple AccessWLAN Wireless Local Area NetworksWMAN Wireless Metropolitan Area NetworksWMN Wireless Mesh NetworkWMRP Wireless Metropolitan Routing Protocol

Chapter 1
Introduction
1.1 Motivation
In the last decade wireless networks became increasingly popular, such as Wi-Fi 1, GPRS 2, or
the more recent, UMTS 3 and WiMAX. This succession of technological advancements allowed
wireless access to become economically viable, widely available and easy to use by non-experts
in telecommunications. Now most people have devices, such as laptops or cell phones, which can
access wireless networks. With the increase on the number of different technologies available, it
became useful and viable to mix them into single heterogeneous solutions. In these solutions, each
wireless network technology present its own advantages and disadvantages aligned with its origi-
nal purpose (e.g. Wi-Fi for WLAN 4 access; UMTS and WiMAX for WMAN 5 access). Providing
a service capable of performing a transparent switch between heterogeneous technologies, based
on coverage limitations and QoS goals, can help improve its flexibility, minimize deployment and
operation costs and maximize service quality. Unfortunately, when providing such services, tech-
nical difficulties may arise due to technology limitations (e.g. Mobile WiMAX (IEEE 802.16e)
and UMTS are ready for vehicular mobility while the Wi-Fi (IEEE 802.11bgn) and WiMAX (IEEE
802.16) are not).
To address the limitations of IEEE 802.11bgn for vehicular mobility scenarios the IEEE 802.11p
amendment was created. This amendment adds Wireless Access in Vehicular Environments (WAVE).
WAVE, which was drafted in 2006, reviews and adds a series of functionalities that are expected to
improve considerably the quality of vehicular access to a Wi-Fi network. Although IEEE 802.11p
was drafted some years ago, there is still a lack of commercial hardware available to implement a
solution based on it. Only recently the hardware compatible with IEEE 802.11p started to emerge.
1Wireless Fidelity2General Packet Radio Service3Universal Mobile Telecommunication Systems4Wireless Local Area Network5Wireless Metropolitan Area Network
1

2 Introduction
This hardware still has some limitations and, therefore, it will take some more years until it be-
comes widely available. It is this new technology that will be the main scope of this dissertation,
aiming to study its characteristics and integration into an already existent heterogeneous vehicular
network.
1.2 Contextualization
This dissertation is included in the SITMe project which has a pilot test running on 11 buses from
STCP. The main goal of SITMe is to provide a diverse set of services to bus passengers using a
solution integrating several wireless technologies. So far, SITMe has a multi-technology commu-
nication system already implemented using IEEE 802.11n, Mobile WiMAX and UMTS technolo-
gies. SITMe uses Wireless Metropolitan Routing Protocol (WMRP) [11] on its communication
architecture. This routing algorithm supports multi-technology network links and has been tested
with very favorable results. [1] [12] [11]. As stated in Section 1.1 the IEEE 802.11bgn is not ready
for vehicular mobility. Seeing as SITMe is a system deployed in a vehicular mobility scenario,
it is natural that an additional IEEE 802.11 technology specially designed for this environment is
desired. In this case, the vehicular mobility ready IEEE 802.11p is the obvious candidate. SITMe
is further detailed in Section 2.1.2.
1.3 Objectives
The main objectives of this dissertation are: first, select the best available IEEE 802.11p hard-
ware and software, given the small budget available, and the SITMe project requirements and
constraints; second, study and compare the IEEE 802.11p and 802.11n technologies, evaluating
the reproducibility of the performance results found on literature and, at the same time, validating
the hardware and software selection, installation, configuration and good operation; third, plan
the integration of the IEEE 802.11p module into SITMe and the changes that need to be per-
formed to the SITMe network architecture; finally, study, compare and decide the best horizontal
handover mechanisms to be adopted for IEEE 802.11p in SITMe scenario, implementing the nec-
essary changes to the SITMe communication architecture and validating its operation. By the
end of this dissertation, the new architecture of the SITMe communication system supporting an
IEEE 802.11p module with handover capabilities is expected to be available and validated. Dur-
ing the validation process, the necessary tests should be carried out, yielding scientific results that
evaluate the liability of the decisions made. Those results will, also, help to understand if an in-
vestment in IEEE 802.11p in SITMe project will create a sufficient performance gain to justify its
implementation.

1.4 Requirements 3
1.4 Requirements
Several requirements were established and most of them come from the context of SITMe project.
Since the IEEE 802.11p module to be developed is to be implemented into SITMe then its system
architecture requirements must be respected. Respecting the SITMe system architecture means: 1)
making no changes to the operating system currently running in SITMe (UBUNTU6 11.04 Natty
Narwhall), especially due to the some network interface driver dependencies; 2) using the SITMe
communication system, or, if the integration of the IEEE 802.11p module cannot be performed
natively, then the solution found should reuse the communication system; and finally 3) the solu-
tion should be small in size, easy to install and maintain. The buses are not a good environment for
hardware and trepidation caused by the movement can cause problems. Additional requirements
are: 1) Using technology already available in INESC Porto when possible; 2) using open source
drivers for IEEE 802.11p; 3) the overall solution should have the least cost possible, this means
making it as simple as possible, with the least amount of software and hardware necessary; and
finally 4) providing a complete solution integrating IEEE 802.11p technology into SITMe.
1.5 Results
This dissertation specifies a solution to integrate an IEEE 802.11p module into SITMe. This
was performed by selecting the necessary hardware and software required, as well as verifying if
changes to the SITMe network architecture were required and doing them in the case they were
needed. To validate the overall solution, a series of tests were performed. These tests had the
goal of performing a direct comparison between IEEE 802.11p and IEEE 802.11n, confronting
the results obtained with some results found in the literature. The results obtained allowed to
confirm that IEEE 802.11p is a promising technology with many advantages over IEEE 802.11n
in vehicular network scenarios. IEEE 802.11p provided better coverage, faster "association time",
more stable operation and better support for higher vehicular speeds. Additionally, a handover
scheme for IEEE 802.11p was proposed and implemented which, again, was tested to validate its
correct operation. The results obtained show that, although there is room for improvements, this
handover scheme works and can be applied to the solution.
1.6 Document Structure
The document structure is the following. Chapter 2 addresses the study of some vehicular network
architectures, technologies and handover in vehicular networks. Chapter 3 presents the detailed so-
lution for implementing an IEEE 802.11p module into SITMe. That is, the selection of hardware,
software and the alterations needed to the SITMe architecture. Chapter 4 presents the testbeds
used to validate the solution presented in Chapter 3 as well as the results obtained from each
6http://www.ubuntu.org

4 Introduction
testbed. Chapter 5 presents the conclusions of this dissertation as well as recommendations for
future work.

Chapter 2
Vehicular Networks
This Chapter presents how the SITMe network scenario was created and how it works. It also ana-
lyzes some of the more common technologies and architectures to create vehicular networks. This
analysis focuses also on how handover works in IEEE 802.11 networks, its related problems when
applied to IEEE 802.11p networks and some proposed schemes to solve the handover problem. It
is not the purpose of this Chapter to present an extensive amount of different solutions. There are
clear restrictions related to the context in which this dissertation is included that must be respected
and limit the scope of the analysis. Therefore, only solutions directly related or used in SITMe are
presented.
2.1 Vehicular Network Architectures
This Section presents WiMetroNet and SITMe architectures, details and explains its operation as
well as the connection between them. Understanding exactly how WiMetroNet and SITMe works
is vital for planning a correct architecture to meet the requirements presented in Section 1.4. Be-
fore presenting WiMetroNet and SITMe, the concept of Routing Bridge (RBridge) must be un-
derstood. In the OSI model [13], RBridges [14] operate between layer 3 as routers and layer 2
as bridges. An RBridge connects multiple network segments at the layer 2 and performs rout-
ing functions using RBridges identification tags, instead of IP addresses. Similarly to routers,
RBridges terminate Spanning Tree Protocol (STP) trees. When calculating the best route for each
destination, the RBridge selects the interface to use for each route based on its cost. [1]
2.1.1 WiMetroNet
WiMetroNet [12] [1] presents an architecture for a large mesh network of moving RBridges oper-
ating over heterogeneous wireless technologies to provide broadband access to vehicles, stops, and
passengers of a public transportation system. Figure 2.1 presents the WiMetroNet reference net-
work diagram. Each vehicle and stop is equipped with an RBridge. RBridges form a mesh network
using wired links, WiMAX and WLAN. UMTS is also considered as a backup access technology.
Fixed RBridges (e.g. RBridges on stops) may be connected using wired links and may provide
5

6 Vehicular Networks
WLAN connections to moving RBridges. Terminals access the network through WLAN or Blue-
tooth. Internet access is provided centrally by Internet Gateway using NAT. Mobility of terminals
between different RBridges and seamless switching between network technologies are supported
by WiMetroNet, allowing terminals to keep their connections when they move through the net-
work and when RBridges change their access technology. These features are supported without
changing the network software on the terminals. All the intelligence is on the network side, ter-
minals only need to support WLAN interfaces and a bare IP communications stack. WiMetroNet
architecture assumes that most of the metropolitan area has private WiMAX coverage. WLAN
is used, when possible, to achieve higher bit-rates and free WiMAX bandwidth to the network
equipment without WLAN coverage. In WiMetroNet all core communications are assumed to be
carried out always through private links (wired, WiMAX or WLAN) provided internally. UMTS
is considered as backup solution to areas without WiMAX coverage, however this possibility is
not described nor implemented. WiMetroNet uses the foundation concepts of TRILL, using also
RBridge equipment, but running WMRP[12] [1] routing protocol designed to mobile networks.
WiMetroNet architecture defines a data plane and a control plane. Data plane specifies how frames
are switched based on a forwarding table defining packet encapsulation and decapsulation. Con-
trol Plane exchanges network topology information in order to calculate and obtain the best paths
to other nodes and compute the forwarding table. A detailed behavior of data and control planes
are presented in Sections 2.1.1.1 and 2.1.1.2.
Figure 2.1: WiMetroNet Reference Scenario [1]
2.1.1.1 WiMetroNet Data Plane
WiMetroNet data plane introduces a layer 2.5 header to carry a TTL field required to avoid loops.
This new header should be small to avoid excessive overhead, which led to the adoption of the
standard MPLS header for WiMetroNet data plane. On top of the MPLS layer the original layer 2
frame is encapsulated. When an ingress operation takes place, the user data frame is encapsulated

2.1 Vehicular Network Architectures 7
in an MPLS header containing the egress RBridge 20bit ID of and non-zero TTL value, and trans-
mitted through the outgoing interface. When the MPLS frame arrives at an egress RBridge it is
“decapsulated” and the original user frame transmitted to the destination station. The original des-
tination MAC address is used to look-up the egress RBridge in a local terminal location database,
which is a table mapping MAC addresses of known terminals to RBridges. Knowing the egress
RBridge, the routing table is then used to look-up a label and an outgoing interface. [12] [1] de-
tails the behavior of WiMetroNet data plane. The use of a MPLS header carrying the destination
RBridge label results in a layer 2 overlay network built on top of dynamic and multi-technology
network links existent between RBridges. Original layer 2 frames are routed by RBridges until
they reach the destination terminal, which is layer 2 attached to the egress RBridge.
2.1.1.2 WiMetroNet Control Plane
WiMetroNet runs a routing protocol, the Wireless Metropolitan Routing Protocol (WMRP). WMRP
is a proactive link state routing protocol for ad-hoc networks, based on OLSR [15] which uses tech-
niques of neighbor discovery and topology propagation in an unreliable link environment. WMRP
runs over layer 2, instead of operating at layer 3 like OLSR; RBridges IDs are used to map net-
work topology instead of IP addresses. WMRP introduces changes to the OLSR related to network
scalability, making possible to support large networks [12] [1]. In WMRP the location of termi-
nals and of RBridges is treated separately; different databases and different routing messages are
employed for each one. HELLO and Traffic Control messages are used to maintain the RBridges
location; MAC Control and IP Control are used to fill terminals’ databases.
HELLO Messages [1] are used for link sensing, i.e. to allow nodes to be discovered by their
neighbors. HELLO messages are broadcasted to each link, periodically (2 seconds, by default)
by each node, but are never forwarded. Through this process, each RBridge knows their local
network topology. Traffic Control Messages (TC) are used by each node to advertise through the
network the list of links to neighbors it has discovered, along with metrics associated with those
links.
Traffic Control Messages [1] are used by each node to advertise through the network the list
of links to neighbors it has discovered, along with metrics associated with those links. TC mes-
sages’ contents is a vector of 32-bit fields; 20 of those bits represent the node id of a neighbor
that has been found, while the remaining 12 bits store the link weight. Neighbor node IDs are
discovered by listening to HELLO messages, while link costs are a linear combination of factors
such as bandwidth, delay, link usage price, and stability. TC messages are generated periodically
by each node and retransmitted once by other nodes, until reaches every node in the network. At
a given moment, each RBridge has a TC per each existing RBridge and uses this information to
calculate the best path to reach every other RBridge using Dijkstra algorithm.

8 Vehicular Networks
MAC Control Messages (MC) [1] are similar in purpose to TC, but instead of advertising
other RBridges it advertises a list of attached end-user terminals, each terminal represented by its
MAC identifier (EUI-48). Like TC, MC messages are periodically generated and forwarded by all
the other nodes. At a given moment, each RBridge has a MC per each existing RBridge and uses
this information to know which RBridge has the destination MAC. Once the destination RBridge
ID is known, the original Ethernet frame is encapsulated and a MPLS [16] header is added con-
taining the 20bit id of the destination RBridge.
IP Control Messages (IC) [1] are used to disseminate IP-MAC associations. Typically, IC
messages are generated only by RBridges directly attached to a DHCP server, using the informa-
tion contained in DHCP leases. As the overlay network operates over layer 2 and all the termi-
nals have the same sub-net IP addresses, they think that all other terminals are locally accessible.
Terminals use ARP [17] protocol to discover what MAC address has the destination terminal IP
address. RBridges intercept ARP requests and forge an ARP reply using IC messages informa-
tion. This mechanism is an optimization to avoid ARP broadcasts in the network, increasing the
architecture scalability.
2.1.2 SITMe Project
The SITMe1 project was developed to deliver information services to bus passengers. Some of the
provided services include displaying passenger assistance information, news and entertainment
information, interactive services, and passenger Internet access via the bus wireless network.
To accomplish this, a multi-technology communication system was developed which currently
supports Wi-Fi (IEEE 802.11n) working in Infrastructure and Ad-hoc modes, Mobile WiMAX
(IEEE 802.16e) and UMTS. SITMe works in a vehicular mobility scenario similar to WiMetroNet [12].
WiMetroNet, as seen in Section 2.1.1 presents an architecture for a large mesh network of moving
RBridges (an RBridge connects multiple network segments at the layer 2) operating over hetero-
geneous wireless technologies to provide broadband access to vehicles, stops, and passengers of
a public transportation system. It was decided that the routing algorithm used in these scenarios,
also known as WMRP [11], would be an excellent candidate to be used in the SITMe RBridges.
Although SITMe scenario is similar to WiMetroNet some changes had to be made to it. While
WiMetroNet assumes that the metropolitan area has full WiMAX coverage, and that WLAN would
be used when possible and UMTS is considered but not implemented. SITMe on the other hand
assumes that the metropolitan area has full UMTS coverage, and that WLAN and WiMAX would
be used when possible. This inclusion of UMTS in the scenario was not possible at the start be-
cause UMTS requires public links and WiMetroNet only supports private links. Adding support to
public links was achieved by changing the WiMetroNet data plane by adding UDP encapsulation
as shown in figure 2.2. These changes were developed in the MSc Dissertation “Multi-Technology
1Serviços Integrados para Transportes Metropolitanos

2.1 Vehicular Network Architectures 9
Router for mobile Networks: Layer 2 Overlay Network over Private and Public Wireless Links”
by Helder Martins Fontes. [1]
Figure 2.2: SITMe Communication Stack for public Links [1]
In terms of network architecture SITMe is fairly complex. Each BUS is equipped with a
RBridge which is, in its turn, connected by Ethernet to an AP that will provide access to passen-
gers inside the BUS as well as to the Xarevision module. Each RBridge also supports multiple
technologies, having WiMAX, UMTS and WLAN interfaces that will be used to communicate
between each other. There is also a Core RBridge located inside FEUP which takes care of several
administrative functions (for example DHCP leases). SITMe can use both the UMTS and WLAN
through its public link functions. WIMAX can be accessed through private links. A network dia-
gram of SITME is presented in figure 2.3.
Figure 2.3: SITMe Network Overview [1]
SITMe is currently running a pilot on 11 STCP buses operating in line 207 where several tests

10 Vehicular Networks
are being performed. These tests take advantage of this real operation scenario where multiple
network technologies coexist and bus passengers are using the system. The main partners of this
project are: FEUP 2, INESC Porto 3, FEP 4, Xarevision 5 and STCP 6. Figure 2.4 shows the STCP
bus line number 207.
Figure 2.4: STCP Bus Line 207
2.1.3 Comparison and Conclusions
Although SITMe is closely based on WiMetroNet some changes were made to it. In terms of
scenarios the SITMe scenario is quite different from WiMetroNet, as presented in Section 2.1.2
SITMe introduced support for public links. Another different aspect is that although they both
use WMRP, SITMe data plane is different from WiMetroNet data plane. That is because it was
necessary to add UDP encapsulation to support public links.
The implementation of IEEE 802.11p is the main scope of this dissertation. Unfortunately,
SITMe may not be ready for this technology. This is because SITMe was built with the express
goal of using IEEE 802.11n WLAN technology. The differences between IEEE 802.11n and IEEE
802.11p are expected to cause problems if a simple replacement of technology was tried. Because
of this, a series of alterations to its network infrastructure and to some of its elements (for example,
changes to WMRP) are expected. The public link access will not be required for IEEE 802.11p,
2http://www.fe.up.pt3http://www.inescporto.pt/4http://www.fep.up.pt5http://www.xarevision.pt/6http://www.stcp.pt/

2.2 Vehicular Wireless Technologies 11
as both the Road Side Unit (RSU) and the On Board Unit (OBU) will form RBridges with private
links (with access to OSI Layer 2). This means that the changes to be made to SITMe could also
be made to WiMetroNet directly. The complete list of necessary changes, as well as the reasoning
behind those changes, will be presented in Section 3.3.
2.2 Vehicular Wireless Technologies
In the following Section a short overview of the most promising vehicular networks is presented.
Although a brief overview of WiMAX and UMTS is also presented, we focus on WLAN tech-
nologies.
2.2.1 Wi-Fi
Wi-Fi is the name of the family of network Technologies that use the IEEE 802.11 standard [18]. It
is a registered trademark of the Wi-Fi Alliance [19] and allows the creation of high speed wireless
networks (WLAN). The IEEE 802.11 standard has several amendments that have been created
over the years. Each amendment has different parameters, such as different data rates, modula-
tions, coding schemes, symbol duration and guard times. Some of the most important amend-
ments are the IEEE 802.11a, IEEE 802.11b, IEEE 802.11g and IEEE 802.11n. In addition, a new
amendment was created to allow Wireless Access in Vehicular Environments (WAVE), also known
as IEEE 802.11p.
Table 2.1 presents a brief comparison of the various amendments listed above in terms of
access speed, range and operation frequency.
802.11a 802.11b 802.11g 802.11n 802.11pAccess Speed (Mbit/s) 54 11 54 150 or 300 6 to 27Range (Meters) 15.2 30.4 30.4 15.2 300-1000Operation Frequency (GHz) 5.15 - 5.85 2.4 2.4 2.4 or 5 5.85-5.95
Table 2.1: Short comparison between 802.11 amendments [9]
These technologies can only communicate with each other if they use the same Operation
Frequency. For example, 802.11a will not be able to communicate with 802.11b. Additionally,
802.11n will only reach an access speed of 300 Mbit/s in dual-channel mode with 40 MHz chan-
nels. Additionally all the ranges presented are for indoor environments except the range presented
for IEEE 802.11p.
Wi-Fi (except IEEE 802.11p) also allows two distinct network architectures, 1) infrastructure
architecture and 2) ad-hoc architecture. The infrastructure architecture is defined by the utilization
of Access Points (AP). These terminals connect the WLAN with other networks using, usually,

12 Vehicular Networks
Ethernet cable. Each mobile terminal connects to one AP establishing between them a Basic Ser-
vice Set (BSS). Each AP works as a portal for other networks and all the mobile terminals must
communicate through the AP to which they are connected, even if the desired communication link
is between two mobile terminals in the same BSS. As for the ad-hoc architecture, the main distinc-
tion of the infrastructure architecture is the absence of an AP. Instead, the terminals communicate
with each other directly, creating between them an Independent Basic Service Set (IBSS).
2.2.2 Wireless Access in Vehicular Environnments
Wireless Access in Vehicular Environments or WAVE is an operation mode for IEEE 802.11 de-
vices operating in the Dedicated Short Range Communications (DSRC) band. It works on top of
the IEEE 802.11p amendment and uses Orthogonal Frequency-Division Multiplexing (OFDM).
WAVE is described in the IEEE 1609 family of standards which defines the architecture, the com-
munications model, the administration structure, security mechanisms and physical access. The
main architectural components defined by these standards are the OBU, the RSU and the WAVE
interface. It is also defined how the WAVE applications should behave according to 1) the adminis-
tration activities defined in the IEEE 1609.1 amendment; 2) the security protocols defined in IEEE
1609.2; 3) the network protocol in the IEEE 1609.3; and 4) the extensions offered to physically
access the communications channel defined in IEEE 802.11 to support multi-channel operations as
defined in IEEE 1609.4. The main characteristics that WAVE possesses are: ranges of nearly 300
to 1000m, a transmission speed of 6-27 Mbit/s and support for Intelligent Transportation Systems
(ITS) applications. These types of applications include the communications between vehicles, also
known as V-to-V, and between vehicles and infrastructures, also known as V-to-I. They generally
depend on radio services for communication and use specialized technologies. [20]. The WAVE
OSI model can be observed in figure 2.5.
Figure 2.5: WAVE - OSI Model [2]

2.2 Vehicular Wireless Technologies 13
2.2.2.1 Dedicated Short Range Communications
Dedicated Short Range Communications or DSRC is a packet communication system developed
by the Electronics and Telecommunications Research Institute (ETRI) that works on the frequency
band of 5.850-5.925 GHz [21]. This band is divided in 7 channels of 10MHz each. This system
is defined by its ranges (300 to 1000m), high access speeds (6 to 27Mbit/s), and for working in
Half-duplex (a terminal cannot receive and send information at the same time). There are several
communication systems of this type already in development with the purpose of being applied to
ITS services. DSRC also has a channel allocation scheme characterized by the existence of 1) two
zones for medium ranged services (with a power limit of 33dBm); 2) two zones for short ranged
services (with a power limit of 23dBm) for data transfer; 3) two service channels designed for
security critical applications; and 4) a prioritization mechanism for public safety messages and
applications in all channels. The channel allocation scheme can be observed in figure 2.6.
Figure 2.6: DSRC - Channel Allocation [3]
2.2.2.2 DSRC - WAVE Networks
As introduced in Section 2.2.2 the WAVE networks use two distinct nodes: an OBU, which must
be placed inside the desired vehicle serving as an 802.11 terminal; and a RSU, usually located
at the road side serving as an AP. These networks can also operate in a Infrastructure or Ad-
hoc architecture. In the infrastructure architecture, the OBUs access the network through a Wave
Basic Service Set (WBSS). The WBSS works similarly as the Basic Service Sets detailed in Sec-
tion 2.2.1. In this case it consists in the aggregation of OBUs and RSUs. To differentiate the
stations in each WBSS it is considered that the station providing a service is the provider and that
all the other stations are users. [10]

14 Vehicular Networks
The operation mode of a OBU consists in the following steps: 1) When a OBU approaches
a RSU it will receive a WSA (Wave Service Announcement) message through the control chan-
nel (CCH); 2) this message contains information about the RSU, such as which is the designated
Service Channel (SCH); 3) the OBU will then switch to the designated SCH and will start com-
municating with the RSU through it. This procedure of listening in two different channels can be
either achieved by time division or having two radios, with one of them constantly listening in the
CCH. [5]
2.2.3 IEEE 802.11p Performance
As detailed in the Section 2.2.2, IEEE 802.11p amendment was created to add WAVE functional-
ities to WLAN access. Since the other Wi-Fi amendments detailed in Section 2.2.1 are not ready
for mobility scenarios, it was pertinent to understand how much better would IEEE 802.11p per-
form than the other amendments.
Wei-Yen Lin, Mei-Wen Li, Kun-chan Lan and Chung-Hsien Hsu performed a series of tests
comparing IEEE 802.11a and IEEE 802.11p in “A comparison of 802.11p for V-to-I commu-
nication: a measurement study” [10]. This comparison was found especially important for this
Dissertation because it not only compares two IEEE 802.11 amendments that work in close oper-
ation frequencies (IEEE 802.11a works in 5.15-5.85 GHz and IEEE 802.11p works in 5.85-5.95
GHz) but it also describes a series of tests particularly useful to evaluate the performance gain.
Table 2.2 shows a comparison of the physical layer between IEEE 802.11a and IEEE 802.11p.
Parameters 802.11a 802.11pBit rate (Mbit/s) 6,9,12,18,24,36,48,54 3,4,5,6,9,12,18,24,27
Modulation mode BPSK, QPSK, 16QAM, 64QAM BPSK, QPSK, 16QAM, 64QAMCode rate 1/2, 2/3, 3/4 1/2, 2/3, 3/4
Number of subcarriers 52 52Symbol duration 4us 8us
Guard time 0.8us 1.6usFFT period 3.2us 6.3us
Preamble duration 16 us 32 usSubcarrier spacing 0.3125 MHz 0.15625
Table 2.2: Comparison between 802.11a and 802.11p physical layers [10]
From table 2.2 it is possible to verify that 1) IEEE 802.11p uses half of the Bit rates and half of
the subcarrier spacing as IEEE 802.11a; 2) there is no change in terms of modulation mode, code
rate and number of subcarriers; and 3) IEEE 802.11p uses double of the symbol duration time,
guard times, FFT period and preamble duration.
The tests defined were, 1) contact duration, which is the longest interval between the first
packed sent by the OBU and last packet received by the RSU; 2) loss distribution, which analyzes

2.2 Vehicular Wireless Technologies 15
some loss factors, mainly the multipath propagations; and 3) throughput using different mod-
ulations, which measured the impact of different modulations and distances on the throughput.
The results were then used to perform a more complete evaluation on the performance of IEEE
802.11p. Table 2.3 shows the contact time obtained by both IEEE 802.11a and IEEE 802.11p with
the vehicle moving at different speeds.
Contact Time (seconds)Speed (km/h) 802.11a 802.11p
20 4.5 38.540 0 1960 0 14
Table 2.3: Contact duration [10]
In terms of contact duration, the tests showed that 802.11p surpassed by far the performance
of 802.11a for the same speed conditions [10]. This is due, mainly, to the fact that 802.11p has no
authentication nor association process. In terms of loss distribution, the tests showed that, again,
802.11p behaved better than 802.11a in a vehicular mobility scenario [10]. The main cause of
inter-symbol interference is the multipath propagation effect, which can be prevented by using
a guard interval higher than the duration of all the multipath signals received after the original
(the guard time for IEEE 802.11p is two times bigger than the guard time for IEEE 802.11a).
As for throughput using different modulations, the tests showed that the theoretical throughput
associated to each modulation could never be reached, and that a switch between a BPSK and
QAM modulations would be desired to maintain high throughputs through all the coverage range.
More specifically, it would be desirable to use BPSK for larger distances and QAM for shorter
distances between RSU and OBU. [10]
2.2.4 WiMAX
WiMAX, or IEEE 802.16, is a point-to-multipoint wireless technology that provides a similar
performance to Wi-Fi and provides high speed access to large metropolitan areas. It has a very
large working range, close to 50Km for fixed terminals (Fixed WiMAX) and 15Km for mobile
terminals (Mobile WiMAX [22] also known as IEEE 802.16e) and works in both licensed and
non-licensed frequencies. Mobile WiMAX is especially important because it offers medium to
long range connectivity, and also, full support to mobility and high data rates, allowing a constant
connectivity between mobile users that are moving with speeds of up to 120 km/h. WiMAX
also offers a robust security scheme, a very good QoS and the utilization of intelligent antennas
that improve the usage of the available frequency spectrum. Because of all these aspects it is
understandable that WiMAX and IEEE 802.11p can complement each other. In “A Comparative
Study between 802.11p and Mobile WiMAX-based V2I Communications Networks” [23] a series
of simulations were performed. The results of such tests helped the authors determine the contact
duration and the performance of both solutions for different offered data rates and different vehicle
speeds. For the contact duration it was considered a packet delivery ratio of 90% and it resulted

16 Vehicular Networks
in IEEE 802.11p having a coverage of around 900m, whereas WiMAX provided a coverage of
almost 6.5Km. This difference correlates to IEEE 802.11p being a more expensive solution [24],
and to cover the same area as WiMAX it would require a higher number of RSUs. From the
performance tests it was possible to determine that WiMAX performed better for higher distances
between OBUs and base stations, as for IEEE 802.11p it was concluded that it responded better to
low traffic load scenarios.
2.2.5 UMTS
UMTS, also known as 3G, is the term given to the third generation radio technologies developed by
3GPP. It uses W-CDMA with either Frequency Division Duplex (FDD) or Time Division Duplex
(TDD) variants [25]. UMTS offers services such as speech, SMS, and bearer services which
allow information transfer between APs, they also have different QoS parameters for maximum
transfer delay, delay variation and bit error ratio (BER) as well as QoS classes for different types
of traffic [26], such as:
• Conversational traffic, e.g. voice, telephony;
• Streaming traffic, e.g. multimedia, video on demand;
• Interactive traffic, e.g. web browsing, network gaming;
• Background traffic, e.g. email, SMS, downloading.
The UMTS architecture consists of three entities, the Core Network (CN), UMTS Terrestrial
Radio Access Network (UTRAN) and User Equipment (UE). Since the CN used is derived from
GSM, it allows a backward compatibility with GSM access technology. Some improvements have
been made to UMTS along the years; the implementation of HSPA was probably the most impor-
tant improvement. HSPA is the terminology given when both HSDPA and HSUPA are used in the
same network and is now one of the most common mobile broadband access technologies. HSPA
increases the UMTS spectrum efficiency by using 16QAM techniques as well as reducing radio
frame lengths and providing re-transmissions between Node-B7 and the Radio Network Controller
(RNC), these changes severely increased throughput and decreased latency. More recently an evo-
lution of HSPA called HSPA+ was introduced, adding multiple-input and multiple-output (MIMO)
antenna capabilities and a 16QAM for uplink and 64QAM for downlink modulation. [25]
2.2.6 Comparison and Conclusions
In this Section the main technologies that could be used to implement vehicular networks have
been studied. SITMe already uses WiMAX and UMTS. For WLAN, there is the option to consider
switching the IEEE 802.11n implementation by a solution built specifically to deal with vehicular
mobility, such as IEEE 802.11p.Table 2.4 shows a small comparison between IEEE 802.11n and
7Term used in UMTS equivalent to Base Transceiver Station

2.3 Handover in IEEE 802.11 Networks 17
IEEE 802.11p in terms of cost, communications range, throughput, and association time.
TechnologiesParameters 802.11n 802.11p
Lower Cost V FHigher Range F VHigher Throughput V FLowest Association Time F V
Table 2.4: Short Comparison Between IEEE 802.11p and IEEE 802.11n
Both in terms of cost and throughput IEEE 802.11p is clearly no match for IEEE 802.11n,
but, when comparing both technologies in terms of range and association time, the clear winner is
definitely IEEE 802.11p. What remains to be verified is if the better behavior of IEEE 802.11p in
these two points would be enough to consider it a better solution than IEEE 802.11n in the SITMe
scenario.
2.3 Handover in IEEE 802.11 Networks
Handover [27] or handoff is the process that a mobile station undergoes to change the AP to which
it is associated. It is important to denote there are two different types of handovers, horizontal han-
dovers and vertical handovers. Horizontal handovers are the handovers performed between two
APs of the same technology. Vertical handovers are handovers between different technologies,
for example, between IEEE 802.11n and WiMAX and the procedure is considerably different and
more complex than the one of horizontal handover. In the context of this thesis there is special
interest in horizontal handovers for IEEE 802.11p. The vertical handovers and horizontal han-
dovers for the other technologies are already implemented, fully tested and working as expected.
To better understand the process of horizontal handovers, first, the process for IEEE 802.11abgn
is introduced and then for the IEEE 802.11p.
In IEEE 802.11abgn networks this process starts by the degrading of link quality metrics, for
example, a decrease of the received strength indicator of the signal between mobile station and AP.
Once this metric reaches a certain threshold, the mobile station starts a probe/discovery phase by
using the MAC level function, scan. This scan function will listen for beacons sent by neighbor-
ing APs in 100ms intervals. The received beacons will be used to learn which APs are currently
neighboring the mobile station and to grade these neighbors by the RSSI present in the received
beacon. Since power management is a very important feature of wireless networks, two different
scanning schemes were created, a passive scan and an active scan. Passive scanning requires that
the mobile station scans all the candidate channels for beacons sent by APs, whereas, active scan-
ning requires that the mobile station broadcasts probe requests to a designated channel, forcing

18 Vehicular Networks
an existing neighbor AP to reply to the request. Once a good candidate AP is found, an authenti-
cation and re-association phase is started involving the transfer of credentials from the old AP to
the new AP. When the mobile station becomes successfully associated to the new AP and able to
establish communication, the handover process is considered complete. For IEEE 802.11p there
are some particular differences to perform the handover. Because IEEE 802.11p uses a simplified
IEEE 802.11 model, which lacks management frames, and no beacons are sent by APs, a better
handover model is needed. This handover model has also to meet the special requirements for
vehicular networks scenarios.
The main problems that need to be solved in order to create a handover scheme for IEEE
802.11p are:
1. Since there are no beacons the mobile station can’t scan for different APs.
2. Because there is no scan all the APs must work in the same frequency (unless WAVE is also
implemented).
3. Multiple APs working in the same frequency will create interferences in the communica-
tions.
4. Because all the APs will work in the same frequency they will all be able to listen the
communication. This might add to redundant information being sent or received from the
APs. For example, two APs answering the same request from a client.
2.3.1 Seamless Handover using RSU IDs
Choi J. and Lee H. propose a novel seamless handover scheme for IEEE 802.11p in “Supporting
Handover in an IEEE 802.11p-Based Wireless Access System” [4]. This scheme was developed
for a highway scenario where the identification of successive RSUs is possible by knowing the
ID of the precedent RSU. This knowledge of the RSU ID allows the RSU to start the handover
procedure on request from the OBU. By using the IEEE 802.11 disassociation message it is pos-
sible to warn the current RSU that handover is necessary. This way, the current RSU can stop
transmitting data frames destined to the OBU and, instead, forward them to the next RSU which
will pre-emptively buffer them. When the new RSU receives a handover request it will, also,
populate the network above it with a message to force all the switches to update their tables to
record the new location of the OBU. This means that the entire traffic heading to the OBU will
now be directed through the new RSU instead of the old RSU. Once the OBU receives the new
WSA message from the new RSU, it will be ready to receive the buffered data frames. Figure 2.7
and 2.8 shows the network architecture associated with this solution and the message exchange
process that provides the handover functionality.

2.3 Handover in IEEE 802.11 Networks 19
Figure 2.7: Network Architecture for Seamless Handover using RSU IDs [4]
Figure 2.8: Message Exchange for Seamless Handover using RSU IDs [4]
This handover scheme solves problems related to the reception of repeated and redundant
information by the RSUs. It does not resolve problems related to interferences resulting from
multiple APs working in the same frequency.
2.3.2 Handover under Multi-channel Operation
Cho W, Kim M, Lee S and Seo Oh Hyun in “Implementation of Handover under Multi-channel
Operation in IEEE 802.11p based Communication Systems” [5] propose a handover algorithm for
IEEE 802.11p based communications systems using the WAVE multi-channel capabilities. When
an OBU receives a WSA message it analyzes the content. The information extracted from this
message enables to create an available service table containing the provider service ID (PSID),
priority and RSSI information. The OBU current service is then verified and, based in the priority
information, a SCH is chosen. Assuming a scenario with two consecutive RSUs, each one of them

20 Vehicular Networks
will be broadcasting WSA messages using the CCH. To make sure these messages are different
from each other, a different time slot for each RSU is used within the CCH. With this setting the
OBU can receive two distinct WSA messages in the same location. By making each consecutive
RSU use different SCH it is, then, possible to enforce that once the OBU creates the service table
it will use the SCH with highest priority. This process of switching to different SCHs effectively
creates handover between the RSUs. Figure 2.9 shows the message exchange between two RSUs
and one OBU, f0 is the frequency of the CCH whereas f1,f2 is the frequency of the SCH used by
each RSU.
Figure 2.9: OBU Operation under multi-channel conditions [5]
This handover scheme is based on the usage of WAVE and therefore solves all the problems
related to handover in IEEE 802.11p.
2.3.3 Handover using SITMe WMRP
As presented in Section 2.1.1, SITMe currently uses a layer 2 routing protocol known as Wireless
Metropolitan Routing Protocol (WMRP). This routing protocol, detailed in Section 2.1.1.2, uses
a set of messages to build a data base in each RBridge that is used to calculate the shortest path
to any known node. Currently the link weights are all equal, which means the shortest path is
simply the minimum hop distance. As in Section 2.3.1 this handover scheme will only solve
problems associated with the reception of redundant or repeated information by the RSUs. The
main advantage of implementing this solution is that it is already running on SITMe. It would
be only required to change some of the parameters of WMRP, such as adding weighted links
functionalities.

2.3 Handover in IEEE 802.11 Networks 21
2.3.4 Comparison and Conclusions
The three handover schemes presented in Section 2.3.1, 2.3.2 and 2.3.3 demonstrate the existence
of several different solutions ready to be implemented to solve the handover problems. In terms
of complexity, the first solution (Section 2.3.1) proposed seems to be clearly the most complex. It
was built with for very specific highway scenario where vehicles movements and handovers are
highly predictable. SITMe works in an urban scenario rather than in a highway scenario, with
different possible routes and possible handovers when considering, for example, a grid of roads.
The second solution (Section 2.3.2) seems to be the least complex to implement. It simply uses
properties native to WAVE, assuming it is implemented in the network control plane functionali-
ties. Although some lost time while establishing the connection is expected it should still behave
in a seamless fashion [5]. The main problem associated with this solution is that it requires WAVE
to be implemented. The third solution (Section 2.3.3) shows a lot of promise, not only it is a
solution already implemented in SITMe, the amount of changes required to port it to be ready for
IEEE 802.11p should be small. In terms of complexity, it is clearly more complex than the second
solution. The main advantage is that it does not require WAVE. Since implementing WAVE is not
one of the goals of this dissertation, the third one solution was chosen.

22 Vehicular Networks

Chapter 3
Integration of the IEEE 802.11p module
Chapter 2 presented 1) the vehicular network architectures associated to SITMe, 2) the main vehic-
ular wireless technologies and 3) some handover scenarios prepared for IEEE 802.11p mobility.
In this Chapter, with the knowledge obtained from the studies performed in Chapter 2, a selection
of a complete solution for our problem is addressed. This includes selecting the hardware and
software while respecting the requirements presented in Section 1.4. It is also necessary to study
and decide how to integrate the IEEE 802.11p module in SITMe, detailing the necessary changes
to the SITMe architecture. By the end of this Chapter, it is expected a fully justified decision on
the hardware and software architecture of the module to be, then, implemented, tested, validated
and integrated on SITMe.
3.1 Hardware Selection
This Section addresses the IEEE 802.11p solution hardware selection process. The selected hard-
ware must be able to run the solution in SITMe, but also to perform the necessary tests in order
to validate it on a Mobile Testbed (MT). This selection should respect the requirements estab-
lished in Section 1.4. Some of those requirements may not be fully met due to limitations found
in the available hardware. Such specific limitations are analyzed in depth and fully explained.
Compatible workaround alternatives for such cases are also proposed and thoroughly justified.
Throughout this Chapter is described and justified the selection of an IEEE 802.11p card, a PC
Engines Alix3d3 computer, antennas, and compact flash (CF) cards.
3.1.1 IEEE 802.11p Cards
The selected IEEE 802.11p card was the UNEX 1 DCMA-86P2 IEEE 802.11p. This card is ready
to operate in the 5.86-5.92 GHz range and supports V-to-V and V-to-I communications using the
DSRC protocol. This card was already available to use and test at INESC, so, no alternative solu-
tions were required. This card has a mini-PCI connector which presents us the first limitation. The
SITMe RBridge does not have a mini-PCI bus but, instead, a mini-PCI Express bus. This means
1http://www.unex.com.tw/
23

24 Integration of the IEEE 802.11p module
that a solution comprising the direct integration of the IEEE 802.11p card into the SITMe RBridge
is not possible. To overcome this incompatibility, two different solutions were found . The first
one would be to use a mini-PCI to mini-PCI Express adapter. This would allow circumventing
the bus incompatibility between the IEEE 802.11p car and the SITMe RBridge. The second so-
lution would be using an additional computer, for example, an additional computer that would be
connected to the SITMe RBridge through Ethernet. This second solution has more drawbacks, as
every single Bus would require an additional RBridge. This represents a less compact solution,
with more power consumption and, obviously, more expensive. The advantages are 1) this solution
can run a different Operating System from the one used on the RBridges, if needed, to support the
IEEE 802.11p card, and 2) this solution, in case of supporting PoE and being small in size, can be
used to actually deploy the RSUs on the real scenario (current RBridge hardware already installed
on buses do not support this). The UNEX DCMA-86P2 card has an Atheros chipset, which means
some level of compatibility with the Atheros family of drivers for Linux is to be expected. Some
of the technical details of this card are presented in table 3.1.
Frequency Range 5.89 – 5.92 GHzChannel Bandwidth 40, 20, 10 and 5 MHzOperation Voltage 3.3 ± 5% VDCModulation Technique OFDM with BPSK, QPSK, 16-QAM and 64-QAMData Rate For 10 MHz BW: 3, 4.5, 6, 9, 12, 18, 24, 27 Mbit/sAntennas 1 Antenna Connector
Table 3.1: Technical Details of the UNEX DCMA-68P2 [6]
Looking at the table 3.1 it is possible to understand that this card supports the required 10 MHz
channel, as well as the associated data rates and the modulations techniques necessary for WAVE.
Figure 3.1 shows the UNEX DCMA-86P2 IEEE 802.11p Card.
Figure 3.1: UNEX DCMA-68P2 IEEE 802.11p Card [6]

3.1 Hardware Selection 25
3.1.2 PC Engines Alix3d3
The Alix3d3, from PC Engines, is a small computer (100 x 160 mm) with an X86 architecture that
was already available at INESC. It is a lower power consumption computer with a 500MHz AMD
Geode processor and 256MB DDR Ram welded to the computer. Having the memory welded
is a beneficial addition. The X86 architecture also allows the usage of several operating systems
which means its a more dynamic solution. This might be especially useful to adapt our system to
the IEEE 802.11p drives presented in Section 3.2.1. These computers will be used for the Mobile
Testbed and as part of the complete solution, so, the memory being welded means more resistance
to the vibration. Vehicles moving cause heavy vibration that might cause the memories to detach
if not welded. Having welded components decreases that risk. The storage in the Alix3d3 is
done by the means of a CF card. It also has 2 mini-PCI slots which are compatible with the
UNEX DCMA-86P2 card described in Section 3.1.1. Furthermore, it can be powered either by
Power Over Ethernet (POE) or through a compatible AC adapter. The POE makes it the perfect
candidate to implement as RSUs on the real scenario. Figure 3.2 shows the front side and backside
of the Alix3d3.
Figure 3.2: PC Engines Alix3d3 [7]
3.1.3 Antennas
For antenna a “Dipole Antenna DUAL 5/2.4GHz 5dBi RSMA connector”2 was chosen, although,
it is not DSRC ready. This antenna works in the 5.15-5.85 GHz range, which means it was de-
signed for the range needed by IEEE 802.11a. The main advantage of this antenna is that INESC
Porto can already provide it for the testbed, avoiding the spending of additional money in antennas.
It is thought that, although it is not DSRC ready, the operation frequency should be good enough to
do all the required tests. A higher degree of attenuation might be verified. This will be the antenna
2http://landashop.com/catalog/index.php

26 Integration of the IEEE 802.11p module
to be coupled with the UNEX DCMA-86P2 IEEE 802.11p card, and has the following specifica-
tions: 1) Operation Frequency: 2.4/5GHz; 2) DB gain: 5dBi; 3) Propagation: Omni-directional;
and 4) Working temperature range: -20 to +80°C.
3.1.4 Other Equipment
A compact flash (CF) card with 8GByte of storage space will be also used. As stated in Sec-
tion 3.1.2, the Alix3d3 has a CF slot and uses CF cards as a storage device. Seeing that a
lightweight Linux distribution will be used, it was considered that 8GByte will be more than
enough for all the tests intended to be performed. Another piece of required equipment is the RSU
case. Assuming that the RSU must be in an outdoor environment, it is important that the case
completely protects it from adverse weather conditions, such as rain. As such, was decided to use
a MINI-BOX enclosure for Alix3d2. Although this box is meant for the Alix3d2, it is also compat-
ible with the Alix3d3 selected for this work. This box has 2 type N 3 connectors for antennas and
an Ethernet port which can be used also for POE functionality. Figure 3.3 shows the MINI-BOX
enclosure.
Figure 3.3: MINI-BOX for Alix3d3
3.2 Software Selection
After selecting the different hardware pieces that will be used for the complete solution, as well as
to the Mobile Testbed, it is, now, necessary to select the software. The operating system, as well
as the IEEE 802.11p drivers, will have a big part in the overall functionality of the system. There
is also additional software which will mostly be used in the context of the Mobile Testbed. Same
as before, the selection of all these aspects should have in mind the requirements established in
3Connector that works in radio frequencies

3.2 Software Selection 27
Section 1.4. Though, if limitations arise, then those requirements might not be met, but valid and
compatible alternatives are addressed.
3.2.1 IEEE 802.11p Drivers
The selection of compatible IEEE 802.11p drivers for Linux is probably the single most important
detail of the software selection. Driver compatibility is many times tied to kernel versions, as well
as to versions of several software dependencies. These dependencies can have an effect on our
choice of Operating System. These drivers should also be open source and easily obtained to meet
the requirements in Section 1.4.
After a thorough online search, it was found that there are no widely available and updated
drivers for IEEE 802.11p. Seeing as some of the specifications tied to IEEE 802.11p (WAVE
for example) are still being drafted, the current number of teams working with IEEE 802.11p
is small. The only drivers that showed promise were created by the Grand Cooperative Driving
Challenge 4(GCDC). The GCDC presents a series of challenges to interested investigator teams to
develop vehicular mobility applications based in IEEE 802.11p[28]. Furthermore, they created a
series of patches that can be applied to the Atheros family of drivers. These patches were made
to adapt the driver responsible for the IEEE 802.11a mode to work in IEEE 802.11p mode. More
specifically, these patches target the Ath5k driver, enabling IEEE 802.11p capabilities. Figure 3.4
shows the patching of the Ath5k driver.
Figure 3.4: Patching Ath5k Driver with GCDC patch
These patches work by changing the MAC and PHY layer specifications, from the specifica-
tions of IEEE 802.11a to IEEE 802.11p. This means halving the bit rate and subcarrier spacing
and doubling the symbol duration, guard time, FFT Period and preamble duration. These changes
can be viewed in table 2.2. It is also important to note that these patches do not create the WAVE
stack present in figure 2.5. This means that they do not supply WAVE capabilities such as multi
frequency channels. Another limitation is that it is not possible to access the RSSI values natively.
4http://www.gcdc.net/

28 Integration of the IEEE 802.11p module
A more elaborate solution had to be applied to obtain this value and will be presented in Sec-
tion 3.3.2.
GCDC currently offers two distinct solutions to apply the IEEE 802.11p driver patches. The
first one is aimed at a generic Linux system (Fedora, Ubuntu, etc.), whereas the second is aimed
at OpenWrt 5. GCDC also has an installation manual that can help on the installation procedures
of their solutions. The biggest drawback is that both the solutions were last reviewed in 2010.
As it will be described in Section 3.2.2, this caused us several compatibility and dependencies
problems.
3.2.2 Operating System
To meet the requirement established in Section 1.4, the operating system to be used to completely
integrate the IEEE 802.11p card into SITMe should be Ubuntu 11.04 (Natty Narwhal). This distri-
bution of Ubuntu uses kernel 2.6.38.2 and was released on the 28th of April of 2011. As stated in
the requirements in Section 1.4 SITMe runs this operating system, and because there’s some hard-
ware that requires some dependencies found in this operating system getting the IEEE 802.11p
module working here would be the ideal solution. Unfortunately it was verified that the only cur-
rently existing open source IEEE 802.11p drivers are not compatible with this Ubuntu version (and
its corresponding kernel version). After several tries it was decided to move to operating systems
that the organization that created the drivers recommended.
Following the recommendations posed by the GCDC, there were two main solutions of oper-
ating systems that could be used. The first solution would be using Ubuntu 9.10 (Karmic Koala)
with kernel version 2.6.31.1. The second solution would be using OpenWrt Backfire 10.03 for
X86. Firstly, Ubuntu 9.10 was selected to begin the tests but it was not fully compatible with the
Alix3d3 computer. This resulted in difficulties getting the Ubuntu 9.10 to boot in the Alix3d3
computer. Based on this, it was decided to use the OpenWrt alternative. OpenWrt is a Linux
distribution for embedded devices that provides a fully writable file system with package man-
agement. It is mostly used for router hardware but has the possibility of being installed in X86
systems [8]. It only possesses a command line interface, although, a more graphical interface that
can be accessed through HTTP could be installed.
The installation of OpenWrt starts by selecting and compiling the required packages. To make
this process as error free as possible, this cross-compiling was performed in a machine running
Ubuntu 10.10. A more recent version of Ubuntu was initially used to compile OpenWrt but it
caused several problems. Of those problems, the main one was the inability to boot OpenWrt after
compiling and flashing the CF card. In Section 3.2.3 a full overview on the installation procedure
of both the GCDC IEEE 802.11p patches as well as of OpenWrt is presented.
5https://openwrt.org/

3.2 Software Selection 29
3.2.3 Compiling and Installing OpenWRT
To compile and install both the driver patches and OpenWrt, the installation manual present in the
GCDC website was followed. The GCDC Reference Communications Stack found in the GCDC
website had all that was required to perform these tasks. This package contains an OpenWrt sys-
tem customized for GCDC and some documents describing the contents of the package. This
process starts by extracting the OpenWrt distribution and editing the “feeds.conf.default” file and
adding a static path to where the GCDC Reference Communications Stack packages are located.
Feeds work as repositories. Adding a costume path to the folders containing the packages means
that when selecting them it will be possible to install packages currently located in the system or
in pre-defined locations online. No changes need to be done to this file in the case that all the re-
quired packages needed are located in the OpenWrt repository. Now, a feed update command that
will incorporate the GCDC feed into the OpenWrt build system can be executed. After updating
the feed it is important to make sure all the packages are available to installation, this is done with
a "feed install" command.
With the feeds updated and installed, it is then necessary to run a “make menuconfig” com-
mand. This will start a series of procedures that will check that the current system has all the
necessary dependencies to successfully compile OpenWrt. It also allows choosing all the neces-
sary packages that are wanted in OpenWrt. Figure 3.5 shows the configuration menu.
After selecting all the packages, it is then necessary to run the "make" command. This com-
piles all the selected packages and creates the image files that will be posteriorly flashed to the
CF card. Once the compilation is concluded it is, then, necessary to add the patches to support
the IEEE 802.11p hardware and stack changes. This is done by copying all the patch files present
in the GCDC package to its corresponding location and then remaking the whole configuration.
In total, there are two patch files to be applied to the mac80211 package and one patch file to be
applied to the IW package. After this process is concluded successfully, the image files required to
flash the cards will be available. This last step is simply done by running the following command:
sudo dd if=IMAGENAME.image of=/dev/sdc
Note that the image name will change accordingly to what type of file extension were chosen.
The final path will also change, making sure the correct path is also chosen. This is vital or it
might cause data loss.
3.2.4 Additional Software
Along with the IEEE 802.11p drivers and the Operating System, some other software was also
required. The most important additional softwares selected were: Iperf 6, tcpdump 7, wavemon 8
6http://sourceforge.net/projects/iperf/7http://www.tcpdump.org/8http://freecode.com/projects/wavemon

30 Integration of the IEEE 802.11p module
Figure 3.5: OpenWRT Configuration Menu [8]
and Aircrack-ng 9.
Iperf [29] is a TCP and UDP monitoring software that allows the injection of traffic in a net-
work to measure its performance. It reports several values such as jitter, bandwidth and datagram
loss. Since it is natively available for OpenWrt, its installation is straightforward. It has no graph-
ical presentation so it is extremely simple to use, allowing to tune the characteristics of the traffic
needed to be injected. It is possible to define how much time is wanted for the test to run, how
much traffic to inject and how the final report should look. Although it has some report functional-
ities, some care must be taken when analyzing the output logs. Some of the values presented in the
log at the client side do not always match the values presented in the log at the server side (client
being the one who injects traffic). It is because of this discrepancy of reports that was decided to
use the tcpdump application.
Tcpdump [30] is a portable command-line packet analyzer based on libpcap [30]. It allows
capturing UDP packets being transmitted in the network. Using this application together with Iperf
9http://www.aircrack-ng.org/contact.html/

3.3 Changes to SITMe 31
allowed an increased degree of confidence in the results obtained. It is especially useful because
the logs it generates can be read with more complex applications such as Wireshark. This makes
the data treatment and analysis simpler than only having logs in text format. Same as for Iperf,
tcpdump also allows the usage of flags to additionally filter only the important traffic to focus on.
It is possible to capture only UDP traffic, as well as stating who is the sender or receiver of the
traffic to capture. It is also possible to define the amount of bytes to capture from each packet. This
is useful in the case that only the headers of a packet are needed. Being able to discard everything
but header creates shorter logs which, in its turn, make the analysis faster and simpler.
Wavemon [31] is an application based in ncurses [32] for wireless hardware. It is natively
included in OpenWrt, allowing for its simple installation. It has a simple graphical display that
shows several network and link quality parameters for wireless connections. It has the capability
of showing link quality, signal level, noise level and the signal-to-noise ratio of a wireless connec-
tion, as well as some statistics such as sent and received traffic. It also shows some information
about the interface and the network to which our interface is associated. It is possible to run wave-
mon through command-line and saving only the needed values as the output. This allows to more
easily log some parameters that would otherwise require additional scripting.
Aircrack-ng [33] is a network software suite that contains several features such as: packet
sniffing, WEP and WPA/WPA2-PSK cracker, analysis tool and packet injection. The main func-
tionality it has (and the one needed in this case) is the ability to turn different network cards into
monitor mode. This need came from the fact that wavemon was not able to obtain link quality
values from the IEEE 802.11p card used. As mentioned in Section 3.2.1, the GCDC drivers lack a
direct functionality to obtain link quality values which makes wavemon useless. With the airmon-
ng feature, it was possible to activate a monitor mode associated to the IEEE 802.11p interface
that could then be listened using, for example, tcpdump. Setting tcpdump to capture the monitor
interface allowed intercepting all the packets being sent through the network and, as an additional
feature, it was now possible to verify the RSSI of every link in the network. This feature is very
important for the handover procedure presented in Section 3.3.
3.3 Changes to SITMe
The changes that will be performed to SITMe to accommodate the integration of the IEEE 802.11p
in its structure are divided in two sub sections. First, the changes that must be performed to the
network architecture to integrate the system itself are explained. Then, the changes to the data and
control planes to support the handover mechanism are also presented.
3.3.1 Changes to the Network Architecture
After selecting the hardware and software required for this project, it is now possible to verify
to which degree the requirements presented in Section 1.4 were respected. Of the requirements

32 Integration of the IEEE 802.11p module
Figure 3.6: SITMe Network Architecture V2
presented, the first one (OS version) is the most important one that was not possible to be met. Un-
fortunately, as stated in Section 3.2.1, there is a clear incompatibility between the IEEE 802.11p
drivers and the Operating System currently being used in SITMe. Because of this a different Oper-
ating System had to be chosen. Having a different Operating System will also make the integration
of the IEEE 802.11p module in SITMe more complicated. A simple integration of the module to
each bus RBridge as an additional interface will not be possible. Instead, an additional RBridge
will have to be added to each bus to implement the support for IEEE 802.11p. This additional
RBridge will be connected using Ethernet to the original RBridge in each bus. It will be running
OpenWrt and will have the IEEE 802.11p interface. Additionally, each RSU will also be an ad-
ditional RBridge. These RBridges will be connected to the hotspots from Porto Digital. Porto
Digital network is interconnected using fiber, but it provides converters to Ethernet with POE in
the hotspots. Figure 3.6 shows the revised network architecture for SITMe with the IEEE 802.11p
interfaces and figure 3.7 shows the two RBridges in the bus with higher detail.
Figure 3.7: Bus Network Infrastructure
3.3 Changes to SITMe 33
It is important to note that the RSU RBridges will have a Ethernet and may have also a Wire-
less link. This is because in the implementation all the IEEE 802.11p interfaces will be working in
the same frequency and also because was decided to make the connection ranges of these RSUs to
overlap near the maximum coverage range. This is necessary to implement a horizontal handover
mechanism. If there is connectivity loss between the RSUs, then the vertical handover imple-
mented in SITMe will start and an access technology change will be performed. Once the OBU
would get to the range of the second RSU then an additional vertical handover would start, making
yet again another access technology change. The aim of this work is to keep the IEEE 802.11p
technology in use for the longest possible intervals to test if seamless horizontal handovers are
achievable in this technology. In terms of network architecture these are all the required alter-
ations to SITMe.
3.3.2 Changes to the Data and Control Planes
As stated before, the objective is to implement a seamless handover mechanism for IEEE 802.11p.
In the Section 2.3, it was studied some proposed handover mechanisms and it was decided that
using the WMRP would be a good way to achieve this objective. In Section 2.1.1 the WiMetroNet
architecture was presented. As stated there, SITMe is based in this architecture but is currently
working for a different scenario, so, it was necessary to implement some modifications to the
Data and Control Planes. Remembering the alterations performed to WiMetroNet to adapt it to the
SITMe scenario, they were performed with the goal to implement public link capabilities. Because
the links between the OBUs and RSUs will be private, it is possible to conclude that the alterations
aimed to be performed to implement the IEEE 802.11p module with handover capabilities, can be
either done to SITMe or to WiMetroNet. This is true because both solutions share a common code
for the private links.
In Sections 2.1.1.1 and 2.1.1.2 the Data and Control Planes of WiMetroNet were studied. The
data plane requires no changes. The way the Rbridges encapsulates and decapsulates packets do
not need modifications and should remain unaltered. The Control Plane, on the other hand, defines
the way the RBridges trade messages to calculate the routing table. It is this architectural element
that will be the focus to implement the necessary changes.
The control plane previously defined has a series of messages that are exchanged between
RBridges. These messages are used to build a routing table composed of several entries. Each
node has in its routing table the complete list of RBridge nodes and all the neighbors associated
to each RBridge plus the link weight between each RBridge and its neighbors. Until now, the link
weight fields were assumed as being always 1. This means that in fact the link weight was only
the hop count between RBridges. Having hop count as the defining factor of how the traffic is
routed is not enough to perform the handover operation required for the IEEE 802.11p module.
The link weight field should either be calculated based on the RSSI of the wireless links or the
distance between RSUs and OBUs. At a first stage, the plan was to use the distance between RSUs

34 Integration of the IEEE 802.11p module
and OBUs because it was not possible to obtain RSSI values from the IEEE 802.11p cards nor the
driver used. Fortunately, aircrack-ng allowed obtaining these values and it was further decided
that, indeed, the RSSI value should be the main factor of decision to calculate the routing table.
Seeing as WMRP already had the link weight field, the main task would be to develop a method
to feed WMRP periodically with values of RSSI.
To feed WMRP with the RSSI values a series of bash scripts were used. These scripts would
use capabilities from both tcpdump and aircrack-ng, along with some UNIX operations to search
through logs. The first step towards this was to enable the monitor mode of the IEEE 802.11p
interface and start tcpdump to capture all the packets in that interface. Next, the output of that
capture is "piped" to a log file. This log file can be rotated to not let its size increase too much.
To analyze the data captured a script that performs UNIX file operations on the log file was used.
The script looks like this:
While[1];
do{
tail -n 1 “AABBCCDDEEFF.log” | cut -d 1-3 | tee AABBCCDDEEFF
sleep 1
}
Each RSU and OBU will be running this script. Tail command with the –n flag selects the last
number of lines needed. The first tail is aimed at looking only at the last few lines of the log. This
is done to avoid reading the entire tcpdump log every time this script ran. If not, than high delays
would be introduced once the log reached a larger size. Egrep command looks for a particular
string in the lines selected. In this case, it needs to look for a MAC address next to a SA identifier
(SA stands for Source Address). The next tail and cut operations are meant to, first, grab only
the last line received with the specified MAC address and, then, to cut from the message only the
RSSI value. This value is then saved to a log file with the same name as the MAC SA. This file
will have only one line with the RSSI value and will be read periodically by WMRP so that the
weight field can be assessed correctly and disseminated to all RBridges. WMRP will choose the
next hop based on the path with lowest RSSI. With these values being calculated every second,
WMRP will be able to populate its routing tables correctly and the handover will occur naturally.
This happens because, now, the path with lowest RSSI will be always the chosen path.

Chapter 4
Evaluation of the Solution
Chapter 3 presented the necessary steps to integrate IEEE 802.11p into SITMe. Now it is important
to validate those decisions. This will be done by establishing a Mobile Testbed that will be used
to test the performance of IEEE 802.11p and compare it with the performance of IEEE 802.11n.
The comparison between these two technologies is of especial importance because IEEE 802.11n
is the WI-FI technology currently running on SITMe. This means that a first step to evaluate
IEEE 802.11p could be verifying that it outperforms IEEE 802.11n in a vehicular mobile scenario.
Furthermore, the results obtained in this testbed will be also compared to some results found in the
literature, when possible. The results obtained from this Mobile Testbed will be used to validate the
solution presented in Chapter 3 as well as the changes to the SITMe network architecture. Finally,
to validate the chosen handover scheme, an additional Handover Testbed will be introduced with
the objective of performing its practical validation. A theoretical validation is also presented
complementing the validation of some aspects, related to the control plane, that are more difficult
to trace in the real scenario of the Handover testbed.
It is important to note that, although the Mobile Testbed and the Handover Testbed serve the
same purpose of validating the solution presented in this dissertation, they were built with different
objectives. The first focus aspects related to the bare use and comparison of the IEEE 802.11n and
IEEE 802.11p network tecnologies, without introducing the intelligent routing component. The
second testbed is more complex, introducing the new version of the SITMe data and control plane,
and reflects the expected operation of the IEEE 802.11p in the SITMe scenario.
4.1 Mobile Testbeds
A Mobile Testbed is a platform that allows technological tests to be performed outside in a real
environment scenario. This means that a higher degree of control over the tests is possible which,
for a first stage of validation, is very important. The validation work using the developed Mobile
Testbed includes presenting:
1. The location where the tests will be performed and the location of the network elements;
35

36 Evaluation of the Solution
2. Which tests will be performed;
3. The results obtained;
4. A critical analysis to the results obtained.
It is also important to note that two Mobile Testbeds were actually developed. Although they
serve the same purpose of comparing the two different technologies, the second Mobile Testbed is
more complete, making the comparison more thoroughly and overcoming some physical limitation
found in the test site of the first testbed. Appendix D contains photographies of the location of
these two Mobile Testbeds as well as how the RSU and the OBU were mounted.
4.1.1 First Mobile Testbed
In a first stage a Mobile Testbed was defined. It would be located inside the FEUP Campus. The
FEUP’s student’s car park provides a straight stretch of road of nearly 200m. Adding to this, the
park could be used in the weekend which would provide a nearly empty park. Performing the
tests in a weekend would also decrease the interference, especially for the IEEE 802.11n. This is
because the FEUP Campus is covered with the EDUROAM network that works in the 2.4GHz fre-
quency. In work days, the number of students accessing this network causes congestion and would
increase the effects of interference on the tests. Although this location proved beforehand not to be
good enough for the required tests, it was a good starting point and a accessible location to prepare
the test equipments and obtain the first values. The main identified limitation was the short length
of the road. Before performing these tests, the real connection ranges of both the IEEE 802.11p
and the IEEE 802.11n where not known for sure, but were expected to be superior to 200m. This
is especially the case of IEEE 802.11p which revealed to have a greater coverage than the park
length. This short park length also caused another limitation for the tests. This second limitation is
related to the fact that in literature the tests found were performed with stable vehicular speed. The
short length of the site meant that, to achieve the desired speeds, an acceleration phase would be
required within the coverage range. Finally, on the day these tests were performed it was raining
heavily. This fact is expected to have caused an impact on the tests results. Figure 4.1 shows a
satellite view of FEUP’s student’s car park with the location of the RSU and the trajectory of the
OBU.
After deciding the first location for the tests and expected limitations, it was time to decide how
to perform the network tests. This meant deciding the location of the RSU, as well as the OBU
vehicle trajectory. For the RSU, a central location was selected appearing to be the best choice.
Having it centered and knowing that omnidirectional antennas will be used meant that a complete
coverage along the road was expected. For the OBU, was decided that it should always start from
one of the edges of the park and move to the other edge, passing near the RSU. Three runs for
the speeds of 20, 30 and 40 km/h were done using each technology. These speeds were chosen
because they are closer to the BUS speeds in an urban environment, which is the environment in
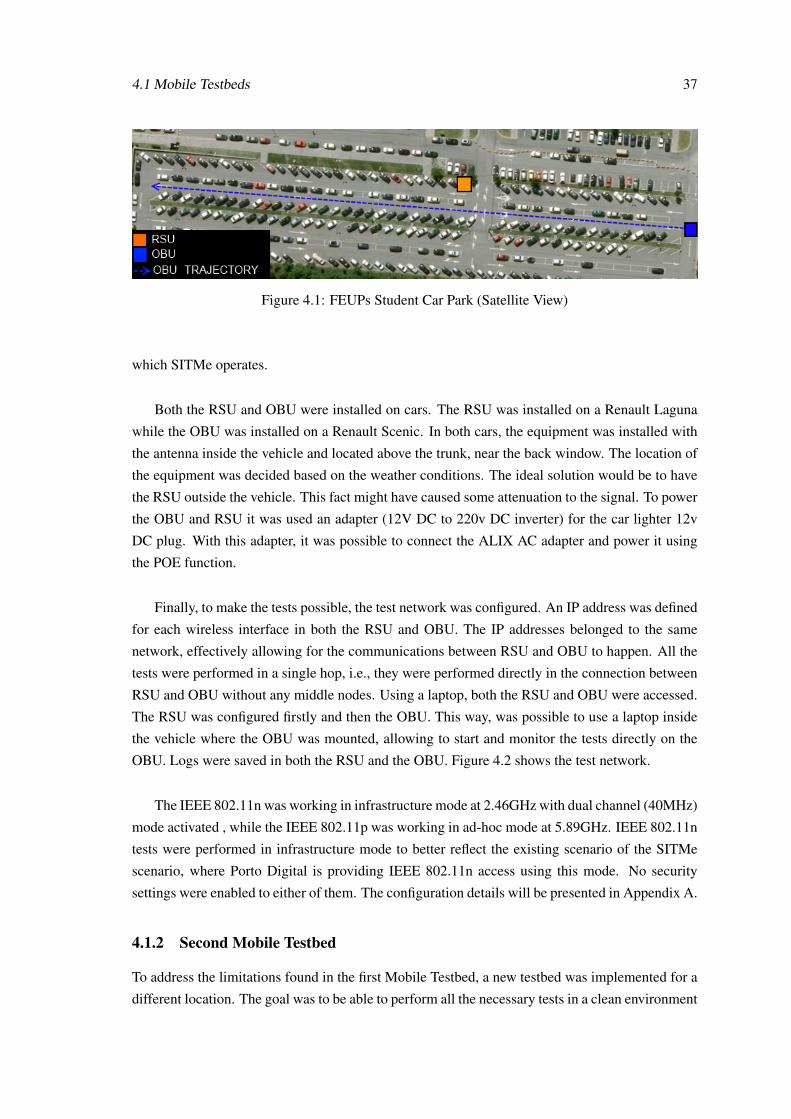
4.1 Mobile Testbeds 37
Figure 4.1: FEUPs Student Car Park (Satellite View)
which SITMe operates.
Both the RSU and OBU were installed on cars. The RSU was installed on a Renault Laguna
while the OBU was installed on a Renault Scenic. In both cars, the equipment was installed with
the antenna inside the vehicle and located above the trunk, near the back window. The location of
the equipment was decided based on the weather conditions. The ideal solution would be to have
the RSU outside the vehicle. This fact might have caused some attenuation to the signal. To power
the OBU and RSU it was used an adapter (12V DC to 220v DC inverter) for the car lighter 12v
DC plug. With this adapter, it was possible to connect the ALIX AC adapter and power it using
the POE function.
Finally, to make the tests possible, the test network was configured. An IP address was defined
for each wireless interface in both the RSU and OBU. The IP addresses belonged to the same
network, effectively allowing for the communications between RSU and OBU to happen. All the
tests were performed in a single hop, i.e., they were performed directly in the connection between
RSU and OBU without any middle nodes. Using a laptop, both the RSU and OBU were accessed.
The RSU was configured firstly and then the OBU. This way, was possible to use a laptop inside
the vehicle where the OBU was mounted, allowing to start and monitor the tests directly on the
OBU. Logs were saved in both the RSU and the OBU. Figure 4.2 shows the test network.
The IEEE 802.11n was working in infrastructure mode at 2.46GHz with dual channel (40MHz)
mode activated , while the IEEE 802.11p was working in ad-hoc mode at 5.89GHz. IEEE 802.11n
tests were performed in infrastructure mode to better reflect the existing scenario of the SITMe
scenario, where Porto Digital is providing IEEE 802.11n access using this mode. No security
settings were enabled to either of them. The configuration details will be presented in Appendix A.
4.1.2 Second Mobile Testbed
To address the limitations found in the first Mobile Testbed, a new testbed was implemented for a
different location. The goal was to be able to perform all the necessary tests in a clean environment

38 Evaluation of the Solution
Figure 4.2: Test Network for the First Mobile Testbed
to better compare the technologies, while maintaining a vehicular scenario close to the SITMe
reality. Building a scenario like that meant that this Mobile Testbed had to be located in an open
stretch of road with car traffic. To address the length limitation found in FEUP’s student’s car
park, a stretch of road of around 1 to 2Km was searched. The ideal road was found in Ovar, more
specifically, a stretch of the “Estrada Nacional 327”. This road has several stretches of nearly 1Km
of straight road. After visual inspection of the road condition and general layout, a good spot to
mount the RSU was found. The RSU was mounted on a very small curve followed and preceded
by large straight stretches of road. This way it was possible to guarantee that there would be a
direct line of sight to the RSU before and after the small curve. Figure 4.3 shows the “EN 327”,
the location of the RSU, the starting location of the OBU and the path followed by the OBU.
Figure 4.3: EN 327, location of RSU, OBU and OBU PATH
This Mobile Testbed was long enough to perform all the required tests in a constant speed, i.e.,
no acceleration phase was required within the technologies’ coverage range areas. Furthermore,
it was also long enough to test the maximum coverage range of both the IEEE 802.11n and IEEE
802.11p. The tests were performed in a Saturday noon.
The test network and other generic configurations were the same as in the first Mobile Testbed.

4.1 Mobile Testbeds 39
The main difference was that in the tests performed here, tcpdump was used to capture the data
being transferred between OBU and RSU. Wavemon was also used to log the link quality metrics
for IEEE 802.11n, such as signal level, noise level and signal-to-noise ratio. Seeing as the weather
conditions were more favorable (open sun) the RSU was placed outside of the car, on top of a
concrete wall with around 1m of height (Figure D.3). The OBU was kept inside the moving car to
mimic the disposition found in SITMe, i.e., an OBU inside a bus and a RSU next to the road.
4.1.3 Tests and Metrics
With the Mobile Testbeds presented in Section 4.1.1 and Section 4.1.2, it is now necessary to
introduce the different type of tests performed in each Mobile Testbed, as well as the different
configurations associated to those tests. The main purpose of these two Mobile Testbeds was to
test both technologies (802.11n and 802.11p) in terms of basic connectivity, goodput, connectivity
range, maximum connectivity range, contact time, frame loss ratio, total data transferred. Ad-
ditionally the association time was also calculated. Seeing as the IEEE 802.11p does not have
association mechanisms, it was necessary to perform some changes to what is referred by associa-
tion time. This is because similar metrics are needed to compare IEEE 802.11p and IEEE 802.11n.
Next, an overview for each test performed are presented, as well as the procedure to execute each
one.
• Basic Connectivity is the capability of the RSU and OBU to communicate with one another.
This test was performed by doing a simple ping (ICMP ECHO) between the RSU and OBU.
Success in performing a ping means there is connectivity.
• Goodput (Mbit/s) is the number of successful information bits that reach the destination.
This is immediately calculated by Iperf as it only counts the application data itself and not
the headers. This test was performed by doing a number of runs (3 runs for the first Mobile
Testbed and 2 runs for the second) at different speeds while using Iperf to inject UDP traffic
on the network.
• Connectivity Range (meters) is the distance between OBU and RSU at which the connec-
tivity is still up. This was tested by analyzing Global Position Satellite (GPS) data logs
after each run and crossing the time stamps with the time stamps present in the logs of tcp-
dump. Crossing these time stamps gives the exact location of the moving vehicle when the
connectivity started and when it ended. The sum of these distances gives the connectivity
range.
• Maximum Connectivity Range (meters) was determined in a similar way as the basic
connectivity. A ping sequence was started inside the connectivity range and the moving
vehicle slowly moved away from the RSU. Once the connectivity ends (as in the pings stop)
then the maximum connectivity range was found. This is quite useful because it allows
calculating the “association” time for each technology.

40 Evaluation of the Solution
• Contact Time (seconds) is the time between the first and last frame received by the RSU. It
gives the exact amount of time with connectivity.
• Frame Loss Ratio (%) or FLR is the ratio between total number of sent frames and the
total number of lost frames. It is tested alongside the goodput. Its value shows how prone
to frame loss the technology is.
• Data Transferred (Mbyte) is the absolute amount of data transferred between OBU and
RSU. It can be easily determined by adding the goodput values. Its main purpose is to pro-
duce a plot which clearly shows the increase and decrease of goodput by simply inspecting
the slope.
• Association Time was defined as being the elapsed time between the moment a moving
vehicle (OBU) enters the coverage range, passing border determined as maximum connec-
tivity range, and the time in which the communication with the RSU is actually started. The
vehicle speed value from our GPS logs is used to easily determine the association time by
using Equation 1:
AssociationTime =(Rangemaxconnectivity −DistanceStartConnection)
Speed(meters/s)(4.1)
All the tests were performed using Iperf to inject traffic on the network. Therefore, Iperf was
used in server mode in the RSU, and in client mode at the OBU. This was because all the tests
would be initiated by the OBU. The amount of traffic injected on the network was decided to be
the theoretical value achievable by IEEE 802.11n and IEEE 802.11p. That is, around 300 Mbit/s
for IEEE 802.1n and 27 Mbit/s for IEEE 802.11p. In addition to Iperf, tcpdump was used to
capture all the frames sent and received. This allowed to correctly comparing how many frames
were sent and received and, therefore, the frame loss ratio. Wavemon was also used, as stated in
Section 4.1.2, to log link quality metrics. The modulation parameter of IEEE 802.11n and IEEE
802.11p was set to automatic. Finally, a GPS was used to log the position and speed of the vehicle
with the OBU. A time stamp was also added to this GPS log, which allowed correlating the GPS
data with the data obtained from tcpdump. Table 4.1 shows the full list of tests performed and
which of them were performed in each Mobile Testbed.
4.1.4 Results
With the Mobile Testbeds presented, as well as the tests to be performed, it is now time to present
the results obtained by analyzing the data gathered from each testbed. Because there are two
different testbeds, the results will be presented for each testbed separately. Firstly, the results ob-
tained from the first Mobile Testbed will be presented, both for IEEE 802.11p and IEEE 802.11n.
After that, the results obtained from the second Mobile Testbed will, also, be presented. As the
results are being presented, a critical analysis to them will be performed.

4.1 Mobile Testbeds 41
Test First Mobile Testbed Second Mobile TestbedBasic Connectivity V VConnectivity Range F VMax Connectivity Range F VContact Time F V“Association” Time F VFrame Loss Ratio V VGoodput V VTotal Data Transferred V V
Table 4.1: Tests performed in each Mobile Testbed
4.1.4.1 Results for the First Mobile Testbed
As detailed in Section 4.1.3, tests were performed to determine the basic connectivity, goodput,
frame loss ratio and total data transferred in the first Mobile Testbed. Three runs at three different
speeds (20, 30 and 40 km/h) were performed. The results for goodput, frame loss ratio and total
data transferred are presented in function of the overall distance between the RSU and the OBU.
These distances were calculated using the GPS data using the following equation:
Distancep1−p2 = arccos((A∗B)+(C ∗D)∗E ∗F)+1000, (4.2a)
A = cos(90−Latp2), B = cos(90−Latp1), (4.2b)
C = sin(90−Latp2), D = sin(90−Latp1), (4.2c)
E = sin(Longp2 −Longp1), F = Earthrad = 6371Km. (4.2d)
Although all the values of latitude and longitude should be inputted as degrees, a conversion to
radians is needed before performing the trigonometric functions. Since the comparison between
IEEE 802.11n and IEEE 802.11p is the most important element to be analyzed, the results of each
test are presented aggregated by speed and, for each speed, the results of both technologies are
presented successively. A critical analysis is performed for each result.
Figures 4.4 and 4.5 show the overall goodput for the IEEE 802.11n and IEEE 802.11p, re-
spectively (with the car at 20 km/h), in function of the distance between the RSU and the OBU.
Negative distances represent the distance between the OBU and the RSU from the starting point
until they cross each other. This is merely to help plotting the results’ graphs.
It is possible to observe that for the IEEE 802.11n the goodput is very prone to fluctuations.
There is a clear increase until the OBU gets very close to the RSU. All the runs seem to show a
decrease of goodput after the point of intersection . This can be explained by the direction the car
with the RSU was facing. Remembering that in this first Mobile Testbed the RSU was mounted
inside a car it can be concluded that the car windows and car body may have caused signal at-

42 Evaluation of the Solution
Figure 4.4: MT1 Goodput for 20 km/h (802.11n)
Figure 4.5: MT1 Goodput for 20 km/h (802.11p)
tenuation. In terms of stability of goodput, although the third run is the one where the maximum
goodput achieved was the lowest, it was also the one where it was more stable, performing al-
most constantly above 30 Mbit/s and being only below 20 Mbit/s at the start and at the end of
the test run. For the IEEE 802.11p the goodput also fluctuates, although not as unstable as for
IEEE 802.11n. The maximum goodput achievable is also much smaller, being around 9 Mbit/s at
maximum. It also seems that the IEEE 802.11p is not as unstable in terms of goodput, although
it is possible to note that there’s an increase on goodput bursts after the OBU passed by the RSU
these fluctuations are still not as big as the ones from IEE 802.11n. In fact only the second run
produced a burst decrease of goodput.
Figures 4.6 and 4.7 shows the overall goodput for both technologies at a car speed of 30 km/h
in function of the distance between the RSU and the OBU.

4.1 Mobile Testbeds 43
Figure 4.6: MT1 Goodput for 30 km/h (802.11n)
Figure 4.7: MT1 Goodput for 30 km/h (802.11p)
For 30 km/h the results does not seem to have changed significantly. The goodput is still unsta-
ble, and for IEEE 802.11n the maximum goodput achievable seems to have decreased. For IEEE
802.11p there is a big decrease in goodput at around 40m for all the runs, which was most likely
caused by the absence of direct line of sight between RSU and OBU at that particular distance.
Although line of sight between the RSU and the OBU is a important factor for IEEE 802.11p
communications its overall effect should be smaller than for IEEE 802.11n (behaves better against
multipath effect) [10].
Finally, figures 4.8 and 4.9 shows the overall goodput for both technologies at a car speed of
40 km/h in function of the distance between the RSU and the OBU.
The same as before, the goodput for both technologies seems to have clear bursts. The maxi-
mum goodput for IEEE 802.11n seems to have increased a bit from the measures at 30km/h, again,
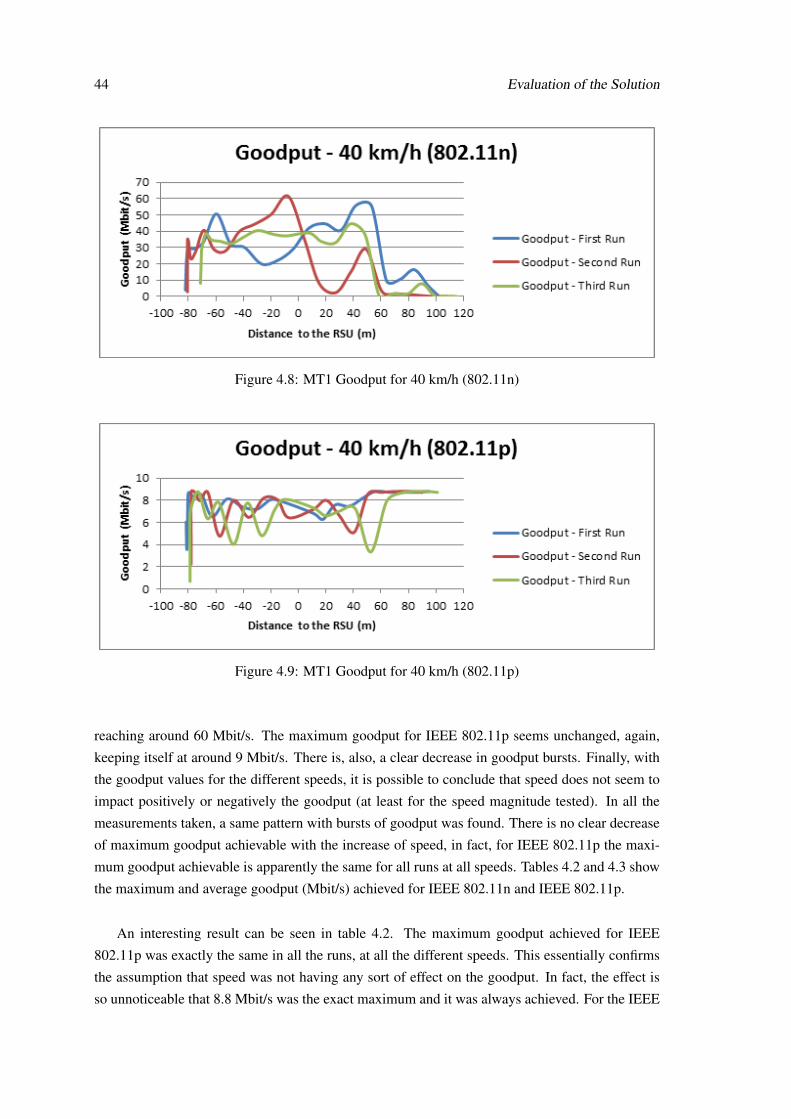
44 Evaluation of the Solution
Figure 4.8: MT1 Goodput for 40 km/h (802.11n)
Figure 4.9: MT1 Goodput for 40 km/h (802.11p)
reaching around 60 Mbit/s. The maximum goodput for IEEE 802.11p seems unchanged, again,
keeping itself at around 9 Mbit/s. There is, also, a clear decrease in goodput bursts. Finally, with
the goodput values for the different speeds, it is possible to conclude that speed does not seem to
impact positively or negatively the goodput (at least for the speed magnitude tested). In all the
measurements taken, a same pattern with bursts of goodput was found. There is no clear decrease
of maximum goodput achievable with the increase of speed, in fact, for IEEE 802.11p the maxi-
mum goodput achievable is apparently the same for all runs at all speeds. Tables 4.2 and 4.3 show
the maximum and average goodput (Mbit/s) achieved for IEEE 802.11n and IEEE 802.11p.
An interesting result can be seen in table 4.2. The maximum goodput achieved for IEEE
802.11p was exactly the same in all the runs, at all the different speeds. This essentially confirms
the assumption that speed was not having any sort of effect on the goodput. In fact, the effect is
so unnoticeable that 8.8 Mbit/s was the exact maximum and it was always achieved. For the IEEE

4.1 Mobile Testbeds 45
802.11n 802.11pSpeed (km/h) 1st Run 2nd Run 3rd Run 1st Run 2nd Run 3rd Run
20 76.64 72.24 42.32 8.8 8.8 8.830 44.8 41.12 55.92 8.8 8.8 8.840 55.76 61.44 44.64 8.8 8.8 8.8
Table 4.2: MT1 Maximum Goodput Achieved (Mbit/s) for IEEE 802.11n and IEEE 802.11p
802.11n 802.11pSpeed (km/h) 1st Run 2nd Run 3rd Run 1st Run 2nd Run 3rd Run
20 34.36 29.04 26.06 7.01 7.05 7.6830 26.37 28.17 22.12 7.11 7.32 7.1240 28.08 21.77 22.43 7.68 7.16 6.70
Table 4.3: MT1 Average Goodput Achieved (Mbit/s) for IEEE 802.11n and IEEE 802.11p
802.11n, the maximum goodput achieved is not so constant. The maximum achieved was 76.64
Mbit/s at the first run at 20 km/h. For 30 km/h the results are, in average, the worst, yet, they
increase again for 40 km/h. As for table 4.3 it shows that the average goodput is more constant for
all speeds in IEEE 802.11p.
Figures 4.10 and 4.11 shows the frame loss ratio for each technology with the car moving at
20 km/h in function of the overall distances between the RSU and the OBU.
Figure 4.10: MT1 Frame Loss Ratio for 20 km/h (802.11n)
In terms of frame loss ratio, it is clearly seen that the IEEE 802.11p is much more stable than
IEEE 802.11n. The maximum frame loss ratio obtained by IEEE 802.11p is 1% near the end of
the test, while for IEEE 802.11n the frame loss ratio goes above that value several times along
each run, reaching a maximum of 30% in the first run. The third run for IEEE 802.11n is quite
different though. Remembering that the goodput for the third run at 20 km/h was a lot more stable
than for the other two runs, it is also possible to observe that the frame loss ratio is much more

46 Evaluation of the Solution
Figure 4.11: MT1 Frame Loss Ratio for 20 km/h (802.11p)
stable. In fact, there is only a burst of lost frames at the start of the run. After that it keeps itself
above 5% for the rest of the run.
Figures 4.12 and 4.13 shows the frame loss ratio for each technology with the car moving at
30 km/h in function of the overall distances between the RSU and the OBU.
Figure 4.12: MT1 Frame Loss Ratio for 30 km/h (802.11n)
At 30 km/h the frame loss ratio seems to be keeping a similar pattern as before. For IEEE
802.11n the overall frame loss ratio seems more stable, only crossing the 10% threshold twice in
two distinct runs. The maximum frame loss ratio obtained was of around 25%. The big burst of
frames lost also seems to happen at around the same distance to the RSU as the burst found at 20
km/h. For IEEE 802.11p, the results are still very stable, although the maximum frame loss ratio
seems to have increased, now crossing the 1% threshold twice in two distinct runs. The distance at
which the second burst happens, seems to have changed too. It did not happen at 100m as before

4.1 Mobile Testbeds 47
Figure 4.13: MT1 Frame Loss Ratio for 30 km/h (802.11p)
but instead happened at around 40m, the exact same distance at which the biggest burst in frame
loss happened for IEEE 802.11n.
Finally for the frame loss ratio, figures 4.14 and 4.15 shows the frame loss ratio for a car at 40
km/h in function of the distance between the RSU and the OBU.
Figure 4.14: MT1 Frame Loss Ratio for 40 km/h (802.11n)
Surprisingly, the results obtained for the frame loss ratio at 40 km/h for IEEE 802.11p were
actually the best of all. There is only one instance of the frame loss ratio reaching 10% of packet
loss right at the start of the run. After that, and for the duration of the entire run, the frame loss
ratio kept itself above the 1% frame loss ratio threshold. For IEEE 802.11n there are two peaks at
the start and end of the runs that happened in the first run. These peaks do not appear in any other
measure except for a single run at 20 km/h, and even in this run, it was only present at the start
point. Seeing as in no other instance such a large burst of frame loss ratio at the end of the run

48 Evaluation of the Solution
Figure 4.15: MT1 Frame Loss Ratio for 40 km/h (802.11p)
have occurs, some problem might happened here that did not happen in any other instance. Again,
speed does not seem to affect the results strongly enough. Table 4.4 shows a full comparison of
the average frame loss ratio for each speed for IEEE 802.11n and IEEE 802.11p.
802.11n 802.11pSpeed (km/h) 1st Run 2nd Run 3rd Run 1st Run 2nd Run 3rd Run
20 0.0606 0.0592 0.0157 0.000343 0.00032 0.00022330 0.0201 0.0131 0.0285 0.000322 0.000519 0.0006740 0.0712 0.0276 0.0212 0.000136 0.005186 0.004745
Table 4.4: MT1 Average Frame Loss Ratio for IEEE 802.11n and IEEE 802.11.p
In terms of averages, speed also doesn’t seem to have that much of an impact. Although, the
best average results for IEEE 802.11n were found to be at the runs performed at 30 km/h. Runs
were also found, in the different speeds, that are similar to the ones found at 30 km/h. The average
frame loss ratio also seems not to reach 8% in any of the runs. As for IEEE 802.11p there is a
clear increase in frame loss ratio in the last two runs at 40 km/h. Yet, all the other runs have a very
small average of frame loss ratio. In fact, it does not even reach 0.1%, and even in the worst case
scenario, the highest obtained value was of nearly 0.5%. These are small values that in a standard
usage would have minimal impact on the performance of communications. This same conclusion
cannot also be used for IEEE 802.11n. There are far superior peaks of frame loss ratio, and also
averages of 6-7%. These values of frame losses would actually start creating a noticeable impact
in the communications. Especially if using TCP, retransmissions due to lost frames would cause
delays that might not be acceptable for real time applications.
Finally, the results obtained in terms of data transferred are, now, analyzed. Figures 4.16
and 4.17 show the data transferred at 20 km/h in function of the distances between the RSU and
the OBU.

4.1 Mobile Testbeds 49
Figure 4.16: MT1 Data Transferred for 20 km/h (802.11n)
Figure 4.17: MT1 Data Transferred for 20 km/h (802.11p)
It is easily concluded by simple inspection that IEEE 802.11p possesses a much more stable
goodput. This is verified through the slope of the plot curves. The slope is almost constant for all
the runs of IEEE 802.11p, only having slight variations near the end of the test. IEEE 802.11n, in
the other hand, has a much more unstable slope (and therefore unstable goodput). This result was
already observed in the goodput analysis. The increase of goodput also happens at a much higher
rate than for IEEE 802.11p. For example, in the first run for IEEE 802.11n, a clear increase in
the slope from around -80m to -10m can be noticed. A much more obvious result is that the total
amount of data transferred is much lower for IEEE 802.11p. This is absolutely expected after see-
ing the obtained results of goodput. Another result observable here is that there is a clear decrease
of goodput for IEEE 802.11n near the end of the test. As for IEEE 802.11p, the goodput seems to

50 Evaluation of the Solution
be constant throughout the entire test.
Figures 4.18 and 4.19 shows the data transferred at 30 km/h in function of the distances be-
tween the RSU and the OBU.
Figure 4.18: MT1 Data Transferred for 30 km/h (802.11n)
Figure 4.19: MT1 Data Transferred for 30 km/h (802.11p)
Comparing the results for 30 km/h with the results obtained for 20 km/h it can be easily con-
cluded that they are very similar. The increase of goodput for IEEE 802.11p is, now, not so stable,
which can be verified by the changes in the slope. The total data transferred is obviously smaller
since the car speed increased. Again, the sudden decline in goodput for IEEE 802.11n at the end
of the run can also be verified. This is starting to indicate that, indeed, it seems that the maximum
range of the IEEE 802.11n was being reached around those distances. It is not possible to confirm
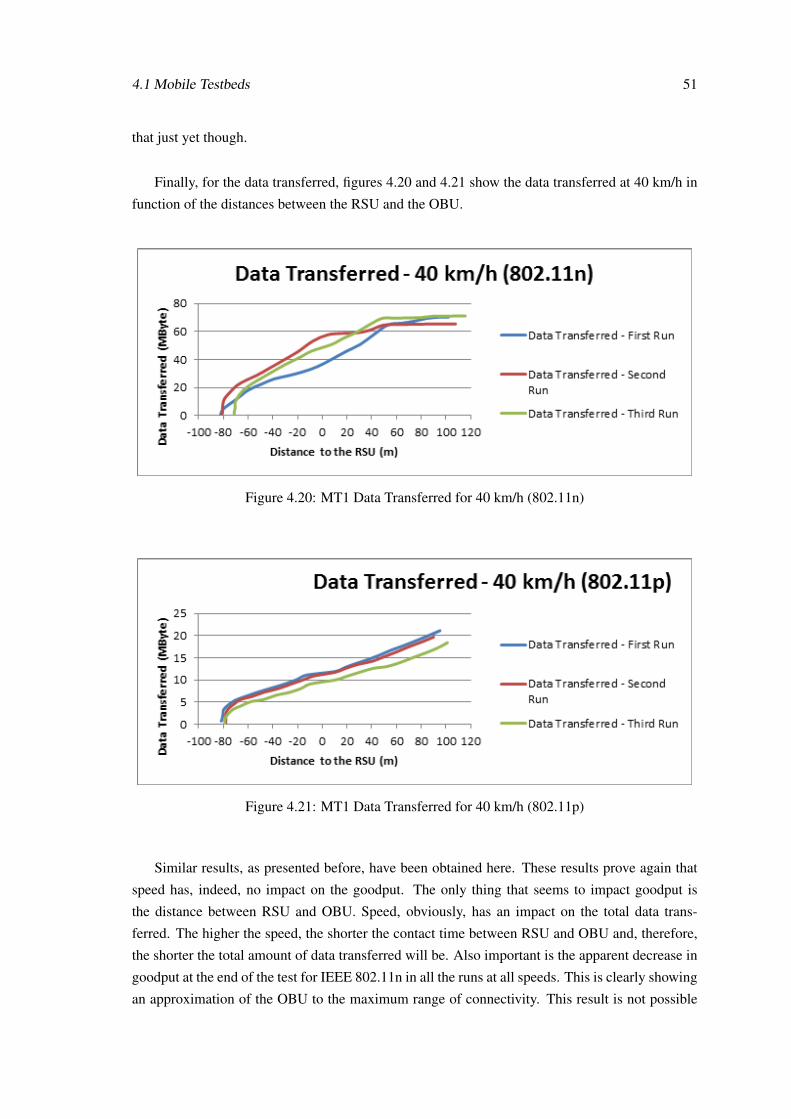
4.1 Mobile Testbeds 51
that just yet though.
Finally, for the data transferred, figures 4.20 and 4.21 show the data transferred at 40 km/h in
function of the distances between the RSU and the OBU.
Figure 4.20: MT1 Data Transferred for 40 km/h (802.11n)
Figure 4.21: MT1 Data Transferred for 40 km/h (802.11p)
Similar results, as presented before, have been obtained here. These results prove again that
speed has, indeed, no impact on the goodput. The only thing that seems to impact goodput is
the distance between RSU and OBU. Speed, obviously, has an impact on the total data trans-
ferred. The higher the speed, the shorter the contact time between RSU and OBU and, therefore,
the shorter the total amount of data transferred will be. Also important is the apparent decrease in
goodput at the end of the test for IEEE 802.11n in all the runs at all speeds. This is clearly showing
an approximation of the OBU to the maximum range of connectivity. This result is not possible
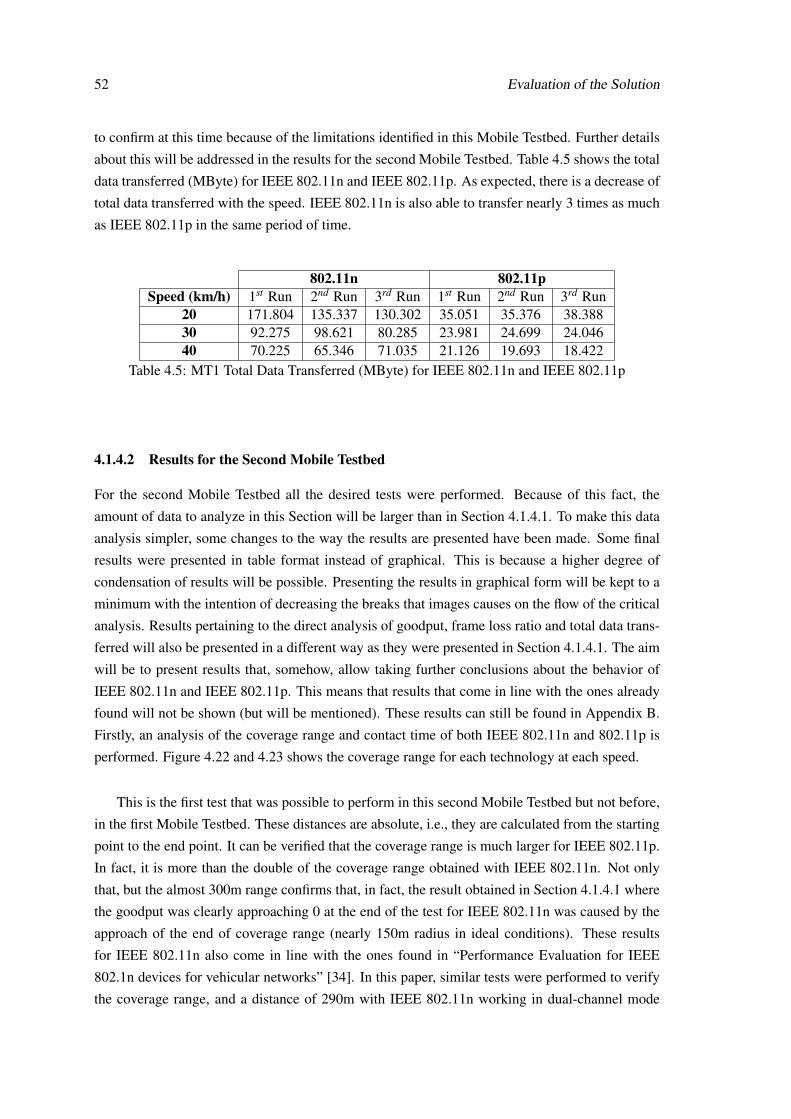
52 Evaluation of the Solution
to confirm at this time because of the limitations identified in this Mobile Testbed. Further details
about this will be addressed in the results for the second Mobile Testbed. Table 4.5 shows the total
data transferred (MByte) for IEEE 802.11n and IEEE 802.11p. As expected, there is a decrease of
total data transferred with the speed. IEEE 802.11n is also able to transfer nearly 3 times as much
as IEEE 802.11p in the same period of time.
802.11n 802.11pSpeed (km/h) 1st Run 2nd Run 3rd Run 1st Run 2nd Run 3rd Run
20 171.804 135.337 130.302 35.051 35.376 38.38830 92.275 98.621 80.285 23.981 24.699 24.04640 70.225 65.346 71.035 21.126 19.693 18.422
Table 4.5: MT1 Total Data Transferred (MByte) for IEEE 802.11n and IEEE 802.11p
4.1.4.2 Results for the Second Mobile Testbed
For the second Mobile Testbed all the desired tests were performed. Because of this fact, the
amount of data to analyze in this Section will be larger than in Section 4.1.4.1. To make this data
analysis simpler, some changes to the way the results are presented have been made. Some final
results were presented in table format instead of graphical. This is because a higher degree of
condensation of results will be possible. Presenting the results in graphical form will be kept to a
minimum with the intention of decreasing the breaks that images causes on the flow of the critical
analysis. Results pertaining to the direct analysis of goodput, frame loss ratio and total data trans-
ferred will also be presented in a different way as they were presented in Section 4.1.4.1. The aim
will be to present results that, somehow, allow taking further conclusions about the behavior of
IEEE 802.11n and IEEE 802.11p. This means that results that come in line with the ones already
found will not be shown (but will be mentioned). These results can still be found in Appendix B.
Firstly, an analysis of the coverage range and contact time of both IEEE 802.11n and 802.11p is
performed. Figure 4.22 and 4.23 shows the coverage range for each technology at each speed.
This is the first test that was possible to perform in this second Mobile Testbed but not before,
in the first Mobile Testbed. These distances are absolute, i.e., they are calculated from the starting
point to the end point. It can be verified that the coverage range is much larger for IEEE 802.11p.
In fact, it is more than the double of the coverage range obtained with IEEE 802.11n. Not only
that, but the almost 300m range confirms that, in fact, the result obtained in Section 4.1.4.1 where
the goodput was clearly approaching 0 at the end of the test for IEEE 802.11n was caused by the
approach of the end of coverage range (nearly 150m radius in ideal conditions). These results
for IEEE 802.11n also come in line with the ones found in “Performance Evaluation for IEEE
802.1n devices for vehicular networks” [34]. In this paper, similar tests were performed to verify
the coverage range, and a distance of 290m with IEEE 802.11n working in dual-channel mode

4.1 Mobile Testbeds 53
Figure 4.22: MT2 Coverage Range (802.11n)
Figure 4.23: MT2 Coverage Range (802.11p)
was found. Table 4.6 shows a comparison of contact time (in seconds) between IEEE 802.11n and
IEEE 802.11p.
802.11n 802.11pSpeed (km/h) 1st Run 2nd Run 1st Run 2nd Run
20 53 55 151 17130 39 36 123 10840 25 28 78 75
Table 4.6: MT2 Contact Time (in seconds) for IEEE 802.11n and IEEE 802.11p
As expected, the contact times for IEEE 802.11p are much higher than for IEEE 802.11n.
Also, by looking at the decrease in contact time for IEEE 802.11n, it can be also concluded that
above 60 km/h the contact time will start to be so small that is going to actually impair the amount
of data it is capable to transfer. Also, referring to table 2.3 it can be verified that a much higher
contact times are being achieved now in table 4.6 than the ones achieved in table 2.3. For 20 km/h,

54 Evaluation of the Solution
the results in the literature state a contact time of 38.5 seconds for 400m of coverage range. Here,
contact times of 151 and 171 seconds for almost 1000m of coverage range are being possible.
Next, the results for the association time are presented. Figures 4.24 and 4.25 show the asso-
ciation time for each technology at each speed.
Figure 4.24: MT2 Association Time (802.11n)
Figure 4.25: MT2 Association Time (802.11p)
The results obtained for association time (performed as indicated in Section 4.1.3) are a bit
odd. At a first glance it seems that for 30 km/h the association time is the shorter for both tech-
nologies. Although for example, for IEEE 802.11p there is a result at 20 km/h better than the ones
at 30 km/h. These association times are highly dependent on the results found for the maximum
coverage distance. Although a lot of care was taken when measuring this distance, here is clearly
visible that these values might represent problems. This could be caused by the fact that this Mo-
bile Testbed was located in a real scenario with background vehicle traffic. The best explanation

4.1 Mobile Testbeds 55
for these odd results would be that, somehow, the maximum coverage distance is greater than the
one first determined. And that the tests performed for 30 km/h were actually done in a best case
scenario (for example, no car traffic). The other tests were clearly affected by these vehicle traffic
disturbances which clearly impaired the results. The only way of clearly validating these results
would be with additional runs at the test site. Unfortunately that was not possible in the timeframe
and resources for this project. There should be no reason for a run at 30 km/h perform better
than a run at 20 km/h. An additional note is that overall IEEE 802.11p seems to have a shorter
association time, as expected. Table 4.7 shows the maximum coverage distance determined at the
site of the tests.
Technology Maximum Coverage Distance (m)IEEE 802.11n 200.7IEEE 802.11p 612.9
Table 4.7: MT2 Maximum Coverage Distance by Technology
It is important to remember that these distances were only calculated in the side where the
tests would start. Seeing as all tests would start from the same point there is no need to calculate
this distance in the opposite way, since they only served to calculate the association time.
With this presented results, now the focus will be on results pertaining to goodput, frame loss
ratio and total data transferred. As done in Section 4.1.4.1, the analysis will start with goodput.
Figures 4.26 and 4.27 show the goodput for each technology at 20 km/h in function of the distances
between the RSU and the OBU.
Figure 4.26: MT2 Goodput for 20 km/h (802.11n)
The goodput in these new tests is still very prone to fluctuations. Now, the point where IEEE
802.11n starts reaching substantially high goodputs can be clearly seen. It is also noticeable that
the maximum achieved goodput has increased. It is, now, standing at nearly 80 Mbit/s in both

56 Evaluation of the Solution
Figure 4.27: MT2 Goodput for 20 km/h (802.11p)
runs. Same as the results presented in Section 4.1.4.1, there seems to be a clear decrease in
goodput when the OBU crosses the RSU. As for IEEE, 802.11p, now, it can be clearly seen that
until around -150m the goodput is around 4 Mbit/s with some bursts to 9 Mbit/s, but once it crosses
that threshold, the goodput jumps to a solid 9 Mbit/s. It stays like that almost until 150m where
it starts to decrease due to loss of connectivity. It is also important to note the clear difference of
range for each side, the starting side had 600m whereas the ending side only around 400m. This
difference was caused by the scenario itself. The 400m side had more houses, trees and high grass
that may dampen the signal. The results obtained for 30 and 40 km/h are absolutely similar in
terms of goodput fluctuation. The only differences are that the starting point varies. The behavior
of IEEE 802.11p of stabilizing the goodput after around 150m is still present. These full results
are present in Sppendix B. Tables 4.8 and 4.9 show the maximum amount of goodput and average
goodput (Mbit/s) achievable for each technology at each speed.
802.11n 802.11pSpeed (km/h) 1st Run 2nd Run 1st Run 2nd Run
20 79.410 77.305 9.495 9.47130 77.511 73.495 9.459 9.49540 72.79 65.693 9.471 9.483
Table 4.8: MT2 Maximum Goodput Achieved (Mbit/s) for IEEE 802.11n and IEEE 802.11p
Looking at the results presented in table 4.8 it seems that the maximum achievable goodput is
actually decreasing as speed increased, at least for IEEE 802.11n. The same effect does not seem
to be happening for IEEE 802.11p. An increased amount of runs would be necessary to clearly
prove or disprove if speed is in fact dampening the highest goodput achievable. As for table 4.9,
a clear decrease on the average can be noticed for IEEE 802.11p in comparison with the results
found in Section 4.1.4.1. This decrease is easily explained because of the massive increase in

4.1 Mobile Testbeds 57
802.11n 802.11pSpeed (km/h) 1st Run 2nd Run 1st Run 2nd Run
20 22.839 21.945 5.069 3.76530 18.421 22.797 3.58 4.70640 20.731 22.810 4.154 4.563
Table 4.9: MT2 Average Goodput Achieved (Mbit/s) for IEEE 802.11n and IEEE 802.11p
contact time and contact range and the associated decrease of goodput at higher ranges.
With the goodput results analyzed, now the focus will be on frame loss ratio. Figures 4.28
and 4.29 show the frame loss ratio for both technologies at 20 km/h in function of the distances
between the RSU and the OBU.
Figure 4.28: MT2 Frame Loss Ratio for 20 km/h (802.11n)
The frame loss ratio results are not so different from the ones obtained in the first Mobile
Testbed. If focusing solely on the same distances to the RSU as before, they would be absolutely
similar. Now it can be seen that for IEEE 802.11p, the higher distances to the RSU the higher
the frame loss ratio gets. After crossing -485m the FLR stabilizes, as before, and keeps stabilized
until around 150m after the RSU. Results for higher speeds kept the same structure as the ones
presented here. If these results were compared with the same contact times as presented here,
than, they would be very similar. Same as before, for the goodput results, these results can also be
found in Appendix B. Table 4.10 shows the average frame loss ratio for each technology at each
speed.
In terms of average frame loss, it seems that IEEE 802.11n is actually behaving better, overall.
This high increase of the average for IEEE 802.11p, in opposition to the results found in the first

58 Evaluation of the Solution
Figure 4.29: MT2 Frame Loss Ratio for 20 km/h (802.11p)
802.11n 802.11pSpeed (km/h) 1st Run 2nd Run 1st Run 2nd Run
20 0.066758 0.073483 0.007139 0.02317130 0.071078 0.102366 0.187379 0.11812640 0.069884 0.068863 0.064607 0.123404
Table 4.10: MT2 Average Frame Loss Ratio
Mobile Testbed, is due to the high peaks of frame loss that are observable at the end and start of the
runs. This is most likely due to overall distances to the RSU and interference or signal dampening.
As the OBU shortens the distance to the RSU, its behavior is very superior to that of the IEEE
802.11n.
Now, the focus will be on the results for the total data transferred. Figures 4.30 and 4.31 show
the data transferred for both technologies at 20 km/h in function of the distances between the RSU
and the OBU.
The data transferred plots clearly show us that for short distances IEEE 802.11n provide a
much greater goodput increase ratio. After -80m the goodput increases almost exponentially, sta-
bilizing around -40m to a more linear increase. Even this linear increase, though, is a lot sharper
than the one found in IEEE 802.11p. The main fact that must be taken from these results is that
no longer is IEEE 802.11n transferring more than 5 times the amount of data transferred by IEEE
802.11p. The huge difference in coverage range is making up for the incredibly smaller data rates
of IEEE 802.11p. Again, the results found for higher speeds are no different than these. Speed
seems to have absolutely no effect other than shortening the coverage range and reducing possible
data to transfer. Table 4.11 shows the total data transferred (MByte) for each technology at each
speed.

4.1 Mobile Testbeds 59
Figure 4.30: MT2 Data Transferred for 20 km/h (802.11n)
Figure 4.31: MT2 Data Transferred for 20 km/h (802.11p)
802.11n 802.11pSpeed (km/h) 1st Run 2nd Run 1st Run 2nd Run
20 154.1635 153.6162 96.3144 80.9530 92.1065 105.4393 55.5904 64.12240 67.377 82.68826 41.023 43.394Table 4.11: MT2 Total Data Transferred (MByte)
By analyzing this total data transferred table it can be verified that the rate at which the total
data transferred is decreasing seems to be much faster for IEEE 802.11n. Although, the total
amount is still superior to the amount of traffic transferred using IEEE 802.11p. It can be assumed

60 Evaluation of the Solution
that with the constant increase of the car speed and, therefore, the reduction of contact time, there
is, clearly, a point after which IEEE 802.11p will have a better performance (data transferred) than
IEEE 802.11n
4.1.5 Conclusions
With all the results presented, now, the conclusions can be drawn. As presented, all the factors
needed were testes in the second Mobile Testbed. Although some results were very similar in
both testbeds, some differences did arise. If in the first Mobile Testbed IEEE 802.11n seemed to
have a clear victory over IEEE 802.11p in terms of total data transferred, that completely changed
in the second Mobile Testbed. It was found that not only IEEE 802.11p completely outperforms
IEEE 802.11n in coverage distances, but also this outperformance is so high that it actually lessens
the differences of total data transferred. In fact, it is expected to cause the IEEE 802.11p to also
outperform IEEE 802.11n above a certain higher car speed. In terms of maximum goodput, IEEE
802.11n still outperforms IEEE 802.11p, but high goodputs are not what is required for real time
applications such as VoIP, nor real time applications. What is mostly needed, in fact, is a constant
connection with sufficient goodput to keep an application alive on this technology for greater
distances. This would help increasing the number of network viable alternatives along the bus
line. In terms of total time that the connection stays alive, IEEE 802.11p is again a clear winner.
It can be also concluded that, although speed seems to have no clear effect in our tests other
than shortening the connection range, this needs further testing. That is, speeds of 20, 30 and 40
km/h are not a good enough sample to clearly state this fact. These speeds are closer to the ones
experienced in SITMe though, and from the results obtained from these tests it does not seem that
they will negatively impair the functioning of IEEE 802.11p. It is also important to note that an
extensive comparison with results found in the literature was not possible. This is mainly due to
the fact that IEEE 802.11p is being currently tested mainly in highway scenarios. These scenarios
differ from the one we currently have. From the analysis provided in this Section, it is clearly
concluded that IEEE 802.11p, indeed, has perfect capacity of outperforming IEEE 802.11n in a
live scenario although for a more static scenario (bus stops) IEEE 802.11n would still be preferred
to IEEE 802.11p. The solution we present is therefore validated. Further validation would require
testing IEEE 802.11p for a longer period of time inside a scenario like SITMe .
4.2 Handover in IEEE 802.11p
In Section 4.1, the solution presented in Chapter 3 was tested and validated in terms of technol-
ogy, i.e., it was verified the validity of using IEEE 802.11p instead of IEEE 802.11n in a vehicular
mobility scenario. It is, now, necessary to validate the architecture and, therefore, the changes to
the SITMe architecture that were also presented in Chapter 3. Validating these changes depends
mainly on the validation of the handover scheme decided to be used. To perform this validation,
another testbed was defined with the explicit objective of testing the handover scheme. In this

4.2 Handover in IEEE 802.11p 61
Chapter, this handover testbed will be presented, as well as the results obtained from it. Further-
more, a theoretical validation will also be presented based on the working principles of WMRP.
4.2.1 Handover Testbed
Before defining how this handover testbed will be constituted, it is important to first understand
what specific scenario needs to be tested. There are two different scenarios that must be considered
before advancing with the development of this handover testbed. These scenarios are defined by
the existence, or not, of a lack of coverage between consecutive RSUs. Figures 4.32 and 4.33
show these scenarios.
Figure 4.32: Scenario 1 (Lack of Coverage between consecutive RSUs)
Figure 4.33: Scenario 2 (Coverage Overlap between RSUs)
Remembering that WMRP already allows for vertical handovers to occur, and that WiMetroNet
and SITMe allows for the usage of heterogeneous wireless technologies, it is simple to understand
that the first scenario is not important to test. In the first scenario the vertical handover, already
implemented and testes, will take care of the lack of coverage between RSUs. This means that
this testbed can focus exclusively on handover scenarios such as the one of figure 4.33. Because
WAVE is not implemented, the RSUs and the OBU will have to operate in the same frequency. In
this case, and because some interference between RSUs and OBUs are expected to exist because

62 Evaluation of the Solution
Figure 4.34: Handover Test Network
we will have everything working in the same frequency, it is very important to try and reduce the
coverage overlap to a minimum. It is also important to guarantee that there is enough overlap
for the horizontal handover to occur before a vertical handover is required. With the handover
scenario selected, the handover testbed can, now, be introduced. To ease the amount of resources
necessary to perform these tests, were decided to do them again inside the FEUP campus. With
the handover scenario selected, the network architecture for the handover must now be defined.
This network architecture should mimic, as close as possible, the architecture found in SITMe. In
Section 3.3.1 the architecture for the SITMe V2 was presented. Figure 4.34 shows the network
architecture for the handover testbed.
This test architecture is composed by 2 RSUS and 1 OBU that will run WMRP. The Rbridge
Core is the RBridge that will run in a generic laptop. T1 and T2 are two computers running the
standard IP stack. They will serve as start and end point to test communication. These terminals
will provide the results for this testbed. To configure WMRP in each node, the complete list of
MAC addresses was required. Table 4.12 shows the list of MAC addresses of the neighbors of

4.2 Handover in IEEE 802.11p 63
each RBridge. Although this is being set manually, SITMe already has functions to automatically
discover the MAC addresses of the host interfaces and the legacy terminal nodes attached.
Rb Core Rb RSU 1 Rb RSU 2 Rb OBUNeighbor #1 00:01:8a:77:81:c2 00:70:f4:56:3f:6f 00:70:f4:56:3f:6f 00:90:f5:82:db:7aNeighbor #2 00:0d:89:26:85:4c 00:0d:89:27:12:64 00:0d:89:26:85:4c 00:1b:b1:b1:8a:b2Neighbor #3 00:0d:89:27:12:64 00:1b:b1:b1:8c:06 00:1b:b1:b1:8c:06 00:1b:b1:b1:8b:44
Table 4.12: List of Neighbor MAC addresses by RBridge
The only elements with assigned IP addresses are both the terminals, the Eth1 interface of the
Rb Core and the Eth0 interface of the Rb Obu. This is because, as explained en Section 2.1.1.2,
WMRP is a layer 2 routing protocol. The WMRP nodes do not need IP addresses. Each of them
have a unique ID attached that are used by them to route traffic between themselves using MPLS.
Table 4.13 shows the IP addresses of the terminal nodes.
Node and Interface IP Address & NetworkT1 Eth0 172.16.100.2/24T2 Eth0 172.16.100.1/24Rb Core Eth1 172.16.100.10/24Rb OBU Eth0 172.16.100.20/24
Table 4.13: List of IP Addresses of the Terminal Nodes
The IP address associated to the interfaces Eth1 and Eth0 of the Rb Core and Rb OBU are only
meant to serve as a way to test the connectivity between the terminals and the Rb Core and Rb
Obu. It is also important to note that the wireless link between RSU 1 and RSU 2 is not being con-
sidered. This link does exist, but since both the RSU 1 and RSU 2 are connected through Ethernet
and for link weight purposes Ethernet will be always the link with lowest weight, this wireless
link is discarded. The effects this wireless link has (interferences) is not discarded, nor can it be.
As stated before, the testbed will be installed inside the FEUP campus. To be precise, the RSUs
will be installed in open windows of the third floor of the INESC building, facing different sides.
Because the RSUs will be placed in different rooms, it is expected that these walls will reduce the
interference caused between RSUs. In the road outside, a car Renault Scenic will have the OBU
installed in it. Figure 4.35 shows the location of each of these elements and the path taken by the
OBU.
With the network architecture, as well as the location of the tests defined, now the methodology
to test the handover can be defined. In Section 3.3.2 were shown the changes that had to be
performed to the Data and Control planes of WiMetroNet to include functions that would allow
the IEEE 802.11p handover. Because there will be several scripts that will be reading and writing
into files for to enable to extract the RSSI values, it was decided to keep any other log saving
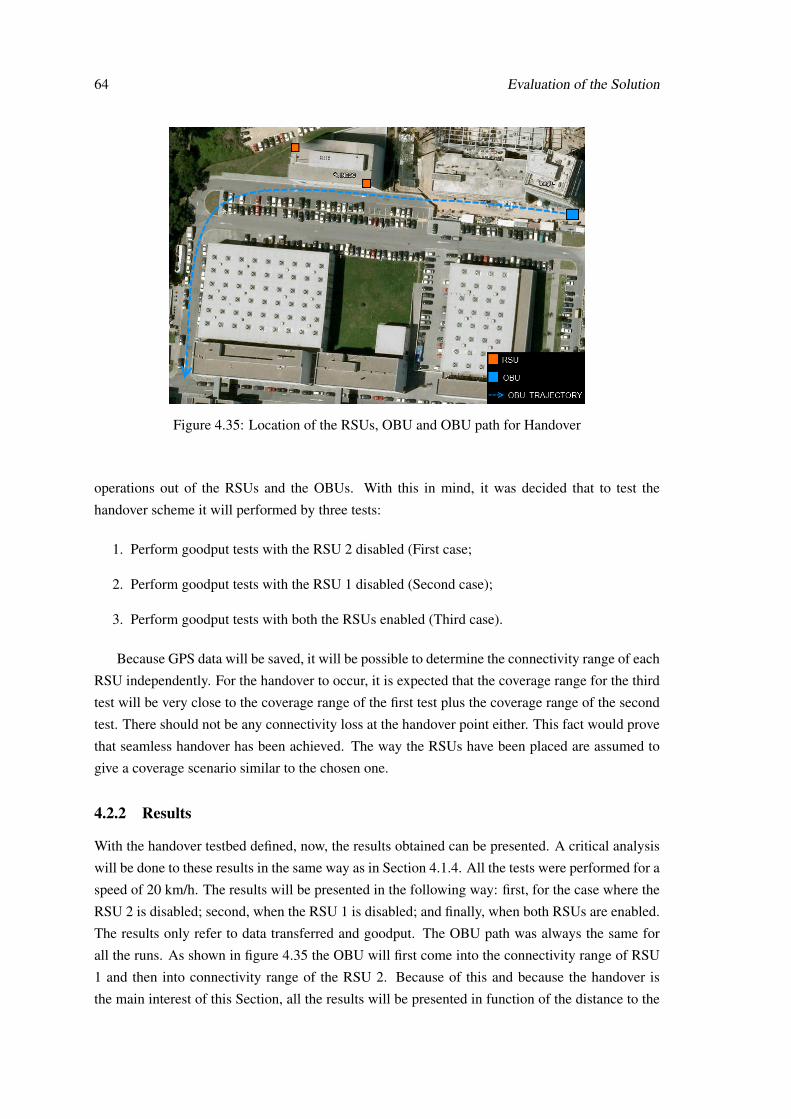
64 Evaluation of the Solution
Figure 4.35: Location of the RSUs, OBU and OBU path for Handover
operations out of the RSUs and the OBUs. With this in mind, it was decided that to test the
handover scheme it will performed by three tests:
1. Perform goodput tests with the RSU 2 disabled (First case;
2. Perform goodput tests with the RSU 1 disabled (Second case);
3. Perform goodput tests with both the RSUs enabled (Third case).
Because GPS data will be saved, it will be possible to determine the connectivity range of each
RSU independently. For the handover to occur, it is expected that the coverage range for the third
test will be very close to the coverage range of the first test plus the coverage range of the second
test. There should not be any connectivity loss at the handover point either. This fact would prove
that seamless handover has been achieved. The way the RSUs have been placed are assumed to
give a coverage scenario similar to the chosen one.
4.2.2 Results
With the handover testbed defined, now, the results obtained can be presented. A critical analysis
will be done to these results in the same way as in Section 4.1.4. All the tests were performed for a
speed of 20 km/h. The results will be presented in the following way: first, for the case where the
RSU 2 is disabled; second, when the RSU 1 is disabled; and finally, when both RSUs are enabled.
The results only refer to data transferred and goodput. The OBU path was always the same for
all the runs. As shown in figure 4.35 the OBU will first come into the connectivity range of RSU
1 and then into connectivity range of the RSU 2. Because of this and because the handover is
the main interest of this Section, all the results will be presented in function of the distance to the

4.2 Handover in IEEE 802.11p 65
RSU 1. Also because the trajectory of the OBU has a curve, the distances were calculated from the
RSU 1 to the start of the curve and, then, from the start of the curve to the end point. This makes
these measures much more accurate than if the distances were calculated as a straight line between
OBU and RSU 1. Also, because handover will undoubtedly occur after the RSU 1 is passed. The
results will only be presented for distances after the RSU 1 location is crossed. Figure 4.36 shows
the goodput achieved for the first case.
Figure 4.36: Goodput with RSU 1 enabled
Figure 4.36 shows that the goodput starts decreasing at around 80m and it is almost 0 after
around 90 m. In comparison with the goodput results from Section 4.1.4.2 there’s a clear decrease
in goodput. This might be a cause of WMRP data plane overhead (MTU for end terminals is
1400Bytes instead of 1500Bytes) and the added computational power required from the ALIX
3d3 boards. Figure 4.37 shows the data transferred for the first case.
Figure 4.37: Data Transferred with RSU 1 enabled

66 Evaluation of the Solution
In both runs, the goodput clearly drops to almost 0 at around 80m as verified before. It is also
possible to verify that 25 Mbytes is the maximum value reached in terms of total data transferred.
These results are completely expected, there is already coverage before the OBU reaches the
RSU 1, which allows the goodput to increase into stable values. After the coverage range limit
approaches, the goodput decreases. Next, the results for the second case are presented. Figure 4.38
shows the goodput achieved for the second case.
Figure 4.38: Goodput with RSU 2 enabled
In opposition to the goodput in the first case, now there is a clear increase of goodput that can
be verified after the OBU crosses the RSU 1 location. This is because only around that location
the RSU 2 started to provide coverage. It is also possible to verify that, although the goodput also
decreases after around 80m, it manages to stay around 4 Mbit/s for some more meters. In fact, the
connectivity only seems to cease at around 110m, in opposition to the 90m found in the first case
tests. Figure 4.39 shows the data transferred results for the second case.
Figure 4.39: Data Transferred with RSU 2 enabled
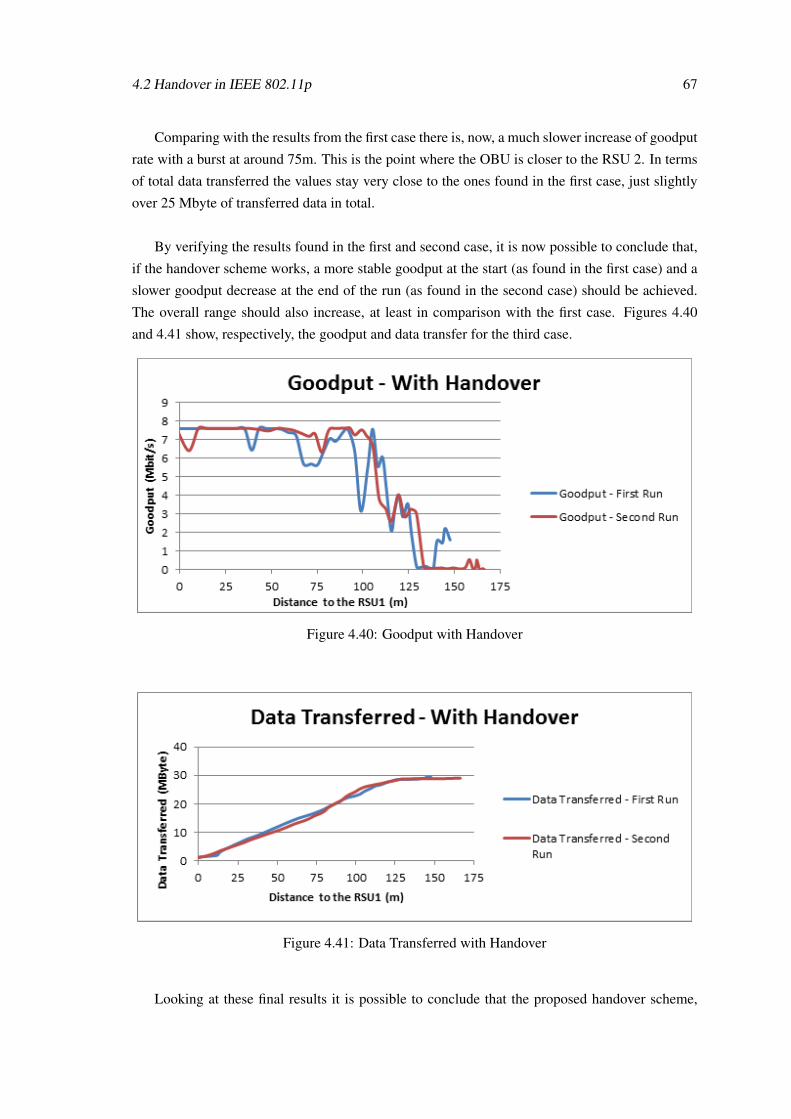
4.2 Handover in IEEE 802.11p 67
Comparing with the results from the first case there is, now, a much slower increase of goodput
rate with a burst at around 75m. This is the point where the OBU is closer to the RSU 2. In terms
of total data transferred the values stay very close to the ones found in the first case, just slightly
over 25 Mbyte of transferred data in total.
By verifying the results found in the first and second case, it is now possible to conclude that,
if the handover scheme works, a more stable goodput at the start (as found in the first case) and a
slower goodput decrease at the end of the run (as found in the second case) should be achieved.
The overall range should also increase, at least in comparison with the first case. Figures 4.40
and 4.41 show, respectively, the goodput and data transfer for the third case.
Figure 4.40: Goodput with Handover
Figure 4.41: Data Transferred with Handover
Looking at these final results it is possible to conclude that the proposed handover scheme,

68 Evaluation of the Solution
indeed, worked. The overall connectivity range increased. Although it seems to not be as large as
for when only the RSU 2 was active, it is still larger than the range with only the RSU 1 active.
The goodput starts in a much more stable condition. The clear increase of goodput at the start is
no longer found, which means the RSU 1 was indeed providing coverage before the RSU 2 came
into play. Finally, the total data transferred is clearly greater than the one found in, either, the first
or second case. It is, now, very close to 30 Mbyte. Although it was verified that the handover
was indeed occurring, the range of the RSU 1 was larger than what it was expected. In fact, the
RSU 1 seems to completely overlap the RSU 2. It is expected, though, that if the range of RSU
2 was larger, than the results would display it accordingly. That is, it is expected that after the
handover the goodput would again increase to around 8 Mbit/s. There are additional facts that
explain these results and they must be considered. In an ideal scenario WMRP should directly
access the RSSI values. The fact that writing and reading of text files is necessary to get those
values adds complexity to the solution and makes it more unstable (for example, if there is failure
to read a file). The link weights are currently being calculated every two seconds. This value could
be changed but additional problems could arise. One of them is already noticeable in figure 4.40.
Consecutive handovers are happening where the OBU is selecting the RSU 1 and RSU 2 in very
short periods. This is noticeable due to the small decreases in goodput present in figure 4.40.
Ideally this should not happen. WMRP should be able to deal with these sharp variations of RSSI
that are causing these consecutive handovers.
4.2.3 Theoretical Validation
As stated in Section 4.2, along with a practical validation of the proposed handover scheme, a
theoretical validation will also be presented. In Section 2.1.1.2, the control plane of WiMetroNet
was presented. As detailed, this control plane specifies the type of control messages that flow
within the network. These messages are what allow the layer 2 routing to occur. To provide a
theoretical validation, what will be performed next, is a step by step analysis of the messages that
will be exchanged within the network. This means, analyzing the flow of HELLO, TC, MC and IC
messages. The network scenario will be the same one used for the practical validation. At the end
of each of these phases, each RBridge will have a database which can, then, be used to calculate
the routing table. There are three different phases for this procedure. A first phase, where the OBU
will be in the coverage range of only the RSU 1; a second phase, where both the RSU 2 and RSU
1 will be providing coverage range; and a third phase, where it will be only in the coverage range
of the RSU 2. Because presenting the diagrams for every phase and every message would be too
exhaustive and would present an excessive weight for this Section, these diagrams will be pre-
sented in Appendix C. These diagrams will be enough to understand the algorithm behind WMRP.
Although these diagrams are not presented, the routing tables that are formed after receiving these
messages in each phase will still be presented here (and they are enough to validate the handover
scheme). Table 4.14 shows association of RBridge IDs with the IDs of their neighbors (one hop
distance nodes) for the first phase.

4.2 Handover in IEEE 802.11p 69
ID # Neighbor IDs1 2 32 1 3 43 1 24 2
Table 4.14: Association of RBridge IDs to Neighbor IDs (First Phase)
After the HELLO messages have been sent, each RBridge would know which RBridges are its
neighbors. After this, it is now important for each RB ridge to know what neighbors each RBridge
in the network have, as well as the link cost for each RBridge. Table 4.15 shows the TC tables in
each RBridge.
In RBridge ID # ID # Neighbors ID # Link Cost
12 1 3 4 1 1 X3 1 2 1 14 2 Y
21 2 3 1 13 1 2 1 14 2 Y
31 2 3 1 12 1 3 4 1 1 X4 2 Y
41 2 3 1 12 1 3 4 1 1 X3 1 2 1 1
Table 4.15: TC Tables (First Phase)
The TC table shows how each TC table will look in each RBridge. For example, in RBridge
1 it is possible to verity that RBridge 2 has, as neighbors, the RBridges with IDs 1, 3 and 4.
Furthermore, the weight of each link is given by a vector present in the Link Cost column. This
weight will be used to calculate the routing table. Finally, the MC and IC messages will associate
each RBridge to the MAC addresses of terminals that they are directly connected to, as well as the
association between those MAC addresses and IP addresses. Table 4.16 shows these associations.
RBridge ID # MAC Address of Terminal IP Address of Terminal1 00:01:80:77:b1:c2 172.16.100.14 00:90:f5:82:db:7a 172.16.100.2
Table 4.16: MC and IC Tables (First Phase)
With these tables calculated, WMRP would now be able to successfully route the traffic. For
example, if Terminal 2 wanted to communicate with Terminal 1, then the procedure required would
be:

70 Evaluation of the Solution
1. RBridge 4 searches in its MC and IC table for the RBridge that is association to T1, in this
case its RBridge 1;
2. RBridge 4 searches in its TC table for the shortest path to RBridge 1. It is possible to see
that only RBridges 2 and 3 have the RBridge 1 has neighbor and that RBridge 2 is a direct
neighbor of the RBridge 4;
3. The total cost of this path would be X + 1 and would reach RBridge 1 in two hops.
Since there are no additional available paths from RBridge 4 to RBridge 1, this would be the
selected path. These tables would be continuously refreshed and would stay the same until the end
of the first phase (although alterations to the wireless link costs would change). After some time
the OBU would enter the second phase. In this phase the OBU would be in the coverage range
of both the RSU 1 and the RSU 2. It is in this phase that the handover will most likely occur.
Table 4.17 shows the HELLO tables after the HELLO messages have been sent.
ID # Neighbor IDs1 2 32 1 3 43 1 2 44 2 3
Table 4.17: Association of RBridge IDs to Neighbor IDs (Second Phase)
In this new phase the RBridge 3 and 4 have updated their hello tables. This is because they are
now neighbors. Because of this fact the TC tables will also be updated. Table 4.18 shows the TC
tables after the TC messages have been sent.
In RBridge ID # ID # Neighbors ID # Link Cost
12 1 3 4 1 1 X3 1 2 4 1 1 A4 2 3 Y B
21 2 3 1 13 1 2 4 1 1 A4 2 3 Y B
31 2 3 1 12 1 3 4 1 1 X4 2 3 Y B
41 2 3 1 12 1 3 4 1 1 X3 1 2 4 1 1 A
Table 4.18: TC Tables (Second Phase)
It is now noticeable that Bbridges 3 and 4 have additional link costs for the new neighbors.
This opens a new path for the messages to be sent. Seeing as no additional terminals were added,
IC and MC messages will stay unchanged. Determining the shortest path between T2 and T1 will

4.2 Handover in IEEE 802.11p 71
be performed in the same way as done in phase 1. The main difference is that, now, there are
two available paths. T2 can reach T1 by selecting a path through RBridge 2 and 1 or through
RBridge 3 and 1. The defining factor that will break this tie is the link cost of the wireless links
between RBridges 4 and 2 or 3. If the link cost is lower for link 2 then, the path taken would be
2-1, otherwise it would be 3-1. In case of a tie the ID with the smallest number will be selected.
Finally for the third phase, the tables would look similar to the ones in the first phase. The main
difference is that, because the OBU is no longer in the coverage range of the RSU 1, then no
WMRP messages would be traded by these two RBridges. RSU 1 would stop being a neighbor of
the OBU and, so, only one the path through RBridge 3 and 1 would be up for T1 to contact T2.
4.2.4 Conclusions
In this Section a handover testbed used to test the proposed handover scheme was presented as
well as practical and theoretical proof that the chosen handover scheme is working as intended,
although with some room for improvement. The fact that WMRP allows for the changing of the
time interval between updates to its routing tables makes it a flexible solution. If there is a small
overlap of coverage area or the speeds of the vehicles are high then a small interval could be used.
These small intervals will have an effect on the size of the network that it would be possible to
use Small intervals mean that a lot more information would be traveling on the network; adding
too many nodes could cause efficiency problems. On the other hand, if there is a large overlap of
coverage area or if the speeds of the vehicles are low, then a high interval could be used. Using a
higher interval would decrease the amount of traffic on the network and allow the creation of larger
networks and additional scalability. The results presented here are clearly promising, and WMRP
is definitely a good solution to perform handover in IEEE 802.11p , but a lot of work could be
performed to improve its current performance. In Section 4.1 it was verified that IEEE 802.11p is
a good candidate against IEEE 802.11n in a vehicular mobility scenario. With the results obtained
in this Section, it is now possible to validate the changes to the SITMe architecture as well as our
handover scheme presented in Section 3.3.

72 Evaluation of the Solution
Chapter 5
Conclusions and Future Work
In this dissertation, the main goal was to test a new immerging wireless technology based on IEEE
802.11p amendment. This technology aims to be especially useful in vehicular mobility scenarios.
Although some reasonable results to this type of vehicular mobile scenarios can be achieved by
using IEEE 802.11n, this technology is not specially designed to meet the specific requirements
of these scenarios, such as, high mobility. Initially, a search for available vehicular technologies
that would serve as a ground to this work was conducted. Possible handover schemes to solve
handover in IEEE 802.11p were studied, as well as the vehicular network architecture associated
with SITMe. After studying these technologies and architectures, a plan to integrate an IEEE
802.11p module into SITMe was devised. Initially, all the requirements present in Section 1.4
were tried to be met, but because of some faults and limitations found in the used software and
hardware, that was not possible. The main limitation was due to incompatibilities between the
IEEE 802.11p drivers and the operating system currently runnin on SITMe. For those special
cases, valid alternatives were presented and explained. Hardware and software to build a complete
solution was chosen and the necessary changes to the SITMe network architecture to allow the
integration of the proposed module were presented in Chapter 3. With this solution defined it was
then created a mobile testbed, as well as a handover testbed to validate it. The mobile testbed was
used to evaluate the technology by performing a series of comparisons between IEEE 802.11p
with IEEE 802.11n. It was found that IEEE 802.11p outperforms IEEE 802.11n in a vehicular
mobile scenario. This is, mainly, due to the difference in coverage range between IEEE 802.11p
and IEEE 802.11n. After evaluating the technology, the changes to the SITMe architecture to add
handover in IEEE 802.11p needed to be validated. With the handover testbed, it was possible to
recreate a network scenario similar to the one that would be found in SITMe. The obtained results
validated the selected handover scheme. The Control Plane operation was validated theoretically.
It is now possible to conclude that, indeed, IEEE 802.11p shows very promising results in a real
vehicular mobility scenario and that the changes made to SITMe to accommodate this technology
are feasible.
73

74 Conclusions and Future Work
Future Work
There are several ways of improving the work done along this dissertation. As stated, there are
no drivers for IEEE 802.11p currently available. The solution found uses a series of patches that
are applied to the drivers for IEEE 802.11a with an Atheros chipset. This reduces the amount of
hardware choices for IEEE 802.11p cards. IEEE 802.11p drivers could be developed in the future
to overcome this limitation. Fully functional drivers for Linux would enable the implementation
of an IEEE 802.11p module as a simple interface addition to the current SITMe architecture. No
additional RBridges by bus would be required. A further problem with the drivers found is that
they do not implement the WAVE functions. Having a workable WAVE stack functioning would
make possible to select cleaner network architectures for this solution. For example, it would
allow the use of a multi-channel handover scheme as described in Section 2.3.2. Although the
selected handover scheme is promising, there is no way to deal with interferences caused by a
chain of RSUs and OBUs working all in the same frequency. In the handover scenario, if a larger
amount of OBUs are included, the interferences would significantly impair the performance of
IEEE 802.11p. Multi-channel functions would allow the creation of a chain of RSUs working in
different frequencies, therefore, decreasing interferences caused on one another to a minimum.
The handover scheme presented can also be improved by creating a solution to be directly
integrated into WMRP to obtain the RSSI. So far, the way the RSSI values are being obtained from
the IEEE 802.11p cards is far from ideal. The successive writing and reading functions present in
each Rbridge is impairing the general performance of the handover. Another improvement would
be to stabilize the RSSI values. In the present solution, the RSSI values fluctuate too much, which
causes frequent handover processes to happen in a short period between consecutive RSUs. Future
drivers for IEEE 802.11p might add functions to capture, accurately, these RSSI values.

References
[1] Helder Fontes. Multi-Technology Router for Mobile Networks: Layer 2 Overlay Networkover Private and Public Wireless Links. MSc, Faculdade de Engenharia da Universidade doPorto, 2010.
[2] SAE. DSRC implementation guide, 2012. Available in http://www.sae.org/standardsdev/dsrc/DSRCImplementationGuide.pdf, last time accessed inFebruary 7, 2012.
[3] Michele Weigle. Standards: WAVE/DSRC/802.11p, 2008. Available in www.cs.odu.edu/~mweigle/courses/cs795-s08/lectures/5c-DSRC.pdf, last time accessedin February 7, 2012.
[4] Jungwook Choi and Hyukjoon Lee. Supporting handover in an ieee 802.11p-based wirelessaccess system. In Proceedings of the seventh ACM international workshop on VehiculArInterNETworking, VANET ’10, pages 75–80, New York, NY, USA, 2010. ACM.
[5] Woong Cho, Minjung Kim, Sangwoo Lee, and Hyun Seo Oh. Implementation of handoverunder multi-channel operation in ieee 802.11p based communication systems. In ICT Con-vergence (ICTC), 2011 International Conference on, pages 151 –155, sept. 2011.
[6] UNEX. UNEX DCMA-86P2 - 5.9GHz DSRC wireless mini-pci, 2012. Available in http://www.unex.com.tw/product/dcma-86p2, last time accessed in June 20, 2012.
[7] ALIX. PC Engines Alix 3d3, 2012. Available in http://pcengines.ch/alix3d3.htm, last time accessed in June 20, 2012.
[8] OpenWRT. OpenWRT - Wireless Freedom, 2012. Available in https://openwrt.org/,last time accessed in June 20, 2012.
[9] ATT. Differences between 802.11a, 802.11b, 802.11g and 802.11n, 2012. Avail-able in http://www.wireless.att.com/support_static_files/KB/KB3895.html, last time accessed in February 7, 2012.
[10] Wei-Yen Lin, Mei-Wen Li, Kun chan Lan, and Chung-Hsien Hsu. A comparison of 802.11aand 802.11p for V-to-I communication: a mesasurement study. November 2010.
[11] Gustavo Carneiro, Pedro Fortuna, Jaime Dias, and Manuel Ricardo. Transparent and scalableterminal mobility for vehicular networks. Computer Networks, 56(2):577 – 597, 2012.
[12] M. Ricardo, G. Carneiro, P. Fortuna, F. Abrantes, and J. Dias. WiMetroNet - a scalable wire-less network for metropolitan transports. In Proceedings of The Sixth Advanced InternationalConference on Telecommunications (AICT).
75

76 REFERENCES
[13] H. Zimmermann. OSI reference model–The ISO model of architecture for open systemsinterconnection. IEEE Transactions on communications, 28(4):425–432, 1980.
[14] R. Perlman. Rbridges: transparent routing. In INFOCOM 2004. Twenty-third AnnualJointConference of the IEEE Computer and Communications Societies, volume 2, pages 1211–1218 vol.2, 2004.
[15] T. Clausen and P. Jacquet. Optimized link state routing protocol (OLSR).http://tools.ietf.org/html/rfc3626, October 2003.
[16] E. Rosen, A. Viswanathan, and R. Callon. RFC3031: Multiprotocol Label Switching Archi-tecture. Internet RFCs, 2001.
[17] D. Plummer. Ethernet address resolution protocol: Or converting network pro-tocol addresses to 48.bit ethernet address for transmission on ethernet hardware.http://tools.ietf.org/html/rfc826, November 1982.
[18] IEEE. IEEE 802.11 Standard, 2012. Available in http://standards.ieee.org/about/get/802/802.11.html/, last time accessed in February 7, 2012.
[19] Wi-Fi Alliance. Wi-Fi alliance, 2012. Available in http://www.wi-fi.org/, last timeaccessed in February 7, 2012.
[20] RITA. IEEE 1609 - family of standards for wireless access in vehicular environments (wave),2012. Available in http://www.standards.its.dot.gov/fact_sheet.asp?f=80, last time accessed in February 7, 2012.
[21] Oh Hyunseo, Yae Chungil, Ahn Donghyon, and Cho Hanberg. 5.8 ghz DSRC packet com-munication system for ITS services. In Vehicular Technology Conference, 1999. VTC 1999 -Fall. IEEE VTS 50th, volume 4, pages 2223–2227, 1999.
[22] WiMAX. WiMAX tutorial, 2012. Available in http://www.wimax.com/table/wimax-tutorial/, last time accessed in February 7, 2012.
[23] I.C. Msadaa, P. Cataldi, and F. Filali. A comparative study between 802.11p and MobileWiMAX-based V2I communication networks. pages 186–191.
[24] Connie Ribeiro. Bringing wireless access to the automobile: A comparison of Wi-Fi,WiMAX, MBWA, and 3G.
[25] 3GPP. Third generation partnership project, 2012. Available in http://3gpp.org/, lasttime accessed in February 9, 2012.
[26] 3GPP. Overview of the universal mobile telecommunication system available, 2002. Avail-able in http://www.umtsworld.com/technology/overview.htm#a3, last timeaccessed in February 9, 2012.
[27] B. S. Gukhool and S. Cherkaoui. Handling handovers in vehicular communications using anIEEE 802.11p model in NS-2.
[28] GCDC. Grand Cooperative Driving Challenge, 2012. Available in http://www.gcdc.net/, last time accessed in June 20, 2012.
[29] NLANR/DAST. IPERF, 2012. Available in http://sourceforge.net/projects/iperf/, last time accessed in June 20, 2012.

REFERENCES 77
[30] TCPdump. TCPdump, 2012. Available in http://www.tcpdump.org/, last time ac-cessed in June 20, 2012.
[31] Jan Morgenstern. Wavemon, 2012. Available in http://freecode.com/projects/wavemon, last time accessed in June 20, 2012.
[32] Free Software Foundation. Ncurses, 2012. Available in http://www.gnu.org/software/ncurses/, last time accessed in June 20, 2012.
[33] Aircrack-ng. Aircrack-ng, 2012. Available in http://www.aircrack-ng.org/contact.html/, last time accessed in June 20, 2012.
[34] A. Matsumoto, K. Yoshimura, S. Aust, T.Ito, Y. Kondo. Performance Evaluation for IEEE802.1n devices for vehicular networks. 2009.

78 REFERENCES

Appendix A
Configurations
In this appendix some of the network configurations used for the Mobile Testbeds will be presented
as well as some scripts that were used to automate some of the tests we performed.
#Network Configuration of the RSU for IEEE 802.11p and IEEE 802.11n#
config interface loopback
option ifname lo
option proto static
option ipaddr 127.0.0.1
option netmask 255.0.0.0
config interface lan
option ifname eth0
option proto ’static’
option ipaddr ’192.168.1.1’
option netmask ’255.255.255.0’
option gateway ’192.168.1.2’
option dns ’8.8.8.8’
config interface wireless
option ifname wlan0
option proto ’static’
option ipaddr ’192.168.11.1’
option netmask ’255.255.255.0’
#Network Configuration of the OBU for IEEE 802.11p and IEEE 802.11n#
config interface loopback
option ifname lo
option proto static
option ipaddr 127.0.0.1
79
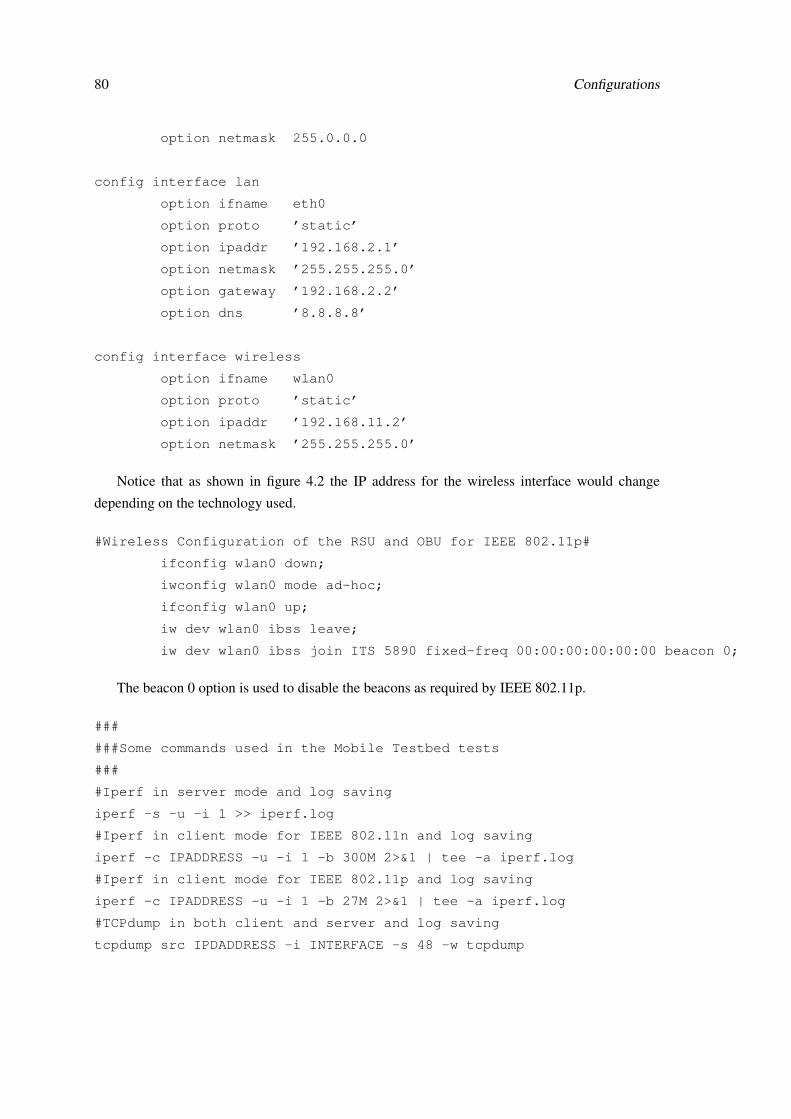
80 Configurations
option netmask 255.0.0.0
config interface lan
option ifname eth0
option proto ’static’
option ipaddr ’192.168.2.1’
option netmask ’255.255.255.0’
option gateway ’192.168.2.2’
option dns ’8.8.8.8’
config interface wireless
option ifname wlan0
option proto ’static’
option ipaddr ’192.168.11.2’
option netmask ’255.255.255.0’
Notice that as shown in figure 4.2 the IP address for the wireless interface would change
depending on the technology used.
#Wireless Configuration of the RSU and OBU for IEEE 802.11p#
ifconfig wlan0 down;
iwconfig wlan0 mode ad-hoc;
ifconfig wlan0 up;
iw dev wlan0 ibss leave;
iw dev wlan0 ibss join ITS 5890 fixed-freq 00:00:00:00:00:00 beacon 0;
The beacon 0 option is used to disable the beacons as required by IEEE 802.11p.
###
###Some commands used in the Mobile Testbed tests
###
#Iperf in server mode and log saving
iperf -s -u -i 1 >> iperf.log
#Iperf in client mode for IEEE 802.11n and log saving
iperf -c IPADDRESS -u -i 1 -b 300M 2>&1 | tee -a iperf.log
#Iperf in client mode for IEEE 802.11p and log saving
iperf -c IPADDRESS -u -i 1 -b 27M 2>&1 | tee -a iperf.log
#TCPdump in both client and server and log saving
tcpdump src IPDADDRESS -i INTERFACE -s 48 -w tcpdump
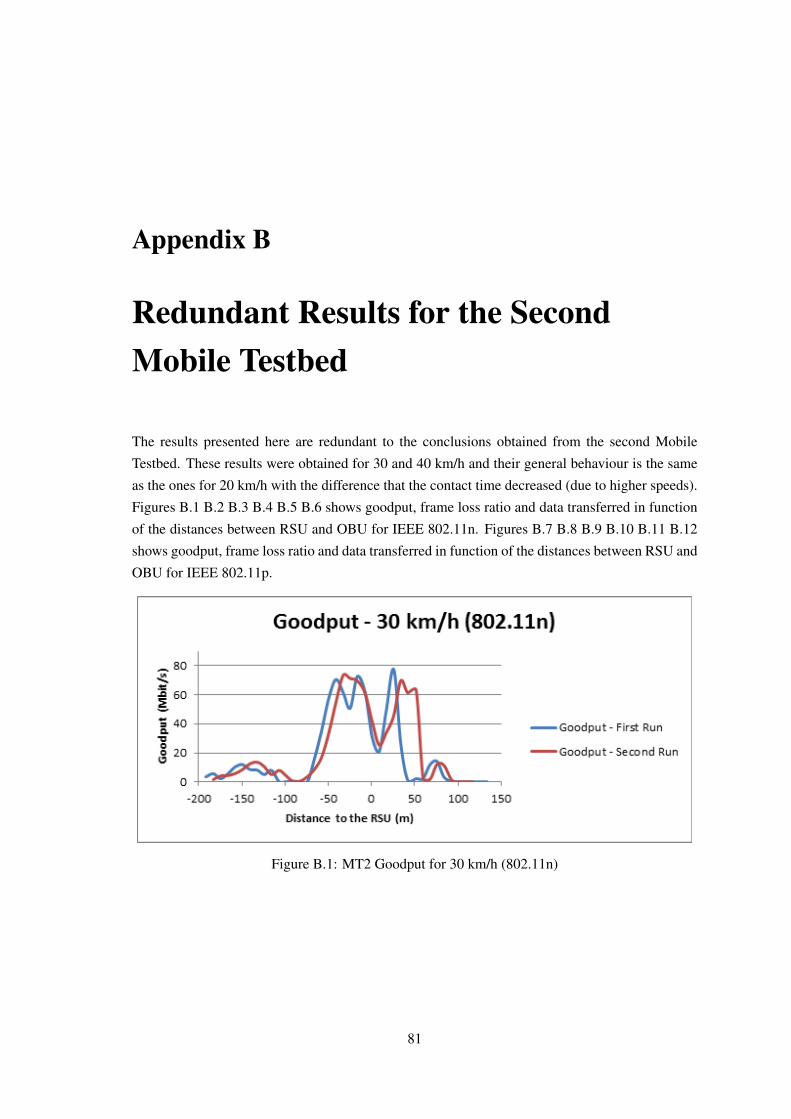
Appendix B
Redundant Results for the SecondMobile Testbed
The results presented here are redundant to the conclusions obtained from the second Mobile
Testbed. These results were obtained for 30 and 40 km/h and their general behaviour is the same
as the ones for 20 km/h with the difference that the contact time decreased (due to higher speeds).
Figures B.1 B.2 B.3 B.4 B.5 B.6 shows goodput, frame loss ratio and data transferred in function
of the distances between RSU and OBU for IEEE 802.11n. Figures B.7 B.8 B.9 B.10 B.11 B.12
shows goodput, frame loss ratio and data transferred in function of the distances between RSU and
OBU for IEEE 802.11p.
Figure B.1: MT2 Goodput for 30 km/h (802.11n)
81

82 Redundant Results for the Second Mobile Testbed
Figure B.2: MT2 Goodput for 40 km/h (802.11n)
Figure B.3: MT2 Frame Loss Ratio for 30 km/h (802.11n)

Redundant Results for the Second Mobile Testbed 83
Figure B.4: MT2 Frame Loss Ratio for 40 km/h (802.11n)
Figure B.5: MT2 Data Transferred for 30 km/h (802.11n)

84 Redundant Results for the Second Mobile Testbed
Figure B.6: MT2 Data Transferred for 40 km/h (802.11n)
Figure B.7: MT2 Goodput for 30 km/h (802.11p)

Redundant Results for the Second Mobile Testbed 85
Figure B.8: MT2 Goodput for 40 km/h (802.11p)
Figure B.9: MT2 Frame Loss Ratio for 30 km/h (802.11p)

86 Redundant Results for the Second Mobile Testbed
Figure B.10: MT2 Frame Loss Ratio for 40 km/h (802.11p)
Figure B.11: MT2 Data Transferred for 30 km/h (802.11p)

Redundant Results for the Second Mobile Testbed 87
Figure B.12: MT2 Data Transferred for 40 km/h (802.11p)

88 Redundant Results for the Second Mobile Testbed

Appendix C
Network Diagrams for TheoreticalValidation of the IEEE 802.11pHandover Scheme
In this Appendix the network diagrams with the message sequence for the handover theoretical
validation will be presented.
For all the network diagrams, a light blue node means it is a first hop source while a dark blue
node means it is a second hop source. Lines colored green shows the direction and flow of the
corresponding WMRP messages. For the first phase only, Figure C.1 shows the Hello messages
sent by all the nodes, figure C.2 shows the TC messages sent by the Rb Core and Rb RSU 2 and
figure C.3 shows the IC and MC messages sent by the Rb Core and Rb OBU. For simplification
purposes only one terminal connected to the Rb OBU is being considered as being active, instead
of a terminal connected to the Rb OBU and one connected to the Rb Core as presented in sec-
tion 4.2.
In the first phase there is no connectivity between Rb OBU and the Rb RSU 2 because they
are out of range of each other. TC, MC and IC messages flood are sent through all the interfaces
and forwarded in a second hop through all the remaining interfaces except the one it arrived in.
The second phase starts as soon as the OBU is in range of both the RSU 1 and RSU 2. Figure C.4
shows the Hello messages sent by all the nodes, figure C.5 shows the TC messages sent by the Rb
Core and Rb RSU 1 and figure C.6 shows the IC and MC messages sent by the Rb Core and Rb
OBU. It is in this phase that the handover will occur. Finally once the OBU is out of the coverage
range of the RSU 1 the handover is already completed. This phase is in all aspects similar to the
first phase. Figure C.7 shows the Hello messages sent by all the nodes, figure C.8 shows the TC
messages sent by the Rb Core and Rb OBU and figure C.9 shows the IC and MC messages sent
by the Rb Core and Rb OBU.
89
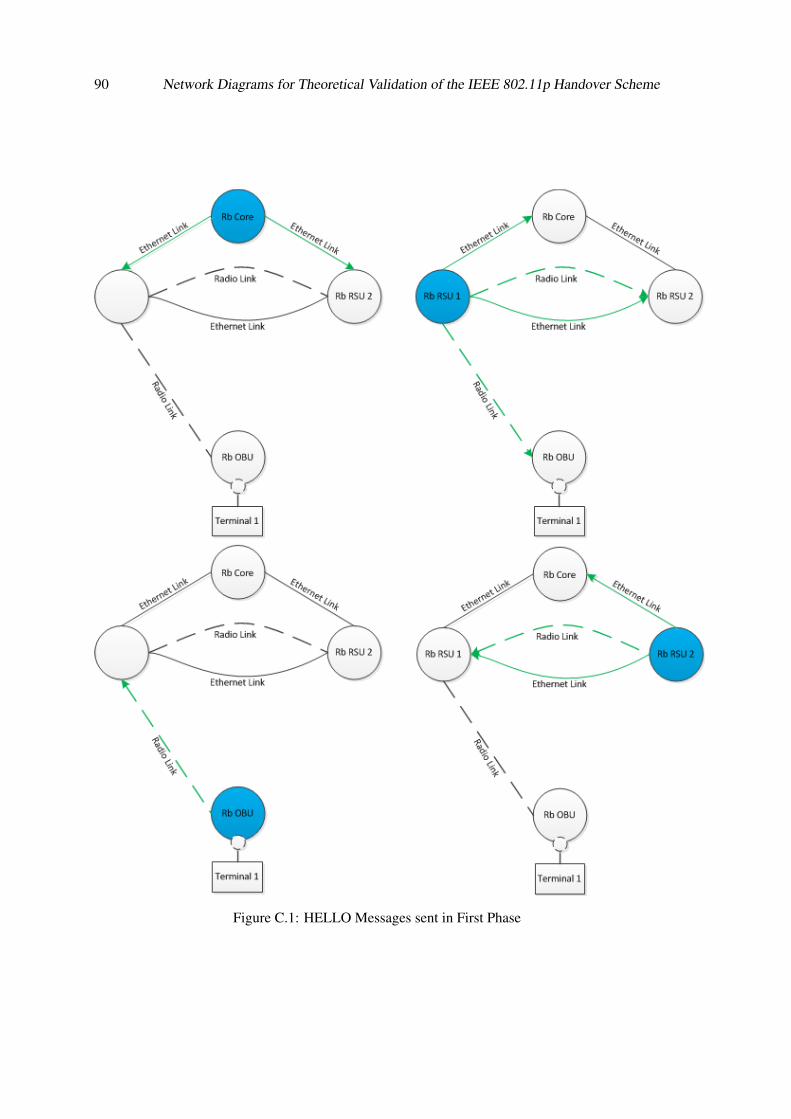
90 Network Diagrams for Theoretical Validation of the IEEE 802.11p Handover Scheme
Figure C.1: HELLO Messages sent in First Phase

Network Diagrams for Theoretical Validation of the IEEE 802.11p Handover Scheme 91
Figure C.2: TC Messages sent in First Phase
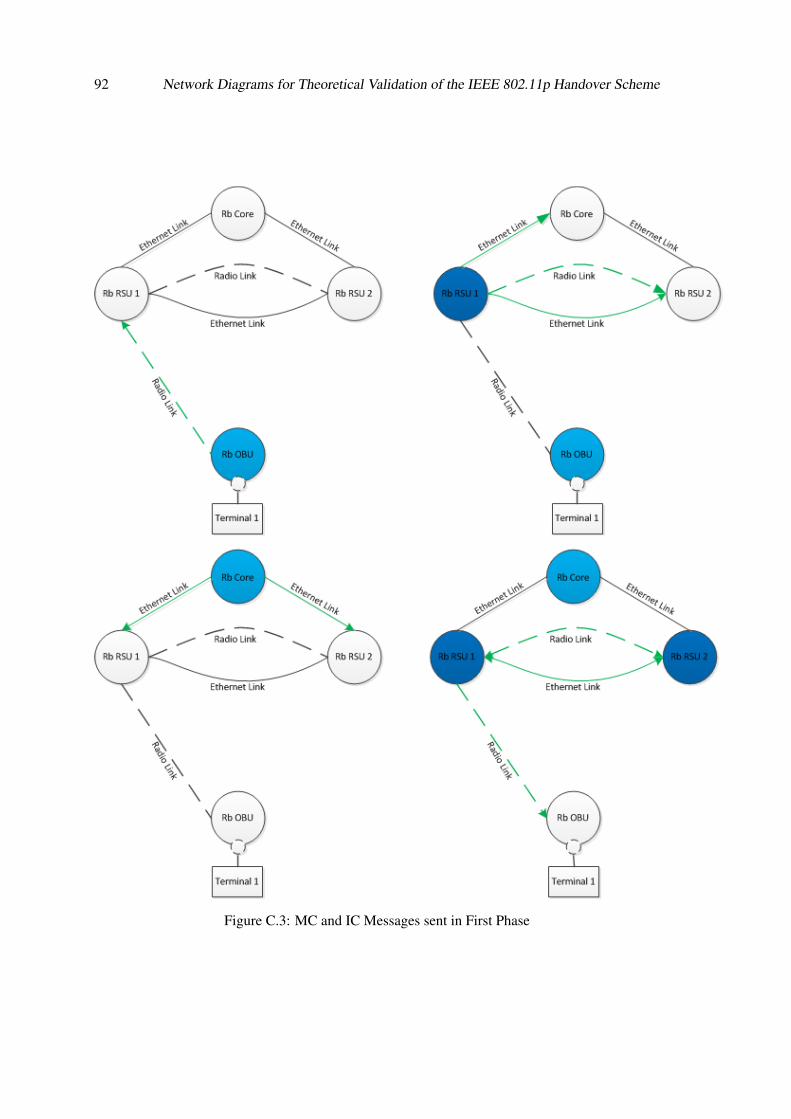
92 Network Diagrams for Theoretical Validation of the IEEE 802.11p Handover Scheme
Figure C.3: MC and IC Messages sent in First Phase

Network Diagrams for Theoretical Validation of the IEEE 802.11p Handover Scheme 93
Figure C.4: HELLO Messages sent in the Second Phase

94 Network Diagrams for Theoretical Validation of the IEEE 802.11p Handover Scheme
Figure C.5: TC Messages for the Second Phase

Network Diagrams for Theoretical Validation of the IEEE 802.11p Handover Scheme 95
Figure C.6: MC and IC Messages for the Second Phase
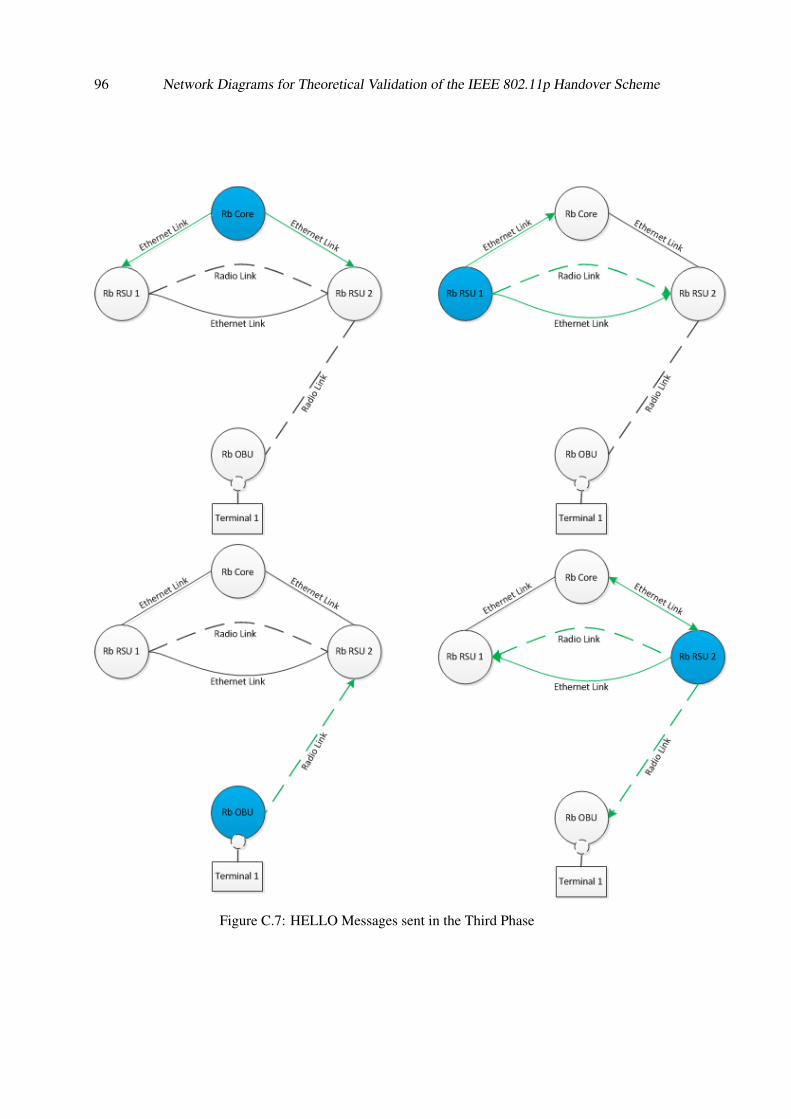
96 Network Diagrams for Theoretical Validation of the IEEE 802.11p Handover Scheme
Figure C.7: HELLO Messages sent in the Third Phase

Network Diagrams for Theoretical Validation of the IEEE 802.11p Handover Scheme 97
Figure C.8: TC Messages for the Third Phase

98 Network Diagrams for Theoretical Validation of the IEEE 802.11p Handover Scheme
Figure C.9: MC and IC Messages for the Third Phase

Appendix D
Photographies of the Mobile Testbeds
The location and assembly of equipment at each Mobile Testbed was documented through pho-
tography. These photos show some of the most important details pertaining each Mobile Testbed.
Figures D.1 and D.2 shows the N 327 while facing south and north respectively from the point of
view of the RSU. It is possible to see that for example while facing south there are a lot of traffic
signs that are blocking direct LOS. This fact caused a reduction of coverage range on the south
side.
Figure D.1: N 327 - Facing South (Second Mobile Testbed)
Figures D.3 and D.4 show the mounted RSU and OBU in the second mobile testbed.
99
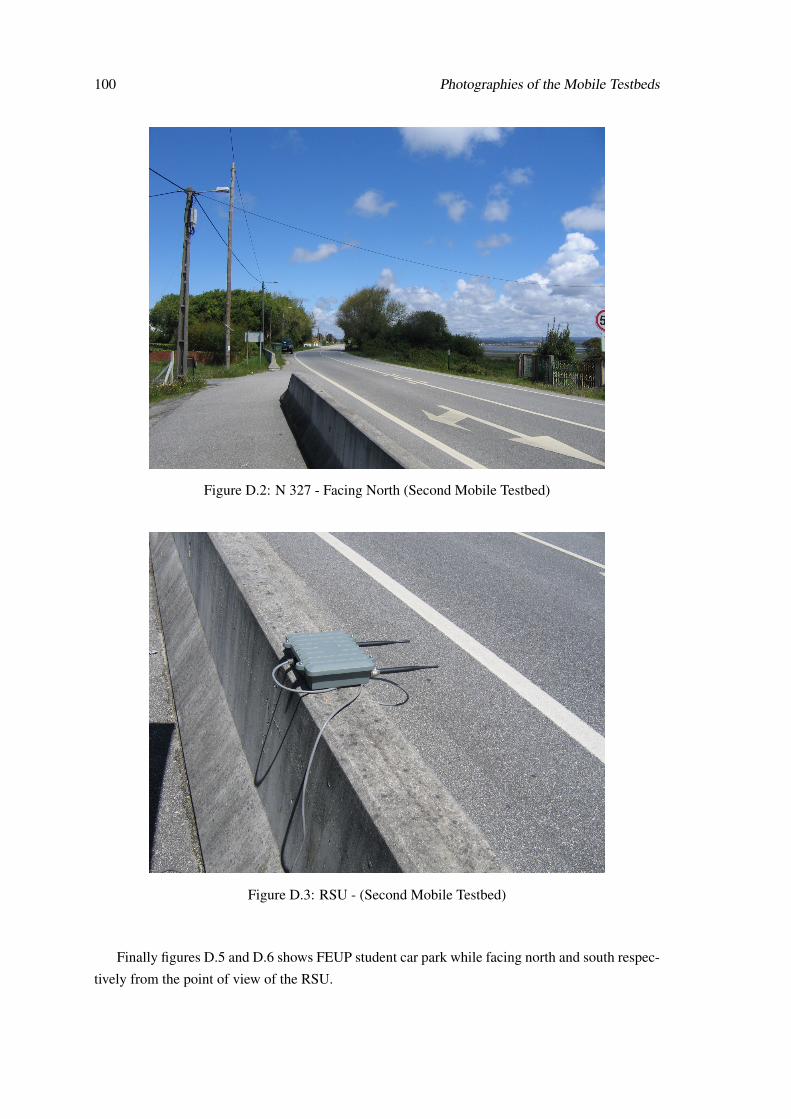
100 Photographies of the Mobile Testbeds
Figure D.2: N 327 - Facing North (Second Mobile Testbed)
Figure D.3: RSU - (Second Mobile Testbed)
Finally figures D.5 and D.6 shows FEUP student car park while facing north and south respec-
tively from the point of view of the RSU.

Photographies of the Mobile Testbeds 101
Figure D.4: OBU - Facing North (Second Mobile Testbed)
Figure D.5: FEUP student car park - Facing North (First Mobile Testbed)

102 Photographies of the Mobile Testbeds
Figure D.6: FEUP student car park - Facing South (First Mobile Testbed)