Veg. Oil Daily Fundamental Report - Agriwatch
7
Veg. Oil Daily Fundamental Report 8 th Apr 2021 Domestic Fundamentals: Edible oil complex featured rising trend at various markets centers on Tuesday. Soy oil refined domestic prices traded up at various locations. Demand for Soy oil is increasing as mustard arrival in market is slow. Soy oil International benchmark traded down as crude oil inventory goes up. USDA’s planting acreage is below at 87.6 Million acres compared to trade expectation of 90 Million acres. CPO prices closed above than previous day. BMD international benchmark traded down following rival Soy oil. Malaysia is currently facing labour shortage as migrant workers returned their homes and Malaysia have stopped hiring foreign workers. Indonesia is expanding their production as they target to increase their biodiesel consumption. Sunflower oil price is correcting after moving up to level of 1800 Rs and is currently at Rs 1630. Sunoil demand is being substituted to Soy and palm oil as prices are hiked. Mustard oil prices are rising gradually as demand is firm and supply is slow. COOIT estimated lowered mustard production at 89.50 Lakh MT compared to 104.5 Lakh MT of Government’s estimates According to Brazilian consultancy AgResource, farmers have harvested 78 percent of area planted under soybean compared to 83 percent at the same point last year. According to cargo surveyor Societe Generale de Surveillance (SGS), Malaysia’s Mar 1-20 palm oil exports fell 0.1 percent to 733,668 tons compared to 734,622 tons for period of Feb 1-20. Top buyers were European Union 199,759 tons (183,949 tons), India at 144,300 tons (84,245 tons), China at 59,100 tons (102,160 tons), Pakistan at 0 tons (0 tons) and United States at 18,630 tons (44,040 tons). Values in brackets are figures of last month. According to Indonesia the trade ministry, Indonesia will charge an export duty of USD 93 per ton on crude palm oil for April, up from $93/Ton tax in March. Reference price of April is set at USD 1093.83 per ton compared to USD 1,026.78 per ton last month. According to the General Administration of Custom, China’s Soybean import from Brazil fell down nearly 80.0 percent on year-on-year basis from 5.15 MT to currently 1.03 MT for January and February months. While, China’s soybean imports from U.S has increased to 11.9 MT compared to 6.1 MT in last year. Overall, China’s import fell 0.8 percent to 13.41 MT from 13.51 MT. According to Argentina Agriculture Ministry, farmers have sold 11.89 million tonnes of yet-to-be-harvested 2020/21 soybeans, as dry weather is affecting crop condition. While, CBOT international lowered as US export demand slows down. According to National Oilseed Processors Association (NOPA), U.S. February soybean crush fell by 15.97 percent m-o- m to 155.158 million bushels from 184.654 million bushels in January 2021, below market expectation. Crush of soybean in February was lower by 9.95 percent y-o-y compared to February 2020 figure of 166.288 million bushels. Soy oil stocks in U.S. at the end of February fell 2.33 percent m-o-m to 1.757 billion lbs compared to 1.799 billion lbs in end January 2020. Stocks of soy oil in end February is down by 8.58 percent y-o-y compared to end February 2020, which was reported at 1.922 million lbs. Soy oil stocks are below trade expectation. According to China's customs office, China’s January and February months’ Soybean imports fell 0.8 percent to 13.41MT from 13.51MT last year. Delayed harvesting of crops and low availability of trucks in Brazil lowered the imports as China’s imports soybean majorly from Brazil. According to cargo surveyor Intertek Testing Services (ITS), Malaysia’s Feb palm oil exports fell 5.5 percent to 1,001,440 tons compared to 1,059,225 tons last month. Top buyers were India & subcontinent 188,780 tons (190,765 tons), European Union 248,385 tons (308,455 tons) and China at 97,610 tons (131,450 tons). Values in brackets are figures of last month. Brazilian consultancy AgResource forecasted Soybean production to reach 129.89 MT in 20/21 despite harvesting delays. This forecast is higher than previous forecast of 128 MT. US Soybean traded lower after expectation of higher harvest. Outlook: Edible oil basket is expected to feature firm tone in near term.
Transcript of Veg. Oil Daily Fundamental Report - Agriwatch

Veg. Oil Daily Fundamental Report 8th Apr 2021
1]]]]]]]]]]]]]]]]]]][
~~~bvc ++++++++++++++ 5hhhhhhhhhhhhhhhhhhhhhh%uvvvvvv 576p[-+++o- ws
Domestic Fundamentals: Edible oil complex featured rising trend at various markets centers on Tuesday.
Soy oil refined domestic prices traded up at various locations. Demand for Soy oil is increasing as mustard arrival in
market is slow. Soy oil International benchmark traded down as crude oil inventory goes up. USDA’s planting acreage is
below at 87.6 Million acres compared to trade expectation of 90 Million acres.
CPO prices closed above than previous day. BMD international benchmark traded down following rival Soy oil. Malaysia
is currently facing labour shortage as migrant workers returned their homes and Malaysia have stopped hiring foreign
workers. Indonesia is expanding their production as they target to increase their biodiesel consumption.
Sunflower oil price is correcting after moving up to level of 1800 Rs and is currently at Rs 1630. Sunoil demand is being substituted to Soy and palm oil as prices are hiked.
Mustard oil prices are rising gradually as demand is firm and supply is slow. COOIT estimated lowered mustard production at 89.50 Lakh MT compared to 104.5 Lakh MT of Government’s estimates
According to Brazilian consultancy AgResource, farmers have harvested 78 percent of area planted under soybean
compared to 83 percent at the same point last year.
According to cargo surveyor Societe Generale de Surveillance (SGS), Malaysia’s Mar 1-20 palm oil exports fell 0.1
percent to 733,668 tons compared to 734,622 tons for period of Feb 1-20. Top buyers were European Union 199,759
tons (183,949 tons), India at 144,300 tons (84,245 tons), China at 59,100 tons (102,160 tons), Pakistan at 0 tons (0 tons)
and United States at 18,630 tons (44,040 tons). Values in brackets are figures of last month.
According to Indonesia the trade ministry, Indonesia will charge an export duty of USD 93 per ton on crude palm oil for
April, up from $93/Ton tax in March. Reference price of April is set at USD 1093.83 per ton compared to USD 1,026.78
per ton last month.
According to the General Administration of Custom, China’s Soybean import from Brazil fell down nearly 80.0 percent on year-on-year basis from 5.15 MT to currently 1.03 MT for January and February months. While, China’s soybean imports from U.S has increased to 11.9 MT compared to 6.1 MT in last year. Overall, China’s import fell 0.8 percent to 13.41 MT from 13.51 MT.
According to Argentina Agriculture Ministry, farmers have sold 11.89 million tonnes of yet-to-be-harvested 2020/21 soybeans, as dry weather is affecting crop condition. While, CBOT international lowered as US export demand slows down.
According to National Oilseed Processors Association (NOPA), U.S. February soybean crush fell by 15.97 percent m-o-
m to 155.158 million bushels from 184.654 million bushels in January 2021, below market expectation. Crush of soybean
in February was lower by 9.95 percent y-o-y compared to February 2020 figure of 166.288 million bushels. Soy oil stocks
in U.S. at the end of February fell 2.33 percent m-o-m to 1.757 billion lbs compared to 1.799 billion lbs in end January
2020. Stocks of soy oil in end February is down by 8.58 percent y-o-y compared to end February 2020, which was
reported at 1.922 million lbs. Soy oil stocks are below trade expectation.
According to China's customs office, China’s January and February months’ Soybean imports fell 0.8 percent to 13.41MT
from 13.51MT last year. Delayed harvesting of crops and low availability of trucks in Brazil lowered the imports as China’s
imports soybean majorly from Brazil.
According to cargo surveyor Intertek Testing Services (ITS), Malaysia’s Feb palm oil exports fell 5.5 percent to 1,001,440
tons compared to 1,059,225 tons last month. Top buyers were India & subcontinent 188,780 tons (190,765 tons),
European Union 248,385 tons (308,455 tons) and China at 97,610 tons (131,450 tons). Values in brackets are figures of
last month.
Brazilian consultancy AgResource forecasted Soybean production to reach 129.89 MT in 20/21 despite harvesting
delays. This forecast is higher than previous forecast of 128 MT. US Soybean traded lower after expectation of higher
harvest.
Outlook: Edible oil basket is expected to feature firm tone in near term.

Veg. Oil Daily Fundamental Report 8th Apr 2021
NCDEX SOY Futures
+/- Open High Low Close Volume Volume Change
OI OI
Change
Apr-20 -21.00 1330.80 1331.90 1304.00 1306.30 16,225 -6375 29520 7045
May-20 -24.10 1318.00 1321.80 1290.50 1292.20 26,720 -7075 25285 -410
Prices & Vol-OI are at 5:30 PM
NSE CDSO Futures
+/- Open High Low Close Volume Volume Change
OI OI
Change
Apr-30 -25.50 1288.40 1291.50 1260.70 1261.30 262 40 26 0
May-31 -23.90 1284.80 1285.10 1254.70 1256.00 368 174 14 6
Prices & Vol-OI are at 5:30 PM
Spot Prices-Futures Prices
Spread Dec-20 Jan-20
Spot
Apr-30 47.7
May-31 -5.3
Spot Prices-Futures Prices
Spread Dec-20 Jan-20
Spot
Apr-20 38.70
May-20 -14.10
MCX CPO Futures
+/- Open High Low Close Volume Volume Change
OI OI
Change
Apr-30 -13.00 1150.00 1151.50 1131.00 1134.10 1831 -1306 5893 -137
May-31 -15.50 1109.00 1112.90 1092.30 1094.30 1152 -776 2863 313
Prices & Vol-OI are at 5:30 PM

Veg. Oil Daily Fundamental Report 8th Apr 2021
Forex:
Date/Currency Chinese
Yuan Indonesian
Rupiah Malaysian
Ringgit Argentine
Peso Indian rupee
Brazilian Real
Dollar Index
Crude Oil WTI
($/barrel)
7/04/2021 6.54 14,566 4.14 92.25 73.23 5.61 92.38 59.57
Edible Oil Prices at key Markets:
Commodity Centre
Prices (Per 10 Kg) Chan
ge 7-Apr-21
6-Apr-21
Refined Soybean Oil
Indore 1345 1330 15
Indore (Soy Solvent Crude) 1280 1280 Unch
Mumbai 1320 1320 Unch
Mumbai (Soy Degum) 1310 1300 10
Kandla/Mundra 1330 1325 5
Kandla/Mundra (Soy Degum) 1300 1295 5
Kolkata 1350 1350 Unch
Delhi 1347 1347 Unch
Nagpur 1270 1270 Unch
Rajkot 1310 1310 Unch
Kota 1350 1350 Unch
Hyderabad NA NA -
Akola 1320 1320 Unch
Amrawati 1315 1315 Unch
Bundi 1360 1360 Unch
Jalna 1260 1260 Unch
CBOT Soy Oil Futures (Projections): (Values in US cents/lb)
Contract +/- Open High Low Close
May 0.16 52.85 53.01 52.63 52.69
Jul 0.11 51.00 51.18 50.82 50.89
Aug 0.13 49.29 49.45 49.24 49.24 Sep 0.17 48.11 48.32 48.04 48.04
Oct 0.03 47.54 47.54 47.37 47.46
Spot Prices-Futures Prices
Spread Nov-20 Dec-20
Spot
Apr-30 45.9
May-31 -39.8
Dec-31
BMD CPO Futures: (Values in MYR/tonnes)
Contract +/- Open High Low Close
Apr 12.0 4270 4270 4211 4270
May 55.0 4031 4045 4012 4025
Jun 66.0 3805 3808 3768 3779
Jul 70.0 3629 3630 3591 3596
Veg. Oil Daily Fundamental Report 8th Apr 2021
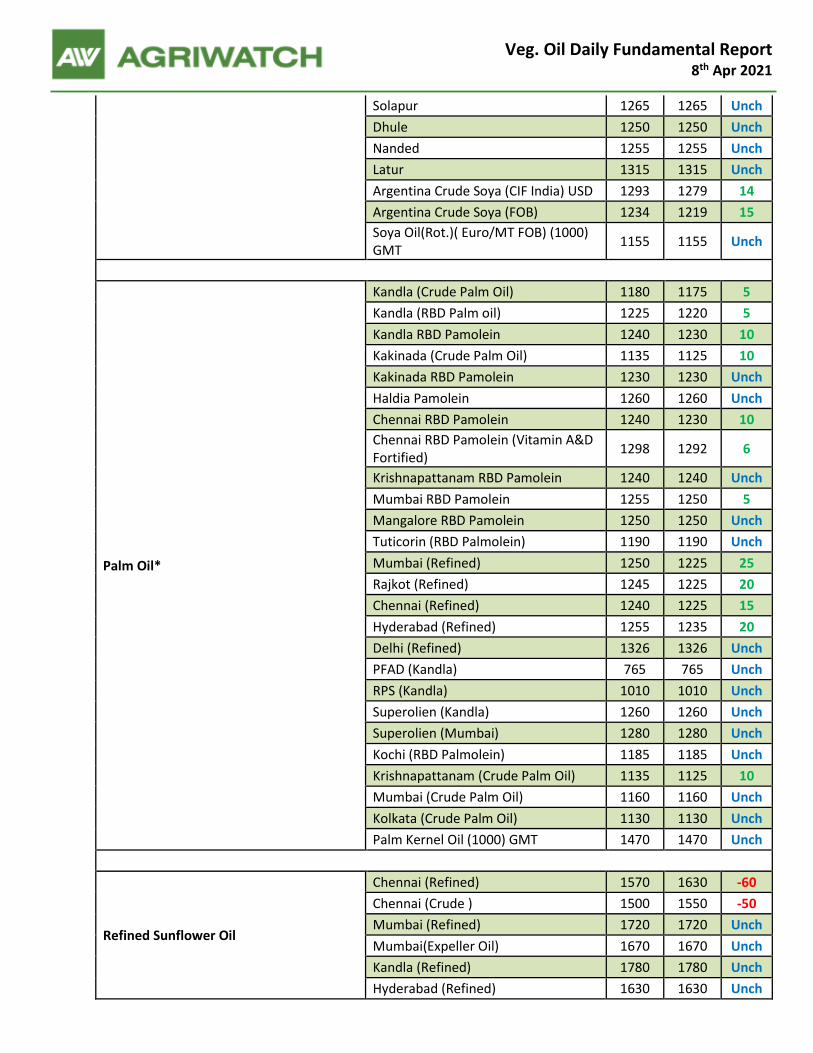
Solapur 1265 1265 Unch
Dhule 1250 1250 Unch
Nanded 1255 1255 Unch
Latur 1315 1315 Unch
Argentina Crude Soya (CIF India) USD 1293 1279 14
Argentina Crude Soya (FOB) 1234 1219 15
Soya Oil(Rot.)( Euro/MT FOB) (1000) GMT
1155 1155 Unch
Palm Oil*
Kandla (Crude Palm Oil) 1180 1175 5
Kandla (RBD Palm oil) 1225 1220 5
Kandla RBD Pamolein 1240 1230 10
Kakinada (Crude Palm Oil) 1135 1125 10
Kakinada RBD Pamolein 1230 1230 Unch
Haldia Pamolein 1260 1260 Unch
Chennai RBD Pamolein 1240 1230 10
Chennai RBD Pamolein (Vitamin A&D Fortified)
1298 1292 6
Krishnapattanam RBD Pamolein 1240 1240 Unch
Mumbai RBD Pamolein 1255 1250 5
Mangalore RBD Pamolein 1250 1250 Unch
Tuticorin (RBD Palmolein) 1190 1190 Unch
Mumbai (Refined) 1250 1225 25
Rajkot (Refined) 1245 1225 20
Chennai (Refined) 1240 1225 15
Hyderabad (Refined) 1255 1235 20
Delhi (Refined) 1326 1326 Unch
PFAD (Kandla) 765 765 Unch
RPS (Kandla) 1010 1010 Unch
Superolien (Kandla) 1260 1260 Unch
Superolien (Mumbai) 1280 1280 Unch
Kochi (RBD Palmolein) 1185 1185 Unch
Krishnapattanam (Crude Palm Oil) 1135 1125 10
Mumbai (Crude Palm Oil) 1160 1160 Unch
Kolkata (Crude Palm Oil) 1130 1130 Unch
Palm Kernel Oil (1000) GMT 1470 1470 Unch
Refined Sunflower Oil
Chennai (Refined) 1570 1630 -60
Chennai (Crude ) 1500 1550 -50
Mumbai (Refined) 1720 1720 Unch
Mumbai(Expeller Oil) 1670 1670 Unch
Kandla (Refined) 1780 1780 Unch
Hyderabad (Refined) 1630 1630 Unch

Veg. Oil Daily Fundamental Report 8th Apr 2021
Hyderabad (Expeller) 1550 1550 Unch
Latur (Refined) 1590 1620 -30
Latur (Expeller Oil) 1530 1560 -30
Chellakere (Expeller Oil) 1500 1530 -30
Erode (Expeller Oil) 1670 1650 20
Kakinada (Refined) 1650 1700 -50
Krishna Pattanam (Refined) 1650 1700 -50
Delhi (Refined) NR NR -
Sun Oil (Rotterdem) NR NR -
Groundnut Oil
Rajkot 1600 1550 50
Chennai 1600 1580 20
Delhi 1560 1560 Unch
Hyderabad * 1600 1570 30
Mumbai 1630 1610 20
Gondal 1600 1550 50
Jamnagar 1600 1550 50
Gujarat GN Telia 2520 2500 20
Rapeseed Oil/Mustard Oil
Jaipur (Expeller Oil) 1270 1270 Unch
Jaipur (Kacchi Ghani Oil) 1325 1325 Unch
Kota (Expeller Oil) 1250 1250 Unch
Kota (Kacchi Ghani Oil) 1320 1320 Unch
Neewai (Expeller Oil) 1275 1275 Unch
Neewai (Kacchi Ghani Oil) 1305 1305 Unch
Bharatpur (Kacchi Ghani Oil) 1320 1250 70
Sri-Ganga Nagar(Exp Oil) 1280 1280 Unch
Sri-Ganga Nagar (Kacchi Ghani Oil) 1310 1310 Unch
Mumbai (Expeller Oil) 1290 1270 20
Kolkata(Expeller Oil) 1450 1450 Unch
New Delhi (Expeller Oil) 1230 1230 Unch
Hapur (Expeller Oil) 1310 1290 20
Hapur (Kacchi Ghani Oil) 1340 1320 20
Agra (Kacchi Ghani Oil) 1325 1255 70
Nagpur (Expeller Oil) 1367 1367 Unch
Refined Cottonseed Oil
Rajkot 1360 1350 10
Hyderabad 1360 1340 20
Mumbai 1365 1360 5
New Delhi 1260 1260 Unch
Gujarat Cotton Wash 1335 1328 7
Coconut Oil Kangayan (Crude) 2000 2000 Unch

Veg. Oil Daily Fundamental Report 8th Apr 2021
Cochin 2230 2230 Unch
Coconut Oil(Rot.)(Phil/Indo) NR NR -
Vanaspati Oil
Uttar Pradesh 1690 1690 Unch
Kolkata 1600 1600 Unch
Rajkot 1823 1823 Unch
Sesame Oil New Delhi 1410 1410 Unch
Mumbai NA NA -
Kardi Mumbai NA NA -
Rice Bran Oil
New Delhi (40%) 985 985 Unch
Punjab 4%) 1180 1200 -20
Bhatinda (Crude 4%) 1030 1030 Unch
Bhatinda (Refined 4%) 1145 1145 Unch
Hyderabad (Crude) 1110 1110 Unch
Hyderabad (Refined) 1270 1270 Unch
Kolkata (Crude) 1070 1070 Unch
Kolkata (Refined) 1170 1170 Unch
Raipur (Crude) 960 960 Unch
Raipur (Refined) 1150 1150 Unch
Odisha (Refined) 1135 1135 Unch
Vijayawada (Refined) 1070 1070 Unch
Malaysia Palmolein USD/MT FOB 1070 1057 13
CNF India 1128 1118 10
Indonesia CPO USD/MT FOB 1113 1105 8
CNF India 1150 1140 10
RBD Palm oil (Malaysia Origin USD/MT) FOB 1068 1068 Unch
RBD Palm Stearin (Malaysia Origin USD/MT)
FOB 1055 1055 Unch
RBD Palm Kernel Oil (Malaysia Origin USD/MT)
FOB 1450 1450 Unch
Palm Fatty Acid Distillate (Malaysia Origin USD/MT)
FOB 980 980 Unch
Crude palm Kernel Oil India (USD/MT) CNF India 1530 1530 Unch
Ukraine Origin CSFO USD/MT Kandla CIF 1595 1590 5
Rapeseed Oil Rotterdam Euro/MT FOB 1080 1080 Unch
Argentina FOB ($/MT) 6-Apr-
21 5-Apr-
21 Chan
ge
Crude Soybean Oil Ship 1240 1220 20
Refined Soy Oil (Bulk) Ship 1283 1263 20
Sunflower Oil Ship 1500 1510 -10
Cottonseed Oil Ship 1220 1200 20

Veg. Oil Daily Fundamental Report 8th Apr 2021
Refined Linseed Oil (Bulk) Ship NA NA -
* indicates including GST Note - Domestic edible oil prices are in Indian rupees per 10 Kg, CNF/FOB/CIF prices are in USD per tons except Rapeseed oil Rotterdam (Euro per tons).
Disclaimer
The information and opinions contained in the document have been compiled from sources believed to be reliable. The company does not warrant its accuracy, completeness and correctness. Use of data and information contained in this report is at your own risk. This document is not, and should not be construed as, an offer to sell or solicitation to buy any commodities. This document may not be reproduced, distributed or published, in whole or in part, by any recipient hereof for any purpose without prior permission from the Company. IASL and its affiliates and/or their officers, directors and employees may have positions in any commodities mentioned in this document (or in any related investment) and may from time to time add to or dispose of any such commodities (or investment). Please see the detailed disclaimer at ©http://www.agriwatch.com/disclaimer.php 2021 Indian Agribusiness Systems Ltd.