Vectors for Multi-Color Bimolecular Fluorescence ...
12
Purdue University Purdue e-Pubs Department of Biological Sciences Faculty Publications Department of Biological Sciences 10-15-2008 Vectors for Multi-Color Bimolecular Fluorescence Complementation to Investigate Protein-Protein Interactions in Living Plant Cells Lan-Ying Lee Purdue University, [email protected] Mei-Jane Fang Lin-Yun Kuang Stanton B. Gelvin Purdue University, [email protected] Follow this and additional works at: hp://docs.lib.purdue.edu/bioscipubs is document has been made available through Purdue e-Pubs, a service of the Purdue University Libraries. Please contact [email protected] for additional information. Recommended Citation Lee, Lan-Ying; Fang, Mei-Jane; Kuang, Lin-Yun; and Gelvin, Stanton B., "Vectors for Multi-Color Bimolecular Fluorescence Complementation to Investigate Protein-Protein Interactions in Living Plant Cells" (2008). Department of Biological Sciences Faculty Publications. Paper 27. hp://dx.doi.org/10.1186/1746-4811-4-24
Transcript of Vectors for Multi-Color Bimolecular Fluorescence ...
Purdue UniversityPurdue e-PubsDepartment of Biological Sciences FacultyPublications Department of Biological Sciences
10-15-2008
Vectors for Multi-Color Bimolecular FluorescenceComplementation to Investigate Protein-ProteinInteractions in Living Plant CellsLan-Ying LeePurdue University, [email protected]
Mei-Jane Fang
Lin-Yun Kuang
Stanton B. GelvinPurdue University, [email protected]
Follow this and additional works at: http://docs.lib.purdue.edu/bioscipubs
This document has been made available through Purdue e-Pubs, a service of the Purdue University Libraries. Please contact [email protected] foradditional information.
Recommended CitationLee, Lan-Ying; Fang, Mei-Jane; Kuang, Lin-Yun; and Gelvin, Stanton B., "Vectors for Multi-Color Bimolecular FluorescenceComplementation to Investigate Protein-Protein Interactions in Living Plant Cells" (2008). Department of Biological Sciences FacultyPublications. Paper 27.http://dx.doi.org/10.1186/1746-4811-4-24
BioMed Central
Page 1 of 11(page number not for citation purposes)
Plant Methods
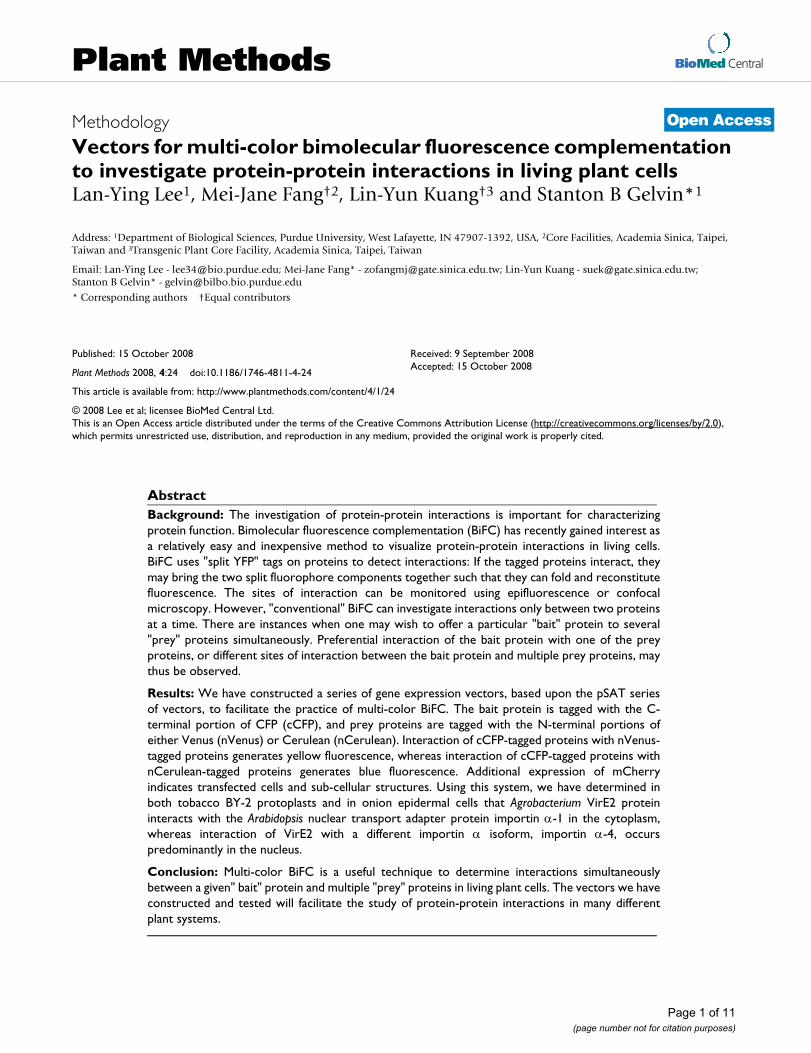
Open AccessMethodologyVectors for multi-color bimolecular fluorescence complementation to investigate protein-protein interactions in living plant cellsLan-Ying Lee1, Mei-Jane Fang†2, Lin-Yun Kuang†3 and Stanton B Gelvin*1
Address: 1Department of Biological Sciences, Purdue University, West Lafayette, IN 47907-1392, USA, 2Core Facilities, Academia Sinica, Taipei, Taiwan and 3Transgenic Plant Core Facility, Academia Sinica, Taipei, Taiwan
Email: Lan-Ying Lee - [email protected]; Mei-Jane Fang* - [email protected]; Lin-Yun Kuang - [email protected]; Stanton B Gelvin* - [email protected]
* Corresponding authors †Equal contributors
AbstractBackground: The investigation of protein-protein interactions is important for characterizingprotein function. Bimolecular fluorescence complementation (BiFC) has recently gained interest asa relatively easy and inexpensive method to visualize protein-protein interactions in living cells.BiFC uses "split YFP" tags on proteins to detect interactions: If the tagged proteins interact, theymay bring the two split fluorophore components together such that they can fold and reconstitutefluorescence. The sites of interaction can be monitored using epifluorescence or confocalmicroscopy. However, "conventional" BiFC can investigate interactions only between two proteinsat a time. There are instances when one may wish to offer a particular "bait" protein to several"prey" proteins simultaneously. Preferential interaction of the bait protein with one of the preyproteins, or different sites of interaction between the bait protein and multiple prey proteins, maythus be observed.
Results: We have constructed a series of gene expression vectors, based upon the pSAT seriesof vectors, to facilitate the practice of multi-color BiFC. The bait protein is tagged with the C-terminal portion of CFP (cCFP), and prey proteins are tagged with the N-terminal portions ofeither Venus (nVenus) or Cerulean (nCerulean). Interaction of cCFP-tagged proteins with nVenus-tagged proteins generates yellow fluorescence, whereas interaction of cCFP-tagged proteins withnCerulean-tagged proteins generates blue fluorescence. Additional expression of mCherryindicates transfected cells and sub-cellular structures. Using this system, we have determined inboth tobacco BY-2 protoplasts and in onion epidermal cells that Agrobacterium VirE2 proteininteracts with the Arabidopsis nuclear transport adapter protein importin -1 in the cytoplasm,whereas interaction of VirE2 with a different importin isoform, importin -4, occurspredominantly in the nucleus.
Conclusion: Multi-color BiFC is a useful technique to determine interactions simultaneouslybetween a given" bait" protein and multiple "prey" proteins in living plant cells. The vectors we haveconstructed and tested will facilitate the study of protein-protein interactions in many differentplant systems.
Published: 15 October 2008
Plant Methods 2008, 4:24 doi:10.1186/1746-4811-4-24
Received: 9 September 2008Accepted: 15 October 2008
This article is available from: http://www.plantmethods.com/content/4/1/24
© 2008 Lee et al; licensee BioMed Central Ltd. This is an Open Access article distributed under the terms of the Creative Commons Attribution License (http://creativecommons.org/licenses/by/2.0), which permits unrestricted use, distribution, and reproduction in any medium, provided the original work is properly cited.
Plant Methods 2008, 4:24 http://www.plantmethods.com/content/4/1/24
Page 2 of 11(page number not for citation purposes)
BackgroundVisualization of protein-protein interactions in living cellshas become an increasingly important tool for definingprotein function and the "web" of proteins constitutingthe "interactome" [1]. Although in vivo protein-proteininteractions have been investigated using FRET, BRET,TAP-tagging, and co-immunoprecipitation [2,3], bimo-lecular fluorescence complementation (BiFC) has morerecently added a new technique to the arsenal of measuresused to investigate protein-protein interactions. BiFC usesreconstitution of fluorescence from a "split fluorophore"to visualize interaction between two tagged proteins [4,5].The Aequorea green fluorescent protein (GFP) or its wave-length-shifted derivatives can be split in several differentplaces (e.g., between amino acids 154 and 155, orbetween amino acids 173 and 174). Neither the N-termi-nal nor C-terminal fragments (either alone or affixed as atranslational fusion to other proteins) fluoresces. How-ever, when brought together by interaction of the twoaffixed proteins, these GFP fragments may fold and recon-stitute a fluorescent molecule [4]. Several BiFC systemshave recently been described for use in plants [6-8]. Bhatet al. [3] and Ohad et al. [9] have recently reviewed the useof BiFC in plants.
BiFC is conventionally used to visualize the interaction oftwo proteins. However, there may be instances in whichinvestigators may wish simultaneously to visualize poten-tial interactions between a "bait" protein and a number of"prey" proteins. This can best be accomplished if each ofthe prey proteins are tagged with different GFP derivativeprotein fragments that, when reconstituted with the com-plementary protein fragment, will fluoresce at differentwavelengths. Such "multi-color BiFC" reactions were firstdescribed by Hu and Kerppola [10] to visualize interac-tions among domains of different bZIP transcription fac-tors in animal cells.
In this paper, we describe a series of expression vectors tofacilitate the use of multi-color BiFC in plant cells. As anexample to demonstrate how multi-color BiFC can beused to distinguish different sub-cellular sites of interac-tion between a bait protein and multiple prey proteins, wehave investigated simultaneous interactions betweenAgrobacterium VirE2 protein and two Arabidopsis nucleartransport importin adapter proteins, AtImpa-1 (impor-tin -1) and AtImpa-4 (importin -4).
Results and discussionGeneration of multi-color BiFC vectorsTo facilitate the use of multi-color BiFC in plants, weadapted a previously-described series of pSAT vectors [8].The pSAT vectors [11] are built in modular fashion, withrare-cutting restriction endonuclease or homing endonu-clease sites surrounding an "expression cassette". Each
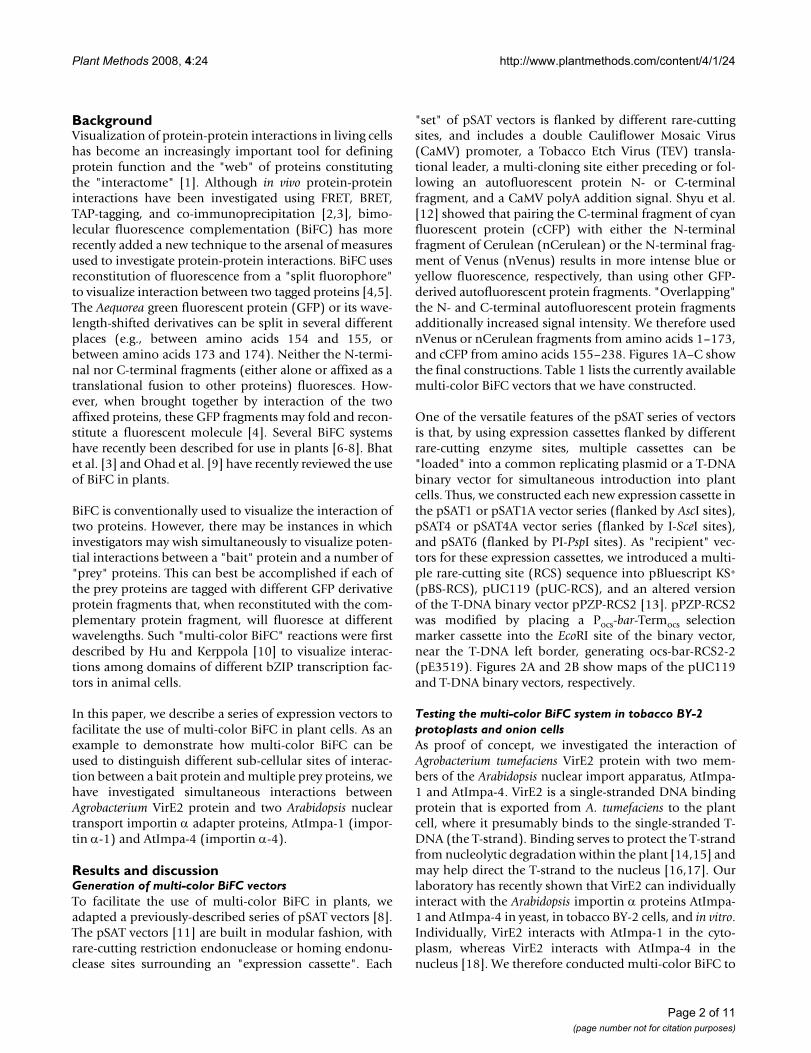
"set" of pSAT vectors is flanked by different rare-cuttingsites, and includes a double Cauliflower Mosaic Virus(CaMV) promoter, a Tobacco Etch Virus (TEV) transla-tional leader, a multi-cloning site either preceding or fol-lowing an autofluorescent protein N- or C-terminalfragment, and a CaMV polyA addition signal. Shyu et al.[12] showed that pairing the C-terminal fragment of cyanfluorescent protein (cCFP) with either the N-terminalfragment of Cerulean (nCerulean) or the N-terminal frag-ment of Venus (nVenus) results in more intense blue oryellow fluorescence, respectively, than using other GFP-derived autofluorescent protein fragments. "Overlapping"the N- and C-terminal autofluorescent protein fragmentsadditionally increased signal intensity. We therefore usednVenus or nCerulean fragments from amino acids 1–173,and cCFP from amino acids 155–238. Figures 1A–C showthe final constructions. Table 1 lists the currently availablemulti-color BiFC vectors that we have constructed.
One of the versatile features of the pSAT series of vectorsis that, by using expression cassettes flanked by differentrare-cutting enzyme sites, multiple cassettes can be"loaded" into a common replicating plasmid or a T-DNAbinary vector for simultaneous introduction into plantcells. Thus, we constructed each new expression cassette inthe pSAT1 or pSAT1A vector series (flanked by AscI sites),pSAT4 or pSAT4A vector series (flanked by I-SceI sites),and pSAT6 (flanked by PI-PspI sites). As "recipient" vec-tors for these expression cassettes, we introduced a multi-ple rare-cutting site (RCS) sequence into pBluescript KS+
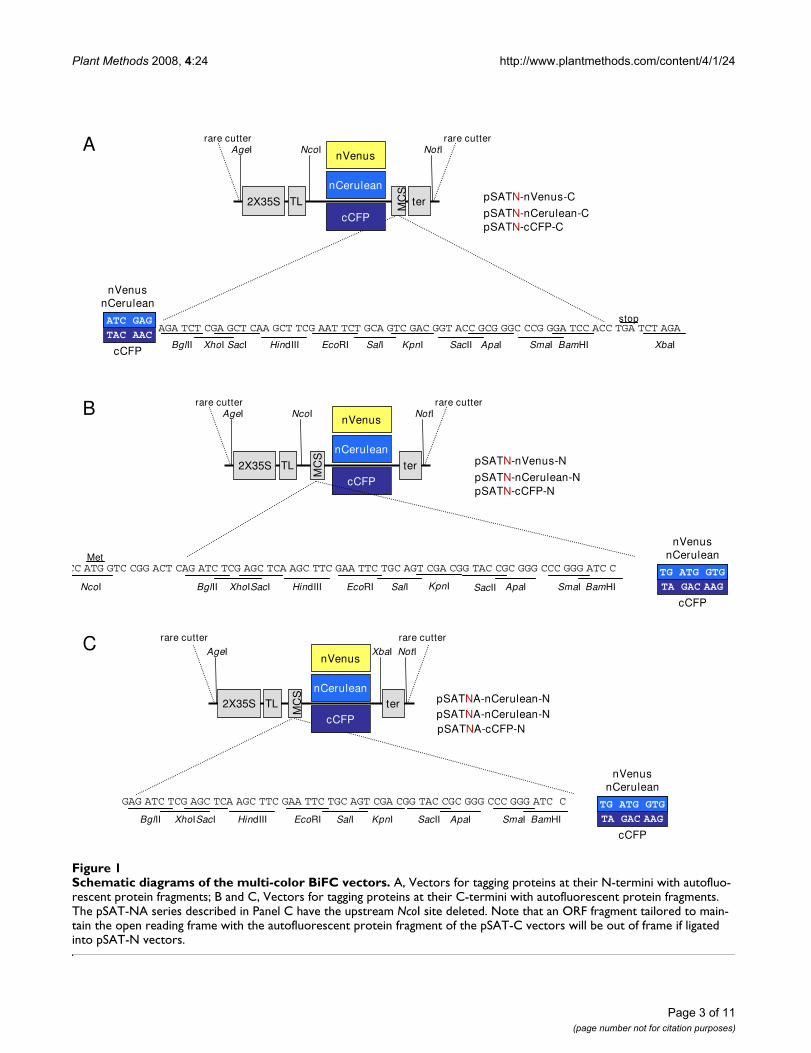
(pBS-RCS), pUC119 (pUC-RCS), and an altered versionof the T-DNA binary vector pPZP-RCS2 [13]. pPZP-RCS2was modified by placing a Pocs-bar-Termocs selectionmarker cassette into the EcoRI site of the binary vector,near the T-DNA left border, generating ocs-bar-RCS2-2(pE3519). Figures 2A and 2B show maps of the pUC119and T-DNA binary vectors, respectively.
Testing the multi-color BiFC system in tobacco BY-2 protoplasts and onion cellsAs proof of concept, we investigated the interaction ofAgrobacterium tumefaciens VirE2 protein with two mem-bers of the Arabidopsis nuclear import apparatus, AtImpa-1 and AtImpa-4. VirE2 is a single-stranded DNA bindingprotein that is exported from A. tumefaciens to the plantcell, where it presumably binds to the single-stranded T-DNA (the T-strand). Binding serves to protect the T-strandfrom nucleolytic degradation within the plant [14,15] andmay help direct the T-strand to the nucleus [16,17]. Ourlaboratory has recently shown that VirE2 can individuallyinteract with the Arabidopsis importin proteins AtImpa-1 and AtImpa-4 in yeast, in tobacco BY-2 cells, and in vitro.Individually, VirE2 interacts with AtImpa-1 in the cyto-plasm, whereas VirE2 interacts with AtImpa-4 in thenucleus [18]. We therefore conducted multi-color BiFC to
Plant Methods 2008, 4:24 http://www.plantmethods.com/content/4/1/24
Page 3 of 11(page number not for citation purposes)
Schematic diagrams of the multi-color BiFC vectorsFigure 1Schematic diagrams of the multi-color BiFC vectors. A, Vectors for tagging proteins at their N-termini with autofluo-rescent protein fragments; B and C, Vectors for tagging proteins at their C-termini with autofluorescent protein fragments. The pSAT-NA series described in Panel C have the upstream NcoI site deleted. Note that an ORF fragment tailored to main-tain the open reading frame with the autofluorescent protein fragment of the pSAT-C vectors will be out of frame if ligated into pSAT-N vectors.
C
2X35S
AgeI
TL
MC
S
ter
XbaI NotI
rare cutter rare cutter
nCerulean
pSATNA-nCerulean-NpSATNA-cCFP-N
pSATNA-nCerulean-NnCerulean
nVenus
cCFP
BglII SacI EcoRI SalI KpnI SacII ApaI SmaI BamHIHindIIIXhoI
cCFP
nVenusnCerulean
TA GAC AAG
TG ATG GTGGAG ATC TCG AGC TCA AGC TTC GAA TTC TGC AGT CGA CGG TAC CGC GGG CCC GGG ATC C
A
pSATN-nVenus-C
pSATN-nCerulean-CpSATN-cCFP-C
TL2X35S
AgeI NcoI
MC
S
ter
NotIrare cutter rare cutter
nCerulean
nVenus
cCFP
TAC AAG AGA TCT CGA GCT CAA GCT TCG AAT TCT GCA GTC GAC GGT ACC GCG GGC CCG GGA TCC ACC TGA TCT AGAstop
BglII SacI EcoRI SalI KpnI ApaI BamHI XbaIXhoI HindIII SacII SmaIcCFP
nVenusnCerulean
ATC GAG
TAC AAC
B
CC ATG GTC CGG ACT CAG ATC TCG AGC TCA AGC TTC GAA TTC TGC AGT CGA CGG TAC CGC GGG CCC GGG ATC C Met
BglII XhoISacI HindIII EcoRI SalI KpnI SacII ApaI SmaI BamHINcoI
pSATN-nVenus-N
pSATN-nCerulean-NpSATN-cCFP-N
TL2X35S
AgeI NcoI
MC
S
ter
NotIrare cutter rare cutter
nCerulean
nVenus
cCFP
cCFP
nVenusnCerulean
TG ATG GTG
TA GAC AAG
Plant Methods 2008, 4:24 http://www.plantmethods.com/content/4/1/24
Page 4 of 11(page number not for citation purposes)
determine whether, using this technique, the sub-cellularsite of VirE2 interaction with these two importin iso-forms yielded the same results as we had previously deter-mined using individual AtImpa isoforms.
We tagged VirE2 on its C-terminus with cCFP (VirE2-cCFP) in the pSAT1-derived plasmid. Similarly, we taggedAtImpa-1 and AtImpa-4 at their C-termini. Proteinstagged with nVenus were in pSAT4-derived vectors,whereas proteins tagged with nCerulean were in pSAT6-derived vectors. Additionally, we constructed a full-lengthmCherry expression vector in pRTL2 [19], and an expres-sion vector containing mCherry-VirD2NLS in pSAT6.Both of these mCherry genes were placed under the con-trol of a double CaMV 35S promoter. mCherry localizes toboth the nucleus and to the cytoplasm of cells, whereasmCherry-VirD2NLS localizes predominantly to thenucleus [8]. Various combinations of expression cassettes,encoding VirE2, AtImpa-1, and AtImpa-4, were insertedinto the corresponding sites of pBluescript-RCS and intro-duced into tobacco BY-2 suspension cells by electropora-tion or direct DNA uptake, and into onion cells by particlebombardment. In addition, we co-transfected either amCherry or a mCherry-VirD2NLS expression cassette to
indicate which cells were transfected, and to distinguishvarious sub-cellular compartments. Experiments in whichthe VirE2 and AtImpa constructions were co-transfected inthe absence of the mCherry markers indicated that expres-sion of mCherry in cells did not alter the sub-cellular sitesof localization of the BiFC interaction (data not shown).
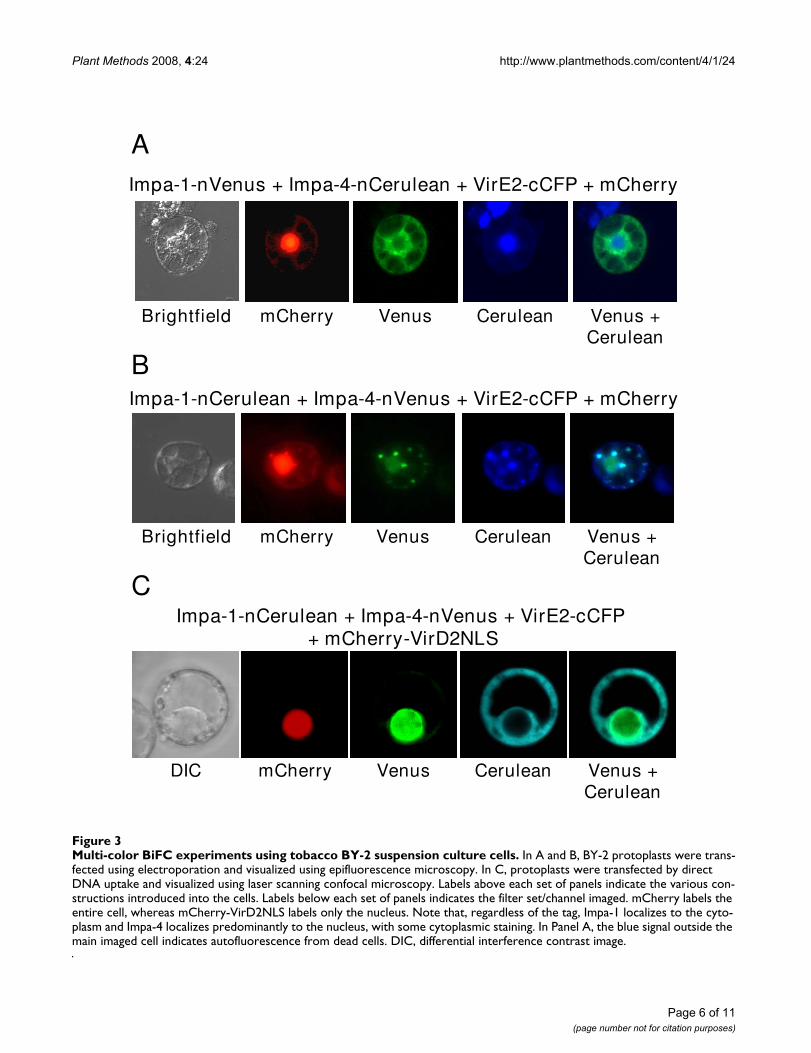
Figure 3 shows results of the tobacco BY-2 transfectionassays, as visualized both by epifluorescence and confocalmicroscopy. AtImpa-1-nVenus interacted with VirE2-cCFPin the cytoplasm, whereas AtImpa-4 simultaneously inter-acted with VirE2-nCerulean. This latter interactionoccurred predominantly in the nucleus, but also weakly inthe cytoplasm (see Figure 3A, fourth panel and Figures 3Band 3C, third panels). Nuclear localization of AtImpa-4was confirmed by co-localization of the nuclear markermCherry-VirD2NLS.
To assure that the sub-cellular sites of interaction trulyreflected properties of the test proteins and not those ofthe autofluorescent protein tags, we "switched" the tags:AtImpa-1 was now tagged with nCerulean, and AtImpa-4with nVenus. AtImpa-1-nCerulean continued to interactwith VirE2-cCFP in the cytoplasm, whereas AtImpa-4-
Table 1: Multi-color BiFC Vectors
Gelvin lab stock number Plasmid name Autofluorescent protein fragment
Rare-cutting site flanking cassette
Protein fusiona
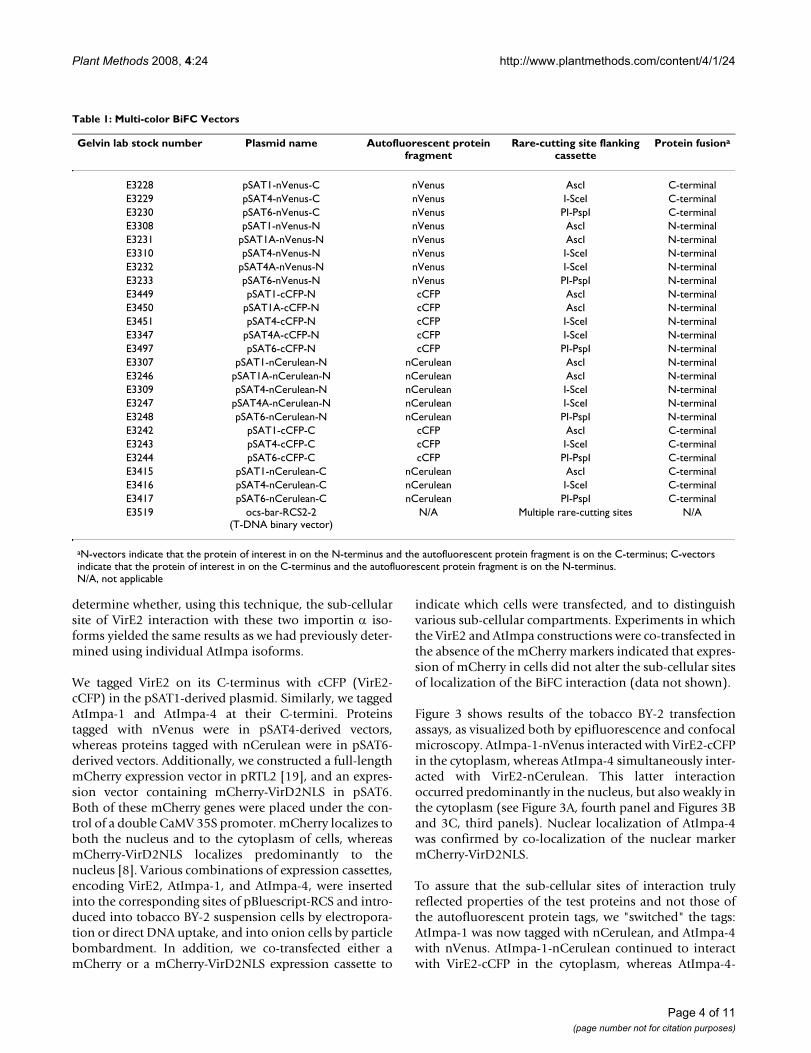
E3228 pSAT1-nVenus-C nVenus AscI C-terminalE3229 pSAT4-nVenus-C nVenus I-SceI C-terminalE3230 pSAT6-nVenus-C nVenus PI-PspI C-terminalE3308 pSAT1-nVenus-N nVenus AscI N-terminalE3231 pSAT1A-nVenus-N nVenus AscI N-terminalE3310 pSAT4-nVenus-N nVenus I-SceI N-terminalE3232 pSAT4A-nVenus-N nVenus I-SceI N-terminalE3233 pSAT6-nVenus-N nVenus PI-PspI N-terminalE3449 pSAT1-cCFP-N cCFP AscI N-terminalE3450 pSAT1A-cCFP-N cCFP AscI N-terminalE3451 pSAT4-cCFP-N cCFP I-SceI N-terminalE3347 pSAT4A-cCFP-N cCFP I-SceI N-terminalE3497 pSAT6-cCFP-N cCFP PI-PspI N-terminalE3307 pSAT1-nCerulean-N nCerulean AscI N-terminalE3246 pSAT1A-nCerulean-N nCerulean AscI N-terminalE3309 pSAT4-nCerulean-N nCerulean I-SceI N-terminalE3247 pSAT4A-nCerulean-N nCerulean I-SceI N-terminalE3248 pSAT6-nCerulean-N nCerulean PI-PspI N-terminalE3242 pSAT1-cCFP-C cCFP AscI C-terminalE3243 pSAT4-cCFP-C cCFP I-SceI C-terminalE3244 pSAT6-cCFP-C cCFP PI-PspI C-terminalE3415 pSAT1-nCerulean-C nCerulean AscI C-terminalE3416 pSAT4-nCerulean-C nCerulean I-SceI C-terminalE3417 pSAT6-nCerulean-C nCerulean PI-PspI C-terminalE3519 ocs-bar-RCS2-2
(T-DNA binary vector)N/A Multiple rare-cutting sites N/A
aN-vectors indicate that the protein of interest in on the N-terminus and the autofluorescent protein fragment is on the C-terminus; C-vectors indicate that the protein of interest in on the C-terminus and the autofluorescent protein fragment is on the N-terminus.N/A, not applicable
Plant Methods 2008, 4:24 http://www.plantmethods.com/content/4/1/24
Page 5 of 11(page number not for citation purposes)
nVenus interacted with VirE2-cCFP predominantly in thenucleus. Thus, the sub-cellular site of interaction was afunction of the test proteins and not of the autofluores-cent tag.
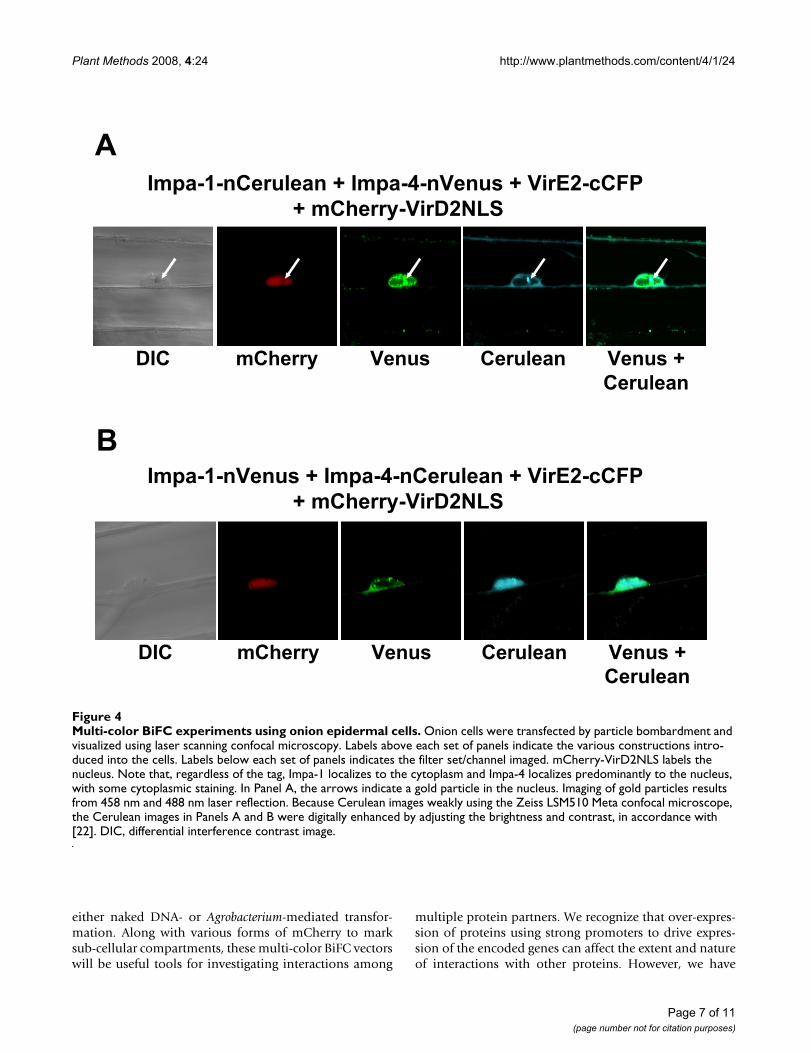
Although A. tumefaciens can infect a wide variety of plants,including monocots [20], dicotyledonous plants such astobacco are more "natural" hosts (i.e., plants which candevelop Crown Gall disease). We therefore were inter-ested in determining whether Agrobacterium VirE2 proteincould interact with Arabidopsis importin proteins inonion, which is not a natural Agrobacterium host. Weintroduced the various combinations of tagged protein-coding genes into onion epidermal cells by particle bom-bardment and visualized the sub-cellular sites of interac-tion using laser scanning confocal microscopy. Figure 4shows that, as in tobacco BY-2 cells, VirE2 interacted withAtImpa-1 in the onion cytoplasm, and with AtImpa-4 pre-dominantly in the onion nucleus. These experiments indi-cate that the sub-cellular sites of interaction of theseproteins are not altered by the particular host, nor by themethod of transgene delivery into these hosts.
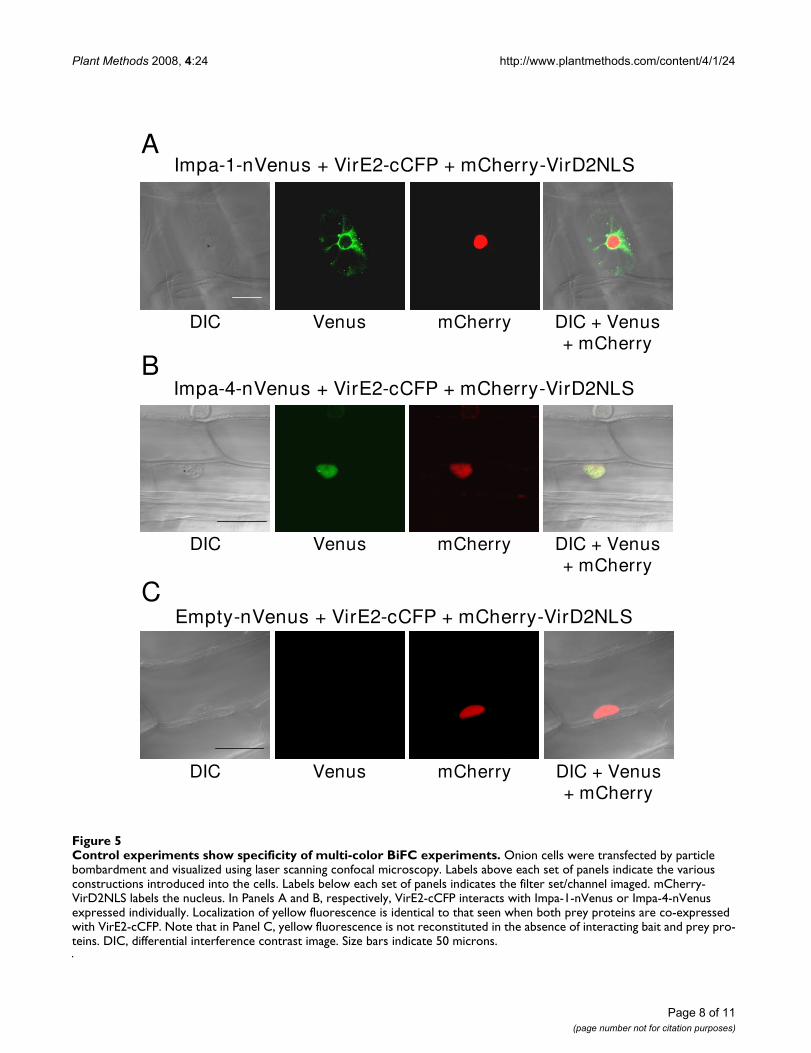
To assure that, using these vectors, interaction of a baitprotein in the presence of multiple prey proteins does notdiffer from interaction of a bait protein in the presence ofa single prey protein, we co-expressed VirE2-cCFP with
either AtImpa-1 or AtImpa4. Figures 5A and 5B show that,as described above, VirE2 interacts with AtImpa-1 in thecytoplasm and with AtImpa-4 predominantly in thenucleus of bombarded onion cells. In addition, we testedwhether fluorescence complementation could occur inthe absence of interacting bait and prey proteins. Figure5C shows that when VirE2-cCFP was co-expressed withnVenus (empty-nVenus), no yellow fluorescence wasobserved. To assure that the onion cells had received thevarious BiFC constructs, we included in this latter controlexperiment a mCherry-VirD2NLS expression constructcloned into the same vector as the BiFC expression cas-settes. Red fluorescence was detected and localized to thenucleus, indicating that the onion cell had received thevarious BiFC constructs. Thus, we did not detect reconsti-tuted yellow fluorescence in the absence of appropriatelytagged bait and prey proteins.
ConclusionWe have designed and tested a set of vectors that will be auseful tool for scientists to investigate protein-proteininteractions in living plant cells. Proteins of interest canreadily be tagged with a number of autofluorescent pro-tein fragments in gene expression cassettes. These cassettescan simultaneously be introduced into plants as separateplasmids, or "loaded" in different combinations into acommon plasmid for introduction into plant cells using
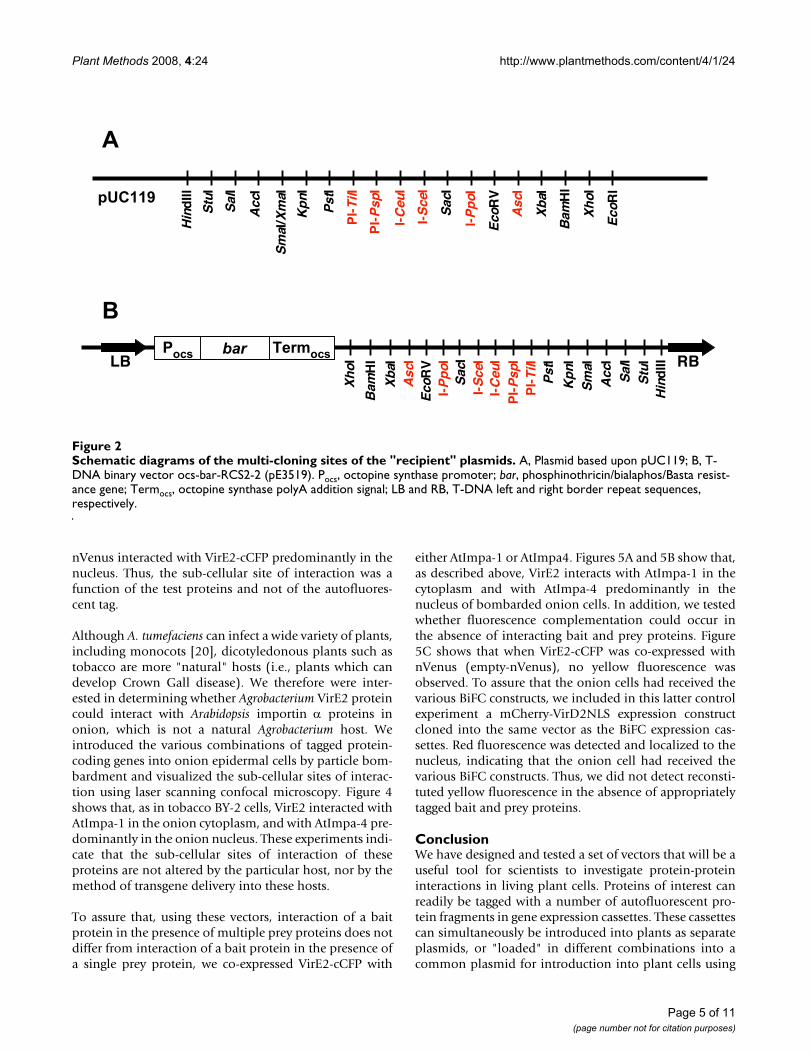
Schematic diagrams of the multi-cloning sites of the "recipient" plasmidsFigure 2Schematic diagrams of the multi-cloning sites of the "recipient" plasmids. A, Plasmid based upon pUC119; B, T-DNA binary vector ocs-bar-RCS2-2 (pE3519). Pocs, octopine synthase promoter; bar, phosphinothricin/bialaphos/Basta resist-ance gene; Termocs, octopine synthase polyA addition signal; LB and RB, T-DNA left and right border repeat sequences, respectively.
Hin
dIII
Stu
I
Sal
I
Acc
I
Sm
aI/X
maI
Kpn
I
Pst
I
PI-
TilI
PI-
Psp
I
I-C
euI
I-S
ceI
Sac
I
I-P
poI
Eco
RV
Asc
I
Xba
I
Bam
HI
Xho
I
Eco
RI
A
pUC119
B
LB RBPocs bar Termocs
Sm
aI
Sal
IA
ccI
Hin
dIII
Xho
I
Bam
HI
Xba
IA
scI
I-P
poI
I-S
ceI
Sac
I
PI-
Psp
I
Pst
I
Kpn
I
Eco
RV
PI-
TilI
Stu
I
I-C
euI
Plant Methods 2008, 4:24 http://www.plantmethods.com/content/4/1/24
Page 6 of 11(page number not for citation purposes)
Multi-color BiFC experiments using tobacco BY-2 suspension culture cellsFigure 3Multi-color BiFC experiments using tobacco BY-2 suspension culture cells. In A and B, BY-2 protoplasts were trans-fected using electroporation and visualized using epifluorescence microscopy. In C, protoplasts were transfected by direct DNA uptake and visualized using laser scanning confocal microscopy. Labels above each set of panels indicate the various con-structions introduced into the cells. Labels below each set of panels indicates the filter set/channel imaged. mCherry labels the entire cell, whereas mCherry-VirD2NLS labels only the nucleus. Note that, regardless of the tag, Impa-1 localizes to the cyto-plasm and Impa-4 localizes predominantly to the nucleus, with some cytoplasmic staining. In Panel A, the blue signal outside the main imaged cell indicates autofluorescence from dead cells. DIC, differential interference contrast image.
Impa-1-nCerulean + Impa-4-nVenus + VirE2-cCFP+ mCherry-VirD2NLS
DIC mCherry Venus Cerulean Venus +Cerulean
C
Impa-1-nCerulean + Impa-4-nVenus + VirE2-cCFP + mCherry
Brightfield mCherry Venus Cerulean Venus +Cerulean
B
Impa-1-nVenus + Impa-4-nCerulean + VirE2-cCFP + mCherry
Brightfield mCherry Venus Cerulean Venus +Cerulean
A
Plant Methods 2008, 4:24 http://www.plantmethods.com/content/4/1/24
Page 7 of 11(page number not for citation purposes)
either naked DNA- or Agrobacterium-mediated transfor-mation. Along with various forms of mCherry to marksub-cellular compartments, these multi-color BiFC vectorswill be useful tools for investigating interactions among
multiple protein partners. We recognize that over-expres-sion of proteins using strong promoters to drive expres-sion of the encoded genes can affect the extent and natureof interactions with other proteins. However, we have
Multi-color BiFC experiments using onion epidermal cellsFigure 4Multi-color BiFC experiments using onion epidermal cells. Onion cells were transfected by particle bombardment and visualized using laser scanning confocal microscopy. Labels above each set of panels indicate the various constructions intro-duced into the cells. Labels below each set of panels indicates the filter set/channel imaged. mCherry-VirD2NLS labels the nucleus. Note that, regardless of the tag, Impa-1 localizes to the cytoplasm and Impa-4 localizes predominantly to the nucleus, with some cytoplasmic staining. In Panel A, the arrows indicate a gold particle in the nucleus. Imaging of gold particles results from 458 nm and 488 nm laser reflection. Because Cerulean images weakly using the Zeiss LSM510 Meta confocal microscope, the Cerulean images in Panels A and B were digitally enhanced by adjusting the brightness and contrast, in accordance with [22]. DIC, differential interference contrast image.
A
Impa-1-nCerulean + Impa-4-nVenus + VirE2-cCFP
+ mCherry-VirD2NLS
DIC mCherry Venus Cerulean Venus +
Cerulean
Impa-1-nVenus + Impa-4-nCerulean + VirE2-cCFP
+ mCherry-VirD2NLS
B
DIC mCherry Venus Cerulean Venus +
Cerulean
Plant Methods 2008, 4:24 http://www.plantmethods.com/content/4/1/24
Page 8 of 11(page number not for citation purposes)
Control experiments show specificity of multi-color BiFC experimentsFigure 5Control experiments show specificity of multi-color BiFC experiments. Onion cells were transfected by particle bombardment and visualized using laser scanning confocal microscopy. Labels above each set of panels indicate the various constructions introduced into the cells. Labels below each set of panels indicates the filter set/channel imaged. mCherry-VirD2NLS labels the nucleus. In Panels A and B, respectively, VirE2-cCFP interacts with Impa-1-nVenus or Impa-4-nVenus expressed individually. Localization of yellow fluorescence is identical to that seen when both prey proteins are co-expressed with VirE2-cCFP. Note that in Panel C, yellow fluorescence is not reconstituted in the absence of interacting bait and prey pro-teins. DIC, differential interference contrast image. Size bars indicate 50 microns.
AImpa-1-nVenus + VirE2-cCFP + mCherry-VirD2NLS
DIC Venus mCherry DIC + Venus+ mCherry
B
DIC Venus mCherry DIC + Venus+ mCherry
Impa-4-nVenus + VirE2-cCFP + mCherry-VirD2NLS
CEmpty-nVenus + VirE2-cCFP + mCherry-VirD2NLS
DIC Venus mCherry DIC + Venus+ mCherry
Plant Methods 2008, 4:24 http://www.plantmethods.com/content/4/1/24
Page 9 of 11(page number not for citation purposes)
shown that the nuclear localization of the AtImpa-4/VirE2protein pair using strong promoters is identical to thatseen when using the native AtImpa-4 promoter [18].
The expression vectors and recipient plasmids describedin this study can be obtained by contacting [email protected]. DNA sequences and mapsfor the various vectors can be found at: http://bio.purdue.edu/people/faculty/gelvin/nsprotocols_vectors.htm.
MethodsVector constructionPCR amplified nVenus, nCerulean, and cCFP fragmentswere initially cloned into pBluescript II KS+. Aftersequences were confirmed, all three fragments werereleased from the vector by digestion with the appropriaterestriction endonucleases and cloned into pSATN(A) vec-tors. Primers used for nVenus and nCerulean were: FP-1C(NcoI): TTA ACC ATG GTG AGC AAG GGC GAG; FP-2C(BglII): AGA TCT CTC GAT GTT GTG GCG GAT; FP-3N(BamHI): TAT GGG ATC CTG ATG GTG AGC AAG GGCGAG; FP-4N (XbaI): GCG GGA TCT AGA CTA CTC GATGTT GTG GCG. Primers used for cCFP were: cCFP-1(NcoI): AAT ACC ATG GAC AAG CAG AAG AAC GGC;cCFP-2 (BglII): ATT GGC AGA TCT CTT GTA CAG CTCGTC CAT; cCFP-3 (BamHI): ACA GAA TGG ATC CTA GACAAG CAG AAG AAC GGC; cCFP-4 (XbaI): A CCT TCT AGATCA CTT GTA CAG CTC G. Forward primers are FP-1C,FP-3N, cCFP-1, and cCFP-3. Reverse primers are FP-2C,FP-4N, cCFP-2, and cCFP-4. To perform PCR, we pairedthe NcoI forward primer with the BglII reverse primer (Fig-ure 1A), and the BamHI forward primer with the XbaIreverse primer (Figures 1B and 1C).
Plant transformationFor electroporation experiments, protoplasts were iso-lated from five-day old Nicotiana tabacum BY-2 suspensioncells. Suspension cultures were grown at 23°C with shak-ing (130 rpm) in a medium containing Murashige andSkoog salts [21] supplemented with 1 mg/L thiamine-HCl, 370 mg/L KH2PO4, 30 g/L sucrose, and 2 mg/L2, 4-dichlorophenoxyacetic acid, pH 5.7. Cells were sub-cul-tured once per week by adding 2.5–3 ml of inoculum to50 ml of fresh medium in 250 ml Erlenmeyer flasks. The50 ml of suspension culture was centrifuged at 250 × g atroom temperature for 5 min in a Sorvall GLC-2 centrifuge,and the pellet (15 ml packed cell volume) was re-sus-pended in 50 ml of protoplast isolation solution contain-ing 7.4 g/L CaCl2 ·2H2O, 1 g/L NaOAc, and 45 g/Lmannitol supplemented with 1.2% cellulose R10 (Ona-zuka) and 0.6% Macerozyme (Duchefa), pH 5.7. Approx-imately 15 ml of suspension culture was transferred intothree 20 × 100 mm sterile Petri dishes and incubated inthe dark with a gentle shaking (40 rpm) at room temper-ature for 4 hours. The protoplasts were washed twice with
protoplast isolation solution and the pellet was re-sus-pended in 50 ml of floating solution (99 mg/L myo-inosi-tol, 2.88 g/L L-proline, 100 mg/L enzymatic caseinhydrolysate, 102.6 g/L sucrose, 97.6 mg/L MES buffer, 4.3g/L MS salts, 1 mg/L thiamine-HCl, 370 mg/L KH2PO4,pH 5.7). Protoplasts (floating on the top of the solution)were transferred to a new tube, washed twice, and sus-pended in 50 ml of electroporation solution (10 mMNaCl, 4 mM CaCl2·2H2O, 120 mM KCl, 10 mM HEPES,0.6 M mannitol, pH 7.2). Cells were incubated at 42°C for5 min and kept in ice for 10 min before electroporation.Aliquots of protoplasts containing approximately 3 × 10⁶
cells/ml were used for electroporation. ~20 g of eachplasmid DNA were added to 300 l of protoplasts in atube and placed on ice. The electroporation was con-ducted using a BioRad Gene Pulser apparatus at 0.16 kV,with the Pulse Controller set to infinity and the capaci-tance extender set to 960 FD. After 10 min incubation onice, the protoplasts were transferred into 10 ml of BY-2culture medium supplemented with 0.4 M mannitol andincubated overnight.
For direct DNA uptake experiments, 20 ml BY-2 suspen-sion cells were transferred to a sterile conical centrifugetube and centrifuged at 3000 rpm for 10 min. The pelletedcells were suspended in 10–20 ml protoplast digestionenzyme solution (1.2% Cellulase Onozuka RS [Duchefa]and 0.6% Macerozyme R-10 [Duchefa] in 10 mMCaCl2·2H2O, 12 mM NaOAc, 11% mannitol, pH 5.7)and incubated in the dark with shaking (40 rpm) for 3–4hr at room temperature. The protoplasts were filteredthrough 40 m nylon mesh and centrifuged in a 50 mlconical tube at 250 × g for 5 min. The protoplasts were col-lected and suspended in 10 ml protoplast floating solu-tion (per liter: 99 mg myo-inositol, 2.88 g L-proline, 100mg enzymatic casein hydrolysate, 102.6 g sucrose, 97.6mg MES buffer, 4.3 g MS salts, 1 mg Vitamin B1, 370 mgKH2PO4, pH 5.7) and centrifuged at 250 × g for 10 min.Protoplasts floating in this solution were removed and 10ml W5 solution (154 mM NaCl, 125 mM CaCl2, 5 mMKCl, 2 mM MES, pH 5.7) was added. The solution wascentrifuged at 250 × g for 5 min, and the protoplasts pel-leted. Protoplast concentration was adjusted to 1 × 10⁶/mland the solution incubated on ice for 30 min. The proto-plasts were again centrifuged at 250 × g for 5 min and sus-pended at a density of 1 × 10⁶ cells/ml in MMg solution(0.6 M mannitol, 15 mM MgCl2, 4 mM MES, pH 5.7).DNA (10 g in 10 l) was added to 100 l protoplasts, fol-lowed by addition of 110 l PEG solution (per ml: 0.4 gPEG 4000 [Fluca], 0.6 ml 1 M mannitol, 100 l 1 MCaCl2), and the protoplasts incubated at room tempera-ture for 30 min. After addition of 1 ml W5 solution, theprotoplast suspension was centrifuged at 250 × g for 5min. The protoplast pellet was suspended in 1 ml incuba-tion solution (per liter: MS salts and vitamins, 2 mg/L 2,4-
Plant Methods 2008, 4:24 http://www.plantmethods.com/content/4/1/24
Page 10 of 11(page number not for citation purposes)
D, 3% sucrose, 0.4 ~ 0.6 M mannitol) and incubated inthe dark for 16 hr at 26°C.
Particle bombardment of onion epidermal peel layers wascarried out using a Biolistic Particle Delivery System (Bio-Rad) PDS-1000. Samples (whole onion from which thedry outer layer was removed) were sterilized in ~300 ml2% NaOCl and 2–3 drops Tween-20 for 15 min. The tis-sue was washed with sterilize H2O at least five times. Theupper epidermal layer of the onion was removed, cut into2 × 2 cm squares, and placed on a plate containing 1/2 MSmedium. 5 g of each plasmid DNA was used in all exper-iments. Gold particles size was 1.6 m (INBIO GOLD).0.15–0.2 mg particles/per shot were used with a chambervacuum of 27 in Hg. Particles were accelerated with a pres-sure of 1100 psi. The distance between the projectilesource and the samples was 6 cm.
MicroscopyTransfected cells were imaged using a Nikon Eclipse E600fluorescence microscope, or a Zeiss LSM510 Meta confo-cal microscope. For confocal microscopy, the objectivelens was a C-Apochromat 63×/1.2 W corr. Channel speci-fications were as follows:
Multi Track: Channel 1 (Venus track): Argon laser; Excita-tion: Line active 488 nm; Transmission 8%; Main BeamSplitter 1: 488/543/633; Beam Splitter 2: 545; BP 500–530IR; Detector Gain: 620; Amplifier Offset: -0.1.
Multi Track: Channel 2 (mCherry track): HeNe laser; Exci-tation: Line active 543 nm; Transmission 100%; MainBeam Splitter 1: 488/543/633; Beam Splitter 2: 545; BP565–615IR; Detector Gain: 550; Amplifier Offset: -0.1.
Multi Track: Channel 3 (Cerulean track): Argon laser;Excitation: Line active 458 nm; Transmission 20%; MainBeam Splitter 1: 458; Beam Splitter 2: mirror; BP 480–520IR; Detector Gain: 550; Amplifier Offset: -0.1.
DIC channel: HeNe laser 543 nm; Detector Gain: 198;Amplifier Offset: -0.1
Competing interestsThe authors declare that they have no competing interests.
Authors' contributionsLYL designed and constructed the vectors, tested the vec-tors in electroporated tobacco BY-2 protoplasts, and ana-lyzed the data. MJF conducted confocal microscopicstudies on transfected tobacco BY-2 and onion epidermalcells. LYK conducted plant cell transfections on tobaccoBY-2 protoplasts by naked DNA uptake, and on onionepidermal cells by particle bombardment. SBG helpeddesign the experiments, analyzed the data, and wrote the
manuscript. All authors read and approved the final man-uscript.
AcknowledgementsThe authors thank Zhe Wang and Kelly Babb for help with some of the vec-tor constructions. We also thank Dr. Cheng-Deng Hu for the nCerulean and nVenus clones. This research was funded by a NSF Arabidopsis 2010 grant (MCB-0418709) to SBG.
References1. Remy I, Michnick SW: Dynamic visualization of expressed gene
networks. J Cell Physiol 2003, 196:419-429.2. Rigaut G, Shevchenko A, Rutz B, Wilm M, Mann M, Seraphin B: A
generic protein purification method for protein complexcharacterization and proteome exploration. Nature Biotechnol1999, 17:1030-1032.
3. Bhat RA, Lahaye T, Panstruga R: The visible touch: In planta vis-ualization of protein-protein interactions by fluorophore-based methods. Plant Meth 2006, 2:2-12.
4. Hu C-D, Chinenov Y, Kerppola TK: Visualization of interactionsamong bZIP and rel family proteins in living cells using bimo-lecular fluorescence complementation. Mol Cell 2002,9:789-798.
5. Remy I, Michnick SW: A cDNA library functional screeningstrategy based on fluorescent protein complementationassays to identify novel components of signaling pathways.Methods 2003, 32:381-388.
6. Bracha-Drori K, Shichrur K, Katz A, Oliva M, Angelovici R, YalovskyS, Ohad N: Detection of protein-protein interactions in plantsusing bimolecular fluorescence complementation. Plant J2004, 40:419-427.
7. Walter M, Chaban C, Schutze K, Batistic O, Weckermann K, Nake C,Blazevic D, Grefen C, Schumacher K, Oecking C, Harter K, Kudla J:Visualization of protein interactions in living plant cells usingbimolecular fluorescence complementation. Plant J 2004,40:428-438.
8. Citovsky V, Lee L-Y, Vyas S, Glick E, Chen M-H, Vainstein A, Gafni Y,Gelvin SB, Tzfira T: Subcellular localization of interacting pro-teins by bimolecular fluorescence complementation inplanta. J Mol Biol 2006, 362:1120-1131.
9. Ohad N, Shichrur K, Yalovsky S: The analysis of protein-proteininteractions in plants by bimolecular fluorescence comple-mentation. Plant Physiol 2007, 145:1090-1099.
10. Hu C-D, Kerppola TK: Simultaneous visualization of multipleprotein interactions in living cells using multicolor fluores-cence complementation analysis. Nature Biotechnol 2003,21:539-545.
11. Tzfira T, Tian G-W, Lacroix B, Vyas S, Li J, Leitner-Dagan Y,Krichevsky A, Taylor T, Vainstein A, Citovsky V: pSAT vectors: Amodular series of plasmids for autofluorescent protein tag-ging and expression of multiple genes in plants. Plant Mol Biol2005, 57:503-516.
12. Shyu YJ, Liu H, Deng X, Hu C-D: Identification of new fluores-cent protein fragments for bimolecular fluorescence com-plementation analysis under physiological conditions.BioTechniques 2006, 40:61-66.
13. Goderis IJ, De Bolle MF, Francois IE, Wouters PF, Broekaert WF,Cammue BP: A set of modular plant transformation vectorsallowing flexible insertion of up to six expression units. PlantMol Biol 2002, 50:17-27.
14. Yusibov VM, Steck TR, Gupta V, Gelvin SB: Association of single-stranded transferred DNA from Agrobacterium tumefacienswith tobacco cells. Proc Natl Acad Sci USA 1994, 91:2994-2998.
15. Rossi L, Hohn B, Tinland B: Integration of complete transferredDNA units is dependent on the activity of virulence E2 pro-tein of Agrobacterium tumefaciens. Proc Natl Acad Sci USA 1996,93:126-130.
16. Zupan JR, Citovsky V, Zambryski P: Agrobacterium VirE2 proteinmediates nuclear uptake of single-stranded DNA in plantcells. Proc Natl Acad Sci USA 1996, 93:2392-2397.
17. Gelvin SB: Agrobacterium VirE2 proteins can form a complexwith T strands in the plant cytoplasm. J Bacteriol 1998,180:4300-4302.
http://www.ncbi.nlm.nih.gov/entrez/query.fcgi?cmd=Retrieve&db=PubMed&dopt=Abstract&list_uids=8159693
http://www.ncbi.nlm.nih.gov/entrez/query.fcgi?cmd=Retrieve&db=PubMed&dopt=Abstract&list_uids=8159693
http://www.ncbi.nlm.nih.gov/entrez/query.fcgi?cmd=Retrieve&db=PubMed&dopt=Abstract&list_uids=8552588
http://www.ncbi.nlm.nih.gov/entrez/query.fcgi?cmd=Retrieve&db=PubMed&dopt=Abstract&list_uids=8637884
http://www.ncbi.nlm.nih.gov/entrez/query.fcgi?cmd=Retrieve&db=PubMed&dopt=Abstract&list_uids=8637884
http://www.ncbi.nlm.nih.gov/entrez/query.fcgi?cmd=Retrieve&db=PubMed&dopt=Abstract&list_uids=8637884
Publish with BioMed Central and every scientist can read your work free of charge
"BioMed Central will be the most significant development for disseminating the results of biomedical research in our lifetime."
Sir Paul Nurse, Cancer Research UK
Your research papers will be:
available free of charge to the entire biomedical community
peer reviewed and published immediately upon acceptance
cited in PubMed and archived on PubMed Central
yours — you keep the copyright
Submit your manuscript here:http://www.biomedcentral.com/info/publishing_adv.asp
BioMedcentral
Plant Methods 2008, 4:24 http://www.plantmethods.com/content/4/1/24
Page 11 of 11(page number not for citation purposes)
18. Bhattacharjee S, Lee L-Y, Oltmanns H, Cao H, Veena , Cuperus J,Gelvin SB: AtImpa-4, an Arabidopsis importin isoform, ispreferentially involved in Agrobacterium-mediated planttransformation. Plant Cell 2008.
19. Restrepo MA, Freed DD, Carrington JC: Nuclear transport ofplant potyviral proteins. Plant Cell 1990, 10:987-998.
20. DeCleene M, DeLey J: The host range of crown gall. Bot Rev1976, 42:389-466.
21. Murashige T, Skoog F: A revised medium for rapid growth andbio assays with tobacco tissue cultures. Physiol Plant 1962,15:473-475.
22. Rossner M, Yamada KM: What's in a picture? The temptation ofimage manipulation. J Cell Biol 2004, 166:11-15.