Vectorial image · 2 Philipp e Dosc h et al.: A complete system for the analysis of arc hitectural...
18
Transcript of Vectorial image · 2 Philipp e Dosc h et al.: A complete system for the analysis of arc hitectural...

International Journal on Document Analysis and Recognition manuscript No.(will be inserted by the editor)
A complete system for the analysis of architectural drawings
Philippe Dosch, Karl Tombre, Christian Ah-Soon?, G�erald Masini
LORIA, Campus scienti�que, B.P. 239, 54506 Vand�uvre-l�es-Nancy CEDEX, France
Received: date / Revised version: date
Abstract. In this paper, we present a complete systemfor the analysis of architectural drawings, with the aimof reconstructing in 3D the represented buildings. Wedescribe successively the graphics recognition algorithmsused for image processing and feature extraction, the 2Dmodeling step, which includes symbol recognition andconverts the drawing into a description in terms of ba-sic architectural entities, and a proposed 3D modelingprocess which matches reconstructed oors. The systemalso includes a powerful and exible user interface.
Key words: Graphics recognition, architectural draw-ings, symbol recognition, vectorization
1 Introduction
Graphics recognition techniques have been applied tomany kinds of technical documents and drawings. How-ever, surprisingly few teams have been dealing with ar-chitectural drawings. There are probably two main rea-sons for that. Firstly, there has been less demand fromthe application �eld than in other domains for systemscapable of analyzing paper drawings and yielding a 2Dor 3D Cad description of the represented building. Sec-ondly, architectural design is more or less at the cross-roads between engineering and art, which makes preciseanalysis and reconstruction more diÆcult.
These last years, our team has conducted a researchproject whose aim was to reconstruct 3D models of build-ings as automatically as possible, from the analysis of ar-chitectural drawings. This paper presents the resultingcomplete system. We start by presenting the algorithmswe chose for the image processing part and the featureextraction from the drawings (Sect. 2). These featuresallow a �rst 2D modeling, in terms of basic architec-tural entities (Sect. 3). We then propose a 3D modelingprocess (Sect. 4). From the beginning, it was clear that
? Now with Business Objects, Paris.Correspondence to: [email protected]
such a system cannot be fully automatic, so we neededa powerful and exible user interface, which is describedin Sect. 5. To implement such a large system, it is es-sential to de�ne a suitable system architecture, which isdetailed Sect. 6. In Sect. 7, we propose some conclusionsand perspectives on this work, with a critical analysis ofthe results obtained.
2 Image processing and feature extraction
Our basic idea was to look for robust algorithms andmethods [30], i.e. methods which do not require tuninga lot of parameters. Of course, we are not completelysatis�ed with the achievements so far, and we indicateat the end of the section what remains to be done.
2.1 Tiling
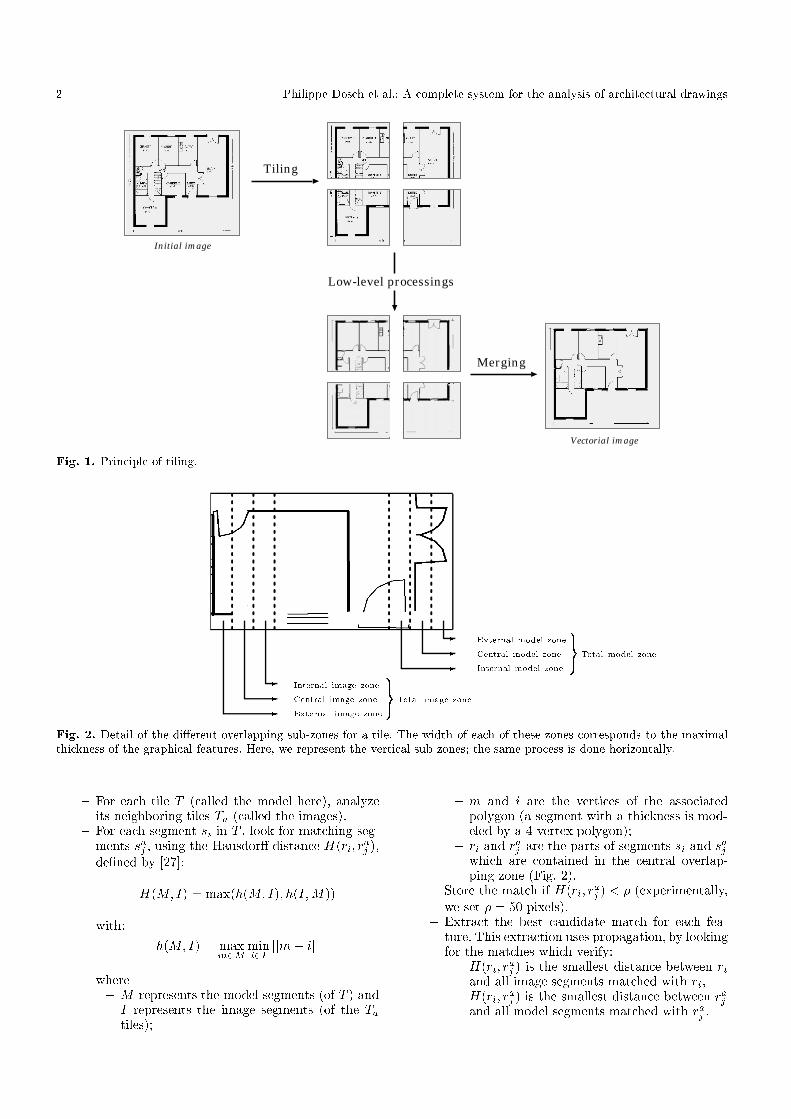
In some cases, the document images on which we have towork are very large, and the memory requirements of ourmethods exceed what is usually available with a commonworkstation. We therefore designed a method for divid-ing the image into tiles, each of them being processed andanalyzed independently. The graphical features resultingfrom the feature extraction process are then merged atthe end.
Splitting up the image: the original image is split intopartially overlapping tiles. The width of the overlap-ping zone is chosen so as to allow for good matchingof the resulting features [34]. It is set to 3 times themaximal width of the graphical features present inthe document.Through this splitting, as many tiles are generatedas necessary for covering the whole image (Fig. 1).
Merging the tiles: the tiles are merged again after vec-torization (Sect. 2.3), by matching the segments ex-tracted in each tile. At vector level, the memory re-quirements are smaller, so it becomes useful to workon the complete data structure again.The merging algorithm works as follows:
2 Philippe Dosch et al.: A complete system for the analysis of architectural drawings
Tiling
Merging
Initial image
Vectorial image
Low-level processings
Fig. 1. Principle of tiling.
-
-
-
-
-
-
Internal image zone
Central image zone
External image zone
9=; Total image zone
External model zone
Central model zone
Internal model zone
9=; Total model zone
Fig. 2. Detail of the di�erent overlapping sub-zones for a tile. The width of each of these zones corresponds to the maximalthickness of the graphical features. Here, we represent the vertical sub-zones; the same process is done horizontally.
{ For each tile T (called the model here), analyzeits neighboring tiles Ta (called the images).
{ For each segment si in T , look for matching seg-ments saj , using the Hausdor� distance H(ri; r
aj ),
de�ned by [27]:
H(M; I) = max(h(M; I); h(I;M))
with:
h(M; I) = maxm2M
mini2I
jjm� ijj
where{ M represents the model segments (of T ) andI represents the image segments (of the Tatiles);
{ m and i are the vertices of the associatedpolygon (a segment with a thickness is mod-eled by a 4-vertex polygon);
{ ri and raj are the parts of segments si and s
aj
which are contained in the central overlap-ping zone (Fig. 2).
{ Store the match if H(ri; raj ) < � (experimentally,
we set � = 50 pixels).{ Extract the best candidate match for each fea-ture. This extraction uses propagation, by lookingfor the matches which verify:{ H(ri; r
aj ) is the smallest distance between ri
and all image segments matched with ri,{ H(ri; r
aj ) is the smallest distance between raj
and all model segments matched with raj .

Philippe Dosch et al.: A complete system for the analysis of architectural drawings 3
{ Merge the matched segments, over several tileswhen necessary.
The results are very satisfying. As an example, fora 6000 � 15600 image, split into 36 tiles of size 2000� 2000 pixels, with an overlapping zone of 120 pixels,the merging process takes approximately 5 seconds on aSun Ultra 1 workstation and yields a �nal set of 3910segments, with an error rate lower than 1%.
2.2 Segmentation
Our basic choice for text/graphics segmentation was toimplement the well known method proposed by Fletcherand Kasturi [13], while adapting the parameters to ourkind of documents. These thresholds are stable, and themethod yields good results (Fig. 3).
Of course, such a method, based on analyzing theshape and the size of the connected components, addsmany dashes from dashed lines to the character layer.This is corrected interactively with our user interface(cf. Sect. 5).
The characters are then grouped into strings, us-ing the Hough transform-based approach proposed byFletcher and Kasturi. The bounding boxes of the stringscan be corrected interactively, if necessary (Fig. 4), andtheir position is then stored, for later character recogni-tion.
The remaining graphics part is further segmentedinto thin lines and thick lines. For this, we chose morpho-logical �ltering [30]. Let I be the image of the graphicspart, w be the minimum width of a thick line, and n bebw2c. Using a Bn square sized (2n + 1) � (2n + 1), the
thick lines can then be retrieved lines through partialgeodesic reconstruction (n+ 1 iterations):
K0 = J ;Ki = (Ki�1 �B1) \ I for i = 1 : : : n+ 1
This yields two images Ithick = Kn+1 and Ithin =I � Ithick (Fig. 5).
2.3 Vectorization
Vectorization is of course a central step in the analysisprocess. We emphasize that it must be as stable androbust as possible [30]. The �rst step in vectorization isto process the raster image in order to extract a set oflines, i.e. of chains of pixels. The most intuitive de�nitionfor these lines is probably that they represent the set ofsigni�cant medial axes of the original image, consideredas a shape. In this section, we will only summarize ourchoices for vectorization; a more thorough presentationand discussion is available in reference [31].
There are three main families of approaches for thisstep. The �rst method which comes to mind is to com-pute the medial axis, i.e. the skeleton of the raster im-age. This is the most common approach, and skeletonsare known to yield good precision with respect to thepositioning of the line. But they also tend to have lotsof barbs when the image is somewhat irregular, so they
(a) Graphics layer.
(b) Text layer.
Fig. 3. Text/graphics separation.
need some clever heuristics or post-processing steps, thatweaken their generality and robustness. Another weak-ness of skeleton-based methods is that they displace thejunction points. This is a direct consequence of the factthat the skeleton follows the medial axis of the shape,whereas the position of the junction as envisioned by thedraftsman is not on the medial axis of the shape (Fig. 6).Other families of methods are based on matching the op-posite sides of the line, or on sparse-pixel approaches.

4 Philippe Dosch et al.: A complete system for the analysis of architectural drawings
Fig. 4. Extraction of character strings. The popup menuallows the user to edit the bounding box, merge two strings,or delete a string.
After a careful study and comparison of the pros andcons of these various methods [31], our current choiceis the skeleton-based approach, despite its known weak-nesses. Among the possible approaches for computing askeleton, we have found the distance transform to be agood choice. The skeleton is de�ned as the set of ridgelines formed by the centers of all maximal disks includedin the original shape, connected to preserve connectiv-ity. Distance transforms [6] can be computed in only twopasses on the image. To guarantee the precision of theskeleton, we advocate the use of chamfer distances, whichcome closer to approximating the Euclidean distance. Agood compromise between precision and simplicity seemsto be the 3{4 chamfer distance transform (Fig. 7), forwhich a good skeletonization algorithm has been pro-posed by Sanniti di Baja [7]. A single threshold on thesigni�cance of a branch enables correct removal of thesmallest barbs.
After extracting the skeleton, the result of the pro-cess is a set of pixels considered as being the medial axesof the lines in the drawing. This set must be linked, toextract the chains making up the lines. A detailed algo-rithm for this linking process is given in reference [31].
The lines extracted from the skeletonization step areto be represented by a set of segments. This is done bypolygonal approximation. Here also, many methods ex-ist. In our experiments, we have basically used two ap-proximation methods. The �rst, based on recursive split-and-merge, was proposed by Rosin and West [26]; it hasthe advantage that it does not require any user-giventhreshold or parameter. The principle is to recursivelysplit the curve into smaller and smaller segments, un-til the maximum deviation is 0 or there are only 3 (orless) points left. Then, the \tree" of possible segmentsis traversed and the method keeps those segments max-imizing a measure of signi�cance, which is de�ned as aratio between the maximum deviation and the lengthof the segment. Rosin has also proposed other possible
(a) Thick lines.
(b) Thin lines.
Fig. 5. Thin/thick separation.
Fig. 6. Position of the junction point with a skeleton-basedmethod.

Philippe Dosch et al.: A complete system for the analysis of architectural drawings 5
V2 V3 V4
V1 X V5
V8 V7 V6
Y = min(V1 + 3; V2 + 4; V3 + 3; V4 + 4)Z = min(Y; V5 + 3; V6 + 4; V7 + 3; V8 + 4)
Fig. 7. Computing the 3{4 distance transform in two passesover the image, the �rst from left to right and from top tobottom, the second from right to left and from bottom to top.Sanniti di Baja's algorithm performs some post-processing onthis distance transform, such as changing labels 6 to 5 and 3to 1; see reference [7] for details.
measures of signi�cance [25], and we plan to explore thisfurther.
We have also used for many years an iterative method,that of Wall and Danielsson [35], enhanced by our teamwith a direction-change marking procedure to preservethe angular points. This method only needs a singlethreshold, on the ratio between the algebraic surface andthe length of the segments. It is fast and eÆcient, butnot as precise as the former. On the other hand, Rosinand West's method tends to split up the lines arounda junction into too many small segments (see Fig. 8).This is a direct consequence of its preciseness and of the
(a) Wall & Daniels-son [35] with typicalthreshold = 20.
(b) Rosin & West [26].
Fig. 8. Comparison of two polygonal approximation methodsapplied to Fig. 6.
previously mentioned displacement of junction points byskeleton-based methods.
2.4 Arc detection
The arc detection method we have designed [12] is basi-cally inspired by that of Rosin & West [26], but we haveincluded two ideas proposed by Dov Dori [9]: a bettermethod for computing the center of the arc, and the useof polylines instead of simple segments. We also addedsome improvements of our own to these basic ideas. Themost important of them is the computation of the er-ror associated with an arc hypothesis, not with respectto the polygonal approximation, but with respect to theoriginal chain of skeleton pixels. In order to achieve that,each set of segments delivered by the polygonal approx-imation step of our vectorization process is associatedwith the pixel chain that the segments approximate. Seg-ments are grouped into polylines, each polyline being the
approximation of a complete chain. The original linkedchain corresponding to a polyline can be retrieved usinga simple index.
Our arc detection algorithm works in two phases: thegeneration of arc hypotheses, and the validation of thehypotheses. The hypotheses are built from the polygonalapproximation. We maintain a list of connected segments(S1; :::; Sn), described by their extremities (P1; :::; Pn+1),such that they contain a minimum number of points (4points are necessary to build a relevant hypothesis), and
that the successive angles\Si Si+1 and \Si+1 Si+2 are ap-proximately equal.
Arc detection is performed on each of these hypothe-ses. If an arc is not detected for a given hypothesis, wedecrease the number of segments of the hypothesis andtest again, until we reach a valid arc or until there aretoo few points to build a signi�cant hypothesis. The testphase is performed using least squares minimization. Theerror measure is not done on the segments of the polyg-onal approximation, but on the subchain of points.
This method also detects full circles. When workingon a closed loop of successive segments, we eliminateone of the segments and apply the previously describedmethod. If a unique arc is detected, including all thesegments, we test the presence of a circle by checkingthe validity of the last segment.
Figure 9 illustrates results obtained on an architec-tural drawing. There are still several possible improve-ments to the method. One of them is to test arc hypothe-ses on more than one polyline, as the skeleton linking al-gorithm starts new chains at each junction. This wouldlead to the possibility of recognizing a single arc, evenwhen it is crossed by another line, or to recognize twofull arcs whenever they share short segments. The maindiÆculty here is not with the method, but with the com-putational complexity of the implementation.
We also still have thresholds in the method, especiallyfor the similarity between two angular measures. A pos-sible improvement would be to extend Rosin's work onsigni�cance measures [25] to arc detection.
2.5 Stability, robustness and possible improvements
As said previously, our aim is to have stable and ro-bust methods, with few and well-de�ned parameters andthresholds. The stability of our current processes is vary-ing. The tiling process and subsequent matching of vec-tors in the di�erent tiles (Sect. 2.1) relies on well-de�nedparameters and can be considered as stable. The samecan be said of most segmentation steps (Sect. 2.2), al-though it remains hard to stabilize the thresholds forcharacter grouping into strings. We have implementedvectorization methods which rely on nearly no parame-ter (Sect. 2.3), and this is in our opinion an importantfactor of robustness. The same cannot be said yet of arcdetection (Sect. 2.4), which remains dependent on toomany parameters, which are relatively hard to master.
In addition to continuing work on the stability as-pect, we also need to improve the precision of vector-ization. As we have seen, an important remaining prob-

6 Philippe Dosch et al.: A complete system for the analysis of architectural drawings
(a) Original image. (b) Detected arcs.
Fig. 9. Results of arc detection.
lem is that of the processing of junctions, where we endup having to �nd a \compromise" between the num-ber of segments and the precision of the vectorization.This problem is annoying as it has an impact on thequality and robustness of all the following steps, includ-ing symbol recognition (Sect. 3.3) and 3D reconstruction(Sect. 4). We are currently investigating several possibleimprovements, including a post-processing process wherethe exact position of the junction would be recomputedafter a �rst vectorization [24,15], and complementary ap-proaches where the skeleton is not computed, but thelines searched for directly on the image [32].
3 2D Modeling
When the basic features have been extracted from thedocument image, the next step consists in recognizingelements which can be used when building a 2D modelof a oor of the building.
3.1 Detection of dashed lines
In architectural drawings, many lines are dashed. Wetherefore needed a detection method to recognize themas such. This can be either done directly on the pixelimage, using image processing tools such as directional
mathematical morphology operators [1], or on the vec-tors yielded by the raster-to-vector conversion. We chosethe latter approach and adapted to our case a method�rst proposed by Dori [8]. This algorithm relies on somecharacteristics common to all dashed lines:
{ they have a minimum number of dashes having ap-proximately the same length;
{ they are regularly spaced;{ they follow a virtual line.
The method starts by extracting the segments whichare smaller than a given threshold and which have atleast one free extremum|i.e. which are not connectedto another segment or arc. All such segments which havenot yet been included in a potential dashed line are calledkeys. The main loop consists in choosing a key as thestart of a new dashed line hypothesis, and in trying to ex-tend this hypothesis in both directions, by �nding othersegments belonging to the same virtual line. This searchis done in a search area whose width is the double ofthe current key width, and whose length is the maximaldistance allowed between two segments belonging to asame dashed line (Fig. 10).
If there is more than one key contained in this searcharea, we choose the one closest to the extremum of thecurrent key. To reduce computation times in this search-ing process, we use a data structure of buckets [4], bydividing the image into meshes. The new key must be

Philippe Dosch et al.: A complete system for the analysis of architectural drawings 7
First key Search areaCurrent key Virtual lineStarting endpoint
Fig. 10. Search area for dashed lines extraction.
aligned with the keys already detected. It is then addedto the current dashed line hypothesis, and the search iscontinued from the new current key, until it is not pos-sible to add any new key.
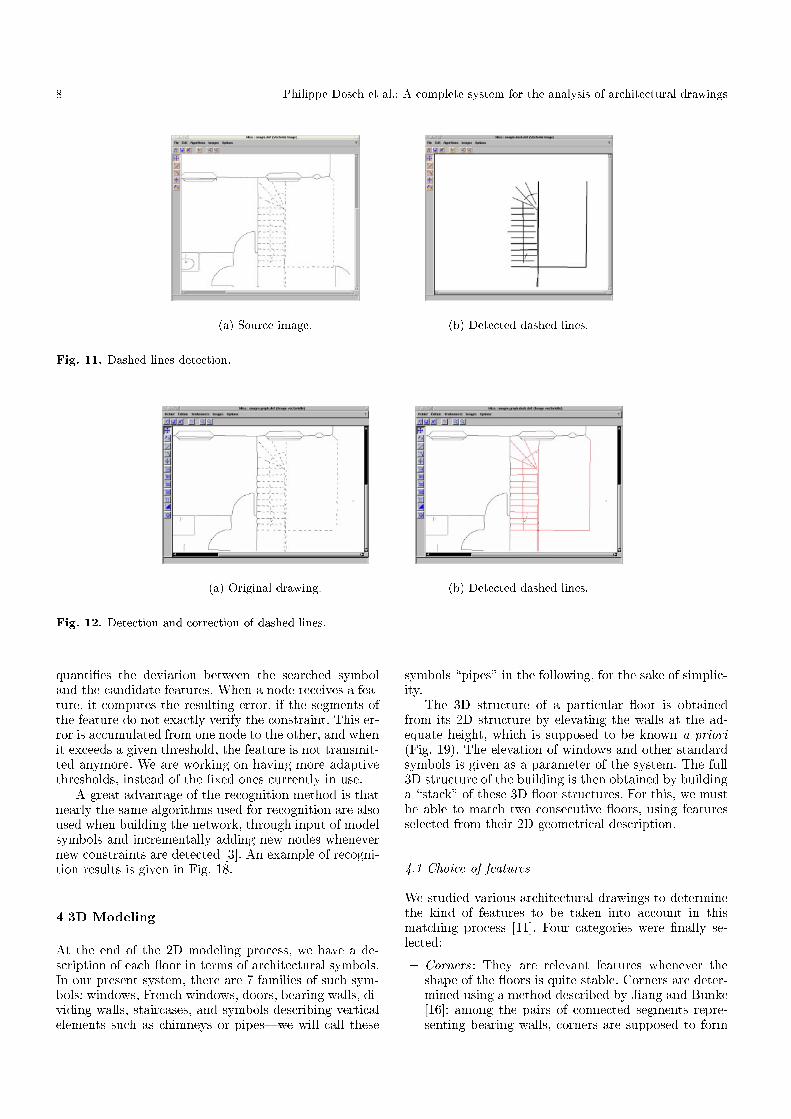
Only hypotheses with at least 3 dashes are kept;the corresponding keys are erased and replaced by thecorresponding line segments, with a \dashed" attribute.Fig. 11 presents the results of the method.
We have added some improvements to this method.For instance, we need to recompute the precise con-nections of the dashed line segments found with theother segments and arcs of the vectorization. This is donethrough a post-processing step which tries to prolongatethe dashed segments until meeting other segments. Themaximum length which is added to a segment extremityis the maximum distance between two dashes. Figures 12and 13 illustrate the results of this improved method.
3.2 Staircases
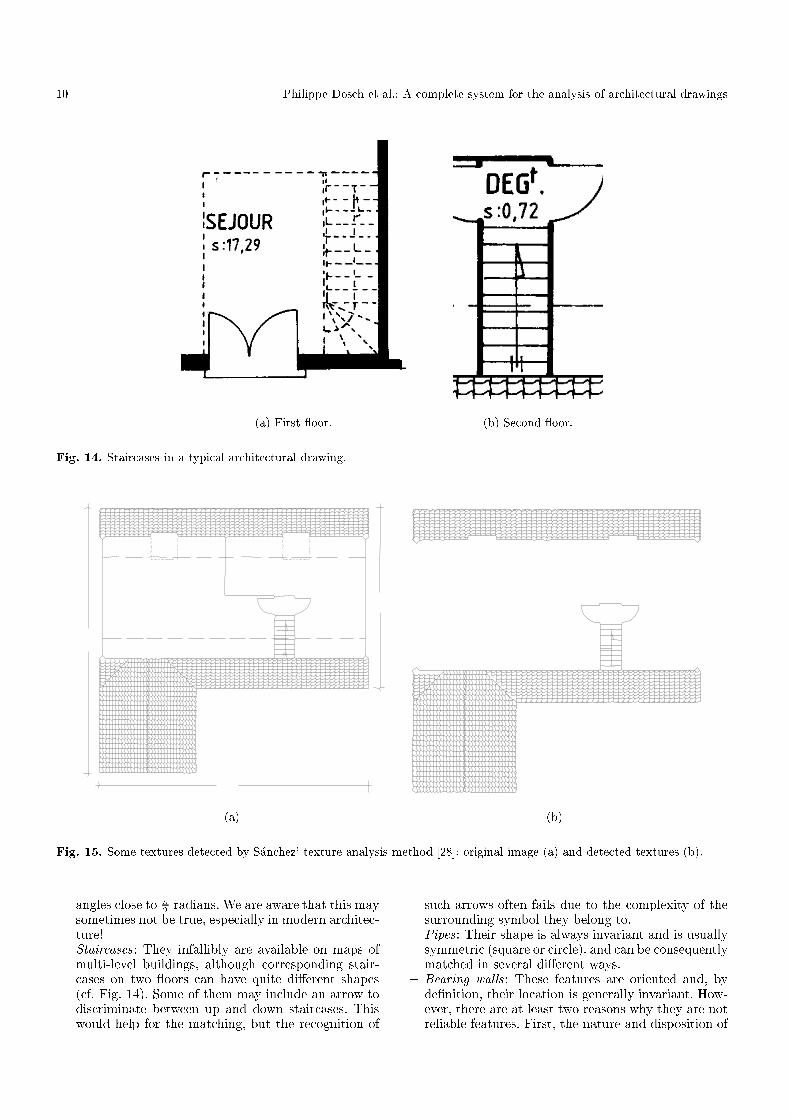
Staircases are useful modeling elements, both for repre-senting the layout of a oor and as matching featureswhen reconstructing the 3D model (Sect. 4). They canusually be considered as a kind of texture, where theindividual stairs are regularly repeated (Fig. 14).
We chose to use a structural texture analysis processdesigned by G. S�anchez [28]. The method is based onsearching for regular polygonal structures. For that, agraph of all the polygons extracted from the vectoriza-tion is built [16]. This graph is used to perform structuraltexture segmentation, using a pyramidal approach [19].In this process, we need the ability to compute a similar-ity measure between two polygons; for that, a distanceis de�ned, based on the di�erence between the areas ofthe polygons.
Among the various textures detected by this approach(Fig. 15), we must then recognize those corresponding tostaircases. As there is no unique standard for represent-ing stairs, we use simple heuristics, based on the numberand size of stairs. Therefore, we simply �lter the resultof the previous texture detection process, keeping theregions having between 5 and 30 texture elements. Al-though this is a very crude and simplistic rule, it extractsmost staircases without adding much noise. Thus, it iseasy and not costly in time to interactively adapt theresult with the user interface (Sect. 5).
Fig. 16 presents some of our results, before user inter-action. Despite some strange results, the recognition rateis surprisingly good, given the simplicity of the �lteringprocess.
3.3 Symbol recognition
A number of symbols must be recognized as such inthe drawing. One problem with architectural symbolsis that many models are \increments" of simpler mod-els (Fig. 17.a), and the recognition method must be ableto recognize the most extended symbol. In our system,symbol recognition is performed using the method de-signed in our group by Christian Ah-Soon, on the basisof previous work by Pasternak [23] and by Messmer[21].The details of the method are described elsewhere [3];we will only summarize it here.
The models of possible symbols are described in termsof elementary features and of geometric and topologicalconstraints between these features, using a simple de-scription language. The descriptions are stored in a text�le, readable by a simple parser. Fig. 17.b shows an ex-cerpt from such a �le, to give an idea of the kind ofconstraints used.
The network of constraints used in our method triesto factorize the similarities of the di�erent models. Thebasic principle of the recognition method is that the fea-tures yielded by vectorization (segments and arcs) areinput into a network of constraints. The search for sym-bols works through propagation of these segments andarcs through the network. The network is made of �vekinds of nodes : NNSegment, NNArc, NNMerge, NNCon-dition and NNFinal. These nodes are connected throughfather{son links; each node can have at most two fa-thers, but can have several sons. Each node tests someconstraints, and can thus be seen as a \�lter", whichonly transmits to its sons the features (de�ned as sets ofsegments and arcs) which verify the tested constraints.These features, created only once by each node, can beused by all the sons of the node. At the end, the segmentsand arcs of the features which have \trickled" down tothe terminal nodes of the network represent the corre-sponding symbols.
For each network, there is only one NNSegment nodeand one NNArc node; they correspond to the inputs ofthe network. These nodes initialize the recognition pro-cess, create a one-segment or one-arc feature for eachsegment or arc, and send it to all their sons. A NNCon-dition node has only one father. It tests the constrainton the features sent to it by its father. If the constraintis satis�ed, the node propagates the feature to its sons.A NNMerge node has two father nodes, and gathers thefeatures sent by its fathers, if they verify a connectionconstraint. The resulting merged feature, if any, is sentto the sons of the node. The NNFinal nodes are the ter-minal nodes. Each of these nodes corresponds to one ofthe symbols which have to be recognized. When a fea-ture reaches such a node, it has gone through a number ofNNMerge and NNCondition nodes and has veri�ed theirconstraints. To get the actual symbol, it is therefore suf-�cient to get the set of features stored in the NNFinalnode.
Although we only perform recognition on the vector-ization of the thin lines layer (Sect. 2.2), there are stillerrors due to noise and to the approximation of curvesby polylines. We therefore use an error measure, which
8 Philippe Dosch et al.: A complete system for the analysis of architectural drawings
(a) Source image. (b) Detected dashed lines.
Fig. 11. Dashed lines detection.
(a) Original drawing. (b) Detected dashed lines.
Fig. 12. Detection and correction of dashed lines.
quanti�es the deviation between the searched symboland the candidate features. When a node receives a fea-ture, it computes the resulting error, if the segments ofthe feature do not exactly verify the constraint. This er-ror is accumulated from one node to the other, and whenit exceeds a given threshold, the feature is not transmit-ted anymore. We are working on having more adaptivethresholds, instead of the �xed ones currently in use.
A great advantage of the recognition method is thatnearly the same algorithms used for recognition are alsoused when building the network, through input of modelsymbols and incrementally adding new nodes whenevernew constraints are detected [3]. An example of recogni-tion results is given in Fig. 18.
4 3D Modeling
At the end of the 2D modeling process, we have a de-scription of each oor in terms of architectural symbols.In our present system, there are 7 families of such sym-bols: windows, French windows, doors, bearing walls, di-viding walls, staircases, and symbols describing verticalelements such as chimneys or pipes|we will call these
symbols \pipes" in the following, for the sake of simplic-ity.
The 3D structure of a particular oor is obtainedfrom its 2D structure by elevating the walls at the ad-equate height, which is supposed to be known a priori(Fig. 19). The elevation of windows and other standardsymbols is given as a parameter of the system. The full3D structure of the building is then obtained by buildinga \stack" of these 3D oor structures. For this, we mustbe able to match two consecutive oors, using featuresselected from their 2D geometrical description.
4.1 Choice of features
We studied various architectural drawings to determinethe kind of features to be taken into account in thismatching process [11]. Four categories were �nally se-lected:
{ Corners : They are relevant features whenever theshape of the oors is quite stable. Corners are deter-mined using a method described by Jiang and Bunke[16]: among the pairs of connected segments repre-senting bearing walls, corners are supposed to form

Philippe Dosch et al.: A complete system for the analysis of architectural drawings 9
(a) Original vectorized image.
A
BD
C
E
F
(b) Detected dashed and dotted lines.
Fig. 13. Detection of dashed and dotted lines on an example from the Grec'95 contest [18]. Some annotations: A. line notrecognized (not enough keys) { B. corrected line { C. corrected line { D. line not corrected (too long) { E. wrong correction {F. corrected lines.
10 Philippe Dosch et al.: A complete system for the analysis of architectural drawings
(a) First oor. (b) Second oor.
Fig. 14. Staircases in a typical architectural drawing.
(a) (b)
Fig. 15. Some textures detected by S�anchez' texture analysis method [28]: original image (a) and detected textures (b).
angles close to �2radians. We are aware that this may
sometimes not be true, especially in modern architec-ture!
{ Staircases : They infallibly are available on maps ofmulti-level buildings, although corresponding stair-cases on two oors can have quite di�erent shapes(cf. Fig. 14). Some of them may include an arrow todiscriminate between up and down staircases. Thiswould help for the matching, but the recognition of
such arrows often fails due to the complexity of thesurrounding symbol they belong to.
{ Pipes : Their shape is always invariant and is usuallysymmetric (square or circle), and can be consequentlymatched in several di�erent ways.
{ Bearing walls : These features are oriented and, byde�nition, their location is generally invariant. How-ever, there are at least two reasons why they are notreliable features. First, the nature and disposition of

Philippe Dosch et al.: A complete system for the analysis of architectural drawings 11
(a) (b)
(c) (d)
(e) (f)
Fig. 16. Vectorized drawings (a, c, e) and recognized staircases (b, d, f)|before user interaction and correction.

12 Philippe Dosch et al.: A complete system for the analysis of architectural drawings
(a) Examples of increasingly more complex archi-tectural symbols.
SEGMENT 2 - ARC 2
50 < seg1.length();
50 < seg2.length();
arc1.pt2_angle_pt2 ( arc2 ) == 360;
seg2.pt1_angle_pt1 ( arc2 ) == 90;
arc1.pt1_angle_pt2 ( seg1 ) == 90;
seg1.extremity1() == arc1.center();
seg2.extremity2() == arc2.center();
SEGMENT 5 - ARC 2
seg1.pt1_angle_pt2 ( seg2 ) == 180;
seg2.pt1_angle_pt2 ( seg3 ) == 90;
seg3.pt1_angle_pt2 ( seg4 ) == 90;
seg4.pt1_angle_pt2 ( seg5 ) == 180;
arc1.pt2_angle_pt2 ( arc2 ) == 360;
seg5.pt1_angle_pt1 ( arc2 ) == 90;
arc1.pt1_angle_pt2 ( seg1 ) == 90;
50 < seg1.length();
50 < seg5.length();
50 < seg3.length();
(b) Excerpt from a symbol description �le.
Fig. 17. Describing architectural symbols.
(a) A drawing. (b) Thin lines. (c) Symbols.
Fig. 18. Symbol recognition for a simple drawing (1700�1600 pixels) vectorized in about 300 segments and arcs.
(a) Drawing of a oor. (b) 3D elevation.
Fig. 19. 3D reconstruction of a oor through elevation.

Philippe Dosch et al.: A complete system for the analysis of architectural drawings 13
pieces of joinery (doors and windows) may di�er fromone level to the other. Secondly, a wall recognized as asingle segment on a given oor may be split into sev-eral segments on another oor, because of the noisefrom the image and from the vectorization process.A single feature may therefore have to be matchedwith several correspondents, and reciprocally.
4.2 The matching method
We then had to choose the matching algorithm to use.As maps may be drawn using di�erent scales and arescanned from separate sheets, the matching of featuresrequires the computation of the transformation (a com-bination of a translation, a rotation and a scaling) thataligns a map with the other. The sets of features of thedi�erent oors being generally very dissimilar, it seemedappropriate to represent a oor as a relational model:a feature is characterized by the relative locations of a�xed minimum number Nmin of neighboring stable fea-tures.
As there are relatively few features to match andthat each feature is associated with a small number ofsimple attributes, sophisticated matching methods arenot necessary. Our choice went to an approach similarto the Local Feature Focus method proposed by Bollesand Cain [5], where objects are characterized by simplefeatures and their relative positions. The hypothesis ofmatches between the features of the model and the fea-tures extracted from the image are represented by nodesin a compatibility graph. An edge between two nodes ex-presses that the corresponding hypothesis are consistent.The largest maximal clique, i.e. the largest totally con-nected set of nodes, represents the best match betweenthe model and the image.
A reliable match between a pair of given oors, F1and F2, must rely on a minimum number of robust fea-tures. The relevant features are selected among the setsof all the available features according to the followingprinciples:
{ A priority order is de�ned on the categories of fea-tures, depending on the invariance of their locationsand shapes: pipes, staircases, corners and bearingwalls, in decreasing order. Location stability prevailsshape stability, since the former allows more precisematches, and thus a more precise computation of thetransformation relating F1 and F2.
{ Let fmin (value experimentally de�ned) be the mini-mal number of features required for a reliable match.Let cimin be the minimum of the numbers of featuresfrom category Ci available in F1 and in F2. Thiscorresponds to the maximum number of consistentmatches that can be performed for this category. Thecategories Ci are successively considered in their pri-ority order, summing the corresponding cimin. Whenthe total reaches fmin, the possibly remaining cate-gories are ignored and the others are selected for theglobal matching process.
Such principles ensure that noisy or non reliable fea-tures are not used whenever the set of relevant features
is large enough, and subsequently do not disturb thematching. Of course, the neighboring features used tocharacterize a given feature are picked up in the selectedcategories.
Each feature is assimilated to a point: the gravity cen-ter of the polygon representing the contours of a staircaseor a pipe, the intersection of the two segments forming acorner, the middle of the segment representing a bearingwall. The relative orientation of two features is computedas the direction of the segment joining their two repre-sentative points.
Two features f1 2 F1 and f2 2 F2 are associated ina matching hypothesis if that con�dence rate �(f1; f2)is lower than a �xed threshold. � is de�ned as the sumof the minimum distances Æ between a neighbor of the�rst feature and the neighbors of the second feature:
�(f1; f2) =
i=NminX
i=1
j=Nmin
minj=1
Æ(f1:i; f2:j)
where fp:q represents the q-th neighbor of feature fp. Æexpresses the di�erence between the relative orientationsof the two considered neighboring features. If these fea-tures do not belong to the same category, Æ returns avalue which makes any match between the two featuresimpossible.
Let fa1 :fi2 and f
b1 :f
j2 be two matching hypotheses. An
edge relates the two corresponding nodes in the graph ifthey represent consistent hypotheses, i.e.:
{ a 6= b and i 6= j (a same feature from F1 obviouslycannot match two di�erent features from F2, and re-ciprocally);
{ �(fa1 )� �(f i2) � �(f b1)� �(f j2 ), where � represents theabsolute direction of a corner or a wall: the directionof the bisector of the angle formed by the corner, andthe direction of the segment representing the wall,respectively. In other terms, the rotation induced bythe �rst match must be the same as that induced bythe second match.
The largest maximal clique, i.e. the largest completelyconnected subgraph that can be extracted from the com-patibility graph, represents the best match between thetwo current oors. Computing maximal cliques is a well-known NP-complete problem, and a lot of more or lesssophisticated algorithms have been developed to use thistechnique for all kinds of applications. However, in ourcase we do not need any sophisticated method, as thesize of our compatibility graph is generally small. A sim-ple and straightforward algorithm, like the one describedby Bolles and Cain [5], has proved its eÆciency on var-ious applications, for example stereo-vision [14], so weimplemented this algorithm.
A con�dence rate is assigned to each clique, de�nedas the sum of the � con�dence rates of all the elementsof the clique. It is used when several largest cliques ofthe same size are supplied: the clique having the lowestrate is supposed to represent the best match.

14 Philippe Dosch et al.: A complete system for the analysis of architectural drawings
The resulting clique is �nally used to compute thetransformation that aligns oor F1 to oor F2. The co-ordinates of the points of oor F2, according to the coor-dinates of points in oor F1, are computed through leastsquares minimization of the error on the transformation.The precision of the solution increases with the numberof available matched points.
4.3 Results
Figure 20 shows some experimental results obtained witha small building, a private house two stories high. The 3Dreconstruction has been generated from the architecturaldrawings of the �rst and second oor.
The 3D structures of the two oors conform to thedrawings. The di�erent construction components (bear-ing walls, dividing walls, doors and windows) have beencorrectly recognized and precisely located (Figs. 20.a and20.b).
The upper oor has been aligned to the lower oorthanks to the transformation computed after matchingthe oors. The result does not seem very precise: theupper oor is slightly misplaced on the lower oor, gen-erating a step on the surface of the outer walls, which isparticularly visible on the angles of the front part of thehouse. Actually, the matching itself is not the reason forthese problems. As said previously (Sect. 2.5), the dis-torsion of junction points by the vectorization process isthe main reason for the poor alignment.
The �rst oor contains 79 architectural entities andthe second 125, from which respectively 53 and 51 fea-tures have been selected. A compatibility graph with 15nodes and 36 edges gave a largest maximal clique of 5nodes. The whole process, from the determination of thefeatures to the generation of the full 3D structure, takesless than 0.3 s on a Sun Ultra 1 workstation.
5 The user interface
Any particular application has to deal with many prob-lems like noise, the many ways of representing architec-tural components (doors, windows, etc.), and, of course,the very limitations of the methods that are applied.In this context, we have to consider the whole analysisprocess as a human-computer cooperation. Our systemmust be able to o�er interactions, thus allowing the userto correct the intermediate results of the automatic pro-cesses. It must also be able to provide help by propos-ing contextual options according to the progress of theanalysis. Thus, all the processes presented in the previ-ous sections are incorporated into a user interface, calledMica, providing visual feedback on the working of thegraphics processes. Mica typically allows the user to:
{ display the content of all kinds of �les which are han-dled by the analysis, with common editor functional-ities like multi-�le editing, zooming, and so on;
{ tune parameter and threshold values, as explainedpreviously, after examination of the results of the cur-rent application;
{ interactively manipulate resulting data, i.e. add miss-ing results, delete or alter erroneous results|in par-ticular, special editing operations are supported forboth raster and vector images: cut and paste of rasterimages, creation and modi�cation of components ofa vector image, etc.
{ backtrack to any previous step of the analysis to pro-ceed processing with a di�erent tuning, and easilycompare the di�erent results obtained.
Fig. 21 shows an example of data manipulation withMica, to interactively correct the results of the segmen-tation process (Sect. 2.2).
6 Software architecture
We have also focused on the software architecture of thesystem, as it is an essential consideration in order tointegrate a set of stable software components, reusablefrom one application to the other, and to add exibilityto the analysis of various architectural drawings.
For the data stream, we have chosen a \batch sequen-tial" architectural style [29], where all graphics recogni-tion applications are independent programs, communi-cating through �les. The interface is added as a layer,calling these independent application programs with theright �les, in a uni�ed framework for �le naming and pa-rameter passing. Despite a relatively poor interactivitybetween the di�erent application modules, this choicegives us great exibility for replacing some parts withmore up-to-date algorithms or applications. As interme-diate results are stored in �les, it is easy to come backto the results of any analysis step.
The system includes three layers (Fig. 22): a libraryof C++ classes, called Isadora, implementing basic gra-phics recognition methods, a set of graphics recognitionmodules (GRMs), implementing useful graphics recog-nition applications designed from Isadora components,and the Mica interface, to monitor the analysis of animage of a drawing, and to take corrective action when-ever necessary. Each step of the analysis can easily beperformed by a GRM.
The interface is designed to be independent of theanalysis processes. It is connected to the graphical recog-nition modules through simple links, which are used totransmit the values of the parameters to the processingmodules: names of images to process, options, thresh-olds, etc. A processing module can be directly invokedby a command line and parameters are set with defaultvalues which can be customized by the user [10]. In thisway, a graphical recognition module can be easily sub-stituted for another, or can be upgraded when necessary.
7 Conclusion and perspectives
In this paper, we have presented a complete system builtfor the analysis of architectural drawings, with the aim ofreconstructing in 3D the represented buildings. The sys-tem is based on a number of automated graphics recogni-tion processes, integrated through a user interface which\puts man in the loop" throughout the analysis.

Philippe Dosch et al.: A complete system for the analysis of architectural drawings 15
(a) 3D structure of the 1st oor. (b) 3D structure of the 2nd oor.
(c) 3D structure of the whole building.
Fig. 20. 3D reconstruction of a private house from the architectural drawings of its oors.

16 Philippe Dosch et al.: A complete system for the analysis of architectural drawings
(a) Original Image. (b) Raw graphics layer.
(c) Raw text layer. (d) Graphics layer after correction.
(e) Text layer after correction.
Fig. 21. Interactive correction using Mica: some dashes are misinterpreted as characters in the text layer and are moved tothe graphics layer by the user, and some characters (like I), misinterpreted as dashes in the graphics layer, are moved to thetext layer by the user.

Philippe Dosch et al.: A complete system for the analysis of architectural drawings 17
tiling
binarization
segmentation
vectorization
fusion
symbol recognition
texture analysis
etc.
dashed lines detectionbinaryimages
vectorialimages
grey levelsimages
linked to library link to program data stream
ISADORA
M ICA
Fig. 22. Software architecture: a three-layer system.
Although we have interesting results on a numberof drawings, we are aware of the fact that the di�erentcomponents of the system are not at the same level ofachievement.
1. The image processing and feature extraction tools arequite mature. They implement in most cases state ofthe art graphics recognition methods. As previouslymentioned, there is of course still room for improve-ments, especially with respect to the precision of vec-torization and to the robustness and stability of arcdetection.
2. Among the 2D modeling methods, the dashed lineextraction must be considered to be quite matureand stable. The staircase recognition relies on verysimple, ad hoc rules, but this proves to be suÆcient,when coupled with the user interface, for this kindof speci�c architectural elements. The main remain-ing research topic at this level is symbol recognition.The results of our method are comparable to thoseof other structural symbol recognition methods [20,22,33], but have also the same kind of weakness: it isdiÆcult to assess how scalable the approach is, whenthe number of symbols to recognize grows from 10{15to 100 or 500. We plan to investigate this scalabilityissue in the coming years.
3. The 3D reconstruction process works reasonably well,but is of course very speci�c to the kind of draw-ings we work on. We have still to prove its validityon much larger buildings, where the complexity ofthe matching process might increase too much forthe maximal clique approach to remain reasonable.However, another solution would be to provide a sim-ple interactive method for matching in 3D the re-constructed levels. Also to be proven on larger-scaledrawings is the validity of the simple elevation pro-cedure used to reconstruct the single oors. Anotherpossibility would be to match the oor drawing with
elevation drawings, as we have experimented someyears ago in mechanical engineering [2].
4. In our opinion, the user interface proves the impor-tance of putting man in the loop in an intelligentway. We plan to continue our parallel development ofthis interface, which will progressively integrate newgraphics recognition modules, whenever they becomemature enough.
Acknowledgements. This work was partly funded by a re-search contract with France Telecom CNET and by �nancialsupport from R�egion Lorraine. The authors are also gratefulto Gemma S�anchez and Josep Llad�os for giving them ac-cess to the structural texture detection method mentioned inSect. 3.2.
References
1. G. Agam, H. Luo, and I. Dinstein. Morphological Ap-proach for Dashed Lines Detection. In Kasturi andTombre [17], pages 92{105.
2. C. Ah-Soon and K. Tombre. A Step Towards Reconstruc-tion of 3-D CAD Models from Engineering Drawings.In Proceedings of 3rd International Conference on Doc-ument Analysis and Recognition, Montr�eal (Canada),pages 331{334, August 1995.
3. C. Ah-Soon and K. Tombre. Network-Based Recognitionof Architectural Symbols. In A. Amin, D. Dori, P. Pudil,and H. Freeman, editors, Advances in Pattern Recog-nition (Proceedings of Joint IAPR Workshops SSPR'98and SPR'98, Sydney, Australia), volume 1451 of LectureNotes in Computer Science, pages 252{261, August 1998.
4. T. Asano, M. Edahiro, H. Imai, M. Iri, and K. Murota.Practical Use of Bucketing Techniques in ComputationalGeometry. In G. T. Toussaint, editor, ComputationalGeometry, pages 153{195. North-Holland, 1985.
5. R. C. Bolles and R. A. Cain. Recognizing and Locat-ing Partially Visible Objects: The Local-Feature-Focus

18 Philippe Dosch et al.: A complete system for the analysis of architectural drawings
Method. In A. Pugh, editor, Robot Vision, pages 43{82.IFS Publications Ltd. (United Kingdom) and Springer-Verlag (Berlin), 1983.
6. G. Borgefors. Distance Transforms in Digital Im-ages. Computer Vision, Graphics and Image Processing,34:344{371, 1986.
7. G. Sanniti di Baja. Well-Shaped, Stable, and ReversibleSkeletons from the (3,4)-Distance Transform. Jour-nal of Visual Communication and Image Representation,5(1):107{115, 1994.
8. D. Dori, L. Wenyin, and M. Peleg. How to Win a DashedLine Detection Contest. In Kasturi and Tombre [17],pages 286{300.
9. Dov Dori and Wenyin Liu. Stepwise recovery of arc seg-mentation in complex line environments. InternationalJournal on Document Analysis and Recognition, 1(1):62{71, February 1998.
10. Ph. Dosch, C. Ah-Soon, G. Masini, G. S�anchez, andK. Tombre. Design of an Integrated Environment for theAutomated Analysis of Architectural Drawings. In S.-W. Lee and Y. Nakano, editors, Proceedings of 3rd IAPRInternational Workshop on Document Analysis Systems,Nagano (Japan), pages 366{375, November 1998.
11. Ph. Dosch and G. Masini. Reconstruction of the 3DStructure of a Building from the 2D Drawings of itsFloors. In Proceedings of 5th International Conferenceon Document Analysis and Recognition, Bangalore (In-dia), pages 487{490, September 1999.
12. Ph. Dosch, G. Masini, and K. Tombre. Improving ArcDetection in Graphics Recognition. In Proceedings of the15th International Conference on Pattern Recognition,Barcelona (Spain), September 2000.
13. L. A. Fletcher and R. Kasturi. A Robust Algorithm forText String Separation from Mixed Text/Graphics Im-ages. IEEE Transactions on PAMI, 10(6):910{918, 1988.
14. R. Horaud and T. Skordas. Stereo CorrespondanceThrough Feature Grouping and Maximal Cliques. IEEETransactions on PAMI, 11(11):1168{1180, 1989.
15. R. D. T. Janssen and A. M. Vossepoel. Adaptive Vector-ization of Line Drawing Images. Computer Vision andImage Understanding, 65(1):38{56, January 1997.
16. X. Y. Jiang and H. Bunke. An Optimal Algorithm forExtracting the Regions of a Plane Graph. Pattern Recog-nition Letters, 14:553{558, 1993.
17. R. Kasturi and K. Tombre, editors. GraphicsRecognition|Methods and Applications, volume 1072 ofLecture Notes in Computer Science. Springer-Verlag,May 1996.
18. B. Kong, I. T. Phillips, R. M. Haralick, A. Prasad,and R. Kasturi. A Benchmark: Performance Evaluationof Dashed-Line Detection Algorithms. In Kasturi andTombre [17], pages 270{285.
19. S. W. C. Lam and H. H. C. Ip. Structural Texture Seg-mentation Using Irregular Pyramid. Pattern RecognitionLetters, pages 691{698, July 1994.
20. J. Llad�os and E. Mart��. A Graph-Edit Algorithmfor Hand-Drawn Graphical Document Recognition andTheir Automatic Introduction into CAD Systems. Ma-chine Graphics & Vision, 8(2):195{211, 1999.
21. B. T. Messmer and H. Bunke. Automatic Learning andRecognition of Graphical Symbols in Engineering Draw-ings. In Kasturi and Tombre [17], pages 123{134.
22. B. T. Messmer and H. Bunke. A New Algorithm forError-Tolerant Subgraph Isomorphism Detection. IEEETransactions on PAMI, 20(5):493{504, May 1998.
23. B. Pasternak. Adaptierbares Kernsystem zur Interpre-tation von Zeichnungen. Dissertation zur Erlangungdes akademischen Grades eines Doktors der Naturwis-senschaften (Dr. rer. nat.), Universit�at Hamburg, April1996.
24. M. R�o�osli and G. Monagan. Adding Geometric Con-straints to the Vectorization of Line Drawings. In Kasturiand Tombre [17], pages 49{56.
25. P. L. Rosin. Techniques for Assessing Polygonal Ap-proximation of Curves. IEEE Transactions on PAMI,19(6):659{666, June 1997.
26. P. L. Rosin and G. A. West. Segmentation of Edges intoLines and Arcs. Image and Vision Computing, 7(2):109{114, May 1989.
27. W. J. Rucklidge. EÆciently Locating Objects Using theHausdor� Distance. International Journal of ComputerVision, 24(3):251{270, 1997.
28. G. S�anchez, J. Llad�os, and E. Mart��. Segmentation andAnalysis of Linial Textures in Planes. In Proceedings of7th Spanish National Symposium on Pattern Recognitionand Image Analysis, Barcelona (Spain), volume 1, pages401{406, 1997.
29. M. Shaw and D. Garlan. Software Architecture: Perspec-tives on an Emerging Discipline. Prentice Hall, 1996.
30. K. Tombre, C. Ah-Soon, Ph. Dosch, A. Habed, andG. Masini. Stable, Robust and O�-the-Shelf Methodsfor Graphics Recognition. In Proceedings of the 14th In-ternational Conference on Pattern Recognition, Brisbane(Australia), pages 406{408, August 1998.
31. K. Tombre, C. Ah-Soon, Ph. Dosch, G. Masini, andS. Tabbone. Stable and Robust Vectorization: How toMake the Right Choices. In Proceedings of 3rd Inter-national Workshop on Graphics Recognition, Jaipur (In-dia), pages 3{16, September 1999. Revised version toappear in a forthcoming LNCS volume.
32. K. Tombre and S. Tabbone. Vectorization in GraphicsRecognition: To Thin or not to Thin. In Proceedings ofthe 15th International Conference on Pattern Recogni-tion, Barcelona (Spain), September 2000.
33. E. Valveny and E. Mart��. Application of DeformableTemplate Matching to Symbol Recognition in Hand-written Architectural Drawings. In Proceedings of 5thInternational Conference on Document Analysis andRecognition, Bangalore (India), pages 483{486, Septem-ber 1999.
34. A. M. Vossepoel, K. Schutte, and C. F. P. Delanghe.Memory EÆcient Skeletonization of Utility Maps. InProceedings of 4th International Conference on Docu-ment Analysis and Recognition, Ulm (Germany), pages797{800, August 1997.
35. K. Wall and P. Danielsson. A Fast Sequential Methodfor Polygonal Approximation of Digitized Curves. Com-puter Vision, Graphics and Image Processing, 28:220{227, 1984.