Vector-Borne Diseases - Public Health ON · Vector-Borne Diseases 2012 Summary Report | 1...
27
Vector-Borne Diseases 2012 Summary Report
Transcript of Vector-Borne Diseases - Public Health ON · Vector-Borne Diseases 2012 Summary Report | 1...
Vector-Borne Diseases
2012 Summary Report

Public Health Ontario
Public Health Ontario is a Crown corporation dedicated to protecting and promoting the health of all
Ontarians and reducing inequities in health. Public Health Ontario links public health practitioners,
frontline health workers and researchers to the best scientific intelligence and knowledge from around
the world.
Public Health Ontario provides expert scientific and technical support to government, local public health
units and health care providers relating to the following:
communicable and infectious diseases
infection prevention and control
environmental and occupational health
emergency preparedness
health promotion, chronic disease and injury prevention
public health laboratory services
Public Health Ontario's work also includes surveillance, epidemiology, research, professional
development and knowledge services. For more information, visit www.publichealthontario.ca
How to cite this document:
Ontario Agency for Health Protection and Promotion (Public Health Ontario). Vector-borne diseases
2012 summary report. Toronto, ON: Queen's Printer for Ontario; 2013.
ISBN 978-1-4606-2891-1 [PDF]
Public Health Ontario acknowledges the financial support of the Ontario Government.
©Queen’s Printer for Ontario, 2013

Disclaimer
This document was developed by Public Health Ontario (PHO). PHO provides scientific and technical
advice to Ontario’s government, public health organizations and health care providers. PHO’s work is
guided by the current best available evidence.
PHO assumes no responsibility for the results of the use of this document by anyone.
This document may be reproduced without permission for non-commercial purposes only and provided
that appropriate credit is given to Public Health Ontario. No changes and/or modifications may be made
to this document without explicit written permission from Public Health Ontario.

Contents
Introduction ......................................................................................................................................1
West Nile Virus ..................................................................................................................................2
Lyme disease ................................................................................................................................... 12
Eastern Equine Encephalitis Virus ..................................................................................................... 20

Vector-Borne Diseases 2012 Summary Report | 1
Introduction This report provides an overview of Ontario’s 2012 vector-borne disease season. The major vector-
borne diseases of public health importance in Ontario are West Nile Virus (WNV) and Lyme disease with
surveillance attention also being focus on the possible emergence of eastern equine encephalitis virus
(EEEV).
WNV is a mosquito-borne viral disease that was first recognized in Africa in the 1930s. The virus
primarily exists between birds and bird-biting mosquitoes. It is transmitted to humans when certain
species of mosquito acquire the virus from biting an infected bird and then bite a human. These species
of mosquitoes that transfer the virus from birds to humans are called bridge vectors. The main bridge
vectors for WNV in Ontario are the species Culex pipiens/restuans. Cx. pipiens/restuans can be found in
significant numbers in urban areas making WNV a primarily urban health risk. The majority of humans
infected with WNV will be asymptomatic; however, some can have nonneurological symptoms, such as
a fever or rash, while very few will progress to neurological symptoms such as encephalitis. It is
estimated that one per cent of infections will have neurological complications. WNV was first detected
in New York, in 1999, and since then, has spread across most of North America. WNV became reportable
in Ontario in 2003 and was first detected in birds in 2001, with the first human cases following in 2002.
Since then, WNV activity has varied from year to year. In 2011, there was an increase in WNV activity
compared to the previous four seasons with this increase persisting through to 2012.
Lyme disease is a tick-borne bacterial disease, which can only be transferred to humans by the bite of an
infected blacklegged tick (Ixodes scapularis). Blacklegged ticks are usually associated with deciduous or
mixed forests, which mean that the majority of human exposures occur in those types of environments.
Lyme disease was first recognized in North America in the late 1970s and has been reportable in Ontario
since 1991. In the early 1990s, there was only one known endemic area in Ontario at Long Point
Provincial Park. Since then Ontario has seen an increase in the distribution of blacklegged ticks and an
expansion of their populations. The number of known endemic areas has now increased to seven
locations spread across the north shores of Lake Erie, Lake Ontario and the St. Lawrence River. With this
increase in blacklegged tick populations, there has also been an increase in locally acquired human cases
of Lyme disease. The majority of these human cases are occurring in areas associated with the
blacklegged tick populations.
EEEV is also a mosquito-borne virus that circulates between birds and mosquitoes, with bridge vectors
transferring it to humans. It differs in that the main mosquito vector inhabits persistently flooded forests
that tend to exist in rural areas. This makes EEEV primarily a rural health risk. It is estimated that one
third of all people infected with EEEV may have serious morbidity or mortality. EEEV has been present in
the horse population in Ontario since 1938. EEEV is not a reportable disease on its own, however it can
be reported if a person does develop encephalitis. Starting in 2009, mosquito surveillance data has

Vector-Borne Diseases 2012 Summary Report | 2
detected the virus sporadically in the Ontario mosquito population. Although the risk is still low in
Ontario, and there has never been a human case of EEEV reported in the province, enhanced
surveillance for the virus was implemented due to increases in EEEV detection in horses and mosquitoes
in surrounding jurisdictions. No horses positive for EEEV were identified in Ontario in 2012. Ontario did
not detect any EEEV in the mosquito populations in 2012 despite increased testing.
West Nile Virus Most human cases of WNV are initially identified by health care providers when individuals present with
clinically compatible signs and symptoms. A blood sample is submitted to a laboratory to confirm the
diagnosis. Patients are screened by an enzyme-linked immunsorbent assay (ELISA) and reactive samples
are then confirmed by a plaque reduction neutralization test (PRNT). Health care providers notify the
public health unit (PHU) of confirmed and probable cases of WNV, which are then entered by the PHU
into the integrated Public Health Information System (iPHIS) for provincial reporting requirements. In
addition, cases may also be discovered by the Canadian Blood Services, through their blood screening
process.
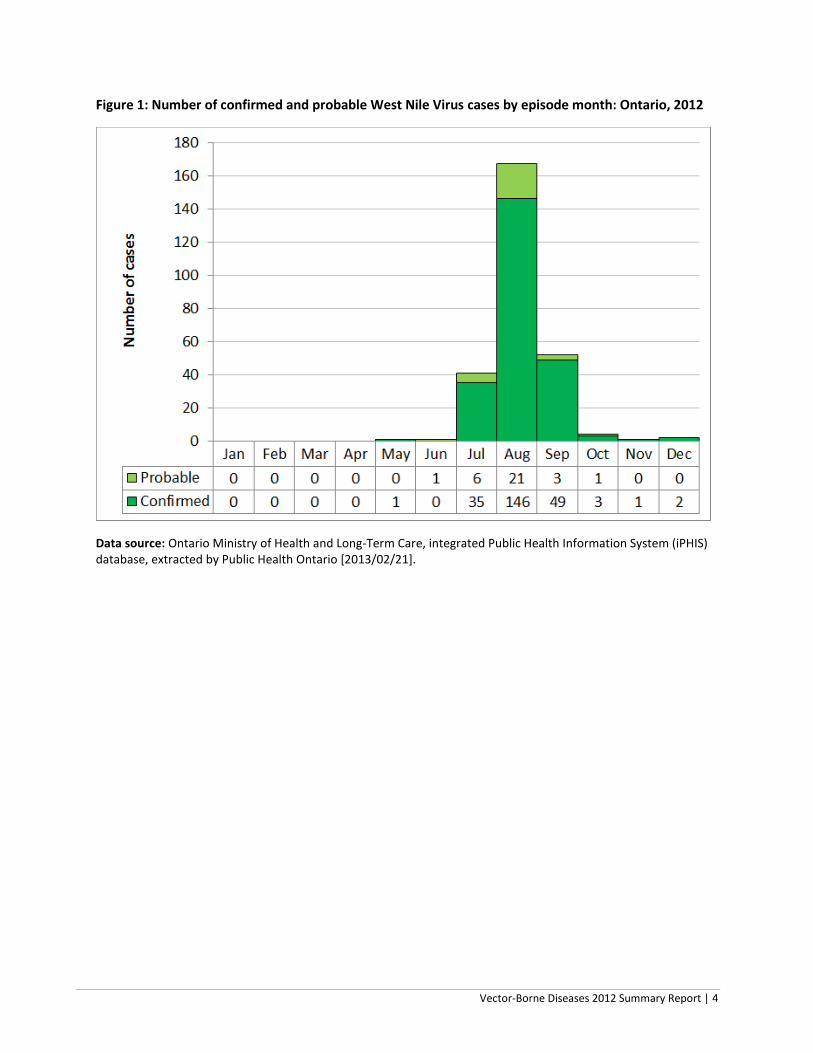
In 2012, there were 269 confirmed and probable cases of WNV in humans (Figure 1)2. The three-month
period from July to September accounted for 97 per cent (260/269) of these cases, of which 64 per cent
(167/260) were reported in August (Figure 1). The majority of human cases were reported in the Golden
Horseshoe area, with 53 per cent of human WNV cases reported from Toronto, Peel Region and Halton
Region (Figure 2 and Table 1). Together, these PHUs make up approximately 35 per cent of the Ontario
population. The number and incidence of reported confirmed and probable WNV cases in humans has
increased considerably in the past two years (Figure 3). The incidence of WNV cases in humans in 2012
was second only to the incidence in 2002, which was the highest reported since WNV was initially
detected in Ontario. The number of cases more than doubled in 2012 compared to 2011, after
increasing more than eightfold from 2010 to 2011.
Since 2002, PHUs in Ontario have conducted WNV mosquito surveillance from June to October each
year. Mosquito surveillance involves placing mosquito traps in various locations within the PHU, and
then sending the collected mosquitoes to mosquito identification service providers for species
identification. Only certain species are tested for WNV. Similar to the trend in human WNV cases, the
number of positive mosquito pools increased by 62 per cent from 2011 to 2012, after a greater than
fourfold increase from 2010 to 2011 (Figure 4).
2 For WNV case definition see:
http://www.health.gov.on.ca/en/pro/programs/publichealth/oph_standards/infdispro.aspx

Vector-Borne Diseases 2012 Summary Report | 3
The increase in positive mosquito pools in 2011 and 2012 could be attributed to warmer temperatures
in those years, as measured by number of degree days (Figure 4), which contrasted with the cooler
conditions and low abundance of vector mosquitoes and WNV activity observed in 2008 and 2009.
Temperature has an important influence on the rate of mosquito development and the rate at which the
virus can replicate inside the mosquito vectors. Warmer temperatures usually result in more mosquitoes
that may carry WNV and, as a result, greater risk to humans that are bitten by infected mosquitoes.
In 2012, the majority of positive mosquito pools were reported in the Golden Horseshoe area, as well as
southwestern and southeastern Ontario, with the highest levels of infected mosquitoes also found
around these areas (Figures 5 and 6). These areas are the predominately urban areas of Ontario and
have large numbers of catch basins with standing water, which are good development sites for the main
mosquito vectors. Figure 6 shows the minimum infection rate (MIR), which is an estimation of the
minimum number of positive mosquitoes in the environment. It is stated as the number positive
mosquitoes per 1000. It is a population-adjusted rate used for comparison and analysis. MIR formula: (#
WNV positive pools/Total # of mosquitoes tested)*1000. While MIR can be used to indicate the level of
positive mosquitoes in the environment, it can be somewhat misleading in areas with lower numbers of
mosquito traps. In those areas, a one positive mosquito pool can make the MIR seem quite large, when
compared to the level of WNV activity.
In 2012, several species of mosquitoes tested positive for WNV, including: Cx. pipiens/restuans, Cx.
salinarius, Aedes vexans, Ochlerotatus triseriatus, Oc. trivittatus, Anopheles punctipennis, and Oc.
japonicus. Cx. pipiens/restuans was the species that tested positive for WNV most frequently; however,
Cx. pipiens/restuans are specifically targeted for WNV testing, as this is the vector primarily responsible
for human cases. Prior to 2011, PHUs were allotted three mosquito pools per mosquito trap to test for
WNV and one mosquito pool if Cs. melanura was trapped for EEEV. In 2011, the testing protocol was
changed to one pool for WNV and two pools for EEEV. This change in testing was partially due to the
discovery of EEEV positive mosquito pools in Ontario 2009 and 2010. These were the first years that
mosquitoes tested positive in Ontario for EEEV. In addition, in 2010, there was increased EEEV activity in
jurisdictions bordering Ontario. Quebec, New York, and Massachusetts had reported increased activity;
and Michigan had reported three human cases and 57 equine cases, which were the highest numbers in
that state in 30 years. It was determined that this change in mosquito viral testing was a proactive
approach to determine the risk of EEEV in Ontario and gather baseline evidence for the extent of the
virus in Ontario mosquitoes. The new order for viral testing depended on the species of mosquitoes
captured in the traps and was as follows:
1. Culex pipiens/restuans – WNV
2. Culiseta melanura – EEEV
3. Coquilletidia perturbans – EEEV
4. Aedes vexans – EEEV
5. Remaining order of WNV vectors.
Vector-Borne Diseases 2012 Summary Report | 4
Figure 1: Number of confirmed and probable West Nile Virus cases by episode month: Ontario, 2012
Data source: Ontario Ministry of Health and Long-Term Care, integrated Public Health Information System (iPHIS) database, extracted by Public Health Ontario [2013/02/21].

Vector-Borne Diseases 2012 Summary Report | 5
Figure 2: Incidence rate per 100,000 population and number of confirmed and probable West Nile Virus cases by health unit of residence: Ontario, 2012
Data sources: WNV cases: Ontario Ministry of Health and Long-Term Care, integrated Public Health Information System (iPHIS) database, extracted by Public Health Ontario [2013/02/21]. Population estimates (for rate calculations): Ontario Ministry of Health and Long-term Care, IntelliHEALTH Ontario, extracted by Public Health Ontario [2012/03/18].

Vector-Borne Diseases 2012 Summary Report | 6
Table 1: Number and incidence rate (per 100,000 population) of reported confirmed and probable human cases of West Nile Virus by health unit of residence: Ontario, 2012
HEALTH UNIT Confirmed Probable Total Rate*
(per 100,000) Brant County 2 0 2 1.4 Chatham-Kent 3 0 3 2.8 City of Hamilton 20 0 20 3.7 City of Ottawa 8 0 8 0.9 Durham Region 6 2 8 1.3 Eastern Ontario 0 1 1 0.5 Grey Bruce 2 0 2 1.2 Haldimand-Norfolk 5 0 5 4.5 Haliburton, Kawartha, Pine Ridge 2 0 2 1.1 Halton Region 23 0 23 4.4 Hastings and Prince Edward Counties 0 1 1 0.6 Kingston, Frontenac, Lennox and Addington 2 0 2 1.0 Lambton County 2 0 2 1.5 Leeds, Grenville and Lanark District 1 1 2 1.2 Middlesex-London 6 1 7 1.5 Niagara Region 10 0 10 2.2 Peel Region 15 10 25 1.8 Perth District 2 1 3 3.9 Peterborough County-City 1 0 1 0.7 Renfrew County and District 1 0 1 1.0 Simcoe Muskoka District 3 0 3 0.6 Toronto 81 13 94 3.4 Waterloo Region 2 1 3 0.6 Wellington-Dufferin-Guelph 2 0 2 0.7 Windsor-Essex County 21 1 22 5.5 York Region 17 0 17 1.6
Ontario overall 237 32 269 2.0
Data sources: *Rate based on total human cases (confirmed and probable combined) WNV cases: Ontario Ministry of Health and Long-term Care, integrated Public Health Information System (iPHIS) database, extracted by Public Health Ontario [2013/02/21]. Population estimates (for rate calculations): Ontario Ministry of Health and Long-term Care, IntelliHEALTH Ontario, extracted by Public Health Ontario [2012/10/15]. NOTE: Population counts for 2011 are used to estimate health unit and provincial population counts for 2012. Notes:
Health unit (HU) refers to the HU where the case resided at the time of identification and not necessarily the place of disease exposure or acquisition.
The data only represent confirmed and probable cases of West Nile Virus that were reported to public health units and recorded in iPHIS. Underreporting is assumed.
iPHIS is a dynamic disease reporting system which allows ongoing updates to data previously entered. As a result, data extracted from iPHIS represent a snap shot at the time of extraction and may differ from previous or subsequent reports.

Vector-Borne Diseases 2012 Summary Report | 7
Figure 3: Number of confirmed and probable human West Nile Virus cases by year: Ontario, 2002–12
Data Sources: WNV cases: Ontario Ministry of Health and Long-Term Care, integrated Public Health Information System (iPHIS) database, extracted by Public Health Ontario [2013/02/21]. Population estimates (for rate calculations): Ontario Ministry of Health and Long-term Care, IntelliHEALTH Ontario, extracted by Public Health Ontario [2012/03/18].

Vector-Borne Diseases 2012 Summary Report | 8
Figure 4: Number of reported West Nile Virus human cases and positive mosquito pools: Ontario, 2002–12
Data Sources: WNV cases: Ontario Ministry of Health and Long-Term Care, integrated Public Health Information System (iPHIS) database, extracted by Public Health Ontario [2013/02/21]. Mosquito data: PHO Mosquito Database [2013/02/21]
0
100
200
300
400
500
600
2002 2003 2004 2005 2006 2007 2008 2009 2010 2011 2012
Val
ue
Year
# of Humans # of Mosquito Pools

Vector-Borne Diseases 2012 Summary Report | 9
Figure 5: Location and number of mosquito pools positive for West Nile Virus: Ontario, 2012
Data source: PHO Mosquito Database [2013/02/21]

Vector-Borne Diseases 2012 Summary Report | 10
Figure 6: Minimum infection rate of positive mosquito pools: Ontario, 2012
Data source: PHO Mosquito Database [2013/02/21]

Vector-Borne Diseases 2012 Summary Report | 11
This change in mosquito viral testing could have led to an underestimation of the number of positive
WNV pools for 2012, making it difficult to compare directly to previous years. In recent years, due to an
increased understanding of WNV biology and epidemiology, some PHUs have reduced the number of
mosquito traps or focused their surveillance efforts to areas of greatest risk, e.g., there were 20,064
mosquito pools viral tested in 2005 compared to 13,675 mosquito pools tested in 2012.
Mosquito surveillance serves as an early warning system for WNV. It also allows for the tracking of other
mosquito-borne diseases such as EEEV and alerts the province to the introduction of new mosquito
species. An example of this is Oc. japonicus (a possible WNV vector), which was first identified in Ontario
in 2001 through the mosquito surveillance program in one PHU and has since spread to most Ontario
PHUs. The mosquito surveillance system has also detected a very small number of Ae. albopictus (the
Asian tiger mosquito) in 2005 and 2012 that is a vector of dengue and chikungunya. While this mosquito
species is not established in Ontario and there is no endemic risk of these diseases, it is still important to
note its occurrence and monitor its activity.

Vector-Borne Diseases 2012 Summary Report | 12
Lyme disease The identification and reporting of human Lyme disease cases is similar to West Nile Virus cases. As
above, when notified of a confirmed or probable case of Lyme disease, PHUs report cases via iPHIS as
per provincial reporting requirements.
In 2012, there were 162 human cases of Lyme disease reported in Ontario3. The number of Lyme disease
cases peaked from May to August 2012, with 60 per cent of cases reported in June and July (Figure 7).
This peak during the summer months is similar to other Lyme disease-endemic regions in the United
States and Canada and coincides with both increased human outdoor activities and the vector life cycle
that results in increased risk of Lyme disease transmission during the months when nymphs are feeding.
Feeding nymphs are much more difficult to see than adults and this leads to the increased likelihood of
longer attachment times for nymphs and thus a higher risk of Lyme disease transmission.
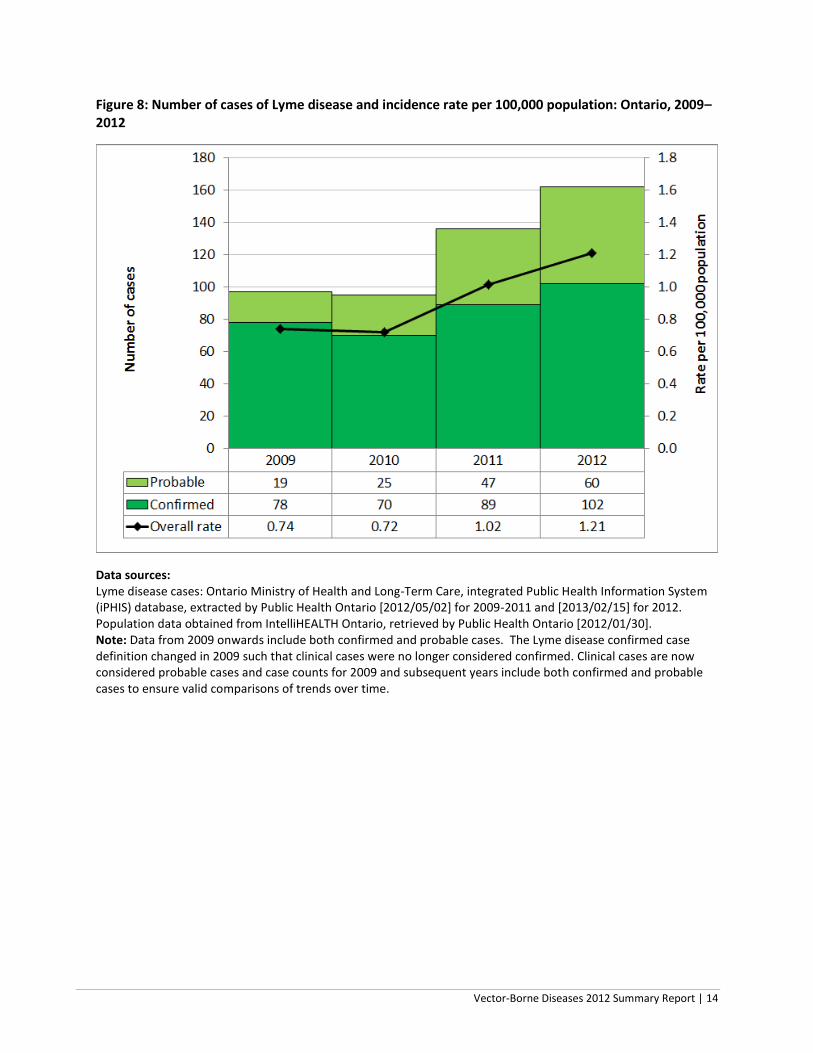
The overall incidence rate of confirmed and probable Lyme disease cases in Ontario in 2012 was 1.2
cases per 100,000 population (Appendix 2). This is 19 per cent higher than the incidence rate of 1.0 case
per 100,000 population reported in 2011 (Figure 8). This difference was not statistically significant.
Although the incidence rate of Lyme disease in Ontario has been steadily increasing since 2002, it is
much lower than in the U.S. overall and New York State, which had incidence rates of 7.8 cases and 16.0
cases per 100,000 population, respectively, in 2011.4
In 2012, of the 162 confirmed and probable Lyme disease cases reported in Ontario, exposure location
was reported for 140 cases (86 per cent). Of the 140 cases with reported exposure location, 103 cases
(74 per cent) were exposed in Ontario (i.e., locally acquired) and 37 cases (26 per cent) were exposed
outside Ontario (i.e., travel-related cases) (Table 2).
The gradual decline in the proportion of travel-related cases is consistent with the tick surveillance data
indicating an increase in the number of blacklegged ticks in Ontario (Figure 9). However, it is important
to note that the number of cases with missing exposure information has more than doubled from 2011
to 2012. Figure 10 shows the geographic distribution of Lyme disease exposure locations among locally-
acquired cases in Ontario. The location of these reported exposure locations are occurring where
Ontario is experiencing its largest numbers of blacklegged tick submissions (Figure 11).
3 Data from 2009 onwards include both confirmed and probable cases. The Lyme disease confirmed case
definition changed in 2009 such that clinical cases were no longer considered confirmed. Clinical cases are now considered probable cases and case counts for 2009 and subsequent years include both confirmed and probable cases to ensure valid comparisons of trends over time. For Lyme disease case definition see: http://www.health.gov.on.ca/en/pro/programs/publichealth/oph_standards/infdispro.aspx 4 Source: http://www.cdc.gov/lyme/stats/chartstables/incidencebystate.html

Vector-Borne Diseases 2012 Summary Report | 13
Six PHUs5 reported 10 or more confirmed/probable cases of Lyme disease in 2012, which accounted for
69 per cent (112/162) of all cases reported in the province (Table 3). No cases were reported by
Ontario’s northern-most PHUs.
In 2012, PHO provided training to over 60 staff, from 21 PHUs, on how to conduct tick surveillance. The
training was hosted in an area with a known tick population and staff was instructed on where and how
to look for ticks in the environment. PHO also assisted PHUs with local continuing medical education
training to help educate physicians on the most current tick biology, epidemiology, and Lyme disease
diagnosis and treatment. With the increase in blacklegged ticks and Lyme disease activity in Ontario,
PHO will continue to provide training to PHUs to assist with their Lyme disease programs.
Figure 7: Distribution of Lyme disease cases* by month: Ontario, 2012
Data source: Ontario Ministry of Health and Long-Term Care, integrated Public Health Information System (iPHIS) database, extracted by Public Health Ontario [2013/02/15]. *Note: Includes confirmed and probable cases. The Lyme disease confirmed case definition changed in 2009 such that clinical cases were no longer considered confirmed. Clinical cases are now considered probable cases and case counts for 2009 and subsequent years include both confirmed and probable cases to ensure valid comparisons of trends over time.
5 Toronto; Leeds-Grenville and Lanark District; City of Ottawa; Kingston-Frontenac, Lennox and Addington; Eastern
Ontario; and Peel Region.
Vector-Borne Diseases 2012 Summary Report | 14
Figure 8: Number of cases of Lyme disease and incidence rate per 100,000 population: Ontario, 2009–2012
Data sources: Lyme disease cases: Ontario Ministry of Health and Long-Term Care, integrated Public Health Information System (iPHIS) database, extracted by Public Health Ontario [2012/05/02] for 2009-2011 and [2013/02/15] for 2012. Population data obtained from IntelliHEALTH Ontario, retrieved by Public Health Ontario [2012/01/30]. Note: Data from 2009 onwards include both confirmed and probable cases. The Lyme disease confirmed case definition changed in 2009 such that clinical cases were no longer considered confirmed. Clinical cases are now considered probable cases and case counts for 2009 and subsequent years include both confirmed and probable cases to ensure valid comparisons of trends over time.

Vector-Borne Diseases 2012 Summary Report | 15
Table 2: Number and incidence rate (per 100,000 population) of reported confirmed and probable human cases of Lyme disease by health unit of residence: Ontario, 2012
Health Unit Confirmed Probable Total Rate*
(per 100,000) Algoma District 0 1 1 0.8
Brant County 1 0 1 0.7
Chatham-Kent 2 0 2 1.8
City of Hamilton 2 2 4 0.7
City of Ottawa 14 4 18 2.0
Durham Region 2 0 2 0.3
Eastern Ontario 2 10 12 6.0
Haldimand-Norfolk 2 0 2 1.8
Haliburton, Kawartha, Pine Ridge 0 1 1 0.6
Halton Region 3 1 4 0.8
Hastings and Prince Edward Counties 8 1 9 5.5
Kingston, Frontenac, Lennox and Addington 0 13 13 6.6
Leeds, Grenville and Lanark District 24 5 29 17.0
Middlesex-London 1 0 1 0.2
Niagara Region 2 2 4 0.9
Northwestern 1 1 2 2.4
Oxford County 0 2 2 1.8
Peel Region 9 1 10 0.7
Peterborough County-City 0 2 2 1.4
Renfrew County and District 0 2 2 1.9
Simcoe Muskoka District 1 0 1 0.2
Toronto 21 9 30 1.1
Waterloo Region 4 0 4 0.8
Wellington-Dufferin-Guelph 1 0 1 0.4
York Region 2 3 5 0.5
Ontario overall 102 60 162 1.2
Data sources: *Rate based on total human cases (confirmed and probable combined) Lyme disease cases: Ontario Ministry of Health and Long-term Care, integrated Public Health Information System (iPHIS) database, extracted by Public Health Ontario [2013/02/21]. Population estimates (for rate calculations): Ontario Ministry of Health and Long-term Care, IntelliHEALTH Ontario, extracted by Public Health Ontario [2012/10/15]. NOTE: Population counts for 2011 are used to estimate health unit and provincial population counts for 2012. Notes:
Health unit (HU) refers to the HU where the case resided at the time of identification and not necessarily the place of disease exposure or acquisition.
The data only represent confirmed and probable cases of Lyme disease that were reported to public health units and recorded in iPHIS. Underreporting is assumed.
iPHIS is a dynamic disease reporting system which allows ongoing updates to data previously entered. As a result, data extracted from iPHIS represent a snap shot at the time of extraction and may differ from previous or subsequent reports.

Vector-Borne Diseases 2012 Summary Report | 16
Figure 9: Number of blacklegged ticks submitted to the Public Health Ontario Laboratories: Ontario, 2006–12
Data source: National Microbiology Laboratory, extracted by PHO [2013/02/19]

Vector-Borne Diseases 2012 Summary Report | 17
Figure 10: Municipalities identified as the most likely exposure location for locally acquired Lyme disease cases: Ontario, 2012
Data source: Ontario Ministry of Health and Long-Term Care, integrated Public Health Information System (iPHIS) database, extracted by Public Health Ontario [2013/02/15]. Note: Includes confirmed and probable cases. The Lyme disease confirmed case definition changed in 2009 such that clinical cases were no longer considered confirmed. Clinical cases are now considered probable cases and case counts for 2009 and subsequent years include both confirmed and probable cases to ensure valid comparisons of trends over time.

Vector-Borne Diseases 2012 Summary Report | 18
Figure 11: The location and number of blacklegged ticks submitted to the Public Health Ontario Laboratory, based on the submitter’s community of residence: Ontario, 2012
Data source: National Microbiology Laboratory, extracted by PHO [2013/02/19]

Vector-Borne Diseases 2012 Summary Report | 19
Table 3: Lyme disease cases by exposure setting: Ontario, 2008–12
EXPOSURE SETTING Percentage (%) of total in each Year
2008 (n=110)
2009 (n=97)
2010 (n=95)
2011 (n=136)
2012 (n=162)
Exposures within Ontario 58.2 46.4 45.2 67.6 63.6
Travel outside Ontario 31.8 38.1 33.7 26.5 22.8
Missing 10.0 15.5 21.1 5.9 13.6
Total (%) 100.0 100.0 100.0 100.0 100.0
Data source: Ontario Ministry of Health and Long-Term Care, integrated Public Health Information System (iPHIS) database, extracted by Public Health Ontario [2012/05/05] for 2009-2011 and [2013/02/15] for 2012. Note: Includes confirmed and probable cases. The Lyme disease confirmed case definition changed in 2009 such that clinical cases were no longer considered confirmed. Clinical cases are now considered probable cases and case counts for 2009 and subsequent years include both confirmed and probable cases to ensure valid comparisons of trends over time.

Vector-Borne Diseases 2012 Summary Report | 20
Eastern Equine Encephalitis Virus To date, no human cases of EEEV have been reported in Ontario. However, while most infected people
will be asymptomatic, the risk of death among those who develop neurological symptoms is higher than
WNV case fatality rates.
The main enzootic vector for EEEV in Ontario and the eastern U.S. is Culiseta melanura. This mosquito
primarily feeds on birds and is mainly found in flooded forests and swamps. The larval form of this
species develops in underwater crypts and attaches to plant stems to breathe. This lifecycle trait can
make it difficult to find these larvae and control for them. With this species primarily inhabiting swamp-
like areas, the majority of horse cases in Ontario occur in areas adjacent to swamps or flooded forests,
making this more of a rural than urban health risk. Possible bridge vectors include Ae. vexans and Cq.
perturbans. These bridge vectors are more easily captured in Ontario’s mosquito light-traps than Cs.
melanura. They are also thought to readily bite humans and can be found in both urban and rural areas.
This is important because the greatest risk to humans will be present if EEEV is found in the bridge
vectors.
Ontario’s adult mosquito vector surveillance program allows EEEV mosquito species captured during
WNV mosquito trapping to be tested for EEEV by the PHU’s mosquito testing service providers. Since the
2011 mosquito season, PHUs were asked to modify the order of preference and test for the main WNV
vector first followed by specific EEEV vectors (Ae. vexans and Cq. perturbans). The duration of this
modified surveillance initiative will depend on the data acquired and the incidence of vector-borne
diseases in Ontario. It was anticipated that this surveillance would last for at least three years to acquire
a minimal baseline dataset. After 2013, a review of the data will be conducted and it be determined if
the EEEV mosquito surveillance program should continue. Due to the high level of WNV activity in 2012
and the pressures to monitor for only WNV vectors, PHUs were advised that they could decide to revert
to testing only for WNV vectors and only Cs. melanura for EEEV.
There were no EEEV positive mosquitoes reported in 2011 or 2012. The first year that Ontario had ever
recorded EEEV positive mosquitoes was in 2009. These positive mosquitoes were found through Health
Canada’s First Nations and Inuit Health Branch’s (FNIHB) WNV mosquito program, which mirrors
Ontario’s program (Table 4). The positive mosquitoes were identified in a First Nations community
within Simcoe Muskoka District PHU. In 2010, EEEV positive Cs. melanura mosquitoes were again found
in the same First Nations community and also in North Bay-Parry Sound District Health Unit.

Vector-Borne Diseases 2012 Summary Report | 21
Equine Surveillance
EEEV has been reported in Ontario in horses, emus, and pheasants dating back to 1938 (Table 4, Figure
12). In 2012, there were no EEEV equine cases reported by the Ontario Ministry of Agriculture and Food
(OMAF). Ontario animal cases occur in predominantly rural health units with the cases occurring in
different locations each year. Like WNV, horses are dead-end hosts but are an indicator of EEEV positive
mosquitoes in the area.
Table 4: Number of Culiseta melanura captured, EEEV-positive mosquito pools and EEEV horses: Ontario, 2002–12
Year Number of
Cs. melanura
Number of EEEV-Positive
Mosquito Pools
Number of EEEV Horse Cases
2002 15 0 1
2003 5 0 11
2004 26 0 2
2005 11 0 no data
2006 127 0 no data
2007 32 0 0
2008 438 0 4
2009 298 126 2
2010 218 37 3
2011 222 0 4
2012 67 0 0
Data sources: Horse data: OMAF online from http://www.omafra.gov.on.ca/english/livestock/horses/westnile.htm#surveillance Mosquito data: PHO Mosquito Database [2013/02/21]
6 First Nations: 10 pools Culiseta melanura and 2 pools Aedes vexans. 7 Health Units (NPS) 1 pool and First Nations 2 pools all Culiseta melanura

Vector-Borne Diseases 2012 Summary Report | 22
Figure 12: Eastern Equine Encephalitis Virus activity: Ontario, 2002–12
Data sources: Horse data: OMAF online from http://www.omafra.gov.on.ca/english/livestock/horses/westnile.htm#surveillance Mosquito data: PHO Mosquito Database [2013/02/21]

Public Health Ontario
480 University Avenue, Suite 300,
Toronto, Ontario
M5G 1V2
647.260.7100
www.publichealthontario.ca