VARIATION OF DRAG COEFFICIENT ON ROUGH ...ethesis.nitrkl.ac.in/5743/1/E-93.pdfVARIATION OF DRAG...
99
VARIATION OF DRAG COEFFICIENT ON ROUGH CYCLINDRICAL BODIES A Dissertation Submitted in Partial Fulfillment of the Requirements for the Degree of Master of Technology In Civil Engineering MONALISA MALLICK DEPARTMENT OF CIVIL ENGINEERING NATIONAL INSTITUTE OF TECHNOLOGY ROURKELA 2014
Transcript of VARIATION OF DRAG COEFFICIENT ON ROUGH ...ethesis.nitrkl.ac.in/5743/1/E-93.pdfVARIATION OF DRAG...

VARIATION OF DRAG COEFFICIENT
ON ROUGH CYCLINDRICAL BODIES
A Dissertation Submitted in Partial Fulfillment of the Requirements for the Degree of
Master of Technology In
Civil Engineering
MONALISA MALLICK
DEPARTMENT OF CIVIL ENGINEERING
NATIONAL INSTITUTE OF TECHNOLOGY ROURKELA
2014
VARIATION OF DRAG COEFFICIENT
ON ROUGH CYCLINDRICAL BODIES
A
Dissertation
Submitted in Partial Fulfilment of the Requirements for the
Degree Of
MASTER OF TECHNOLOGY
IN
CIVIL ENGINEERING
WITH SPECIALIZATION IN
WATER RESOURCES ENGINEERING
Under the supervision of
Prof Awadhesh Kumar
Submitted By
MONALISA MALLICK
(ROLL NO. 212CE4489)
DEPARMENT OF CIVIL ENGINEERING
NATIONAL INSTITUTE OF TECHNOLOGY ROURKELA
2014

National Institute of Technology
Rourkela
CERTIFICATE This is to certify that the thesis entitled, “VARIATION OF DRAG COEFFICIENT ON
ROUGH CYLINDRICAL BODIES” submitted by Monalisa Mallick in partial fulfilment
of the requirements for the award of Master of Technology Degree in Civil
Engineering with Specialization in “WATER RESOURCES ENGINEERING” at
National Institute of Technology, Rourkela, is an authentic work carried out by her
under my supervision and guidance.
To the best of my knowledge, the matter embodied in this Project Report has not
been submitted to any other University/Institute for the award of any Degree or Diploma.
Prof. Awadhesh Kumar
Water Resources Engineering,
Place: Rourkela Department of Civil Engineering
Date: 30.05.2014 National Institute of Technology, Rourkela
Odisha, India

ACKNOWLEDGEMENTS
A complete research work can never be the work of anyone alone. The
contributions of many different people, in their different ways, have made this
possible.
First of all, I would like to express my sincere gratitude to my supervisor
Prof. Awadhesh Kumar, for his guidance, motivation, constant encouragement,
support and patience during the course of my research work. I truly appreciate
and value his esteemed guidance and encouragement from the beginning to the
end of the thesis
I wish to express my sincere gratitude to Dr. S K Sarangi, Director, NIT,
Rourkela for giving me the opportunities and facilities to carry out my research
work.
I would like to thank Prof. Nagendra Roy; Head of the Dept. of Civil
Engineering, National Institute of technology, Rourkela. I am also thankful to
Prof. Kanhu Charan Patra, Prof. Ramakar Jha, and Prof. Kishanjeet Kumar
Khatua for their kind cooperation and necessary advice.
A special words of thanks to Abinash, who supported me in writing, and
incented to strive towards goal.
I am also thankful to staff members of Hydraulic machine Laboratory
especially Mr. Kulamani Patra and Mr. Minz for their assistance &co-operation
during the exhaustive experiments in the laboratory. I express to my special
thanks to my dear friends Chita, Bibhuti, Rajesh, Arpan, Ellora and my juniors
Rajendra, Anta for their continuous support, suggestions and love.
Finally, I would like to thanks to my father Mr. Sankar charan Mallick and
mother Mrs. Sushilabala Mallick, who taught me the value of hard work by their
own example. I would like to a special thanks to my family, words cannot
express how grateful I am to my Father, Mother, sweet Brother Swarop Ranjan
Mallick and lovely Sister Priyanka Mallick for all of the sacrifices that you have
made on my behalf.
Monalisa Mallick

P a g e | i
Table of Contents
List of Figures ....................................................................................................................... v
List of Tables ...................................................................................................................................vii
List of Notations .............................................................................................................................. viii
ABSTRACT ......................................................................................................................... x
CHAPTER I .......................................................................................................................... 1
INTRODUCTION ................................................................................................................ 1
1.1 AERODYNAMICS ......................................................................................................... 1
1.2 FLOW CLASSIFICATION ............................................................................................. 3
1.2.1 Subsonic Flow .............................................................................................................. 3
1.2.2 Transonic flow ............................................................................................................. 4
1.2.3Supersonic flow ............................................................................................................. 4
1.2.4 Hypersonic flow ........................................................................................................... 4
1.3 DRAG ON A CYLINDER .............................................................................................. 4
1.4 DRAG ............................................................................................................................. 5
1.5 LIFT................................................................................................................................ 6
1.6 DRAG FORCE ............................................................................................................... 6
1.6.1 Pressure Drag and Friction Drag ................................................................................... 6
1.7 DRAG COEFFICIENT ................................................................................................... 7
1.8 PRESSURE COEFFICIENT ........................................................................................... 7
1.9 SIGNIFICANCE AND OBJECTIVES FOR THE RESEARCH ...................................... 7

P a g e | ii
1.10 ORGANISATION OF THESIS ..................................................................................... 9
CHAPTER II ...................................................................................................................... 12
REVIEW OF LITERATURE .............................................................................................. 12
2.1 GENERAL .................................................................................................................... 12
2.2 REYNOLDS NUMBER FOR CIRCULAR CYLINDER............................................... 12
2. 3 DRAG REDUCTION OF A CIRCULAR CYLINDER ................................................ 14
2.4 PREVIOUS WORKS ON EXPERIMENTAL RESEARCH FOR DRAG
COEFFICENT .................................................................................................................... 19
2.4.1 Cylindrical Bodies ...................................................................................................... 20
2.4.2 Rough Cylindrical Bodies ........................................................................................... 21
2.5 SURFACE ROUGHNESS OF CYLINDRICAL BODIES............................................. 21
2.6 PRESSURE DISTRIBUTION ....................................................................................... 22
CHAPTER III ..................................................................................................................... 25
EXPERIMENTATION AND PROCEDURE ...................................................................... 25
3.1.GENERAL .................................................................................................................... 25
3.2 APPARATUS & EQUIPMENTS USED ....................................................................... 26
3.3EXPERIMENTAL PROCEDURE ................................................................................. 28
3.4 EXEPERIMENTAL SETUP ......................................................................................... 29
3.4.1 Setup for Drag Force Measurement ............................................................................ 29
3.4.2 Setup for the Pressure Distribution Experiments ......................................................... 30
3.5 EXPERIMENTAL CYLINDERS .................................................................................. 31
P a g e | iii
3.6 METHODOLOGY ........................................................................................................ 34
3.6.1 Drag Force by Direct Weighing Method ..................................................................... 34
3.6.2 Drag coefficient by pressure distribution Method........................................................ 36
3.7 MEASUREMENT OF PRESSURE COEFFICIENT ..................................................... 38
3.8 MEASUREMENT OF DRAG COEFFICIENT ............................................................. 38
CHAPTER IV ..................................................................................................................... 39
EXPERIMENTAL RESULTS ............................................................................................ 39
4.1 OVERVIEW ................................................................................................................. 39
4.2 DRAG FORCE RESULTS ............................................................................................ 39
4.3 PRESSURE DISTRIBUTION METHOD ..................................................................... 46
CHAPTER V ...................................................................................................................... 57
DIMENSIONAL AND MODEL ANALYSIS ..................................................................... 57
5.1 OVERVIEW ................................................................................................................. 57
5.2 CORRELATION OF DIMENSIONLESS FORM ......................................................... 58
5.3 DIMENSIONLESS FORM ........................................................................................... 62
CHAPTER VI ..................................................................................................................... 68
ESTABLISHMENT OF CORRELATION .......................................................................... 68
6.1 CORRELATION DEVELOPMENT ............................................................................. 68
6.1.1 Data processing .......................................................................................................... 68
6.2 DIMENSIONAL ANALYSIS ....................................................................................... 68
CHAPTER VII .................................................................................................................... 77

P a g e | iv
CONCLUSION ................................................................................................................... 77
7.1 OVERVIEW ................................................................................................................. 77
7.2 SCOPE FOR FUTURE WORK .................................................................................... 78
REFFERENCES ................................................................................................................. 80
PUBLICATIONS FROM THE WORK ............................................................................... 84
A: Published ....................................................................................................................... 84

P a g e | v
List of Figures
Fig. 1.1 Drag coefficient vs Reynolds number for a circular cylinder ................................................. 2
Fig. 1.2 Drag coefficient vs Reynolds number for a smooth surface cylinder and rough surface
cylinder. ............................................................................................................................................ 5
Fig. 3.1 Airflow Bench .................................................................................................................... 26
Fig 3.2 (i to iv) Apparatus used in experimentation in both attachments ........................................... 27
Fig.3.3 Schematic Diagram of Experimental Setup of Airflow Bench .............................................. 28
Fig.3.4 Setup For Drag Force Measurement .................................................................................... 29
Fig.3.5 Setup For Pressure Distribution method .............................................................................. 30
Fig.3.6 (a) Used For Smooth Surface Cylinders with varying diameters. .......................................... 31
Fig.3.6 (b) Used For Rough Surface Cylinders With Different Roughness ....................................... 31
Fig.3.7 (a) Used For Smooth surface cylinders with varying diameters............................................. 31
Fig.3.7 (b) Used For Rough Surface Cylinders With Different Roughness ....................................... 31
Fig.3.8 Cross section of a cylindrical body ....................................................................................... 34
Fig.3.9 Appratus diagram for Direct Weighing Method. ................................................................... 36
Fig.3.10 Appratus diagram for Pressure Distribution Method ........................................................... 38
Fig.4.1 (i)-Fig4.1(iv) Comparison between smooth and rough surface for 12.5mm, 15mm, 20mm and
25mm diameter ............................................................................................................................... 40
Fig.4.2 (i)-Fig.4.2(iv) comparsion between smooth and rough surface at constant velocity 26.14 m/s,
25.48m/s, 24.45m/s & 24.10m/s. ..................................................................................................... 41
Fig.4.3(i) Drag force vs. Diameter, comparsion between in different velocity at constant roughness
326 micron ...................................................................................................................................... 42
Fig.4.3(ii) Drag force vs. Diameter, comparsion between in different velocity at constant roughness
260 micron ...................................................................................................................................... 42
Fig.4.3(iii) Drag force vs. Diameter, comparsion between in different velocity at constant roughness
200 micron ...................................................................................................................................... 43
Fig.4.3(iv) Drag force vs. Diameter, comparsion between in different velocity at constant roughness
160 micron ...................................................................................................................................... 43
Fig.4.4 Comparsion between Drag force vs. Roughness, in different velocity at constant diameter .. 44
Fig.4.5(i)-Fig.4.5(iv) Drag force vs.velocity, in different diameter at constant roughness 325 micron,
260micron, 200micron and 160micron............................................................................................. 45
Fig.4.6 Drag force vs. velocity, in different diameter at smooth surface............................................ 46
Fig. 4.7(i) Comparison 325 micron roughness of cylinder at constant Velocity=26.50 m/s .............. 47
Fig.4.7(ii) Comparison 325 micron roughness of cylinder at constant Velocity=26.50 m/s ............. 47

P a g e | vi
Fig.4.8 (i) Comparison 260 micron roughness of cylinder at constant Velocity=26.50m/s ............... 48
Fig.4.8 (ii) Comparison 260 micron roughness of cylinder at constant Velocity=26.50m/s .............. 48
Fig.4.9 (i) Comparison 260 micron roughness of cylinder at constant Velocity=25.18m/s ............... 49
Fig.4.9(ii) Comparison 260 micron roughness of cylinder at constant Velocity=25.18m/s .............. 49
Fig.4.10(i) Comparison 260 micron roughness of cylinder at constant Velocity=24.83m/s .............. 50
Fig.4.10(ii) Comparison 260 micron roughness of cylinder at constant Velocity=24.83m/s ............. 50
Fig.4.11(ii) Comparison 260 micron roughness of cylinder at constant Velocity=23.41m/s ............ 51
Fig.4.12(i) Comparison 200 micron roughness of cylinder at constant Velocity=26.50m/s ............. 52
Fig.4.12(ii) Comparison 200 micron roughness of cylinder at constant Velocity=26.50m/s ............ 52
Fig.4.13(i) Comparison 200 micron roughness of cylinder at constant Velocity=25.18m/s ............. 53
Fig.4.13(i) Comparison 200 micron roughness of cylinder at constant Velocity=25.18m/s ............. 53
Fig.4.14 (i) Comparison 200 micron roughness of cylinder at constant Velocity=24.83m/s ............. 54
Fig.4.14(ii) Comparison 200 micron roughness of cylinder at constant Velocity=24.83m/s ............ 54
Fig.4.15 (i) Comparison 200 micron roughness of cylinder at constant Velocity=23.41m/s ............. 55
Fig.4.15(ii) Comparison 200 micron roughness of cylinder at constant Velocity=23.41m/s ............ 55
Fig.4.16(i) Comparison 160 micron roughness of cylinder at constant Velocity=26.50m/s .............. 56
Fig.4.16(ii) Comparison 160 micron roughness of cylinder at constant Velocity=26.50m/s ............. 56
Fig.5.1 The relationship between drag coefficient and Reynolds number. ......................................... 62
Fig.5.2 Relationship between drag coefficient and Roughness. ......................................................... 63
Fig.5.3: The relationship between drag coefficient and effect Reynolds number & effect of roughness.
........................................................................................................................................................ 63
Fig.5.4 the relationship between drag coefficient and effect Reynolds numbers, effect of roughness
and other explicit data...................................................................................................................... 66
Fig.5.5 Final correlation plot between the drag parameter with system parameter ............................. 66
Fig.6.1 The relationship between drag force and roughness. ............................................................. 69
Fig. 6.2 The relationship between Drag force and Velocity .............................................................. 70
Fig. 6.3 The relationship between Drag force and Diameter ............................................................. 70
Fig.6.4 The relationship between Drag force and x.......................................................................... 72
Fig.6.5 relationship between Drag force and effect of k, V, D and other correlation data. ................. 74
Fig.6.6 relationship between Drag force and effect of k, V, D and other explicit points. ................... 74
Fig 6.7 Final correlation plots between the drag parameter with system parameters in dimensional
data. ................................................................................................................................................ 75
Fig 6.8 mean % error. ...................................................................................................................... 76

P a g e | vii
List of Tables
Table 3.1: Details of Geometrical parameters of the experimental runs ................................ 32
Table 3.2 Scope of the experiment:- .................................................................................... 33
Table.5.1 Details of correlation constant parameters. ........................................................... 64
Table.5.2 Details of dimensionless parameters of the experimental runs (Roughness =
0.000260m) ......................................................................................................................... 65
Table.5.3 Details of dimensionless parameters of constant velocity =20.46m/s & diameter
=0.02m…………………………………………………………………………………….….65
Table.6.1 Details of dimensional parameters of the experimental runs. ................................ 71
Table.6.2 Details of dimensional parameters of the experimental runs with other explicit
points and correlation data................................................................................................... 73

P a g e | viii
List of Notations
A Projected area
𝐶𝐷 Drag coefficient
𝐶𝑓 Skin friction coefficient
𝐶𝑃 Pressure coefficient
D Diameter of cylinder
e Error
𝐹𝐷 Drag force
𝐹𝐿 Lift force
k Roughness
L Length of cylinder
M Mass
P Gauge pressure
P surface pressure
p Barometric pressure
𝑃𝑎 Absolute pressure
𝑝0 Static pressure
𝑃0 Total pressure
R Gas constant
𝑅𝑒 Reynolds Number

P a g e | ix
𝑅2 Regression coefficient
T Time
U Uniform Speed
V Velocity
X Independent Variable
𝑋1 Dependent variable
Kinematic viscosity
μ Dynamic viscosity
Density
Shear stress
Angle of incidence in degree

P a g e | x
ABSTRACT
The accurate assessment of drag force on bodies of different configuration enable us better
design of structures like buildings, chimney, towers, aeroplanes, automobiles etc. Drag
coefficient is a function of speed, flow direction, object position, object shape and size, fluid
density and fluid viscosity. Many factors affect the overall drag coefficient for vehicles, such
as the following: (1) the shape of the bodies (leading and trailing edges), or nose, of the
vehicle. (2) The surface roughness of the bodies. (3) Such appendages as mirrors, door
handles, antennas, and so forth. Drag is a function of relative speed, flow direction,
placement of the object, object configuration (shape and size), fluid density, fluid viscosity
and roughness of the surface of the bodies. There have been persistent efforts to decrease the
above problems by the use of drag force and pressure distribution of cylindrical bodies.
A review of literature reveals that some investigations relating to aerodynamics quality have
been carried out in cylindrical bodies. Although these examinations have thrown some
graceful on the performance of definite conclusions (qualitative /quantitative) have not been
arrived at as regards their improved performance on a comparative basis with respect to a
conventional drag force. The literature provides limited quantitative study on the effect of
roughness on related parameters in cylindrical bodies’ viz. different diameter of cylinder,
different size of roughness and free streamed velocity.
The present work is the result of extensive experimentation on cylindrical bodies with
varying cylinder diameters, surface roughness and air velocity. The experimental variables
include cylinders of diameters as 12.5mm, 15 mm, 20 mm, and 25 mm, air velocity range is
26.14, 25.48, 24.10, 23.38, 22.26, 21.87, 19.39, 15.46, 10.12 and 8.26 m/s and surface
roughness as 325 micron, 260 micron, 200 micron and 160 micron. The drag coefficient of
flow in each case was calculated from the data obtained by performing tests on an air flow
bench (AF12). For a particular run, the value of drag force and hence the co-efficient of drag
was obtained by two methods: (i) direct application of weights to counter balance the drag
force and, (ii) measuring pressure at different angles around the periphery of the cylinder.
The same procedure is repeated by varying, diameter of the cylinder, free stream velocity and
the roughness of the surface of the cylinder.
A comparison for the drag co-efficient and pressure distribution between the smooth
and rough surfaces of the cylinders are extensively presented. In case of smooth surface
cylinder, the separation angles for different diameter of cylinder calculation are found to be
around 800~90° on either side of the cylinder from the upstream stagnation point. The drag

P a g e | xi
coefficients for smooth surface of different diameter cylinders are calculated by
experimentation and subsequent changes in drag due to introducing surface roughness are
demonstrated. The surface roughness is found by experimentation of different drag
coefficient. From the drag force data obtained from direct weighing method, the correlations
both in terms dimensional and dimensionless parameters have been developed. The predicted
values of drag force have been compared (graphically and tabular form) with the
corresponding experimental ones and have been found to be in good agreement in the range
of the experiment.
In dimensional correlation result is very sensitive, accurate and deterministic. In
dimensionless correlation result is linear with their parameters.
KEYWORDS: Cylinder, Drag force, Drag coefficient, Pressure coefficient.

INTRODUCTION
P a g e | 1
CHAPTER I
INTRODUCTION
1.1 AERODYNAMICS
Drag is the heart of aerodynamic design. The resistance of a body as it moves through a fluid
is of great technical importance in hydrodynamics and aerodynamics. The study of the
performance of bodies in moving airstreams is called aerodynamics. Hydrodynamics is the
name given to the study of moving bodies immersed in liquids, particularly water. Drag force
reduces fuel consumption, range and speed. (Grosche and Meier in 2001) The basic principle
of drag reduction for automobiles include providing rounded smooth contours for the forward
part, elimination or streamlining of appendages, blending of changes in contour (such as at
the hood/windshield interface), and rounding of rear corners. Decreasing drag is a major goal
in designing most kinds of vehicles because a significant amount of energy is required to
overcome drag as vehicles move through fluids (Tsutsui and Igarashi in 2002). Drag
coefficient is a function of speed, flow direction, object position, object shape and size, fluid
density and fluid viscosity. Many factors affect the overall drag coefficient for vehicles, such
as the following:
1. The shape of the bodies (leading and trailing edges), or nose, of the vehicle.
2. The surface roughness of the bodies.
3. Such appendages as mirrors, door handles, antennas, and so forth.
Drag coefficient is not a constant term. It is a function of relative speed, flow
direction, placement of the object, object configuration (shape and size), fluid density,
fluid viscosity and roughness of the surface of the bodies. When simulating the wind flow
over a scale model comprised of curved surfaces, discrepancies are present between the

INTRODUCTION
P a g e | 2
model scale data and full scale winds experienced by the structure. Since the Reynolds
number corresponding to the curved surface is a function of the radius of curvature, there is
an inconsistency between the model scale Reynolds number and the full scale Reynolds
number.
For a circular cylinder, Reynolds number can be computed via Equation (1.1).
𝑅𝑒 =𝑣𝑑
(1.1)
Where, Re is the Reynolds number of the shape; v is the wind velocity in unobstructed flow, d
is the diameter of the cylinder and is the kinematic viscosity of air.
Fig. 1.1 Drag coefficient vs Reynolds number for a circular cylinder
Subcritical flow over a smooth cylinder generally occurs at Re less than 2x10⁵ Sub-critical
flows are characterized by laminar flow over the windward surface of the cylinder with the

INTRODUCTION
P a g e | 3
flow separating on the upwind face (Scruton and Rogers in 1997). Super-critical flow occurs
at Re greater than 4x10⁶ and is evident by the turbulent boundary layer that forms over the
surface of the cylinder. The turbulent wind separates from the cylinder on the leeward face
and results in a lower drag coefficient. The critical region is defined as flow resulting at Re
between those of sub-critical and super-critical flows. Aerodynamic drag generally consists
of friction drag and pressure drag. Friction drag is determined almost entirely by the state of
the boundary layer (laminar, transition or turbulent), and does not vary greatly between
subsonic and supersonic flight.
1.2 FLOW CLASSIFICATION
Flow velocity is used to classify flows according to speed regime. Subsonic flows are flow
fields in which air velocity throughout the entire flow is below the local speed of sound.
Transonic flows include both regions of subsonic flow and regions in which the flow speed is
greater than the speed of sound. Supersonic flows are defined to be flows in which the flow
speed is greater than the speed of sound everywhere. A fourth classification, hypersonic flow,
refers to flows where the flow speed is much greater than the speed of sound.
Aerodynamicists disagree on the precise definition of hypersonic flow. (Pasto in 2008)
1.2.1 Subsonic Flow
Subsonic (or low-speed) aerodynamics studies fluid motion in flows which are much lower
than the speed of sound everywhere in the flow. There are several branches of subsonic flow
but one special case arises when the flow is in viscid, incompressible and irrational. This case
is called potential flow.

INTRODUCTION
P a g e | 4
1.2.2 Transonic flow
The term Transonic refers to a range of velocities just below and above the local speed of
sound (generally taken as 0.8-1.2). It is defined as the range of speeds between the critical
Mach number, when some parts of the airflow over an aircraft become supersonic and a
higher speed, typically near Mach 1.2, when all of the airflow is supersonic. Between these
speeds, some of the airflow is supersonic, and some is not.
1.2.3Supersonic flow
Supersonic flow behaves very differently from subsonic flow. Fluids react to differences in
pressure; pressure changes are how a fluid is "told" to respond to its environment. Therefore,
since sound is in fact an infinitesimal pressure difference propagating through a fluid,
the speed of sound in that fluid can be considered the fastest speed that "information" can
travel in the flow.
1.2.4 Hypersonic flow
In aerodynamics, hypersonic speeds are speeds that are highly supersonic. In the 1970s, the
term generally came to refer to speeds of Mach 5 (5 times the speed of sound) and above. The
hypersonic regime is a subset of the supersonic regime. Hypersonic flow is characterized by
high temperature flow behind a shock wave, viscous interaction, and chemical dissociation of
gas.
1.3 DRAG ON A CYLINDER
The drag force i.e. the force exerted by the following fluid on the cylinder in direction of flow
depends upon the Reynolds number of the flow. From experimentations, it has been observed
that:

INTRODUCTION
P a g e | 5
(i) When Reynolds number(𝑅𝑒) < 1, drag force is directly proportional to velocity
and hence the drag co-efficient (𝐶𝐷) is inversely proportional to Reynolds
number.
(ii) When Reynolds increases from 1 to 2000, the drag co-efficient decreases. The
minimum value of 0.95 at Re = 2000.
(iii) When the value of Reynolds number is increased from 3 × 10⁴ to3 × 105. At
Re= 3 × 10⁵, the value of CD is 0.3.
(iv) If the Reynolds number is increased beyond3 × 106 , the value of CD increases
and it becomes equal to 0.7 in the end.
Fig. 1.2 Drag coefficient vs Reynolds number for a smooth surface cylinder and rough
surface cylinder.

INTRODUCTION
P a g e | 6
1.4 DRAG
The component of the total force in the direction of motion is called drag. Thus drag
is the force exerted by the fluid in the direction of motion. Drag is the force on a body caused
by the fluid that resists motion in the direction of travel of the body.
1.5 LIFT
The component of the total force in the direction perpendicular to the direction of
motion is called lift. Thus lift is the force exerted by the fluid in the direction perpendicular to
the direction of motion.
1.6 DRAG FORCE
The drag force = Force due to pressure in the direction of fluid motion and force due to
shear stress in the direction of fluid motion.
= pdA cos θ + τ0dA cos(90 − θ) (1.2)
Total Drag
𝐹𝐷 = pdA cos θ + τ0dA sin θ (1.3)
1.6.1 Pressure Drag and Friction Drag
Total drag on a body is due to two components. Pressure drag (also called form drag) is due
to the disturbance of the flow stream as it passes the body, creating a turbulent wake. Friction
drag (also called skin drag and shear drag) is due to shearing stresses in the thin layer of fluid
near the surface of the body called the boundary layer.

INTRODUCTION
P a g e | 7
The relative contribution of the pressure drag and friction drag to the total drag depends on:
1. Shape of the immersed body.
2. Position of the body immersed in the fluid, and
3. Fluid characteristics.
1.7 DRAG COEFFICIENT
The magnitude of the drag coefficient for pressure drag depends on many factors,
most notably the shape of the body, the Reynolds number of the flow, the surface
roughness, and the influence of other bodies or surfaces in the vicinity.
It is a dimensionless number that depends on the shape of the body and its orientation
relative to the fluid stream.
CD is the drag coefficient.
1.8 PRESSURE COEFFICIENT
CP is the pressure coefficient.
Experimental procedure is to measure CP at different angular position on the
surface of the cylinder to predict the overall drag coefficient and separation angle
of the cylinder.
𝐶𝑃 =𝑃−𝑝01
2𝜌𝑈2
(1.4)
1.9 SIGNIFICANCE AND OBJECTIVES FOR THE RESEARCH
The present work is aimed to study the distribution of pressure in ‘rough cylindrical bodies’.
The distribution of pressure along the cylinder depends on total pressure, static pressure,
pressure coefficient, angle of incidence and free streamed velocity. Out of these parameters

INTRODUCTION
P a g e | 8
pressure coefficient and angle of incidence plays a major role in estimation of pressure
distribution in rough cylindrical bodies.
Even for rough cylindrical bodies computational works are reported more than experimental
studies. Therefore experimental analysis on drag force along the rough cylindrical bodies can
be studied more extensively which can further applied to automobile during aerodynamic
conditions. These studies should be useful in determining the drag coefficient through a
rough cylindrical body to solve many designing problems and also it provides a better design
of structure in automobiles, building and towers. The objectives of the present work are
summarized as:
1. To Measure the drag force on cylindrical bodies with varying velocity, diameter and
roughness.
2. To measure pressure distribution at (0 to 180, and 0 to -180) angles of incidence for
the different cases. Determination of pressure distribution along with different
diameter and different size of roughness in cylindrical bodies.
3. To find out drag coefficient under varying above varying conditions by two methods
viz. (i) Drag force by direct weighing method and (ii) pressure measurement at
different angles of incidence.
4. To compare predicted values of drag co-efficient with the corresponding ones
obtained experimentally by above two methods.
5. To propose a correlation for the drag co-efficient. Development of a correlation with
dimensionless and dimensional analysis of the drag force and drag coefficient of the
cylindrical bodies.

INTRODUCTION
P a g e | 9
6. To conduct experiment and analyze experimental data for the investigation of drag
force and pressure distribution for different diameter, roughness and velocity for
smooth and rough cylindrical bodies.
1.10 ORGANISATION OF THESIS
The thesis consists of seven chapters. General introduction is given in Chapter 1, literature
review is presented in Chapter 2, experimental work is described in Chapter 3, experimental
results are outlined and analysis of results are done in Chapter 4, the dimensionless
correlation is in chapter 5, the development of correlation is in chapter 6 and finally the
conclusions, scope of future work and references are presented in Chapter 7.
Chapter-1 outlines the introduction to different characteristic of drag force along with their
impact on the drag coefficient and pressure distribution phenomenon and the objectives of the
investigation undertaken.
Chapter–2 presents the literature review which summarizes the up-to-date investigations
related to drag coefficient viz. drag force, pressure coefficient, pressure distribution, surface
roughness and drag reduction. Investigations in drag force with various shape and size
specification and supported by different types of coefficient have also been incorporated in
this chapter.
Chapter–3 describes the experimental setup with details of attachments: one for Direct
weighing method and another for pressure distribution. It also explains detailed experimental
procedure and methodology. The different aspects of investigation have also been outlined.
The variables include cylinders of four diameters, four different roughness for the cylindrical

INTRODUCTION
P a g e | 10
surfaces and ten free stream velocities. The scope of the present investigation has been
presented in Table No-3.2
Chapter- 4 presents data collection and analysis. The calculation of drag coefficient
ratio (CD) i.e. the ratio of the drag force and 1
2𝜌𝐴𝑣2. Thus, drag coefficient ratio is a
function of drag force and dynamic pressure of the cylindrical bodies.
The comparison of the predicted results for the drag force ratio for the drag force and
dynamic pressure indicates that all types of diameters used in the investigation are quite
effective in reducing the roughness over the drag force ones. Also, the effect of the pressure
coefficient results in the reduction of drag coefficient. Thus, the combined effect of
roughness, velocity and diameter and pressure coefficient, whereas diameter increases the
drag force increases and velocity increases the drag force increases, velocity decreases with
drag force decreases.
Chapter- 5 Presents the development of two correlations: (i) in dimensional terms
and (ii) in the in non-dimensional forms. The relation can be expressed as functions of
dimensionless terms containing roughness, velocity and diameter parameters and the
properties of the aerodynamic particles and the aerodynamic medium. These correlations
have been expressed in the form of modified drag coefficient ratio (CD) in order to ensure the
analysis of the experimental data for the effect of the individual dimensionless group has
been carried out. Using the values of the constants and the exponents as obtained by the
regression analysis of the data, the final correlations for modified drag coefficient ratio have
been obtained as under: For this, drag coefficient ratio has been expressed as functions of
system variables in dimensional and non-dimensional forms separately as under:

INTRODUCTION
P a g e | 11
(i) Dimensional terms: 𝐹𝐷 = 𝐶(𝑉𝑛1)(𝐷𝑛2)(𝑘𝑛3)
(ii) Dimensionless terms: 𝐹𝐷
1
2𝜌𝐴𝑉2
= 𝐶(𝑅𝑒)𝑛1 (𝑘
𝐷)𝑛2
Developed for the prediction of drag force in rough cylindrical bodies with different diameter
of cylinder and different surface roughness. To show the effect of roughness, effect of
velocity, effect of diameter. The developer parameters have been used in dimensionless form
and the following correlations have been developed:
Chapter -6 Using different system variables expressed in dimensionless form, the
following correlations have been obtained:
Chapter-7 conclusion summarizes the conclusion reached by the present research and
scope of future work is listed out.
References that have been made in subsequent chapters are provided at the end of the
thesis.

LITERATURE REVIEW
P a g e | 12
CHAPTER II
REVIEW OF LITERATURE
2.1 GENERAL
Although the literature covers an extensive variety of theories, this review will focus on
major theories which develop constantly. The Chapter describes the past research works
based on the proposed study. A continuous effort has been made researchers to study the
pressure drag and shear drag on different bodies. The widespread use of drag coefficient in
aerodynamic applications has motivated many researchers to study various characteristics of
their geometrical parameters. Drag force along the drag coefficient of a cylinder is
influenced by Many factors particularly, the different diameter of cylinder, velocity and the
size of the roughness i.e. 326 micron, 260 micron, 200 micron, 160 micron. It is quite
necessary to take into description the pressure distribution that exists in aerodynamics to
understand the pressure coefficient. So the present review of literature includes works on
experimental research of pressure distribution and drag coefficient for rough cylindrical
bodies in aerodynamics.
2.2 REYNOLDS NUMBER FOR CIRCULAR CYLINDER
Many researches had been carried out to predict the variation of drag Coefficient vs.
Reynolds number for circular cylinder.
Roshko (1961) showed that measurements on a large circular cylinder in a pressurized wind
tunnel for Reynolds numbers from 106 to 107 and revealed a high Reynolds number transition
in which the drag coefficient increases from its low supercritical value to a value

LITERATURE REVIEW
P a g e | 13
0.7 at Re = 3.5 x l06 and then becomes constant. Also, for Re > 3.5 x l06, definite vortex
shedding occurs, with Strouhal number 0.27.
Achenbach and Heinecke (1981) observed that the range of Reynolds number 6×10³ to
5×10⁶ effect of relative roughness on drag for the flow over circular cylinder. They
investigated vortex shedding phenomena in this range.
Shih and Wang et al (1993) studied the flow past rough circular cylinders at high Reynolds
numbers. In their research they had carried out experiments using three rough cylinder
models with three different k/d ratios, along with one smooth cylinder. They had tested using
variable density, low turbulence facilitated pressure tunnel at NASA Ames Research Centre.
It is found that there is an effect of Reynolds number on pressure distribution at low Re
and hence for all three roughness model and smooth model, the base pressure co-
efficient depends on Reynolds number. When the roughness increases, the base-pressure co-
efficient becomes independent of Reynolds number in the range beyond 2x10⁶.
Williamson (1996) has presented comprehensive description of flow phenomena at different
Reynolds number.
Mittal and Singh (2005) studied flow past a circular cylinder for Re= 100 to 107 numerically
by solving the unsteady incompressible two dimensional Navier-Stokes equations and they
described the shear layer instability and drag crisis phenomena.
Triyogi et al. (2009) used of the I-type small cylinder with a cutting angle of θs =65º as
passive control at a stagger angle of α=0 is most effective in reducing the drag of the large
circular cylinder, among the passive control cylinders used in this investigation.
Butt and Egbers (2013) presented that a circular cylinder produces large drag due to pressure
difference between upstream and downstream. The difference in pressure is caused by the

LITERATURE REVIEW
P a g e | 14
periodic separation of flow over surface of the cylinder. In this paper, discussed taking into
consideration the well-known characteristics of flows over rough and dimpled cylinders and
flow over circular cylinders with patterned surfaces is studied. Researches were performed in
a subsonic wind tunnel to note the effect of hexagonal patterns on the flow of air at Reynolds
numbers ranging from 3.14E+04 to 2.77E+05. The investigations shown that a patterned
cylinder with patterns pressed outwards has a drag coefficient equal to 65% of the
smooth one. Various flow visualization techniques including measurement of velocity
profiles in the wake region and smoke flow visualization were employed to explain the
effect and hence understand the reason of drag reduction. Besides that the investigation
of vortex shedding frequencies determined by using hot wire anemometry suggested that they
do not change expressively with the decrease in drag coefficient in contrast to the dimpled
cylinders.
2. 3 DRAG REDUCTION OF A CIRCULAR CYLINDER
Bouak and Lemay (2001) the value obtained for the single cylinder is about 32% less than of
the reduction of mean drag coefficient by claimed other authors. This result gained at Re
values ranging from 1.5×10⁴ to 4.0×10⁴,S/d=2.55,and ds/d=1.25.
Grosche and Meier (2001) this paper summaries nearly experimental investigations on
aerodynamics of bluff bodies which had been carried out at the former DLR Institute of Fluid
Mechanics, now Institute of Aerodynamics and Flow Technology. (a) drag reduction by
passive ventilation of the wake of the body, (b) reduction of the drag of automobiles by shape
optimisation to eliminate or at least decrease trailing vortices, (c) determination of the main
sources of aerodynamic noise of high velocity trains which result from unsteady flow
LITERATURE REVIEW
P a g e | 15
separations, (d) experiments on active flow control to delay flow separation are included
given.
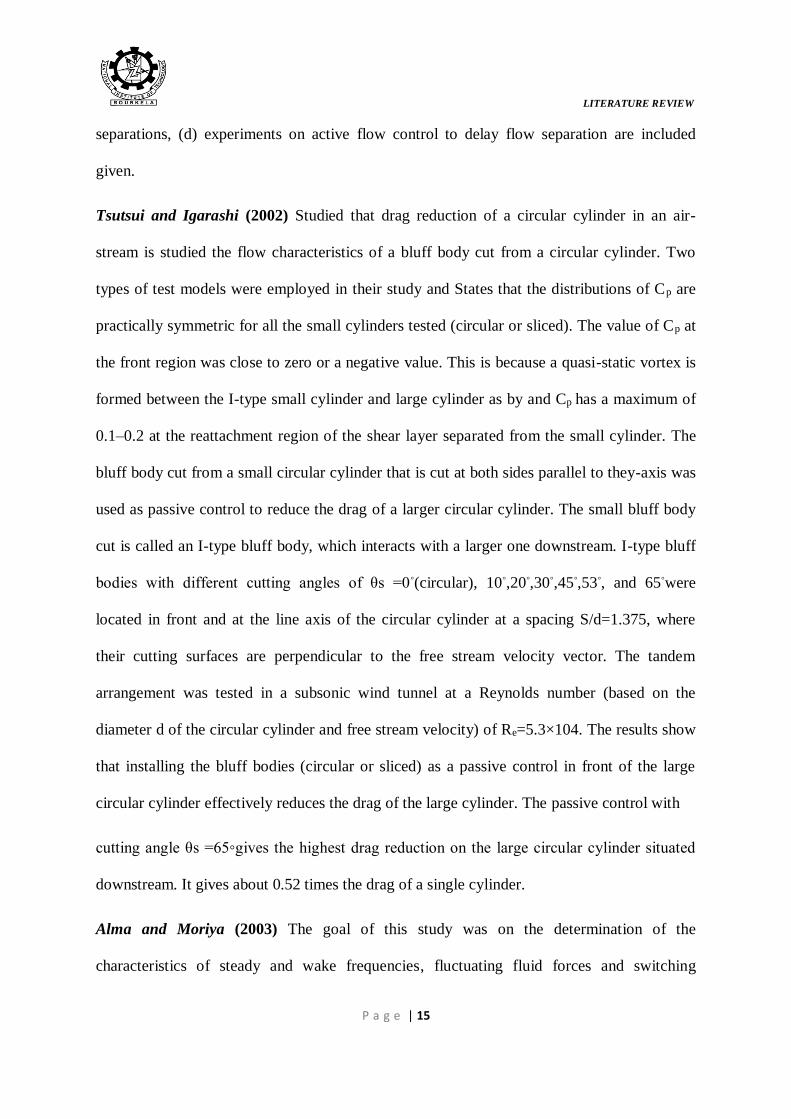
Tsutsui and Igarashi (2002) Studied that drag reduction of a circular cylinder in an air-
stream is studied the flow characteristics of a bluff body cut from a circular cylinder. Two
types of test models were employed in their study and States that the distributions of Cp are
practically symmetric for all the small cylinders tested (circular or sliced). The value of Cp at
the front region was close to zero or a negative value. This is because a quasi-static vortex is
formed between the I-type small cylinder and large cylinder as by and Cp has a maximum of
0.1–0.2 at the reattachment region of the shear layer separated from the small cylinder. The
bluff body cut from a small circular cylinder that is cut at both sides parallel to they-axis was
used as passive control to reduce the drag of a larger circular cylinder. The small bluff body
cut is called an I-type bluff body, which interacts with a larger one downstream. I-type bluff
bodies with different cutting angles of θs =0◦(circular), 10◦,20◦,30◦,45◦,53◦, and 65◦were
located in front and at the line axis of the circular cylinder at a spacing S/d=1.375, where
their cutting surfaces are perpendicular to the free stream velocity vector. The tandem
arrangement was tested in a subsonic wind tunnel at a Reynolds number (based on the
diameter d of the circular cylinder and free stream velocity) of Re=5.3×10⁴. The results show
that installing the bluff bodies (circular or sliced) as a passive control in front of the large
circular cylinder effectively reduces the drag of the large cylinder. The passive control with
cutting angle θs =65◦gives the highest drag reduction on the large circular cylinder situated
downstream. It gives about 0.52 times the drag of a single cylinder.
Alma and Moriya (2003) The goal of this study was on the determination of the
characteristics of steady and wake frequencies, fluctuating fluid forces and switching

LITERATURE REVIEW
P a g e | 16
phenomena in two side-by-side cylinders. In the case of corresponding vortex shedding and
even in the transitional flow pattern, a predominant antiphase corresponding vortex was
found in both the case of two side-by-side circular cylinders and the case of two side by-side
square cylinders. For T=D>0:20; (T; gap spacing between cylinders; D; diameter), the action
of lift forces on both cylinders was in an outward (repulsive); however, for T=D¼0:10; the
action of lift force on the cylinder related with the narrower wake was inward and that on the
other cylinder was outward. The aerodynamic characteristics of two stationary cylinders, both
square and circular, in a side-by-side arrangement were examined experimentally in a
uniform flow at a Reynolds number of 5.51×10⁴, although the square cylinder results are
partial.
Lee and Cheol (2004) Flow control around bluff bodies is of importance and of interest for
wind engineering. The authors investigated this flow control and proposed two new flow
control methods. The first method controls shear layers separated from the bluff body, and
the second controls surface flow around bluff bodies by setting up a small rod upstream of the
bluff body. For the second method, the authors stated that the flow pattern changes,
depending on rod diameter ds, its position, and Reynolds number. For Reynolds numbers Re
ranging from1.5 ×104 to 6.2×10⁴ and the ratio of rod diameter relative to downstream
cylinder diameter (ds/d) being 0.25, with the longitudinal distance between the axis of the
downstream cylinder to the rod relative to downstream cylinder diameter(S/d) being
1.75–2.0, the total drag including the drag of the rod decreased by 63 per cent compared with
that of a single cylinder.
Pasto (2008) presented the results of experimentation on the behavior of a freely vibrating
circular cylinder in laminar and turbulent flows. By varying the cylinder roughness and the

LITERATURE REVIEW
P a g e | 17
mass-damping parameters wind tunnel tests had been conducted. The effects of surface
roughness and flow turbulence were considered in term of an effective Reynolds number, Re
eff. Here it was seen that, it was possible to examine the sample before and after the
beginning of the cylinder boundary layer transition. It had been shown that both mz and
Reynolds number play an important role in governing the response during lock in; If mz is
fixed, the responses is inversely related to Reeff , i.e. with increase in responses the value of
Reeff decreases and vice versa. Moreover, it had been observed that the cylinder may
experience vortex-induced vibrations even in the critical Reeff regime characterized by a
cessation of coherent vortex shedding in steady configuration. They discussed about the
effects of mz and Reeff on the critical velocity (the velocity at which the maximum amplitude
of response is approached), on the wideness of the lock in range, and on the wake correlation
length.
Mohammad and Islam et al. (2010) Drag indicates a great role on aerodynamics and fluid
mechanics while it is shown for any kind of moving object of different shape. An important
number of experiments were achieved for reduction of drag force because drag causes high
power consumption and also structural failure of the object. Reduction of drag force of
circular cylinder by attaching circular rings is described in this research. For finishing this
experiment models are verified in 36x36x100 cm subsonic wind tunnel. By using an external
balance, drag measurements are carried out. Drag force over circular cylinders of different
diameter without any rings are verified first. Then circular rings attached circular cylinders
are verified. It is observed that there is reduction of drag even though the projected area
increased because rings causes more attached flow than the plain cylinder. The optimum
value of drag reduction is found when ring is 1.3d and aspect ratio of cylinder is

LITERATURE REVIEW
P a g e | 18
approximately 12. The experimental results show drag reduced by this optimum
configuration is 25%.
Guy and Steve (2012) presented the result of an investigation on the effect of wind
turbulence for the reduction of drag for a speed skater. A speed skater competing in an indoor
oval is subjected to turbulent flow condition. The goal of the research is to calculate drag
coefficients for different Reynolds numbers. The goal of the report is to identify the
characteristics of different drag coefficient on bluff body aerodynamics and to show the need
of slender bodies through the drag values. Circular cylinder has large dynamic drag resulting
from the separation of flow over the cylinder. To reduce the drag coefficient of a circular
cylinder, some methods have been studied, such as a cylinder with roughened surface, and so
on.
Tamayol (2013) studied that Pressure drop of ordered arrays of cylinders embedded inside
micro channels was experimentally and methodically. Two independent modeling techniques
are used to predict the flow resistance for the creeping flow regime. The pressure drop is
expressed as a function of the involved geometrical parameters such as micro-cylinder
diameter, spacing between adjacent cylinders, channel height, and its width. To verify the
developed models, 15 silicon/glass samples are fabricated using the deep reacting ion etching
(DRIE) technique. Pressure drop measurements are performed over a wide range of nitrogen
flow rates spanning from 0.1 sccm to 35 sccm. Both methods predict the trend of the
experimental data. The porous medium approach shows a wider range of applicability with
reasonable accuracy while the variable cross-section technique is more accurate for dense
arrays of micro-cylinders. Our results suggest that an optimal micro-cylinder diameter exists
that minimizes the pressure drop for a specific surface area-to-volume ratio. This diameter is
a function of the channel dimensions and the desired surface area-to-volume ratio.
LITERATURE REVIEW
P a g e | 19
2.4 PREVIOUS WORKS ON EXPERIMENTAL RESEARCH FOR
DRAG COEFFICENT
The literature review contains cylindrical bodies of research on the subject of drag force in
aerodynamics. This review intends to present some of the selected significant contribution to
the study of drag force in aerodynamics. Research are done covering several aspects such as
using different shape like cylinder and flat plate; different size of cylinder such as 0.0125m,
0.015m, 0.020m, 0.025m with different surface types like smooth and rough cylinder to study
the factors influencing the drag force and pressure distribution.
Alridge and Hunt (1978) Measurements are described of the drag coefficient of porous
circular cylinders fixed between solid hemispherical end caps, for five values of aspect
ratio between 7.92 and 2.67 .The Reynolds number varies between 104 and 2.6 xl05. It is
found that the drag coefficient increases with aspect ratio much as a solid cylinder's but its
drag coefficient is about 20% higher. Flow-visualization experiments have also been
conducted, and show how fluid passes through the cylinders and how the vortex
shedding is weaker than for solid cylinders.
Protas (2002) we are absorbed in identifying the physical mechanisms that accompany mean
drag modifications in the cylinder wake flow subject to rotary control in this paper. We
studied simple control laws where the obstacle rotates harmonically with frequencies varying
from half to more than five natural frequencies. In our analysis we studied the results of the
numerical simulations at Re=150. All the simulations were performed using the vortex
method. We confirm the concerning mean drag reduction at higher forcing frequencies. The
main result is that changes of the mean drag are achieved by modifying the Reynolds stresses

LITERATURE REVIEW
P a g e | 20
and the related mean flow correction. It is argued that mean drag reduction is connected with
control driving the mean flow toward the unstable the basic flow.
Richter and Petr (2012) the heat and fluid past non-spherical particles under different angles
of attack is measured. They investigated drag forces for spherical and non-spherical particles
works about the nusselt number relations for non-spherical particles are rare. The angle of
attack in semi-empirical models, published correlations for drag coefficient and nusselt
number are improved and the accuracy of closures developed for drag coefficient and nusselt
number is discussed in a comparison with published models.
2.4.1 Cylindrical Bodies
Mittal and Balachander (1995) described the effect of three dimensionality on the lift
and drag of nominally two-dimensional cylinders which is useful to describe the
variation of numerical results between two dimensional and three dimensional analysis.
Michel Bergmann and Laurent Cordier (2007) investigated the optimal control approach for
the active control of the cylinder wake flow considered in the laminar (Re =100). The main
objectives is the minimization of the mean total drag where the control function is the time
harmonic angular velocity of the rotating cylinder.
Z.C. Zheng and N. Zhang (2008) studied frequency ranges to be considered are both near
and away from the natural frequency of wake vortex shedding. Consequently, the effects of
frequency lock-in, superposition and de multiplication on lift and drag are conversed based
on the spectral analysis of time pasts of lift and drag. A transversely oscillating cylinder in a
uniform flow is modeled to investigate frequency effects of flow-induced wake on lift and
drag of the cylinder. Definitely, shown unsteady fluid dynamic simulations using an
immersed-boundary method in a fixed Cartesian grid predict the flow structure around the

LITERATURE REVIEW
P a g e | 21
cylinder and reveal how the integration of surface pressure and shear distributions provides
lift and drag on the oscillating cylinder.
2.4.2 Rough Cylindrical Bodies
N. Lyotard and Nicolas (2007) using a continuous ultrasound technique, determined velocity
measurements of steel spheres in free fall through liquid. Alternatively, random surface
roughness and/or high concentration polymer solutions reduce drag gradually and suppress
the drag crisis. We also present a qualitative argument which ties the drag reduction observed
in low concentration polymer solutions to the Weissenberg number and normal stress
difference.
2.5 SURFACE ROUGHNESS OF CYLINDRICAL BODIES
The concept of controlling the flow over circular cylinders is not innovative, as many
researchers have studied the effect of surface roughness on cylinders in the past.
Roshko (1961) cleared the range of critical Re which poses the fundamental problem for the
scale model testing of curved structure in low speed wind tunnels. Various experiments
conducted to investigate the flow around circular cylinders. It obtained by model testing a
curved structure at sub-critical Re. In contrast, wind loads can be underestimated if a building
is model tested at critical Re.
Merrick and Girma (1982) some difficulties are encountered when simulating super-critical
Reynolds number flow over curved surfaces of a building in a low speed boundary layer wind
tunnel due to the sensitivity of the flow to Re. Surface roughness on the façade of the cylinder
can affect the location of the separation point and the extent of the wake on the leeward face,
upon which the wind-induced responses are dependent. This study attempts to control the

LITERATURE REVIEW
P a g e | 22
flow around a circular cylinder through the application of artificial surface roughness across
the exterior of the cylinder. Later, the size of the artificial roughness will be correlated with
Re deviations through a computational fluid dynamics wind flow simulations. These
correlations will support in selecting the suitable artificial roughness that will cause boundary
layer transition at points similar to super-critical Re simulations. Some roughness patterns
were tested on the circular cylinders, which were subjected to wind flows with varying
turbulence intensity. Measurements of the pressure distribution across the façade have been
obtained over the Re range of 1x10⁴ to 2x10⁵ in a BLWT. The results have direct application
in the testing of scale models in low speed BLWTs where super-critical flow characteristics
are anticipated. They described effect of surface roughness for flow over a body at high
Reynolds number using wind tunnel.
Bearman and Harvey (1993) observed dimpled surfaces of cylinder, while roughness on a
cylinder was studied Szechenyi (1975). Both of these studies presented that the pressure
distribution around the cylinder was altered through the addition of a roughness pattern.
2.6 PRESSURE DISTRIBUTION
Libii and Josue (2010) Hands-on exercises were designed and tested in a subsonic wind
tunnel to study pressure distributions around a circular cylinder in cross flow. They allowed
students to collect their own data and use them to examine how the pressure on the surface of
the cylinder changes with two different variables: the location of a given point along the
circumference of the middle cross section of the cylinder and the magnitude of the Reynolds
number of the flow. Plotted data produced curves very similar to those in the research
literature. Detailed examination of results demonstrated how viscous flow behaviour in the
upstream half of the cylinder differed from that on its downstream half. The influence of the

LITERATURE REVIEW
P a g e | 23
magnitude of the Reynolds number on the ability of the viscous flow to recover pressure on
the downstream side of the cylinder was demonstrated.
Hodzic and Rasim (2011) Aerodynamics, as branch of fluid mechanics studies relative
motion of air around the body from theoretical and experimental aspect. Those two
approaches will not give same results if using theoretical laws based on ideal process,
because experimental investigation is presentation of real Process. Wind tunnel is an
instrument that can be used for experimental investigation. Results of cylinder surface
pressure distribution, gained by experimental investigation in wind tunnel are presented in
this paper. Obtained experimental results are compared with theoretical results, and on the
basis of that data certain conclusions are brought.
Islam and Rakibul (2013) Flow past a stationary circular cylinder at Re=105 is studied
numerically using Favre-averaged Navier-Stokes equation and solved via finite volume
method. Numerical observations are compared with experimental results and with research
works of other researchers. Different flow phenomena such as flow separation, pressure
distribution over the surface, drag etc. are also studied at different boundary conditions. In
case of smooth cylinder, the separation angles for experimentation calculation are found to be
around 80~90° in either side of the cylinder from the upstream stagnation point. The drag
coefficients for smooth surface are 0.771 and 0.533 for experimental calculation respectively
and subsequent changes in drag due to introducing surface roughness are demonstrated. The
critical surface roughness is found to be around 0.004 with coefficient of drag 0.43.
They described separation angle for flow over the cylinder at low Reynolds number. They
studied the effects of surface roughness on pressures and dynamic forces on a circular
cylinder for the Reynolds number range of 6x10⁴ to 1x10⁴ in grid generated turbulent flows.
He obtained rough cylinders by wrapping the cylinders with commercial sandpapers to

LITERATURE REVIEW
P a g e | 24
develop separated regions and pressure distributions corresponding to a higher
equivalent Reynolds number on a smooth cylinder. The Reynolds number in the flow is
increased by increase of wind tunnel blockage or turbulent intensity level. The mean and
fluctuating pressure distributions on cylinders of different surface roughness in smooth
and turbulent flow were plotted. He showed that the fluctuating pressures for the rough
cylinders at different Reynolds numbers are very close to that smooth cylinder at supercritical
Reynolds number. Thus he provided the database for further research on rough cylinders for
Reynolds number beyond 1x10⁶.
Kumar and Pilla (2012) the fluid dynamics research and its results show the prediction of
drag coefficient for lesser Reynolds number only. When Reynolds number increase may lead
to change in drag with respect to subcritical, critical, and super critical. This research
concentrates on the flow over the circular cylinder for high Reynolds number to the order of
108. The analysis has been done to predict drag and the variation of traditional CD Vs
Reynolds number curve plotted. Pressure distribution over the cylinder with respect to the
angle shows the physical importance of drag value. Roughness with two cases is measured in
this research wherever one is internal the circular cylinder and the next is internal roughness.

EXPERIMENTAL SETUPAND PROCEDURE
P a g e | 25
CHAPTER III
EXPERIMENTATION AND PROCEDURE
3.1. GENERAL
In our day-to-day life generally we use many things i.e. Automobiles as like motorcycles,
cars, aeroplanes, ships etc. We use different shapes, different size of buildings, towers,
chimneys, temples etc. Basically these are depends upon drag force. For example a vehicle is
different shape, size, and design. So that it depends on drag force. Generally, experimental
work based on automobiles is slightly difficult to present in a laboratory in practical point of
view. For this cause a designed model of a drag force in a laboratory is required. In these
experiments, we easily know that which method of experiment is more accurate to another.
Many investigators have developed a number of models which partially satisfied the
condition of rough cylindrical bodies. Our present study is related to development of a
model which predicts a suitable model which gives more accurate drag force
prediction for rough cylinders than previous. According to the requirement of the
project the attachment of the airflow bench is maintained as follows.
Hydraulic mechanics Lab facilities of National Institute of Technology (NIT) was used to
study the flow over the cylinder experimentally. The present research work utilises the setup
of airflow bench fig.3.1 competence available in the Hydraulic Machine Laboratory of the
Civil Engineering Department, at the National Institute of Technology, Rourkela, India. The
basic objective behind these experiments is to imagine better understanding on the variation
of drag coefficient and pressure distribution due to variation surface roughness, drag force
and drag coefficient also.

EXPERIMENTAL SETUPAND PROCEDURE
P a g e | 26
Fig. 3.1 Airflow Bench
3.2 APPARATUS & EQUIPMENTS USED
In this present study we use different diameters of cylinders like smooth surface and rough
surface cylinders, weight box, one Pitot tube, and a multitube manometers were used in the
experiments. These are used to measure velocity and its direction of flow in the setup. In the
experiments setup like measurements of drag force and pressure distribution attachments are
used. The measuring equipment and the devices were arranged properly to carry out
experiments in the attachments. The apparatus used in the experimentation in both
attachments, measurements of direct weighing and pressure distribution is given in the Figure
3.2 (i to iv) below.

EXPERIMENTAL SETUPAND PROCEDURE
P a g e | 27
Fig 3.2 (i to iv) Apparatus used in experimentation in both attachments
(i) Air Temperture Meter (ii) Multitube Manometer
(iii) Weight Boxes (iv)Velocity Controller

EXPERIMENTAL SETUPAND PROCEDURE
P a g e | 28
3.3EXPERIMENTAL PROCEDURE
In Figure 3.1, the set-up airflow bench consists of two types of attachments: (i) for drag force
by direct weighing method in Figure 3.4 and (ii) drag co-efficient by pressure distribution
method Figure 3.5. The setup consists of an adjusting lever to control flow, a multitube
manometer for pressure measurement. This setup allowed to study of the drag of various
bodies, the pressure distribution around a cylinder. Balance arm attached to the side of the
main unit and holds the models in place inside the main unit. In Figure 3.3, this drag force
experiments, it is used with adjustable weights and for the pressure distribution experiment, a
protractor and cylinder model is fitted in the main body. The circular cylinder is connected to
the separate manometer to display the pressure distribution as the cylinder is rotated.
Fig.3.3 Schematic Diagram of Experimental Setup of Airflow Bench

EXPERIMENTAL SETUPAND PROCEDURE
P a g e | 29
3.4 EXEPERIMENTAL SETUP
For a particular run, the value of drag force and hence the co-efficient of drag was obtained
by (i) direct application of weights to counter balance the drag force. The same procedure is
repeated by varying diameter of the cylinder, free stream velocity and varying roughness of
the surface of the cylinder. In Direct weighing method, we used total pressure (P0), static
pressure (p0) at the inlet, pressures and the value of the weights. In this experiment, we used
four different diameters and also four different size of surface roughness. i.e. 0.0125m,
0.015m, 0.020m and 0.025m diameters. 325 micron, 260 micron, 200 micron, & 160 micron
surface roughness.
3.4.1 Setup for Drag Force Measurement
Fit the circular cylinder model in position and adjust the weights to achieve
equilibrium. Record the value of the weights.
Switch on the fan and adjust the wind speed to a low level and readjust the weights to
achieve equilibrium.
Record the value of the weights and total pressure and static pressure at the inlet.
Increases the wind speed in increments up to its maximum level, each time readjust
the weights to achieve equilibrium and record the pressures and value of the weight.
Fig.3.4 Setup for Drag Force Measurement

EXPERIMENTAL SETUPAND PROCEDURE
P a g e | 30
For a particular run, the value of drag force and hence the drag co-efficient was obtained by
(ii) Measuring pressure at different angles around the periphery of the cylinder. The same
procedure is repeated by varying diameter of the cylinder, free stream velocity and the
roughness of the surface of the cylinder. In pressure distribution method, we used pressure
coefficient, total pressure, static pressure, free stream velocity and angle of incidence.
3.4.2 Setup for the Pressure Distribution Experiments
Fit the circular cylinder and protractor model into the first setup. Connect the model
to the manometer .set the wind speed to maximum and the protractor to zero angle
Record the surface pressure and static pressure. Rotate the protractor in 50 intervals
for readings over the front half (0-900) then 100 intervals for readings over the rear
half 900-1800
Monitor the total pressure and static pressure at the inlet to ensure that the wind speed
is kept constant throughout the experiments.
Fig.3.5 Setup for Pressure Distribution method

EXPERIMENTAL SETUPAND PROCEDURE
P a g e | 31
3.5 EXPERIMENTAL CYLINDERS
The circular cylinder is built of 0.0480 m length, four different sizes of diameters i.e. 12.5
mm, 15mm, 20mm, and 25mm. For better information the details of geometrical
parameters for both the experimental attachments are tabulated below and also Figure 3.6
(a, b) and Figure 3.7(a, b) shows details overview of smooth and rough surface cylinders.
Fig.3.6 (b) Used For Rough Surface
Cylinders with Different Roughness
Fig.3.7 (a) Used For Smooth Surface
Cylinders with Varying Diameter
Fig.3.7 (b) Used For Rough Surface
Cylinders with Different Roughness
Fig.3.6 (a) Used For Smooth Surface
Cylinders with Varying Diameter

EXPERIMENTAL SETUPAND PROCEDURE
P a g e | 32
Table 3.1: Details of Geometrical parameters of the experimental runs
Sl
No
Item description Present Experimental
1 Cylinder Type Smooth and rough circular cylinder.
2 Cylinder size 12.5mm, 15mm, 20mm, 25mm diameter.
3 Cylinder length 0.048 m.
4 Air density 1.164 kg/m3
5 Barometric pressure 1.04 × 10⁵ n/m2
6 Gas constant 287.2
7 Kinematic viscosity 1.6036 × 10⁻⁵ m2/s
8 Roughness size 325micron,260micron,200micron,160micron

EXPERIMENTAL SETUPAND PROCEDURE
P a g e | 33
The detailed information on parameters of cylinder is provided in the table below.
Table 3.2 Scope of the experiment
DIRECT WEIGHING METHOD
PRESSURE DISTRIBUTION METHOD
Diameter
(mm)
Roughness
(micron)
Velocity
(m/s)
Diameter
(mm)
Roughness
(micron)
Velocity
(m/s)
0.0125 325 8.26-26.14 0.015 325 26.50-23.41
260 8.26-26.14 260 26.50-23.41
200 8.26-26.14 200 26.50-23.41
160 8.26-26.14 160 26.50-23.41
0.015 325 8.26-26.14 0.020 325 26.50-23.41
260 8.26-26.14 260 26.50-23.41
200 8.26-26.14 200 26.50-23.41
160 8.26-26.14 160 26.50-23.41
0.020 325 8.26-26.14 0.025 325 26.50-23.41
260 8.26-26.14 260 26.50-23.41
200 8.26-26.14 200 26.50-23.41
160 8.26-26.14 160 26.50-23.41
0.025 325 8.26-26.14 0.0125 smooth
surface 26.50-23.41
260 8.26-26.14 26.50-23.41
200 8.26-26.14 26.50-23.41
160 8.26-26.14 26.50-23.41

EXPERIMENTAL SETUPAND PROCEDURE
P a g e | 34
3.6 METHODOLOGY
The resistance of a body as it moves through a fluid is of great technical importance in
hydrodynamics and aerodynamics. In this experiment we place a circular cylinder in an
airstream and measure its resistance, or drag by two methods.
Drag force by direct weighing method.
Drag coefficient by pressure distribution method.
3.6.1 Drag Force by Direct Weighing Method
In the present context the word cylinder is used to describe a body which is generated by a
straight line moving round a plane closed curve, its direction being always normal to the
plane of a curve.
Fig.3.8 Cross section of a cylindrical body
An essential property of a cylinder is that its geometry is two-dimensional; each cross-section
is exactly the same as every other cross-section, so that its shape may be described without
reference to the dimension along the cylinder axis. Motion of the cylinder through stationary
fluid produces actions on its surface which gives rise to a resultant force. From the point of
view of an observer is moving with the cylinder, to which the fluid appears to be approaching

EXPERIMENTAL SETUPAND PROCEDURE
P a g e | 35
as a uniform stream. At any chosen point A of the surface of the cylinder, the effect of the
fluid may conveniently be resolved into two components, pressure p normal to the surface
and shear stress along the surface. It is convenient to refer absolute pressure pa to the datum
of static pressure p0 in the oncoming stream; p is then a gauge pressure,
i.e.
𝑃 = 𝑝𝑎 − 𝑃0 (3.1)
Let U denote the uniform speed of the motion and the density of the fluid, then the
dynamic pressure in the undistributed stream,1
2𝜌𝑈2 is
1
2𝜌𝑈2 = 𝑃0 − 𝑝0 (3.2)
Where 𝑃0 is total pressure
In this method we calculate the drag coefficient. We record the value of the drag force, total
pressure, static pressure, dynamic pressure.
𝐶𝐷 =𝐷
1
2𝜌𝑈2
(3.3)
Where 𝐶𝑑= Drag coefficient
D= Drag Force
= Air Density
U=Speed

EXPERIMENTAL SETUPAND PROCEDURE
P a g e | 36
Fig.3.9 Apparatus diagram for Direct Weighing Method
3.6.2 Drag coefficient by pressure distribution Method
We know those pressure and skin friction coefficients are related to lift and drag. Consider an
element of length s of the surface, at a point where the normal is inclined at angle to the
direction of U, as in Figure. (3.7)
The drag of a cylinder found by measuring p and over the surface and calculating the drag
coefficient by equation (3.2)
𝐶𝐷 = 1
𝑑 ∮(𝑐𝑝 cos 𝜃 + 𝑐𝑓 sin 𝜃) 𝑑𝑠 (3.4)
Now it is easy to measure the distribution of pressure over a cylinder but measurement of is
a much more difficult task. The case of the circular cylinder, the contribution to drag from
shear stress is found to be very much smaller than from pressure and may be neglected.
𝛿𝑠 = 𝑅𝛿𝜃 =𝑑
2 𝛿𝜃 (3.5)
For the circular cylinder

EXPERIMENTAL SETUPAND PROCEDURE
P a g e | 37
𝐶𝐷 =1
𝑑 ∮ 𝑐𝑝 cos 𝜃 (
𝑑
2) 𝑑𝜃 (3.6)
𝐶𝐷 =1
𝑑 ∮ 𝑐𝑝
2𝜋
0cos 𝜃𝑑𝜃 (3.7)
For consideration of symmetry, we have
𝐶𝐷 = ∮ 𝑐𝑝 cos 𝜃𝑑𝜃2𝜋
0 (3.8)
In this method we calculate drag coefficient. We record the value of the surface pressure,
static pressure, total pressure& Pressure coefficient also.
𝐶𝑃 =𝑃−𝑝01
2𝜌𝑈2
(3.9)
Where 𝐶𝑃 = pressure coefficient
P = surface pressure
P0 = static pressure
𝜌 = air density
U= speed
Then
𝐶𝑑 = ∫ 𝐶𝑝2𝜋
0cos 𝜃 (3.10)

EXPERIMENTAL SETUPAND PROCEDURE
P a g e | 38
Fig.3.10 Apparatus diagram for Pressure Distribution Method
3.7 MEASUREMENT OF PRESSURE COEFFICIENT
The pressure coefficient is used in aerodynamics and hydrodynamics. The pressure
coefficient is a dimensionless number which defines the relative pressures during a flow field
in fluid dynamics. It is defined as the ratio of gauge pressure and dynamic pressure. Gauge
pressure means total pressure minus static pressure.
3.8 MEASUREMENT OF DRAG COEFFICIENT
Drag coefficient is a dimensionless number that depends on the shape of the body and its
orientation relative to the fluid stream. In this method, we calculate drag coefficient by this
formula,
𝐶𝐷 =𝐹𝐷
1
2𝜌𝐴𝑉2
(3.11)
In another method, we calculate drag coefficient by area under the curve, which is cpcos vs.
angle of incidence.

EXPERIMENTAL RESULTS
P a g e | 39
CHAPTER IV
EXPERIMENTAL RESULTS
4.1 OVERVIEW
The results of experiments about the drag force, drag coefficient and pressure distribution in
the Cylinders are presented in this chapter. Analysis is also done for drag coefficient of
cylindrical bodies. The overall summary of experimental runs for the drag coefficient and
pressure distribution.
This chapter will now present the results of these tests in terms of the drag force, drag
coefficient and pressure distribution of the cylindrical bodies.
4.2 DRAG FORCE RESULTS
In direct weighing measurement method, variation of drag force in different parameters, such
as velocity, diameter and roughness. Drag coefficient is inversely proportional to drag force.
Variations of drag force with free stream velocity for the cylinders of varying roughness.
Similarly the variation of drag force with velocity for the same roughness of cylinders of
different diameters. The experimental data of drag force obtained under varying conditions of
flow velocity and constant diameter of the cylinder. In this case diameter is constant, velocity
increase and drag force increase. In smooth surface drag force is less when roughness
increases drag forces will increases.

EXPERIMENTAL RESULTS
P a g e | 40
Fig.4.1 (i) Fig.4.1 (ii)
Fig.4.1 (iii) Fig.4.1 (iv)
Fig.4.1 (i)-Fig.4.1 (iv) Comparison between smooth and rough surface for 12.5mm, 15mm,
20mm and 25mm diameter
In Figure 4.1(I, ii, iii, iv) drag force vs velocity graphs are plotted for
12.5mm, 15mm, 20mm, 25mm diameter of cylinder by varying the roughness of the cylinder.
From it is observed that with increase in roughness of the cylinder, the drag force is
increasing with respect to the velocity.
05
10152025303540
0 20 40
Dra
g F
orc
e (N
m)
Velocity (m/s)
Drag Force vs Velocity
0
5
10
15
20
25
30
35
40
45
50
0 10 20 30
Dra
g F
orc
e(N
m)
Velocity (m/s)
Drag Force vs Velocity
0
10
20
30
40
50
60
70
0 10 20 30
Dra
g F
orc
e (N
m)
Velocity (m/s)
Drag Force vs Velocity
0
20
40
60
80
100
120
0 10 20 30
Dra
g F
orc
e (g
m)
Velocity (m/s)
Drag Force vs Velocity
260micron
325 micron
160 micron
200 micron
smooth
surface

EXPERIMENTAL RESULTS
P a g e | 41
Fig.4.2 (i) Fig.4.2 (ii)
Fig.4.2 (iii) Fig.4.2 (iv)
Fig.4.2 (i)-Fig.4.2(iv) comparison between smooth and rough surface at constant velocity
26.14 m/s, 25.48m/s, 24.45m/s & 24.10m/s.
The four different graphs are plotted between the drag force and diameter of the
cylinder for velocity of 26.14, 25.48, 24.45, 24.10 by varying roughness and smooth surface.
From the graphs, it is found that the drag force is increasing with increase in roughness of the
cylinder with respect to the diameter of the cylinder.

EXPERIMENTAL RESULTS
P a g e | 42
Fig.4.3 (i) Drag force vs. Diameter, comparison between in different velocity at constant
roughness 326 micron
Fig.4.3 (ii) Drag force vs. Diameter, comparison between in different velocity at constant
roughness 260 micron
0
0.2
0.4
0.6
0.8
1
1.2
0 0.01 0.02 0.03
Dra
g Fo
rce
(N
m)
Diameter (m)
0
0.2
0.4
0.6
0.8
1
1.2
0 0.01 0.02 0.03
Dra
g F
orc
e (N
m)
Diameter (m)

EXPERIMENTAL RESULTS
P a g e | 43
Fig.4.3 (iii) Drag force vs. Diameter, comparison between in different velocity at constant
roughness 200 micron
Fig.4.3 (iv) Drag force vs. Diameter, comparison between in different velocity at constant
roughness 160 micron
0
0.2
0.4
0.6
0.8
1
1.2
0 0.01 0.02 0.03
Dra
g Fo
rce(
Nm
)
Diameter (m)
0
0.2
0.4
0.6
0.8
1
1.2
0 0.01 0.02 0.03
Dra
g F
orc
e (N
m)
Diameter (m)

EXPERIMENTAL RESULTS
P a g e | 44
From roughness 326, 260, 200 and 160 micron the above graph Fig.4.3 (I, ii, iii & iv)
is plotted between the drag force and diameters of the cylinders by varying the velocity of
airflow. From the graph it is found that the drag force is increasing with increase in velocity
of the flow with respect to diameter of the cylinder.
Fig.4.4 Comparison between Drag forces vs. Roughness, in different velocity at constant
diameter
A graph is plotted between drag force vs roughness at a constant diameter of 12.5mm
of the cylinder by varying the velocity of the flow. From the graph it is observed that with
increase in velocity, the drag force is also increasing with respect to roughness.
0
0.05
0.1
0.15
0.2
0.25
0.3
0.35
0.4
0 0.0001 0.0002 0.0003 0.0004
Dra
g F
orc
e(N
m)
Rough surface (m)

EXPERIMENTAL RESULTS
P a g e | 45
Fig.4.5 (i) Fig.4.5 (ii)
.
Fig.4.5 (iii) Fig.4.5 (iv).
Fig.4.5(i)-Fig.4.5(iv) Drag force vs.velocity, in different diameter at constant roughness 325
micron, 260micron, 200micron and 160micron
The graph is plotted between drag force vs velocity at a roughness of 325,260,200 &
160 micron by varying the diameter of the cylinder. From the graph it is found that with
increase in the value of the roughness, the drag force is also increasing with respect to
velocity.
0
20
40
60
80
100
120
0 20 40
Dra
g F
orc
e
Velocity (m/s)
Drag Force vs Velocity
0
20
40
60
80
100
120
0 20 40
Dra
g F
orc
e
Velocity (m/s)
Drag Force vs Velocity
0
20
40
60
80
100
120
0 20 40
Dra
g f
orc
e
Velocity (m/s)
Drag force vs Velocity
0.0125m
diameter
0.015m
diameter
0.020m
diameter
0.025m
diameter
0
1020
304050
6070
8090
100
0 10 20 30
Dra
g f
orc
e
Velocity (m/s)
Drag force vs Velocity
0.0125m
diameter
0.015m
diameter
0.020m
diameter
0.025m
diameter

EXPERIMENTAL RESULTS
P a g e | 46
Fig.4.6 Drag force vs. velocity, in different diameter at smooth surface
The graph is plotted between drag force vs.velocity and the variation of drag force
increase when the smooth surface of different diameter of cylinder is increase. Because the
surface area is increased, so that the drag force is also increase.
4.3 PRESSURE DISTRIBUTION METHOD
In pressure distribution method, variation of pressure coefficient is
occurred through different parameters such as velocity, diameter and roughness. Variations of
pressure coefficient occur with free stream velocity for the cylinders of varying roughness.
Similarly the variations of pressure coefficient occur with velocity for the same roughness of
cylinders of different diameters. For pressure distribution at varying location for the cylinder
of same roughness and varying diameters are considered. The experimental data of drag force
obtained under varying conditions of flow velocity and constant diameter of the cylinder. In
this case diameter is constant, velocity increase and drag force increase. In smooth surface
drag force is less when roughness increases drag forces will increases.
0
20
40
60
80
100
120
0 10 20 30
Dra
g F
orc
e
Velocity (m/s)
Drag Force vs Velocity

EXPERIMENTAL RESULTS
P a g e | 47
Fig. 4.7(i) Comparison 325 micron roughness of cylinder at constant Velocity=26.50 m/s
Fig.4.7 (ii) Comparison 325 micron roughness of cylinder at constant Velocity=26.50 m/s

EXPERIMENTAL RESULTS
P a g e | 48
Fig.4.8 (i) Comparison 260 micron roughness of cylinder at constant Velocity=26.50m/s
Fig.4.8 (ii) Comparison 260 micron roughness of cylinder at constant Velocity=26.50m/s

EXPERIMENTAL RESULTS
P a g e | 49
Fig.4.9 (i) Comparison 260 micron roughness of cylinder at constant Velocity=25.18m/s
Fig.4.9 (ii) Comparison 260 micron roughness of cylinder at constant Velocity=25.18m/s

EXPERIMENTAL RESULTS
P a g e | 50
Fig.4.10 (i) Comparison 260 micron roughness of cylinder at constant Velocity=24.83m/s
Fig.4.10 (ii) Comparison 260 micron roughness of cylinder at constant Velocity=24.83m/s

EXPERIMENTAL RESULTS
P a g e | 51
Fig.4.11 (i) Comparison 260 micron roughness of cylinder at constant Velocity=23.41m/s
Fig.4.11 (ii) Comparison 260 micron roughness of cylinder at constant Velocity=23.41m/s
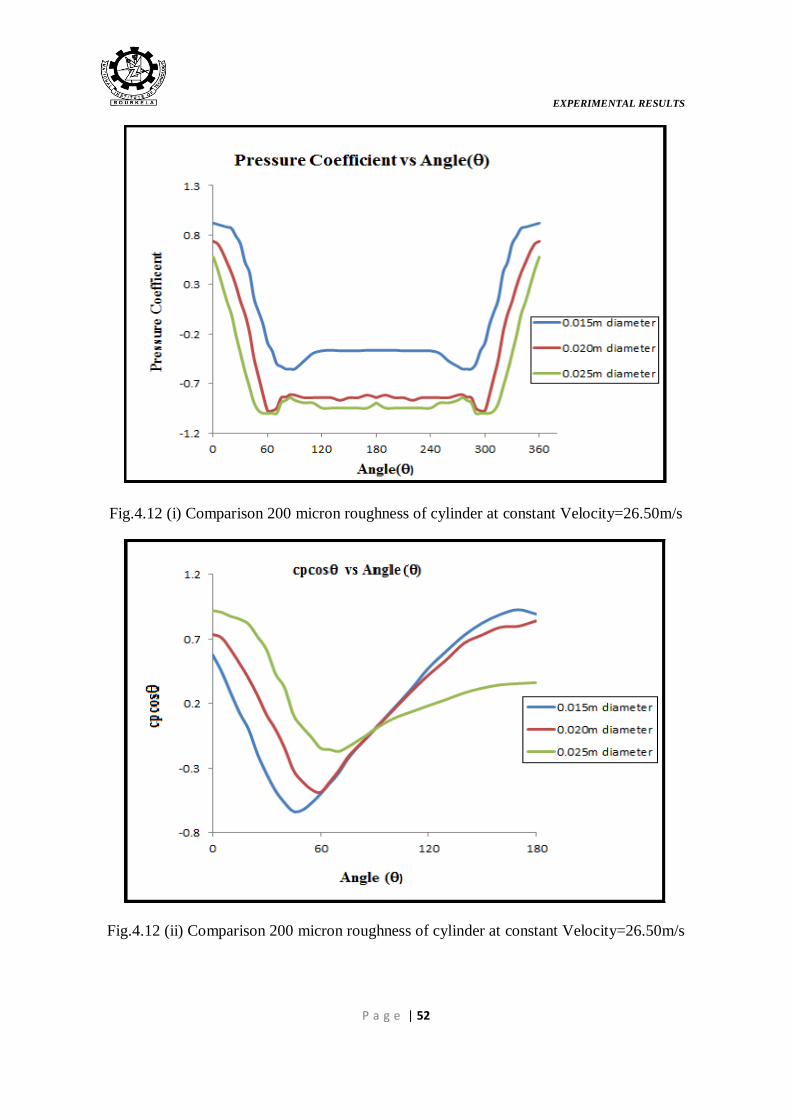
EXPERIMENTAL RESULTS
P a g e | 52
Fig.4.12 (i) Comparison 200 micron roughness of cylinder at constant Velocity=26.50m/s
Fig.4.12 (ii) Comparison 200 micron roughness of cylinder at constant Velocity=26.50m/s

EXPERIMENTAL RESULTS
P a g e | 53
Fig.4.13 (i) Comparison 200 micron roughness of cylinder at constant Velocity=25.18m/s
Fig.4.13 (ii) Comparison 200 micron roughness of cylinder at constant Velocity=25.18m/s

EXPERIMENTAL RESULTS
P a g e | 54
Fig.4.14 (i) Comparison 200 micron roughness of cylinder at constant Velocity=24.83m/s
Fig.4.14 (ii) Comparison 200 micron roughness of cylinder at constant Velocity=24.83m/s

EXPERIMENTAL RESULTS
P a g e | 55
Fig.4.15 (i) Comparison 200 micron roughness of cylinder at constant Velocity=23.41m/s
Fig.4.15 (ii) Comparison 200 micron roughness of cylinder at constant Velocity=23.41m/s

EXPERIMENTAL RESULTS
P a g e | 56
Fig.4.16 (i) Comparison 160 micron roughness of cylinder at constant Velocity=26.50m/s
Fig.4.16 (ii) Comparison 160 micron roughness of cylinder at constant Velocity=26.50m/s

DIMENSIONAL ANALYSIS AND MODELLING
P a g e | 57
CHAPTER V
DIMENSIONAL AND MODEL ANALYSIS
5.1 OVERVIEW
The Rayleigh’s method of dimensional analysis becomes more difficult if the
variables are more than the number of fundamental dimensions (M, L, and T). This difficulty
is overcome by using Buckingham’s -theorem, which states, “if there are n variables in a
physical phenomenon and if these variables contain m fundamental dimensions (M, L, T),
then the variables are arranged into m-n dimensionless terms. Each term is called -term.
Let X1, X2, X3…... Xn are the variables involved in a physical problem. Let X1 be the
dependent variable and X2, X3… Xn are the independent variables on which X1 depends.
Then X1 is a function of X2, X3,….. Xn and mathematically it is expressed as
𝑋1 = 𝑓(𝑋2, 𝑋3, … … … . . 𝑋4) (5.1)
Equation (5.1) can also written as
𝑓1(𝑋1, 𝑋2, 𝑋3, … … … 𝑋𝑛) = 0 (5.2)
Equation (5.2) is a dimensionally homogenous equation. It contains n variables. According
to Buckingham - theorem, the number of dimensionless group or -terms in which number
of -terms is equal to (n-m).
Hence
f (1, 2,…….n-m) =0 (5.3)
Each -terms is dimensionless and is independent of the system of unit. Each -term
contains m+1 variables, where m is the number of fundamental dimensions required to
describe the variables completely. From the variables listed for the phenomena, three variable

DIMENSIONAL ANALYSIS AND MODELLING
P a g e | 58
one each from linear dimension, flow properties and fluid properties are chosen as
repeating variable. If X2, X3 and X4 are selected for repeating variables, then each - term is
written as
𝜋1 = 𝑋2𝑎1. 𝑋3
𝑏1. 𝑋4𝑐1. 𝑋1
𝜋2 = 𝑋2𝑎2. 𝑋3
𝑏2. 𝑋4𝑐2. 𝑋5 (5.4)
𝜋𝑛−𝑚 = 𝑋2𝑎𝑛−𝑚 . 𝑋3
𝑏𝑛−𝑚. 𝑋4𝑐𝑛−𝑚 . 𝑋𝑛
Each equation is solved by the principle of dimensional homogeneity and values of
exponents a1, b1, c1 etc., are obtained. These values are substituted in above equation (5.4) to
get of 1, 2, n-m and subsequently put in equation (5.3).
5.2 CORRELATION OF DIMENSIONLESS FORM
The drag force FD is a function of V, D,,, k
Mathematically,
𝐹𝐷 = (𝑉, 𝐷, 𝜌, 𝜇, 𝑘, ) (5.5)
The above equation can also be written as under:
( 𝐹𝐷, 𝑉, 𝐷, 𝜌, 𝜇, 𝑘) = 0 (5.6)
Where n = No. of total variables involved in the phenomena = 6
m =3, no. of fundamental quantity required to describe all the variables
No. of 𝜋 terms = 6-3 = 3
Now, choosing V, D, as repeating variables, each -term can be expressed as under:
𝜋1 = 𝑉𝑎1𝐷𝑏1𝜌𝑐1𝜇 (5.7)

DIMENSIONAL ANALYSIS AND MODELLING
P a g e | 59
𝜋2 = 𝑉𝑎2𝐷𝑏2𝜌𝑐2𝑘 (5.8)
𝜋3 = 𝑉𝑎3𝐷𝑏3𝜌𝑐3𝐹𝐷 (5.9)
Dimensions of each variable are:
V=[𝑀0𝐿1𝑇−1], (5.10)
D=[𝑀0𝐿1𝑇0], (5.11)
=[𝑀1𝐿−3𝑇0], (5.12)
𝑘 = [𝑀0𝐿1𝑇0], (5.13)
=[𝑀1𝐿−1𝑇−1], (5.14)
𝐹𝐷 = [𝑀1𝐿1𝑇−2] (5.15)
Thus three -terms say𝜋1,𝜋2, and 𝜋3 are formed.
𝑓1(𝜋1𝜋2𝜋3) = 0 (5.16)
each -term = m+1 variables, where m is equal to 3 and also called repeating
variables. Out of six variables𝐹𝐷, 𝑉, 𝐷, 𝜌, 𝜇, 𝑎𝑛𝑑 𝑘, three variables are to be selected as
repeating variable. 𝐹𝐷is a dependent variable and should not be selected as a repeating
variable. Out of the five remaining variables. One variable should have flow property; the
second variable should have geometric property and third one fluid property. These
requirements are fulfilled by selecting V, D and as repeating variables. The repeating
variables themselves should not form a dimensionless term and should have themselves
fundamental dimensions equal to m, i.e. 3 here. Dimension of V, D and are V=[𝑀0𝐿1𝑇−1],
D=[𝑀0𝐿1𝑇0], and =[𝑀1𝐿−3𝑇0] and hence the three fundamental dimensions exist in V, D
and and they themselves do not form dimensionless group.

DIMENSIONAL ANALYSIS AND MODELLING
P a g e | 60
Each -term is written as according to equation (5.5)
Each -term is solved by the principle of dimensional homogeneity. For the first -term, we
have
𝜋1 = 𝑉𝑎1𝐷𝑏1𝜌𝑐1𝜇
[𝑀0𝐿0𝑇0] = [𝑀0𝐿1𝑇−1]𝑎1. [𝑀0𝐿1𝑇0]𝑏1[𝑀1𝐿−3𝑇0]𝑐1[𝑀1𝐿−1𝑇−1]
Equating the powers of M, L, and T on both sides, we get
Power of M, c1= (-1)
Power of L, a1 = (-1)
Power of T, b1 = (-1)
Substituting the values of a1, b1 and c1 in equation (5.5)
𝜋1= (V)-1(D)-1()-1
𝜋1= 𝜇
𝜌𝑉𝐷 = Re
Similarly for the second -term, we get
𝜋2 = 𝑉𝑎2𝐷𝑏2𝜌𝑐2𝑘
[𝑀0𝐿0𝑇0] = [𝑀0𝐿1𝑇−1]𝑎2. [𝑀0𝐿1𝑇0]𝑏2[𝑀1𝐿−3𝑇0]𝑐2[𝑀0𝐿1𝑇0]
Equating the powers of M, L, and T on both sides, we get
Power of M, c2= (0)
Power of L, a2 = (0)
Power of T, b2 = (-1)

DIMENSIONAL ANALYSIS AND MODELLING
P a g e | 61
Substituting the values of a1, b1 and c1 in equation (5.6)
𝜋2= (V)0 (D)-1()0 k
π2= k
D
Similarly for the third -term, we get
𝜋3 = 𝑉𝑎3𝐷𝑏3𝜌𝑐3𝐹𝐷
[𝑀0𝐿0𝑇0] = [𝑀0𝐿1𝑇−1]𝑎3. [𝑀0𝐿1𝑇0]𝑏3[𝑀1𝐿−3𝑇0]𝑐3[𝑀1𝐿1𝑇−2]
Equating the powers of M, L, and T on both sides, we get
Power of M, c3= (-1)
Power of L, a3 = (-2)
Power of T, b3 = (-2)
Substituting the values of a1, b1 and c1 in equation (5.7)
𝜋3= (V)-2(D)-2()-1 𝐹𝐷
π3= 𝐹𝐷
𝜌𝑉2𝐷2
π3= 𝐹𝐷
1
2𝜌𝐴𝑉2
The dimension form
𝜋1= 𝜇
𝜌𝑉𝐷 = Re
π2= k
D

DIMENSIONAL ANALYSIS AND MODELLING
P a g e | 62
π3= 𝐹𝐷
1
2𝜌𝐴𝑉2
FD
1
2ρAV2
= C(Re)n1 (k
D)
n2
The values of constant C as exponents 𝑛1 𝑎𝑛𝑑 𝑛2 are obtained for the Figure (1), (2) and final
correlation graph (4) is given below.
5.3 DIMENSIONLESS FORM
(i) Dimensionless terms: 𝐹𝐷
1
2𝜌𝐴𝑉2
= 𝐶(𝑅𝑒)𝑛1 (𝑘
𝐷)𝑛2
Fig.5.1 The relationship between drag coefficient and Reynolds number.
y = 3E+06x-1.388
R² = 0.9971
0
2
4
6
8
10
12
14
0 10000 20000 30000 40000
Reynolds Number (Re)
Drag coefficient vs Reynolds number

DIMENSIONAL ANALYSIS AND MODELLING
P a g e | 63
Fig.5.2 Relationship between drag coefficient and Roughness
From the graphical plot in Figure 5.1(i) and Figure 5.2(ii) we get the value of 𝑛1= (-1.388)
and 𝑛2= 0.4031. Then found out the value of 𝑥 = (𝑅𝑒)𝑛1 (𝑘
𝐷)
𝑛2
and plot the graph between
drag force (i.e. effect of Reynolds number and effect of roughness) and x. in Figure 5.3.
Fig.5.3: The relationship between drag coefficient and effect Reynolds number & effect of
roughness.
y = 10.673x0.4031
R² = 0.9631
0
0.5
1
1.5
2
2.5
0 0.01 0.02
Roughness (k/D)
Drag coefficient vs Roughness(k/D)
y = 2E+07x0.9998
R² = 0.9971
0
2
4
6
8
10
12
14
0 0.0000002 0.0000004 0.0000006 0.0000008
Dra
g Fo
rce(
Nm
)
X

DIMENSIONAL ANALYSIS AND MODELLING
P a g e | 64
Table.5.1 Details of correlation constant parameters. Roughness(k) Diameter(D) k/D
0.000325 0.025 0.0130
0.000260 0.025 0.0104
0.000200 0.025 0.0080
0.000160 0.025 0.0064
0.000325 0.02 0.0162
0.000260 0.02 0.0130 1st constant
0.000200 0.02 0.0100 2nd constant
0.000160 0.02 0.0080 3rd constant
0.000325 0.015 0.0216
0.000260 0.015 0.0173
0.000200 0.015 0.0133
0.000160 0.015 0.0106
0.000325 0.0125 0.0260
0.000260 0.0125 0.0208
0.000200 0.0125 0.0160
0.000160 0.0125 0.0128

DIMENSIONAL ANALYSIS AND MODELLING
P a g e | 65
Table.5.2 Details of dimensionless parameters of the experimental
runs (Roughness=0.000260m)
Velocity(V) Diameter(D) Reynolds number Drag Force(FD) Drag coefficient (CD)
25.81 0.02 32190.07234 0.608012 1.633587
25.48 0.02 31778.49838 0.588399 1.622105
25.14 0.02 31354.45248 0.583496 1.652391
24.8 0.02 30930.40659 0.580554 1.689448
22.64 0.02 28236.46795 0.539366 1.883373
20.46 0.02 25517.58543 0.500139 2.138382
17.54 0.02 21875.7795 0.446203 2.595845
13.07 0.02 16300.82315 0.372653 3.904441
9.5 0.02 11848.34123 0.299103 5.931699
5.84 0.02 7283.611873 0.252031 13.22616
Table.5.3 Details of dimensionless parameters of constant velocity =20.46m/s &
diameter =0.02m
Roughness(k) k/d Reynolds number Drag Force (FD) Drag Coefficient (CD)
0.000325 0.01625 25517.58543 0.243205 1.039841
0.00026 0.013 25517.58543 0.225553 0.964369
0.0002 0.01 25517.58543 0.20594 0.88051
0.00016 0.008 25517.58543 0.196133 0.838581

DIMENSIONAL ANALYSIS AND MODELLING
P a g e | 66
Fig.5.4 the relationship between drag coefficient and effect Reynolds numbers, effect of
roughness and other explicit data
Fig.5.5 Final correlation plot between the drag parameter with system parameter
y = 5E+06x0.9192
R² = 0.9842
0
2
4
6
8
10
12
14
0 0.0000002 0.0000004 0.0000006 0.0000008 0.000001
Dra
g C
oef
fici
ent
Effect of Reynolds number
Effect of roughness
Other exptl. Pts.
x

DIMENSIONAL ANALYSIS AND MODELLING
P a g e | 67
it is clearly seen that from the graph, it is plotted between the predicted Drag coefficient
verses correlation data for rough cylindrical bodies. In this case, it is found that in Figure 5.3
both drag coefficient vs. effect of reynolds number and effect of roughness agrees perfectly
and also gives a satisfactory result along appropriately with determination or Regression
coefficient is R2=0.99. Similarly, the comparison occurs in between the drag coefficient vs.
effect of reynolds number, effect of roughness and other explicit data has been shown in
Figure 5.4 for experimental data and R2=0.98. Respectively the Regression coefficient R2
for all these data sets are found to be 0.99 and 0.98 and these all are gives a satisfactory
results. Therefore from the above Figure it is clearly shown that the present model
gives a better drag coefficient result. In the dimensionless correlation graph mean % error
is 4.067.

ESTABLISHMENT OF CO-RELATION
P a g e | 68
CHAPTER VI
ESTABLISHMENT OF CORRELATION
6.1 CORRELATION DEVELOPMENT
The Drag coefficient is defined as by a relationship between the drag force FD and the1
2𝜌𝐴𝑉2.
Drag coefficient depends on the drag force, free stream velocity and projected area. For this
experiment data sets are collected by experimentation. So in the present work for regression
analysis, dimensional analysis is used. In this dimensional analysis the variables are used two
types, i.e. dependent and independent variables. All the variables are analyzed through the
experiments with keeping different diameter, velocity and roughness. Then a model is
required for rough cylindrical bodies which should consider the variable geometric such as
diameter, velocity and roughness parameters.
6.1.1 Data processing
The experimental data for drag force with varying diameter, roughness size and free stream
velocity have been collected. From the literature study, it is seen that the drag coefficient of a
rough cylindrical bodies varies surface area, velocity and roughness. They are found to be
function of geometric parameters, flow parameters and surface parameters. All are
dimensionalised. These data have been processed to predict the output viz. drag force by the
following methods: (i) Dimensional analysis.
6.2 DIMENSIONAL ANALYSIS
The following system variables which are likely to impact the output of the system viz.
diameter, roughness and velocity have been considered in the development of the
correlations:
Dimensional terms: 𝐹𝐷 = 𝐶(𝑉𝑛1)(𝐷𝑛2)(𝑘𝑛3)
Drag force (𝐹𝐷)
Velocity (V)
Diameter (D)

ESTABLISHMENT OF CO-RELATION
P a g e | 69
Roughness (k)
The Geometric parameter is Diameter and Flow parameter is Reynolds no. It is in the following
form 𝐹𝐷= f (V, D, k)
The variation of drag force has been found out for four cylinders of different diameters and
roughness. The variations of drag force in terms of drag force are plotted for different
roughness in Figure (6.1). It is seen that, when roughness is increased as drag force increases
because drag force is less in smooth and very in rough surface. In Figure (6.2) the variation of
drag force are plotted for different velocity. When velocity increases, drag force will increase.
In Figure (6.3) the variation of drag force are plotted for different diameter. It seen that the
drag force is increases with increases in diameter, because the surface area is increases.
Fig.6.1 The relationship between drag force and roughness
y = 0.3668x0.0928
R² = 0.996
0.585
0.59
0.595
0.6
0.605
0.61
0.615
0.62
0.625
0.63
0 100 200 300 400
Drag F
orc
e (
nm
)
Roughness (micron)
Drag Force vs Roughness

ESTABLISHMENT OF CO-RELATION
P a g e | 70
Fig. 6.2 The relationship between Drag force and Velocity
.
Fig. 6.3 The relationship between Drag force and Diameter
y = 0.0248x1.0279
R² = 0.9967
0
0.1
0.2
0.3
0.4
0.5
0.6
0.7
0 5 10 15 20 25
Dra
g F
orc
e (
nm
)
Velocity (m/s)
Drag Force vs Velocity
y = 648.1x1.7876
R² = 0.9971
0
0.1
0.2
0.3
0.4
0.5
0.6
0.7
0.8
0.9
1
0.000 0.010 0.020 0.030
Dra
g F
orc
e (
nm
)
Diameter(m)
Drag Force vs Diameter

ESTABLISHMENT OF CO-RELATION
P a g e | 71
Table.6.1 Details of dimensional parameters of the experimental runs.
Roughness Velocity
Diameter X FD FD FD
Drag force (FD)
exponent
predicted FD
% error
325 22.26 0.02 0.038 0.62
0.6272 0.0931 0.61198 2.4
260 22.26 0.02 0.037 0.61
0.6150
0.59941 2.5
200 22.26 0.02 0.036 0.59
0.5982
0.58496 2.2
160 22.26 0.02 0.035 0.58
0.5883
0.57295 2.6
260 22.26 0.02 0.037
0.59
0.5983 1.0413 0.59941 0.1
260 20.80 0.02 0.034
0.55
0.5593
0.55850 0.1
260 19.39 0.02 0.032
0.52
0.5295
0.51911 1.9
260 15.46 0.02 0.025
0.41
0.4118
0.40998 0.4
260 22.26 0.0125 0.016
0.26 0.2647 1.8112 0.25565 3.4
260 22.26 0.015 0.022
0.34 0.3432
0.35580 3.6
260 22.26 0.02 0.037
0.58 0.5883
0.59941 1.8
260 22.26 0.025 0.055
0.90 0.9022
0.89830 0.4
For the above three graphs, we get
𝑛1 = 0.0928,
𝑛2 = 1.0279,
𝑛3 = 1.7876

ESTABLISHMENT OF CO-RELATION
P a g e | 72
Fig.6.4 The relationship between Drag force and x.
Then found out the value of 𝑥 = (𝑉)𝑛1(𝐷)𝑛2(𝑘)𝑛3 and plot the graph between drag force and x
(i.e. effect of velocity, effect diameter and effect of roughness). In Figure 6.4 and put the
three values is given i.e. 0.0928, 1.028 and 1.788.
𝑦 = 16.953𝑥1.0134
𝑅2 = 0.99
In Figure 6.5, the graph between drag forces and 𝑥 = (𝑉)𝑛1(𝐷)𝑛2 (𝑘)𝑛3 , other correlation data
are plotted. The values of exponent are 0.093, 1.042 and 1.813.
𝑦 = 13.582𝑥1.0367
𝑅2 = 0.98
In Figure 6.6, the graph between drag force and effect of roughness, effect of velocity, effect
of diameter and other explicit points.
𝑦 = 10.508𝑥0.9463
𝑅2 = 0.97
y = 16.953x1.0134
R² = 0.9957
0
0.1
0.2
0.3
0.4
0.5
0.6
0.7
0.8
0.9
1
0 0.02 0.04 0.06
Dra
g f
orc
e(N
m)

ESTABLISHMENT OF CO-RELATION
P a g e | 73
Table.6.2 Details of dimensional parameters of the experimental runs with other explicit
points and correlation data
Roug
hness
Veloc
ity
Diamet
er x
Effect of
roughnes
s
Effect of
velocity
Effect of
diameter
Other
explicit
points correlation
325 22.26 0.02 0.050927 0.62762
0.62762
260 22.26 0.02 0.049326 0.61501
0.615012
200 22.26 0.02 0.047509 0.5982
0.5982
160 22.26 0.02 0.046016 0.5884
0.588399
260 22.26 0.02 0.049326
0.5984
0.598399
260 20.8 0.02 0.046004
0.5594
0.559365
260 19.39 0.02 0.042801
0.5296
0.529559
260 15.46 0.02 0.03391
0.4119
0.411879
260 22.26 0.0125 0.021287
0.26477
0.26477
260 22.26 0.015 0.029491
0.34323
0.343232
260 22.26 0.02 0.049326
0.5884
0.588399
260 22.26 0.025 0.073512
0.90221
0.902211
325 21.87 0.025 0.07453
0.8924 0.8924
260 21.87 0.025 0.072188
0.88079 0.88079
200 21.87 0.025 0.069528
0.86298 0.86298
160 21.87 0.025 0.067343
0.85317 0.85317
325 21.87 0.025 0.07453
0.87279 0.87279
325 19.39 0.025 0.065856
0.81395 0.81395
325 15.46 0.025 0.052176
0.72647 0.726465
325 21.87 0.0125 0.021582
0.2432 0.2432
325 21.87 0.015 0.0299
0.32362 0.323619
325 21.87 0.02 0.05001
0.57859 0.578592
325 21.87 0.025 0.07453
0.87279 0.87279

ESTABLISHMENT OF CO-RELATION
P a g e | 74
Fig.6.5 relationship between Drag force and effect of k, V, D and other correlation data
Fig.6.6 relationship between Drag force and effect of k, V, D and other explicit points
y = 13.582x1.0367
R² = 0.9859
0
0.1
0.2
0.3
0.4
0.5
0.6
0.7
0.8
0.9
1
0 0.02 0.04 0.06 0.08
Dra
g F
orc
e Effect of roughness
Effect of velocity
Effect of diameter
Other exptl points
corr
y = 10.508x0.9463
R² = 0.9723
0
0.2
0.4
0.6
0.8
1
1.2
0 0.02 0.04 0.06 0.08 0.1
Dra
g F
orc
e (N
m)
Effect ofroughnessEffect of velocity
Effect ofdiameter

ESTABLISHMENT OF CO-RELATION
P a g e | 75
Fig 6.7 Final correlation plots between the drag parameter with system parameters in
dimensional data
Then found out the value of 𝑥 = (𝑉)𝑛1(𝐷)𝑛2(𝑘)𝑛3 and plot the graph between drag force and x
(i.e. effect of velocity, effect diameter and effect of roughness).
𝑦 = 0.98𝑥0.9722
𝑅2 = 0.972
it is clearly seen that from the above graph, it is plotted between the predicted Drag force
verses correlation data for rough cylindrical bodies. In this case, it is found that in Figure 6.1
both drag force vs. roughness agrees perfectly and also gives a satisfactory result along
appropriately with determination or Regression coefficient is R2=0.996. Similarly, the
comparison occurs in between the drag force vs. velocity has been shown in Figure 6.2 for
experimental data and R2=0.9967. Similarly, the comparison occurs in between the drag
force vs. diameter has been shown in Figure 6.3 for experimental data and R2=0.997.
y = 0.98x0.9722
R² = 0.9728
0
0.2
0.4
0.6
0.8
1
1.2
0 0.2 0.4 0.6 0.8 1 1.2
Dra
g F
orc
e (N
m)
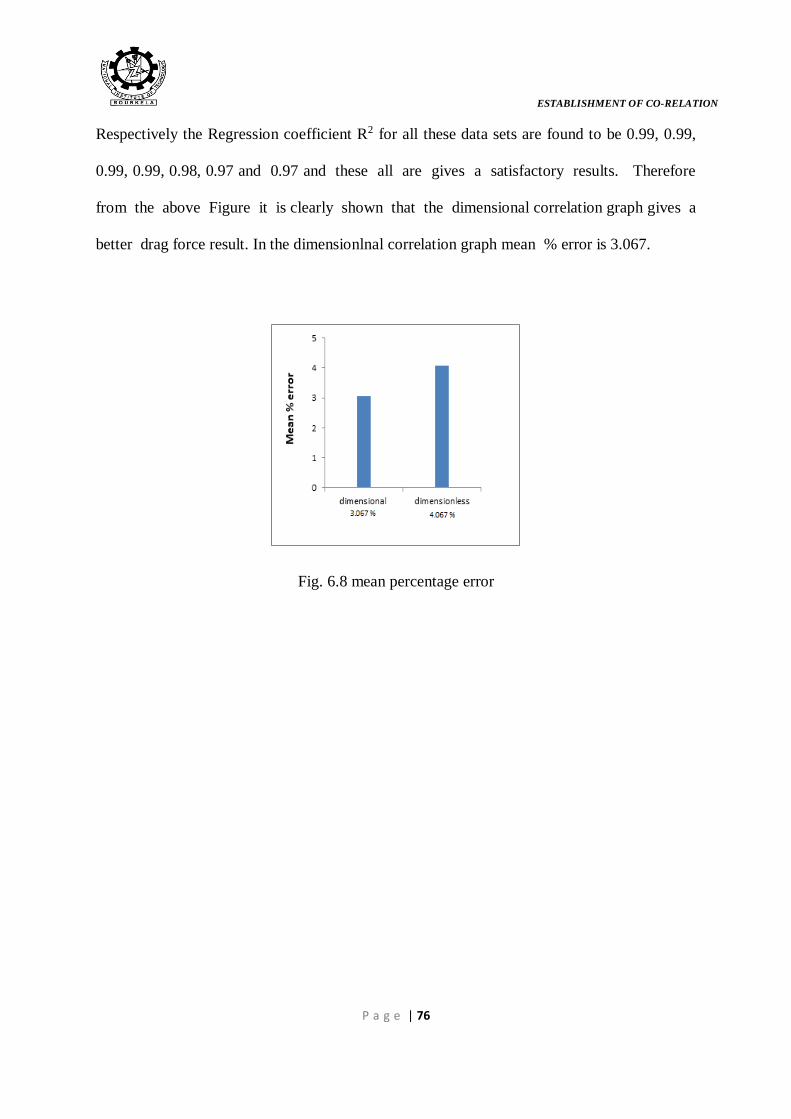
ESTABLISHMENT OF CO-RELATION
P a g e | 76
Respectively the Regression coefficient R2 for all these data sets are found to be 0.99, 0.99,
0.99, 0.99, 0.98, 0.97 and 0.97 and these all are gives a satisfactory results. Therefore
from the above Figure it is clearly shown that the dimensional correlation graph gives a
better drag force result. In the dimensionlnal correlation graph mean % error is 3.067.
Fig. 6.8 mean percentage error

CONCLUSION
P a g e | 77
CHAPTER VII
CONCLUSION
7.1 OVERVIEW
Extensive literature survey has been carried out to study the drag force and pressure
distribution of a rough cylindrical bodies. From the literature, it is found that Reynolds
number depends upon velocity, diameter or radius and kinematic viscosity. As compare to
both methods of drag force, the direct measurement method gives more reliable than the
pressure distribution method. From the experimental findings and different plots shown
above, the following conclusions can be derived:
The drag force increases with increase in diameter of the cylinder, because drag force
is directly proportional to area of cylinder.
When flow velocity is increase the drag force increases. But drag coefficient
decreases with increase in drag force. Drag coefficient is inversely proportional ti
drag force. When diameter, velocity and roughness of the cylinder increases the drag
coefficient decreases.
The drag force increases with increase in roughness and drag coefficient is decreases.
In this case, drag force increases with the smooth surface and decreases in rough
surface in compare smooth surface and rough surface.
For a cylinder of particular diameter and roughness, drag force has been found to
increase with increase in air velocity.
Drag coefficient decreases with an increase in Reynolds number for all k/D ratios for
a cylinder. But drag force increases with increases in Reynolds number for all k/D
ratios for a cylinder. Because Reynolds number depends upon velocity and diameter.

CONCLUSION
P a g e | 78
In pressure distribution method, the diameter increases with their pressure coefficient
is very high. In both methods we found drag coefficient in different ways. In direct
weighing method we found drag coefficient by the formula but in pressure
distribution method we found the drag coefficient by area under the curve.
The present study under taken can be further extended to study the effect of surface
roughness on flow parameters for different shape and configuration of objects.
The results of pressure distribution profiles clearly show that the flow separates at
around 800-900 on either side of the cylinder from the upstream stagnation point.
As compare to both methods of drag force, the direct measurement method gives
more reliable than the pressure distribution method.
For a constant Reynolds number, the value of drag coefficient decreases with an
increase in k/D ratio of the cylinder.
In dimensional correlation result is very sensitive, accurate and deterministic. The
mean % error of dimensional error is 3.047 %. In dimensionless correlation result is
linear with their parameters. The mean % error of dimensionless is 4.047 %.
7.2 SCOPE FOR FUTURE WORK
The present work leaves a wide scope for future investigators to explore many other aspects
of an aerodynamic analysis.
The setup of airflow bench, we investigated the another attachment of wake traverse.
In this setup we used different diameters of cylinder, in futher studied we used
different length, different shapes of models such as sphere, airfoil, rectangular, flat
plate etc.

CONCLUSION
P a g e | 79
Another tested of this project is we compare the big setup of wind tunnel and airflow
bench.
The correlation developed may be improved by incorporating more data from cylinder
of different geometries.
The relationship is establised between the drag force and roughness, here the
roughness is made dimensionaless by dividing the diameter of the cylinder. The
further work can be done by making it by non-dimensional through any one
dimensional parameter.
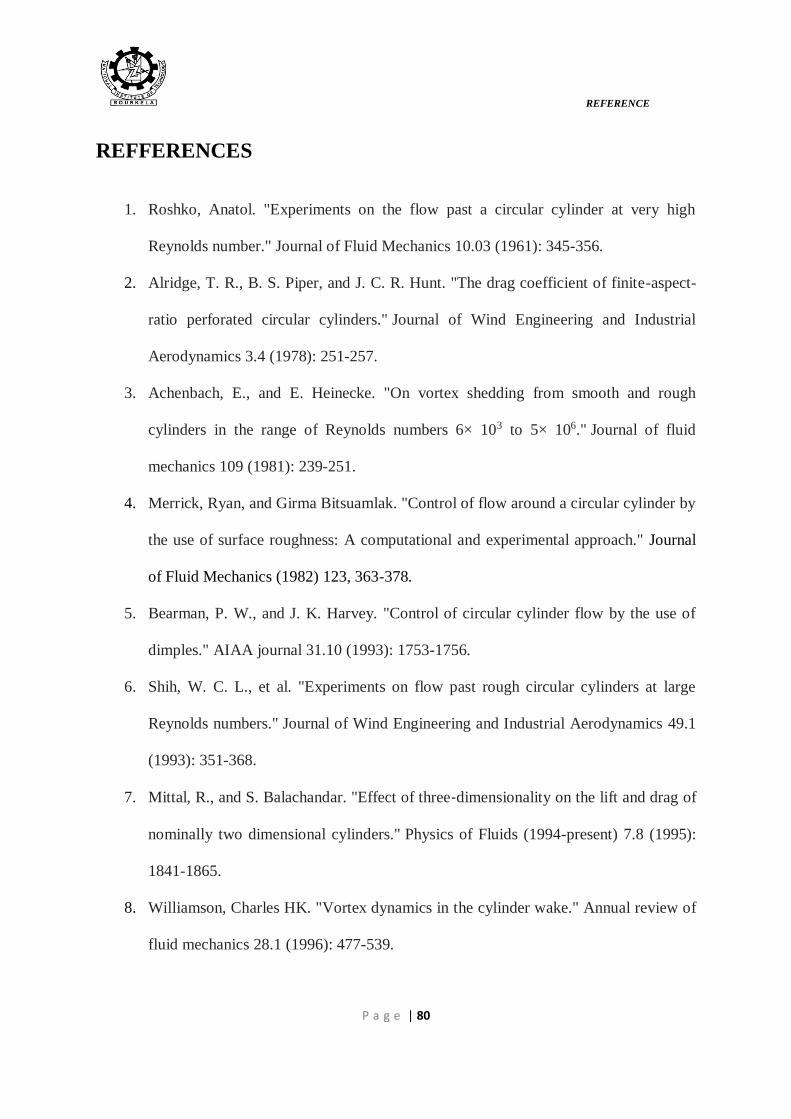
REFERENCE
P a g e | 80
REFFERENCES
1. Roshko, Anatol. "Experiments on the flow past a circular cylinder at very high
Reynolds number." Journal of Fluid Mechanics 10.03 (1961): 345-356.
2. Alridge, T. R., B. S. Piper, and J. C. R. Hunt. "The drag coefficient of finite-aspect-
ratio perforated circular cylinders." Journal of Wind Engineering and Industrial
Aerodynamics 3.4 (1978): 251-257.
3. Achenbach, E., and E. Heinecke. "On vortex shedding from smooth and rough
cylinders in the range of Reynolds numbers 6× 10³ to 5× 10⁶." Journal of fluid
mechanics 109 (1981): 239-251.
4. Merrick, Ryan, and Girma Bitsuamlak. "Control of flow around a circular cylinder by
the use of surface roughness: A computational and experimental approach." Journal
of Fluid Mechanics (1982) 123, 363-378.
5. Bearman, P. W., and J. K. Harvey. "Control of circular cylinder flow by the use of
dimples." AIAA journal 31.10 (1993): 1753-1756.
6. Shih, W. C. L., et al. "Experiments on flow past rough circular cylinders at large
Reynolds numbers." Journal of Wind Engineering and Industrial Aerodynamics 49.1
(1993): 351-368.
7. Mittal, R., and S. Balachandar. "Effect of three‐dimensionality on the lift and drag of
nominally two dimensional cylinders." Physics of Fluids (1994-present) 7.8 (1995):
1841-1865.
8. Williamson, Charles HK. "Vortex dynamics in the cylinder wake." Annual review of
fluid mechanics 28.1 (1996): 477-539.

REFERENCE
P a g e | 81
9. Bouak, F., and J. Lemay. "Use of the wake of a small cylinder to control unsteady
loads on a circular cylinder." Journal of Visualization 4.1 (2001): 61-72.
10. Grosche, F-R., and G. E. A. Meier. "Research at DLR Göttingen on bluff body
aerodynamics, drag reduction by wake ventilation and active flow control.”Journal of
Wind Engineering and Industrial Aerodynamics 89.14 (2001): 1201-1218.
11. Protas, B., and J. E. Wesfreid. "Drag force in the open-loop control of the cylinder
wake in the laminar regime." Physics of Fluids (1994-present) 14.2 (2002): 810-826.
12. Tsutsui, T., and T. Igarashi. "Drag reduction of a circular cylinder in an air-
stream." Journal of Wind Engineering and Industrial Aerodynamics 90.4 (2002):
527-541.
13. Mahbub Alam, Md, M. Moriya, and H. Sakamoto. "Aerodynamic characteristics of
two side-by-side circular cylinders and application of wavelet analysis on the
switching phenomenon." Journal of Fluids and Structures 18.3 (2003): 325-346.
14. Lee, Sang-Joon, Sang-Ik Lee, and Cheol-Woo Park. "Reducing the drag on a circular
cylinder by upstream installation of a small control rod." Fluid dynamics
research 34.4 (2004): 233-250.
15. Mittal, Sanjay, and Saurav Singh. "Vortex-induced vibrations at subcritical Re.
"Journal of Fluid Mechanics 534 (2005): 185-194.
16. Bergmann, Michel, Laurent Cordier, and Jean-Pierre Brancher. "Drag minimization
of the cylinder wake by trust-region proper orthogonal decomposition." Active Flow
Control. Springer Berlin Heidelberg, (2007): 309-324.
17. Lyotard, Nicolas, et al. "Polymer and surface roughness effects on the drag crisis for
falling spheres." The European Physical Journal B 60.4 (2007): 469-476.

REFERENCE
P a g e | 82
18. Pasto, S. "Vortex-induced vibrations of a circular cylinder in laminar and turbulent
flows." Journal of Fluids and Structures 24.7 (2008): 977-993.
19. Zheng, Z. C., and N. Zhang. "Frequency effects on lift and drag for flow past an
oscillating cylinder." Journal of Fluids and Structures 24.3 (2008): 382-399
20. Triyogi, Y., D. Suprayogi, and E. Spirda. "Reducing the drag on a circular cylinder
by upstream installation of an I-type bluff body as passive control. “Proceedings of
the Institution of Mechanical Engineers, Part C: Journal of Mechanical Engineering
Science 223.10 (2009): 2291-2296.
21. Libii, Josué Njock. "Using wind tunnel tests to study pressure distributions around a
bluff body: the case of a circular cylinder." World Transactions on Engineering and
Technology Education 8.3( 2010)
22. Mohammad and Islam et al. “Reduction of Drag Force of a Cylinder by Attaching
Cylindrical Rings”, Proceedings of the 13th Asian Congress of Fluid Mechanics,
(2010), Dhaka, Banglades.
23. Hodžić, Nedim, and Rasim Begagić. "Experimental investigation of boundary layer
separation influence of pressure distribution on cylinder surface in wind tunnel
armfield C15-10." (2011)
24. D'auteuil, Annick, Guy L. Larose, and Steve J. Zan. "Wind turbulence in speed
skating: measurement, simulation and its effect on aerodynamic drag." Journal of
Wind Engineering and Industrial Aerodynamics 104 (2012): 585-593.
25. M.Vignesh Kumar, Pillai et.al. “Drag characteristics of circular cylinder with
various roughness for higher Reynolds number.” VI National Conference on Wind
Engineering, (2012), 14-15

REFERENCE
P a g e | 83
26. Richter, Andreas, and Petr A. Nikrityuk. "Drag forces and heat transfer coefficients
for spherical, cuboidal and ellipsoidal particles in cross flow at sub-critical Reynolds
numbers." International Journal of Heat and Mass Transfer 55.4 (2012): 1343-1354.
27. Butt, U., and C. Egbers. "Aerodynamic Characteristics of Flow over Circular
Cylinders with Patterned Surface." J. Materials, Mechanics, Manufacturing 1.2
(2013).
28. Toukir Islam and S.M. Rakibul Hassan, “Experimental and Numerical Investigation
of Flow over a Cylinder at Reynolds Number 105”, Journal of Modern Science and
Technology, (2013) 1. 1 .52-60.
29. . Tamayol, A., et al. "Low Reynolds number flows across ordered arrays of micro-
cylinders embedded in a rectangular micro/minichannel." International Journal of
Heat and Mass Transfer 58.1 (2013): 420-426.

REFERENCE
P a g e | 84
PUBLICATIONS FROM THE WORK
A: Published
1. Monalisa Mallick, A. Kumar (2014) “Study on Drag Coefficient for the Flow Past a
Cylinder,” International Journal of Civil Engineering Research, vol.5, pp. 301-306
2. Monalisa Mallick, A. Kumar (2014) “Experimental Investigation of Flow Past A
Rough Surfaced Cylinder,” International Journal of Engineering Research and
Applications (IJERA).