--+@5 - MAGiC NACA Archivenaca.central.cranfield.ac.uk/reports/arc/cp/0921.pdf · ·...
32
--+@5 C.P. No. 921 MINISTRY OF TECHNOLOGY AERONAUTICAL RESEARCH COUNCll CURREN J PAPERS The Pressure Drag of an Aerofoil with Six Different Round Leading Edges; at Transonic and Low SuP,rsonic Speeds BY P. G. wilby LONDON: HER MAJESTY’S STATIONERY OFFICE 1967 FIVE SHILLINGS NET
-
Upload
duongthuan -
Category
Documents
-
view
231 -
download
0
Transcript of --+@5 - MAGiC NACA Archivenaca.central.cranfield.ac.uk/reports/arc/cp/0921.pdf · ·...

--+@5 C.P. No. 921
MINISTRY OF TECHNOLOGY
AERONAUTICAL RESEARCH COUNCll
CURREN J PAPERS
The Pressure Drag of an Aerofoil with
Six Different Round Leading Edges;
at Transonic and Low SuP,rsonic Speeds
BY
P. G. wilby
LONDON: HER MAJESTY’S STATIONERY OFFICE
1967
FIVE SHILLINGS NET


C.P. No. 921"
January, 1966
The Pressure Drag of an Aerofoil with Six Different Round Leading Edges, at
Transonic and Low Supersonic Speeds - By -
P. G. Wilby
SUMMARY
The experimental. pressure drags of a two-dimensional aerofoil are compared, for a wide range of leading-edge r&ii. and other variations in curvature distribution, at transonic and low supersonic speeds. It is found that the drag does not increase with increasing leading-edge radius if the profile is designed so 8s to generate .a rapid supersonic expansion. Furthermore, for a given radius, signif'icant reductions in drag can be achieved by changing the way in which the leading-edge circle blends into the werall profile.
Notation
cD
cL
0
H
M
P
r
s
a
pressure drag coefficient
lift coefficient
aerofoil chord length
total pressure
Mach number
static pressure
surface radms
aerofoil ordinate defined in Section 4
angle of incidence
_____-____-_________------------------------ *Replaces N.P.L. Aero Report 1180 - A.R.C.27 618

-2-
Y ratio of specific heats of air
e surface slope
Subscripts
Co free-stream value
0 stagnation value
1. Introduction
It has been pointed out by Grahsx? that the pressure drag of a two-dimensional aerofoil is not necessarily increased by blunting the leading edge. Graham measured the drag of a circular arc biconvex aerofoil, first with the leading edge sharp and then cut back in stages to form circular profiles with increasing radius. Although the surface slope was continuous for these aerofoils, there was a discontinuity in curvature where the profile changed from the small leading-edge circle to the large circle of the basic profile. He found, as expected, that the high pressure region in the immediate vicinity of the stagnation point extended as the leading-edge radius increased, but that the effect of this on drag was offset by the suction generated over the outer parts of the blunt leading edges. However, the particular profile considered by Graham was of a simple geometric shape and possessed features that may be undesirable in a wing section. The large curvature discontinuity 00~113 cause flop separation under certain conditiocs, especially at low speeds, and the suction peaks generated at high subsonic speeds were too high. This led to a premature drag rise rather than the delayed drag rise that can be obtained with optimum "pesky" aerofoils.
With this in mind, the transonic and supersonic drags will be examined here for an aerofoil with six variations of leading-edge shape, each of which was intended to retain acceptable characteristics at low speeds and high subsonic speeds. In fact, the basic aerofoil was designed as a practical wing section with an emphasis on good transonic behaviom.
2. Aerofoil and Leading-Edge Profiles
The basic aerofoil has a maximum thickness of 6.5% chord at about 4% chord from the leading edge, and the leading edges are shown in Fig. 1. Profiles 1, 2, 3 and 4 are identical aft of 1% chord but profile 6 differs over the first 2% of chord. Profile 5 has the same leafing-edge circle as 3 but its upper surface is lowered and does not blend with the basic aerofoil until 4% chord is reached (as shown in Fig. 2). All aerofoils except 4 and 6 have the same chord length, the two exceptions being slightly extended.
All but one (No. 4) of the profiles are of the "pesky" type in that they generate a rapid expansion round the leading edge itself followed by a compression on the downstream surface. Their leading edges are circular with the constant, high curvature retained until the surface slope falls to about 30° to the chord line, at which point there comes a rapid decrease to low values of curvature. The surface slope is everywhere Continuous. Apart from the
differences/

AEROIWJTICAL RESEARCH COUNCIL
Publlcatmns Section, Netlonal Physical Laboratory,
Dear Sir,
I enclose ten ooples of Current Paper No. for your retention. Please sign and return the attached fo%m of receipt.
Yours falthfully,
for Pubtioations Officer
The Publications Officer, Aeronautzcal Research Councd, National Physical Laboratory, Teddington, Mddlesex.
I hereby acknowledge receipt of ten ooples of Current Paper No.
Date...... . . . Sqned . . . . . . . . . : . . . .

-3-
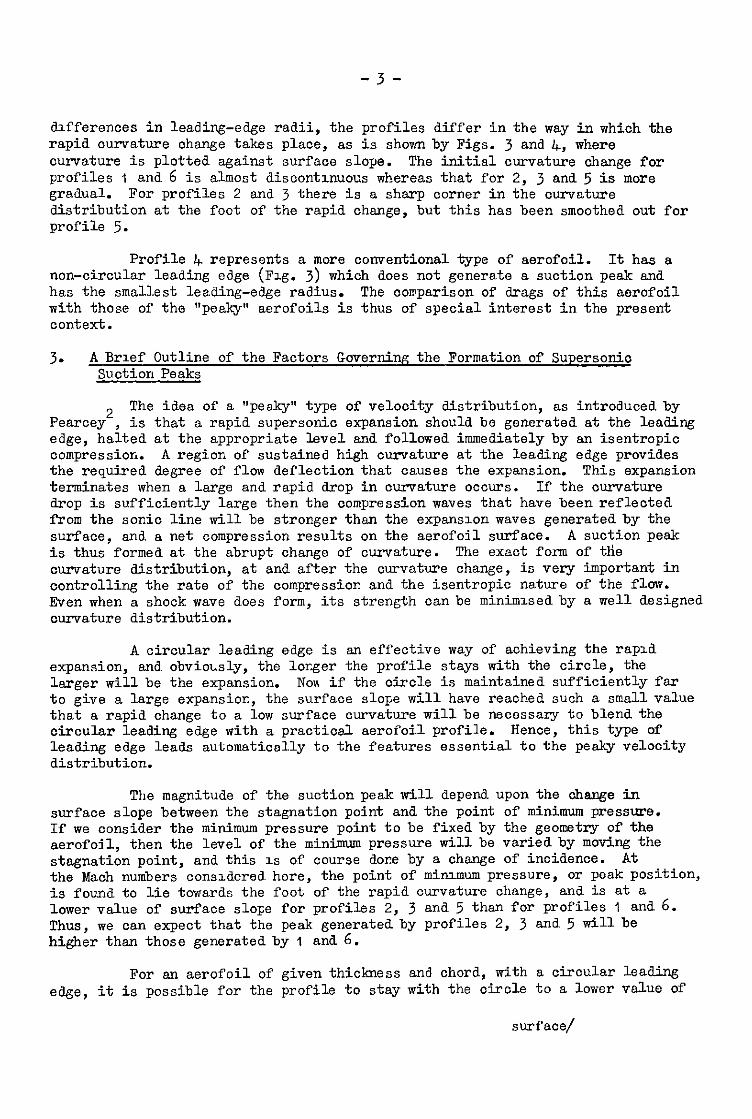
differences in leading-edge radii, the profiles differ in the way in which the rapid curvature change takes place, as is shown by Figs. 3 and 4, where curvature is plotted against surface slope. The initial curvature change for profiles 1 and 6 is almost disoontznuous whereas that for 2, 3 and 5 is mere gradual. For profiles 2 and 3 there is a sharp corner in the curvature distribution at the foot of the rapid change, but this has been smoothed out for profile 5.
Profile 4 represents a mere conventional type of aerofoil. It has a non-circular leading edge (Fig. 3) which does not generate a suction peak and has the smallest leading-edge radius. The comparison of drags of this aerofoil with those of the "pesky" aerofoils is thus of special interest in the present context.
3. A Brief Outline of the Factors Governing the Formation of Supersonic Suction Peaks
2 The idea of a "pesky" type of velocity distribution, as introduced by Pearcey , IS that a rapid supersonic expansion should be generated at the leading edge, halted at the appropriate level and follcwed immediately by an isentropic compression. A region of sustained high Curvature at the leading edge provides the required degree of flow deflection that causes the expansion. This expansion terminates when a large and rapid drop in curvature cccurs. If the curvature drop is sufficiently large then the compression waves that have been reflected from the sonic line will be stronger than the expansion waves generated by the surface, and a net compression results on the aerofoil surface. A suction peak is thus formed at the abrupt change of curvature. The exact form of the curvature distribution, at and after the curvature change, is very important in controlling the rate of the compression and the isentropic nature of the flow. Even when a shock wave does form, its strength can be minimised by a well designed curvature distribution.
A circular leading edge is an effective way of achieving the rapid expansion, and obviously, the larger the profile stays with the circle, the larger will be the expansion. Ncu if the circle is maintained sufficiently far to give a large expansion, the surface slope will have reached such a small value that a rapid change to a low surface curvature will be necessary to blend the circular leading edge with a practical aerofoil profile. Hence, this type of leading edge leads automatically to the features essential to the pesky velocity distribution.
The magnitude of the suction peak will depend upon the change in surface slope between the stagnation point and the point of minimum pressure. If we consider the minimum pressure point to be fixed by the geometry of the aerofoil, then the level of the minimum pressure will be varied by moving the stagnation point, and this is of ccurse done by a change of incidence. At the Mach numbers considered here, the point of minimum pressure, or peak pOsitiOn,
is found to lie towards the foot of the rapid curvature change, and is at a lower value of surface slope for profiles 2, 3 and 5 than for profiles I and 6. Thus, we can expect that the peak generated by profiles 2, 3 and 5 will be higher than those generated by 1 and 6.
For an aerofoil of given thickness and chord, with a circular leading edge, it is possible for the profile to stay with the circle to a lower Value Of
surface/

-4-
surface slope as the leading-edge radius becomes progressively larger. If this possibility is exploited, then the larger the radius becomes, the larger will be the suction peak. From the point of view of supersonic drag, the increased suction peak tends to counter the effect of the increased bluntness. However, a very high suction peak may not be acceptable at subsonic speeds, as mentioned earlier, and because of this, the peak of profile 2 was kept below the possible maximum for an aerofoiltith such a large leading-edge radius.
4. Measurement of Pressure Drag
Two-dimensIona models with a chord length of 5 in. (I27 mm) were tested in the 20 in. x 8 in. (508 mm. x 203 mm) wind tunnel at the N.P.L. The models were provided with static pressure holes drilled normal to the surface, and pressure distributions were measured by a multi-tube manometer. Boundary-layer transition was induced by a oarborundum band at the leading edge.
evaluation The pressure drag coefficient CD was given by a graphical
of the equation
cD = -LL! jmaxA (fpo),
coo0 f min
where A denotes the difference between pressures at points with the same value of s/c. For this purpose, the ratio p/Ho of static pressure to stagnation pressure was plotted against the ordinate s divided by the aerofoil chord c. z was the perpendicular distance, of a point on the aerofoil surface, from a line passing through the trailing edge in a direction parallel to the free stream. Thus, the pressure difference between two elements on the surface with equal values of s represents a direct contribution to the drag.
The forms taken by the above type of pressure plot, and their interpretation in analysing the sources of pressure drag, have been discussed by Pearce y2 and Graham'. Typical examples for the cases studied here are annotated in Figs. 6 and 7 in order to assist in thew interpretation.
Attention is confined to pressure drag and the discussion relates to the effects of leading-edge shape on wave drag, on the assumption that the changes in leading-edge shape do not influence the boundary-layer contribution to the pressure drag. That this assumption is valid is indicated by the fact that the pressures at the rear of the aerof'oil were never materially affected by the leading-edge changes.
5. Comparison of Pressure Drags for M, = 1 and I.4
The values of pressure drag for the various profiles will be considered first at those Mach numbers for which the changes are due to differences in the fully established wave drag, that is, at and beyond the "transor3.c hump".
Values of CD at M, = 1 are plotted against CL in Fig. 5. At low CL all the profiles have almost the same drag, but as C
L increases then
the/

-5-
the spread of CD values increases. However, over the range of CL cocsidered,. the drags of profiles I, 2, 3 and 4 can be taken to be alike, with the drag of profile 6 slightly higher and that of profile 5 somewhat lower. It is not possible to relate drag directly to leading-edge radius and it is of interest to look at a few typical pressure distributions.
In Fig. 6 we have pressure distributions for profiles 2, 3 and 4 at a = 00. These profiles represent the full range of leading-edge radii and it is immediately seen how the suction peaks eat into the drag area and so offset the extra fullness at the immediate leading edge. A similar situation is found in Fq. 7 for aerofoils at 3” incidence.
Fig. 8 demonstrates that the way in which the leading-edge circle blends into the basic aerofoil can be important. Here, pressure distributions for profiles 3 and 5 are oompared; these two differ on leaving the leading-edge circle. The curvature of profile 5 is such as to reduce the pressure rise that follows the suction. peak to such an extent that the area of the drag loop to the right of the peak for profile 3 is eliminated, and in fact replaced by a very small suction loop.
The profiles with the highest and lowest drags have their pressure distributions compared in Fig. 9. This shows clearly how it comes about that the profile with the larger leading-edge radius has the lower drag.
A Mach number of 1.4 produces much the same pattern of results, and CD iS plottea a&&d CL in Fig. 10. Profiles 2 and 6 which have the largest and smallest "peak"-producing leading-edge radii have the same drag, and thexr pressure distributions are conpared in Fig. 11. The profiles with the highest and lowest drags are I and 5 respectively and their pressure distributions are compared in Fig. 12. As these two profiles have almost the same leading-edge radii, the importance of the blending from circle to basic profile is apparent.
With regard to the level of drag at zero lift and M,= 9
it is interesting to note that the theoretical pressure drag coefficient for a biconvex circular arc section (sharp leading edge) of the same thickness chord ratio as that of the present aerofoils, has the value O-038. This, as is seen in Fig. 5, is almost identical with the aerofoils considered here.
6. Comparison of Pressure Drags at Subsonic Speeds
A comparison of the pressure distributiors and their assooiated drags is a little less straightforward at subsonic speeds. In inviscid shock-free flow the thrust and drag loops, such as those in Fig. 13, would exactly balance to give the zero drag for potential flow, in spite of substantial differences in the shape of the loops for the different leading-edge shapes.
In practice each aerofoil will have a finite pressure drag, even in the absence of shock waves, because the boundary-layer growth will prevent the realisation of true potential flow. It then becomes instructive to examine how pressure drag is augmented by the development of shock wave drag as Mach number is increased, and how this development differs according to leading-edge shape. (Pearcey2 has shown that all the initial increase in wave drag can be traced to changes in the thrust loop.) Profiles 4 and 5 provide contrasting
examples/

-6-
examples of pressure-distributid develqment with increasing Mach number, as illustrated in Figs. 13 to 15.
In Fig. 13 we have the two different types of pressure distribution compared at a subcritical Mach number and it is seen that both profiles have the same drag. The situation at M, = 0.7 is shown in Fig. 14, and here shock waves haxe appeared and the drag of both profiles has risen slightly. It is noticed the drag of the profile 5 is slightly higher than that of the non-pesky aerofoil, and this is due to the strong shock which sits ahead of the crest of profile 5. This situation can be improved by changing the shape of the aero+'oil to one more like profile 3, whose pressure distributior, is also shown. Due to its improved pressure distribution which effectively eliminates wave drag, profile 3 is found to have less drag than either of the other two.
When Mach number has increased to 0.8 the pressure distributions of profiles 4 and 5, as shown in Fig. 15, provide an interesting contrast. Here we see that profile 5 still retains a suction, loop (though somewhat reduced in area) due to the "pea@" nature of its pressure distribution, whereas the suction loop for profile 4 has now becorre an extension of the drag loop. The result is that at this Mach number the &rag of profile 5 is considerably less than that of profile 4.
7. Conclusions
It has been shoun that an increase of leading-edge radius is not necessarily accompanies by an increase of drag. Although an aerofoil with a large leading-edge radius has a large frontal area in the high pressure region, this can be balanced by a low pressure region which results from the large and rapid expansion that can be generated by the blunt leasing-e&e. This confirms the conclusions reached by Graham 1, but here we have considered a practical wing section.
The importanoe of designing the blunted aerofoil to generate and exploit the low pressure region has been indicated, and it has been shown to be possible to produce an aerofoil with a large leading-edge ratius whxh has less drag than one with a more conventional and considerably smaller leading-edge radius.
References

No. Author(s)
1 W. J. Graham
2 H. H. Peemey
3 J. R. Spreiter and A. Y. Nlcsne
-7-
References
Title, etc.
The pressure drag due to blunt leadmg cages on twc-dimensional aerofoils, at transonic and low suporsomc speeds. A.F.C. R. & Id. 334-65. hhy, 1965.
The aerodynamic design of section shapes for swept wings. Advances in Aeronautical Sciences, Vo1.3. Prooeedings of the Second Intermtionnl C;ngress in the Aeronautical Sciences Zurich 12-16 Septembes, 1960. Pergnmon Press IIt&., 2p.277 - 322, 1962.
Thin serofoil theory based on npproximate solution of the Lxmsonic flojv equation. NACA TN 3970, '1958.
DS.
D 81540/1/R54 K4 l/87 XL 6r CL


Profile No. N.P L. Aerofoil No.
3 22 13
4 2214
6 22 I6
Leading edge profiles (0 to IO% chord)
I , , , . , , I , , , , , , , , , , , , . , , , , , I , , . . I , . I , , , . , , , , , I

_---
Leading-edge N.l?L. Aerofoil No.
3 2213
5 2215
Comparison of profiles 3 and 5 (0 to 50 % chord)
. , , , I , , , / , , , , , , , . , , ~ , ,
, . I

14
I2
IC
8
C
r
,O-
!O-
IO-
'0 -
O-
40-
!O -
o- 90
6
i
FIG. 3
Continuas to max. valua 256 at = 90’
\
\
\
Leading -adga
I
~\
\
\
\
\
\ \
e-e
---
Curvature distributions for profilas I, 4 and 6

141
12(
IOi
L r
6(
D-
)-
3-
3-
3-
I-
)-
‘90
FIG. 4
Leading-edge __-- 2
--- 3
5
Curvature distributions for profiles 2, 3 and 5

FIG. 5
I I
Leading -edge Radius e o chow
--- 6 0.77
2 I *43
-e-e 3 I.15
4 0.39
I I-04
----- 5 I* I5
0 o-2 CL 0.4 0.6
Drag coefficients as a function of lift coefficient at

27 618
FIG. 6
1 I I 1
Lead trig -edge Rodius(% chord) CD
---- 2 I.43 0.038
3 I.15 0 038
--- 4 0.39 0,037
0.2
08
surface
T
Pressure distributions at M, = I-0, oc = 0’

276lB
FIG. 7
0.4
I I I I I
Leading-edge Radius (O/o chord) CD CL .--- 2 I.43 0.060 0.41
I I.04 0.060 0.42
--- 4 0.39 0.060 0.42
0.06
7 / I
U Pvr surface
I
0.08
Pressura distributions at Mm = 1.0, a = 3’

FIG. 8
I I I
Loading-edge Radius(%chard) CD I
CL
5 I.15 0.071 o-54
--- 3 I.15 0.074 0.53
1 I
0.02 o-04 0.06 z 0.08 I c
IO
Pressure distributions at M, - 1.0, a = 4’

FIG. 9
I I I I
Leading-edge Radius (O/O chard) CD cL 5 I.15 0.0 7 I 0.54
--- 6 0.71 0.075 O-52
0.2 -
” pressu I .-
O-6 -
0.8-
. ^ I
0 0.0 2 0.04 O-06 z 0.08 T
0.10
Pressure dlstri butions at M,= I- 0,o: -4’

FI G.IO
o-0,
0.01
cD
0.01
o-02
0
*r I I Leading-edge Radius (O/O chore
I I.04
2 l-4 3 --
6 0*17 - --- 5 I *I5
-/- -- _----
3
Drag coefficients as a function of lift coefficient at
M (f)= l-4

FIG.11
Sonic ---_ prcs sure
I2
I I I I
Leading-edge Radius (O/O chord) cD C
2 I.43 0.042 0.:30
--- 6 0.71 0.042 0.1 I 5
‘\ I \ \ I I I I I u ’ : I I I’ \ ’ I,: u
0 o-o 2 0.04 2 O’Ub
c
0.C )8
Pressure dlstriburlons at Mm=l-4, 0: =2’
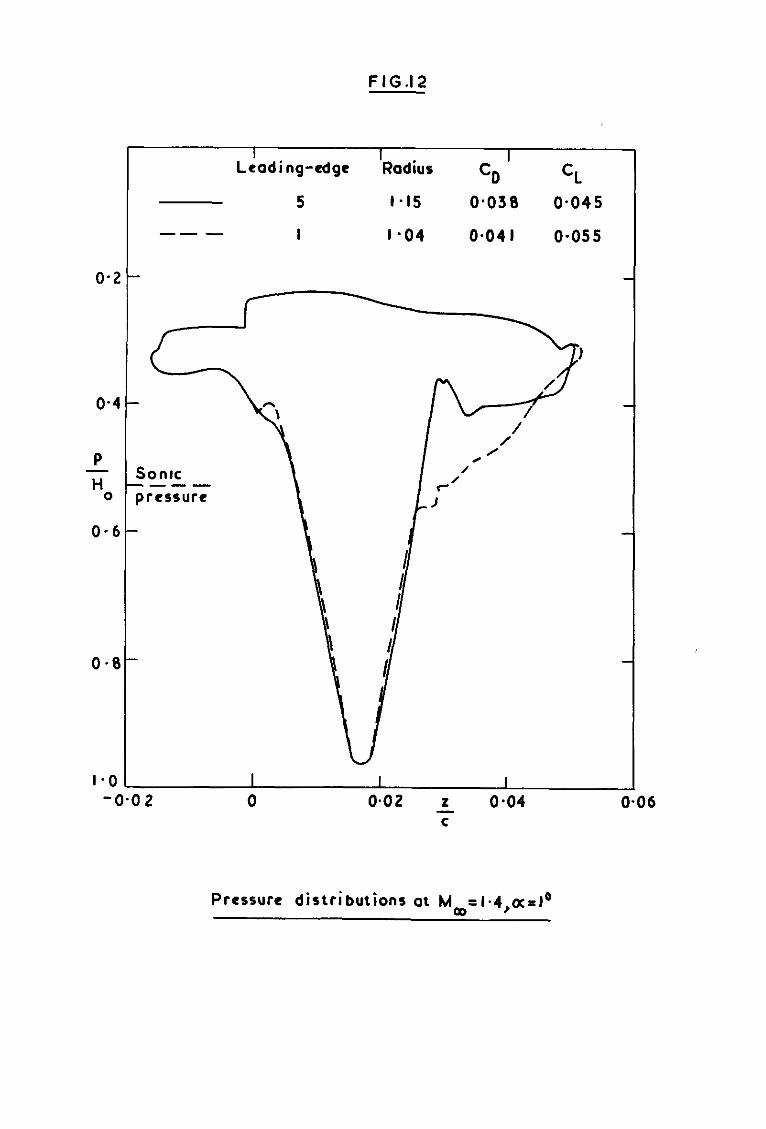
FIG.12
I Lcadi ng-edge
I Radius
I CD CL
5 l-15 0.03 a o-045
--- I l-04 D-04 I O-055
I I I I
-0.0 2 0 0.02 2 o-04 T
0-I 06
Pressure distributions at Mm= l.4,a=l”

27 618 FIG.13
0 1
Loading -edge --
5 I.15 O-007 0.406
0*2-
0.4 -
P
%
1
Sonic --- pressure
0*6 t
I-0 0 0.02 0.04 l 0.06
Pressure distributions at M, = 0.5, a = 3’

FIG. 14
0 I I I I
Leadin -edge Radius@ chord) CD CL -- 4 0.39 O-008 0~512
5 I*15 0~009 0.494
0.2 ----- - 3 1915 0.007 0.50 2
Pressure distributions a M, r0.7, a -50

FIG.15
I I I I
Leading-edge Radius (O/O chord) CD cL
-- 4 0.39 0.02 3 0.641
I .II; .- n.n I a n.#.ac ““., ” “1”
I
J I
0.04 z 0.06 0.0 8 -
Pressure dlsrributions at M-=0 8, ac=3’


A.R.C. C.P. tie. 921 January, 1966 Wilby, P. G.
THE PRESSURX DRAG OF AN AEROFOIL WITH SIX DIFFERENT ROUNI LEADING EDGES, AT TRANSCNIC PM) LOW SUPERSONIC SPEEDS
The experimental pressure drags of a tm-dimensional aerofoil are compared., for .a wide range of leading-edge radii and other variations in curvature distmbution, at transonic and low supersonic speeds. It is found that the drag does not increase with increasing leading-edge radius if the profile is designed so as to generate a rapid supersonic expansion. Furthermore, for a given radius, significant reductions in drag can be achieved by changing the way in which the lea&ng-edge olrcle blends into the overall profile.
A.R.C. C.P. No. 921 Jarwry, 1966 7ilby, P. G.
THE PRESSURE DRAGOFANABROFOIL WITE SIX DIFFERENT ROUND LEllDING EDGES, AT TRANSONIC AND LOW SUPERSONIC SPEEDS
The experimental pressure drags of a two-dimensional aerofoil are compared, for a wde range of leading-edge radii and other variations in curvature distribution, at transonic and law supers&c speeds. It is found that the drag does not increase with increasing leading-edge radius if the profile is designed so as to generate a rapi6 supersonic expansion. Furthermore, far a given radius, significant reductions in drag can be achieved by changing the way in which the leading-edge circle blends into the overall profile.
A.R.C. C.P. No. V2l A.R.C. C.P. No. 921 s
January, 1966 January, 1966 $
Wilby, P. G. Wilby, P. G. 2
TKE PRJ?SSlJPZ DRkGQF AN AEROFOILrmTH SIXDIFFERENT ROUND TEZ PE3SSUP.E DRAG OF AN AEROFOIL m SIX DIFFERENT ROUND LEADING EDGES, AT TRANSONIC AND LOW SUPERSONIC SPEEDS LEADING EDGES, AT TRANSONIC AND LOW SUPEBSONIC SPEEDS
g m
The experimental pressure drags of a two-dimensional The experimental pressure drags of a two-d&nensional aerofoil are cQopared, for a vnde range of leading-edge aerofoil are compared, for a wide range of leading-edge ra&i and other variations in curvature distribution, at radii and other variations in curvature distribution, at transonio and low supersonic speeds. It is found that transonic and low supersonic speeds. It is found that the drag does not increase with increasing leading-edge the drag does not increase with increasing leading-edge radius if the profile is deslgned so as to generate a radius if the profile is designed so as to generate a rapid supersonic expansion. Furthermore, for a given rapid supersonic expansion. Furthermore, for a given raalus, significant reductions in drag can be achieved by radius, significant reductions 111 drag can be achieved by changing the way in which the leading-edge circle blends changing the way in which the leading-edge circle blends into the overall profile. into the overall profile.
.,.,”


C.P. No. 921
0 Crown copyright 1967
Printed and published by HER Mmsru’s STATIONERY OFP~CE
To be purchased from 49 High Holborn, London w c.1 423 Oxford Street, London w.1 33A Castle Street, Edmburgh 2
109 St Mary Street, CardltT Brazennose Street, Manchester 2
50 Farfax Street, Bnstol 1 35 Smallbrook, Rmgway, Brmingham 5
7 - 11 Linenhall Street, Belfast 2 or through any bookseller
Printed in England
C.P. No. 921
S 0 Code No 23-9017-21