Value to Outcomes (V2O) in Oncology Drug...
24
© Copyright 2014 Quintiles ™ Value to Outcomes (V2O) in Oncology Drug Development Dr. John J. Doyle June 17, 2016
Transcript of Value to Outcomes (V2O) in Oncology Drug...

© Copyright 2014 Quintiles
™
Value to Outcomes (V2O) in Oncology Drug
Development
Dr. John J. Doyle
June 17, 2016

2
Pharmaceutical companies are making remarkable
investments in cancer research
Source: Lloyd. Citeline Pharma R&D annual review 2015 - PharmaProject Jan 2015
Number of pipeline products in R&D

3
For example, the PD-1/PD-L1 pipeline is intensely
competitive across major oncology markets
Atezolizumab
(28 trials)Launch 2017
Keytruda
(43 trials)
MEDI-4736
(23 trials)Launch 2017
Opdivo
(42 trials)
5 trials
1 trial
There are 143 oncology trials spanning 23 markets and 39 trials are phase III
Phase I-III trials for PD-1 and PD-L1Bla
dder
Bra
inBre
ast
Cer
vica
lC
olor
ecta
lG
astric
Hea
d and
Nec
k H
emat
olo
gic
Hep
atoce
llula
r
Hod
gkin
's L
ymph
oma
Mel
anom
aM
esot
helio
ma
Mul
tiple
Mye
lom
a
Non
-Hod
gkin
's L
ymph
oma
Non
-Sm
all C
ell Lun
g
Oth
er (S
olid
Tum
ors)
Ova
rian
Pan
crea
ticPro
stat
eR
enal
Cel
lSar
com
aSm
all C
ell L
ung
Source: BioMedTracker September 2015, Quintiles Analysis
4
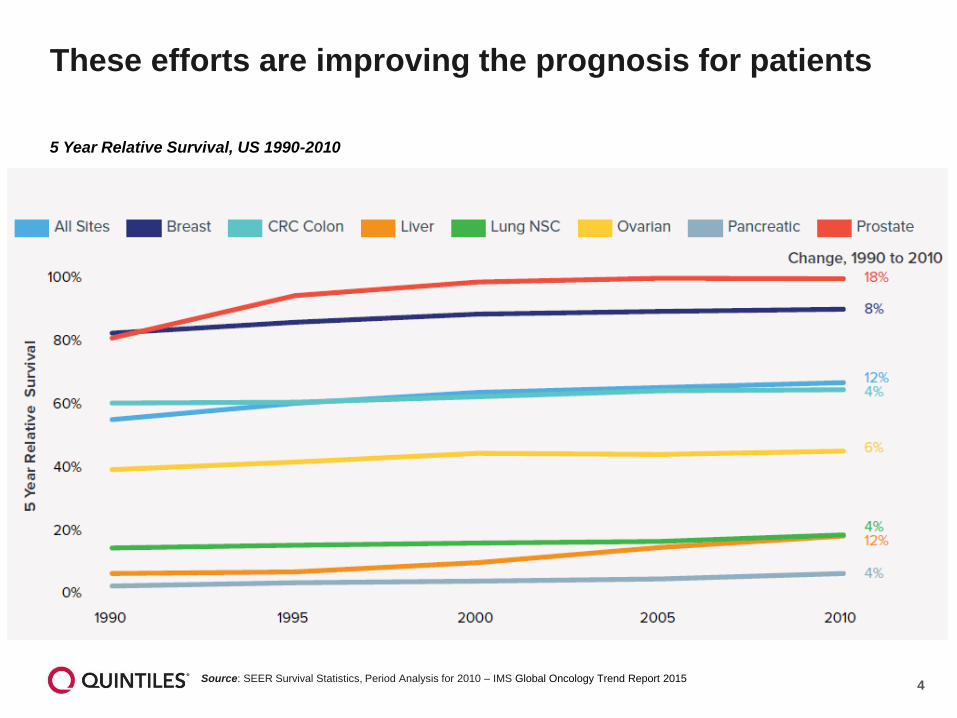
These efforts are improving the prognosis for patients
5 Year Relative Survival, US 1990-2010
Source: SEER Survival Statistics, Period Analysis for 2010 – IMS Global Oncology Trend Report 2015

5
… but this innovation comes at a price that places a
strain on health care budgets
Worldwide Prescription Drug & OTC Sales, by therapeutic area
79.2
153.1
0
200
400
600
800
1000
1200
2014 2020E
Oncology
Anti-diabetics
Anti-rheumatics
Anti-virals
Vaccines
Bronchodilators
Sensory Organs
Anti-hypertensives
MS therapies
Immunosuppressants
Anti-coagulants
Dermatologicals
Anti-hyperlipidaemics
Anti-fibrinolytics
Anti-bacterials
Other
$ B
illi
on
CAGR
+ 11.6%
781
1,029

6
Especially in the US, cancer drug prices have been
rising steadily
Monthly and median costs of cancer drugs at the time of FDA approval, 1965-2015
Source: Peter B Bach, MD Memorial Sloan-Kettering Cancer Center – Available from:
https://www.mskcc.org/research-areas/programs-centers/health-policy-outcomes/cost-drugs

7
There is a bright spotlight on value

8
Prices have been criticized not only by payers, but also
by oncologists

9
How do we solve for value in cancer care?

10
• No unmet need implies no value unless the aim is to drive cost reduction
How do we define and measure unmet need?
• Improved health outcomes, reduced mortality, reduced cost
What is the consequence of addressing the unmet need?
• Clinically meaningful improvement of outcomes in a defined patient population vs an appropriate comparator
How good is this intervention at addressing the unmet
need ?
• Does uncertainty detract from the valueHow good is our evidence of this?
• Does the value of this improved performance match the increased cost? (product price less cost offsets)
• Different health systems take different approaches to value
How do we value the improved
outcomes?
• How does the value translate into price?$
The Value Cascade

11
Value-based assessment frameworks have emerged as
a means to appraise oncology products to control costs
US based Frameworks
EU based Frameworks
ASCO framework to
assess the value of cancer
treatment optionsNCCN Evidence Blocks
Value-based pricing
calculations based on 6
modifiable components using
web-based tool DrugAbacus
Combines a long-term
perspective on value
through CE analyses with
short-term affordability
considerations
The European Society for Medical
Oncology Magnitude of Clinical
Benefit Scale ESMO-MCBS
NHS Cancer Drug Fund
(UK)
NVMO PASKWIL Criteria
(Netherlands)

12
12
InHealth
Historical Evolution of Drug Evaluation in the US
1970 1980 1990 2000
Congress
establishes Office of
Technology
Assessment (OTA)
1972Congress
budget decision
closes OTA
1995
OTA Health
Policy staff
focuses on need
for HTA
RAND call for health
quality measures and
clinical effectiveness
guidelines
Oregon EPC
formed
1997
Network of 14 states
form DERP
AHRQ (Agency
for Healthcare
Research and
Quality)
established
1989
AHRQ Evidence-
based Practice
Centers (EPCs)
established
1997
John M. Eisenberg
Center established
2005
Tech.
Assess-
ment
group
1990
DEcIDE
1992
2003Blue Cross Blue Shield
Association establishes
Technology Evaluation
Center (BCBSA TEC)
1985
Named AHRQ EPC
1997
Kaiser
Permanente
collaboration
1993
1985
1997
Begins HTA; WHO Collaboration
Center
1982
Named AHRQ EPCECRI Institute
established
1968
Designated
CMS advisor
2003
HTAIS HTA database
1993
ICSI
1993
Hayes
Inc.
19942003
Consumer Reports
Best Buy Drugs
2004
United
Biosource
VA TAP
Source: US Federation Scientists OTA Archive; Agency websites; Company
websites; NPC report “Current Evidence Based Medicine Landscape
Government
Select Evidence Based Practice Center (EPC)
Select Private

13
Other countries struggle to determine how to value drugs
• UK undertook a process to
redefine drug price methodology
for PPRS
• VBP (Pricing)
• Renamed VBA (Assessment)
• Initiative failed last year due to
debate over how to measure value
• Issues over differential value for
different people
• Arbitrary “multiplier” for Burden of
Illness and Wider Social Impacts
not justifiable according to critics

14
Value framework implicaitons for drug manufacturers
Clinical Trial Design
• Certain outcomes
(e.g., OS) are
valued more
highly than others
(e.g., Response
Rate)
• NCCN and
DrugAbacus have
metrics for data
quality and
consistency
(multiple trials are
preferred over one
larger trial)
Payer Access
• Major payers (e.g.,
Aetna) have
acknowledged the
potential utility of
value-based
frameworks for
coverage decisions
• Power shifts to
Pharmacy Benefits
Managers and
Accountable Care
Organizations have
placed a premium
on specialty drug
value
Pricing Strategy
• Preliminary and
interim clinical
data will indicate
outputs from
value-based
frameworks
• Increased
scrutiny on drug
prices may lead
to the use of
value-based
frameworks as
guideposts for
drug costs
Provider Usage
• Oncologists have
expressed
discomfort with
discussing the
cost or value of
treatments with
patients
• Providers will rely
on manufacturers
to contextualize
value outputs in
a way that is
useful for patients

15
The healthcare system is moving from volume to value
…. to outcomes.

16
The Healthcare System is migrating from volume to
value … to outcomes (V2O)
Payer & HTA
• Balance of quality and
cost
• Evidence-based care
• Provision of appropriate
care to appropriate
populations
• Balancing care across
the population
Policymaker
• Balance of quality and cost
• Societal considerations
• Health system statutes
and guidelines
Rx & Dx
Manufacturer
• Incentives to develop
evidence
• Reimbursement
commensurate
with value
• Return on investment
• Reward for innovation
Provider & Hospital
• Provision of appropriate care
• Provision of reimbursed
services
• Financial efficiency & viability
• Managing with a budget
Laboratory
• Better, faster, cheaper
• Staff resource requirements and
turn around
• Managing with a budget
Patient
• Need to maintain health
• Benefit/risk tradeoffs
• Affordability of care
V2O
Healthcare
System

17
Market / Patient
AccessDrug/Device
Candidates
Industry Regulators Payers Physicians Patients
• Evaluate evidence
• Advance science
• Improve care
• Ensure continued reimbursement
• Generate publications
• Improve patient outcomes
• Prove value
• Secure coverage and reimbursement
• Enhance understandingof unmet patient needs
• Explore new indications
• Delineate risk-benefit profile
• Detect safety signals
• Ensure long-term safety and effectiveness
• Appraise value for coverage and reimbursement decisions
• Monitor usage within criteria
• Evaluate comparative- and cost-effectiveness
• My own health—what choicesdo I have?
• What are the risks/benefits?
• Which treatmentwill improve my quality of life?
• Which treatmentis safer, more convenient and affordable?
Different stakeholders have various views on risks,
benefits and value

18
Risk-benefit analysis is also becoming personal
PERSONALIZATION
OF CAREMINDING THE
(SYSTEM) GAPS
RISING TIDE OF
CONSUMERISMDEMOCRATIZATION
OF CARE

19
How do we integrate RWE in cancer drug development
development?

20
Launch Pricing
Review
New
Competition
New
Formulation/
Indication
Competitor
Goes Generic
Development Growth Phase Mature Phase
Understand
standard of care
Trial design
Patient recruitment
Unmet need/
disease burden
Budget Impact
Post marketing
commitments
(safety, etc)
Adherence
Utilization/
prescribing
patterns
Long-term
clinical
outcomes
Head to head
comparative
effectiveness
Differentiation in sub-
populations
Target populations Differentiate with or vs.
protected formulation
Effect of switching
on outcomes
Usage
Difference
Evidence
Required
Now Past
Source: Ref. modified from EMA Adaptive Pathways Pilot Presentation at STAMP
http://www.ema.europa.eu/docs/en_GB/document_library/Presentation/2015/11/WC500196727.pdf
Real-world evidence plays an increasing role across the
product lifecycle
Incorporate real-world data needs earlier in the R&D process
- Confidential -

21
RWE can be generated through a variety of study
designs
Retrospective Research
Enriched Retrospective
Observational Prospective
Studies
Enriched Prospective
Studies
Pragmatic
RCTs
Evidence Development Options
Disease registries established
early to investigate real-world
practice patterns and outcomes
RWE databases evaluated to
characterize treatment patterns and
clinical disease patterns; also useful
for informing prospective study
design features
Enriched studies
designed with
experimental and
observational elements
to track real-time risk-
benefit and spawn
further research
Minimally
interventional
trials designed to
include more
representative
populations,
comparators and
endpoints
predicted for
product use
Enriched retrospective studies
conducted to strengthen
secondary data analyses with
information from patients and
clinicians

22
PragmaticDatabase & Hybrid Registries
Changing real world research evidentiary landscape
Explanatory trials (RCT)
Pragmatic Ph IV trials
• High external validity
• Large sample size
• Simple design
• Diverse settings
• Real world late
phase operations • High internal validity
• Smaller sample size
• Sophisticated design
• Controlled environment
Cost/Time Sensitive Approaches

23
PreclinicalClinical Development
Phase I Phase II Phase III
Regulatory
Submission
Real World & Late Phase Research Services
Product Development Services
PRODUCT DECISION
Evidence for Regulators, Providers, Payers, Patients
BioPharma PayersRegulators Providers Patients
Phase IIIB/IV
Healthcare Delivery
REIMBURSEMENT
APPROVAL
Early evidence for better outcomes
Engage Early

24
Reduce Costs
Effic
iency
Effectiveness
Eco
no
mic
s
Equity
System Levers
Healthcare System Goals
What
SuccessLooks
Like
Improve
Population
Outcomes
Enhance
Patient
Experience