Value Innovation: from Value Chain to Revenue Management
53
1 Value Innovation: from Value Chain to Revenue Management Jason C.H. Chen, Ph.D. Professor and Coordinator of MIS Graduate School of Business, Gonzaga University Spokane, WA 99258 USA [email protected]
-
Upload
lydia-serrano -
Category
Documents
-
view
30 -
download
0
description
Value Innovation: from Value Chain to Revenue Management. Jason C.H. Chen , Ph.D. Professor and Coordinator of MIS Graduate School of Business, Gonzaga University Spokane, WA 99258 USA [email protected]. Outline of the Topic. Stages of E-Business - PowerPoint PPT Presentation
Transcript of Value Innovation: from Value Chain to Revenue Management

1
Value Innovation: from Value Chain to Revenue Management
Jason C.H. Chen, Ph.D.
Professor and Coordinator of MIS
Graduate School of Business, Gonzaga University
Spokane, WA 99258 USA

2
Outline of the Topic
• Stages of E-Business• Internet Impact on Economy and Industry• Value Creation
– Business Models and Value Chain– Applications
• Revenue Management– Models and Applications
• Conclusion
3
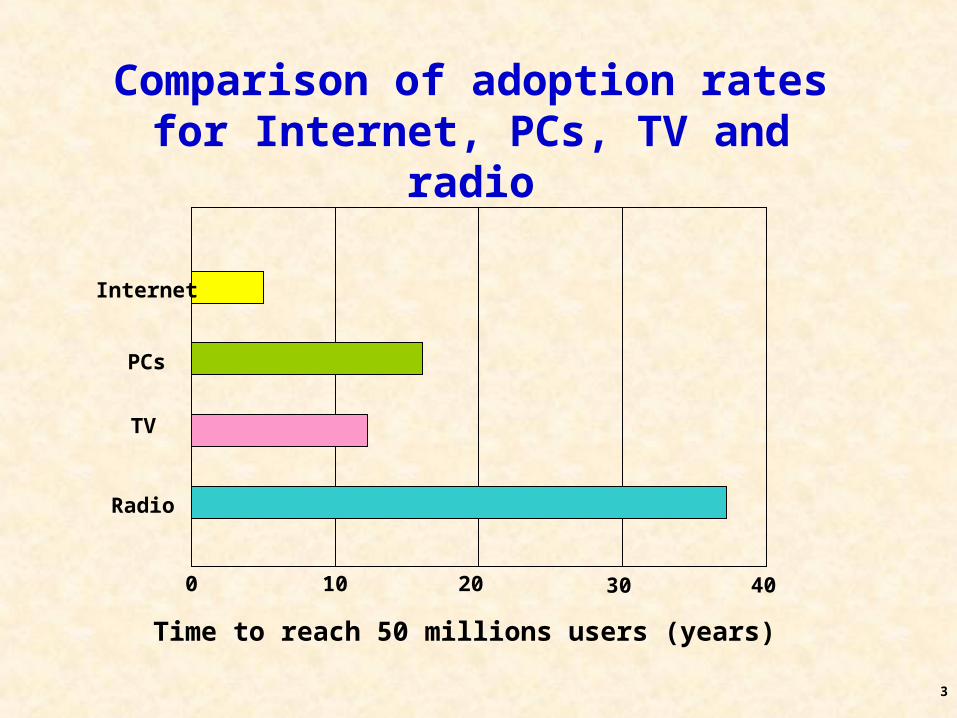
Comparison of adoption rates for Internet, PCs, TV and
radio
Internet
PCs
TV
Radio
0 10 20 30 40
Time to reach 50 millions users (years)

4
““commerce +”commerce +” “e“e--commerce” commerce” “e“e--business”business”
Stage 1Stage 1 Stage 2Stage 2 Stage 3Stage 3 Stage 4Stage 4
AnxietyAnxietyGapGap
2 - 3 years 2 - 4 years
Web presence
• Develop presence• Develop technology
capability
Organizational Organizational Capabilities GapCapabilities Gap
Accessinformation
Transactbusiness
• Re-orientate business/technologythinking skills
• Build integrated approach = web+ business systems
Value Value Transformation GapTransformation Gap
Further integration ofskills, processes,
technologies
• Reorganize people/structures• Reengineer processes• Remodel technology
infrastructure
Capability, leveragingexperience and know-how
to maximise value
• Customer-focused organization• Content-centric services/products• ‘The new marketing’
BUSINESSVALUE
Stages of Moving to E-Business
Wilcocks, Sauer and Associates (2000)
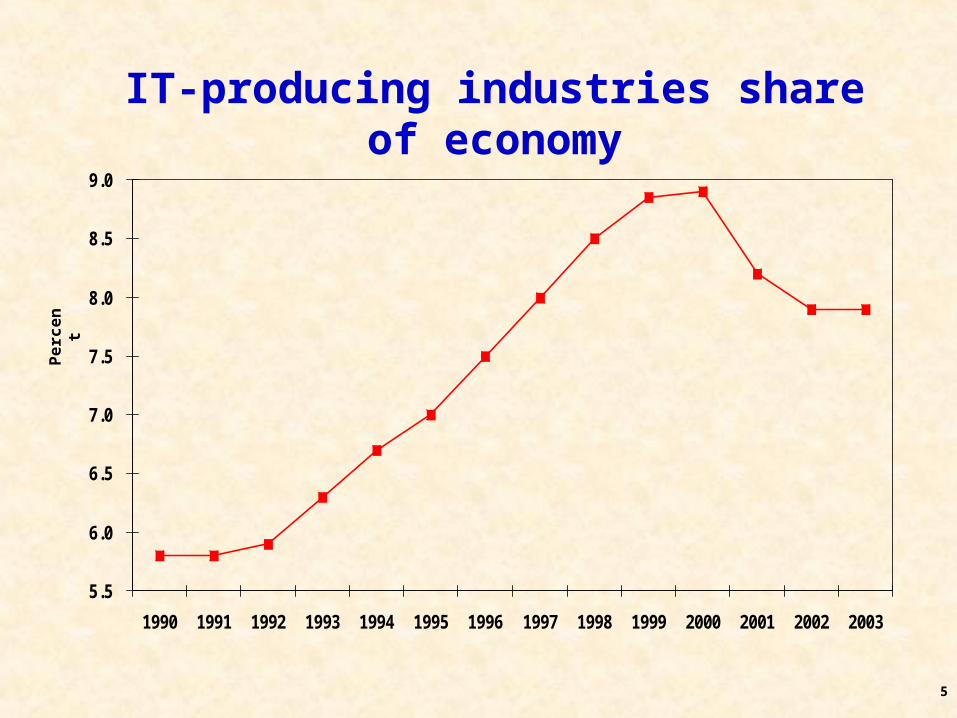
5
5.5
6.0
6.5
7.0
7.5
8.0
8.5
9.0
1990 1991 1992 1993 1994 1995 1996 1997 1998 1999 2000 2001 2002 2003
Pe
rce
nt
IT-producing industries share of economy

6
Distribution of Internet Users Worldwide
# Country or region Population(est. 2003)
Internet users,Latest date
Growth(2000-2003) (%)
Population(penetration) (%)
Users(%)
1.USA2.China3.Japan4.Germany5.UK6.South Korea7.France8.Italy9.Canada10.India11.Brazil12.Spain13.Australia14.Taiwan15.Netherlands16.Malaysia17.Sweden18.Russia19.Turkey20.Thailand21.Mexico22.Hong Kong23.Switzerland24.Argentina25.IndonesiaTop 25 in usersNet 208 countriesTotal world (users)
291,639,9001,311,863,500127,708,00081,904,10059,040,30046,852,30059,303,80056,209,90031,720,4001-067,421,100179,712,50041,547,40019,978,10023,614,20016,258,30024,014,2008,872,600141,364,20073,197,20063,393,600101,457,2006,827,0007,376,00036,993,000217,825,4004,096,094,2002,259,449,6106,355,543,810
184,447,98768,000,00059,203,89644,139,07134,387,24626,270,00022,039,40119,250,00016,841,81116,580,00014,322,36713,986,72412,823,84811,602,52310,351,0647,800,0006,726,8086,000,0004,900,0004,800,0004,663,4004,571,9364,319,2894,100,0004,000,000 606,127,39276,292,120682,419,512
93.4202.225.883.9123.338159.345.832.6231.6186.4159.694.385.3165.4110.866.293.5145108.771.9100.3102.46410091.472.389.1
63.25.246.453.958.256.137.234.253.11.6833.764.249.163.732.575.84.26.77.64.66758.611.11.814.83.410.7
27108.76.553.83.22.82.52.42.121.91.71.51.110.90.70.70.70.70.60.60.688.811.2100.0
7
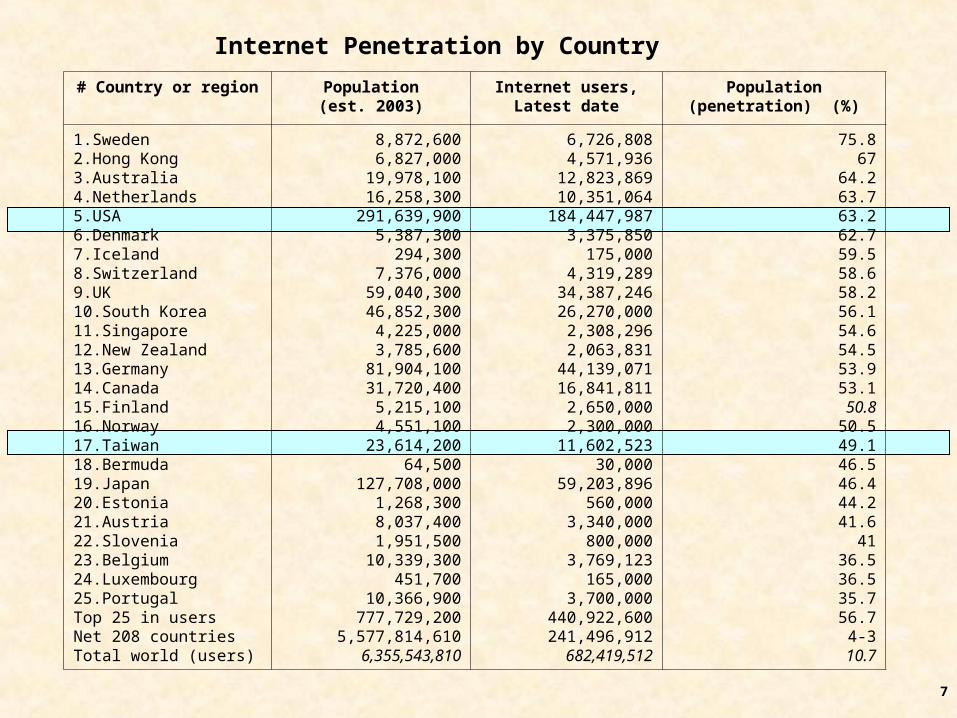
# Country or region Population(est. 2003)
Internet users,Latest date
Population(penetration) (%)
1.Sweden2.Hong Kong3.Australia4.Netherlands5.USA6.Denmark7.Iceland8.Switzerland9.UK10.South Korea11.Singapore12.New Zealand13.Germany14.Canada15.Finland16.Norway17.Taiwan18.Bermuda19.Japan20.Estonia21.Austria22.Slovenia23.Belgium24.Luxembourg25.PortugalTop 25 in usersNet 208 countriesTotal world (users)
8,872,6006,827,000
19,978,10016,258,300
291,639,9005,387,300
294,3007,376,000
59,040,30046,852,300
4,225,0003,785,600
81,904,10031,720,400
5,215,1004,551,100
23,614,20064,500
127,708,0001,268,3008,037,4001,951,500
10,339,300451,700
10,366,900777,729,200
5,577,814,6106,355,543,810
6,726,8084,571,936
12,823,86910,351,064
184,447,9873,375,850
175,0004,319,289
34,387,24626,270,000
2,308,2962,063,831
44,139,07116,841,811
2,650,0002,300,000
11,602,52330,000
59,203,896560,000
3,340,000800,000
3,769,123165,000
3,700,000440,922,600241,496,912682,419,512
75.867
64.263.763.262.759.558.658.256.154.654.553.953.150.850.549.146.546.444.241.6
4136.536.535.756.74-3
10.7
Internet Penetration by Country

8
Distribution of users by language. Online language populations (total 680,000,000
as of September, 2003)
Other
Dutch 1.8%Russian 2.5%
Portuguese 2.6%
Italian 3.3%
French 3.7%
Korean 4.0%
German 7.0%
Spanish8.0%
J apanese
9.5%
Chinese
12.2%
English
35.6%

9
0.0
5.0
10.0
15.0
20.0
25.0
30.0
35.0
40.0
45.0
50.0
Impact of e-commerce on selected industries: manufacturing
(based on figures from US Census Bureau)

10
0.0
5.0
10.0
15.0
20.0
25.0
30.0
35.0
40.0
45.0
50.0
Impact of e-commerce on selected industries: wholesale
(based on figures from US Census Bureau)

11
0.0
5.0
10.0
15.0
20.0
25.0
30.0
Impact of e-commerce on selected industries: services
(based on figures from US Census Bureau)

12
Source: Compustat. Grant explored ROEs for these industries for the years 1985-1997: R. M. Grant, Contemporary Strategy Analysis: Concepts, Techniques, Applications (Oxford, U. K.: Blackwell, 2002) p. 68.
Industry Profitability, 1981-2001
Industry ROE ROA1. Pharmaceuticals 25.87% 10.27%2. Chemicals and allied products 21.70 7.883. Food and kindred products 24.78 7.254. Printing and publishing 16.30 6.685. Rubber and miscellaneous plastic 15.07 6.256. Fabricated metal products 19.00 5.587. Paper and allied products 13.77 4.708. Electronics and electrical equipment (no computers) 9.63 4.679. Nonferrous metals 10.39 4.23
10. Machinery, except electrical 15.69 3.8011. Petroleum and coal products 13.25 3.7612. Textile mill products 5.11 3.7113. Aircraft, guided missiles, and parts 14.02 3.5714. Stone, clay, and glass products 9.16 3.4415. Motor vehicles and equipment 11.91 3.1616. Iron and steel 6.40 3.1417. Airlines (transportation by air) 2.68 2.05

13
Firm Profitability, 1981-2001
Source: Compustat
Firm ROA Firm ROA
Pharmaceuticals Airlines
Bristol Myers Squibb 13.71% Southwest Airlines 4.85%
Merck 13.37 AMR 1.51
Schering Plough 12.89 Delta Airlines 1.50
WYETH American Home Products 12.52 UAL 0.96
Eli Lilly 10.23 US Air 0.31
Pfizer 9.66 America West Holdings -3.27
Pharmacia & Upjohn 7.98 Continental Airlines -4.97
American Cyanamid 3.57 TWA -5.37
Northwest Airlines -3.40

14
Determinants of Profitability
WHY?

15
Four Elements for a Successful Enterprise
•
•
•
•

16
Cooperating to Create Value
Revenue
Competitive forces (coopetitors)
-Suppliers-Customers-Rivalry-Threat of Entry-Substitutes-Complementors
Firm’s Decisions1. 2.
(influence)

17
Why New Models?
• We need some new models– for how we go about exploring IT for
competitive advantage, – for IT infrastructure how we create it and
manage it– for how we acquire, manage and deploy the
skills that are needed to run that infrastructure – __________________

18
Business Model Revenue Model
Value ________ Value _________
It describes the way in which a company enables transactions that create value for all participants, including partners, suppliers and customers.
It can be realized through a combination of - subscription fees, - advertising fees, - transactional income (e.g., fixed transactional fees, referral fees, fixed/variable commissions, etc)
Business vs. Revenue Model

19
Striving for Competitive Advantage
• Firm level: Industry & Competitive Analysis– Competitive Forces Model– Competitive Strategy– __________________________ (New 7Ss)
• Business level – __________________ Analysis
20
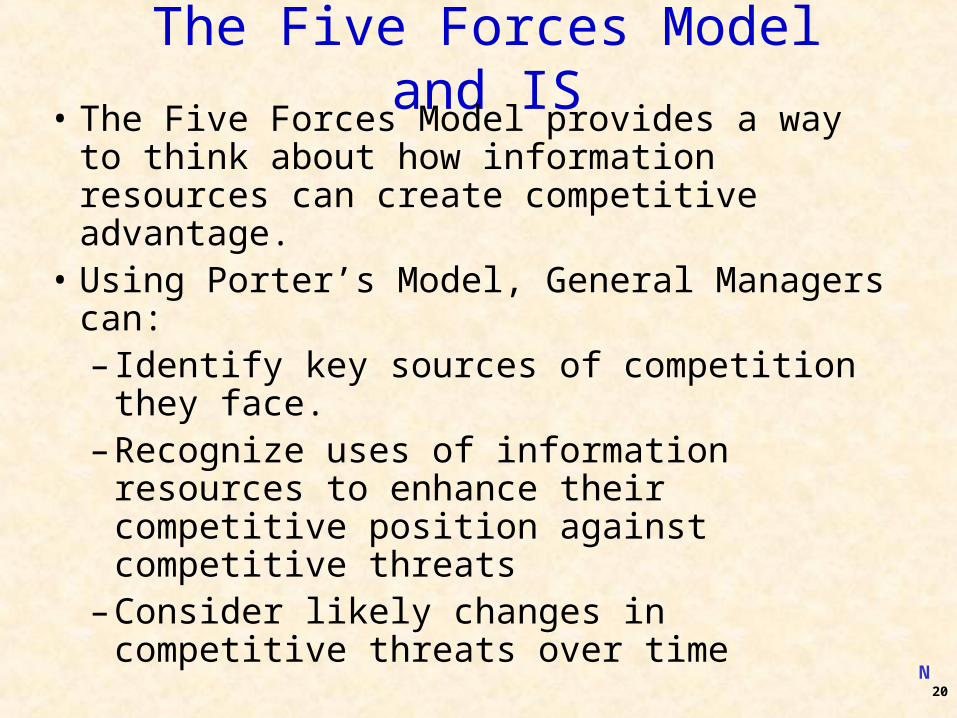
The Five Forces Model and IS• The Five Forces Model provides a way to think
about how information resources can create competitive advantage.
• Using Porter’s Model, General Managers can:– Identify key sources of competition they
face.– Recognize uses of information resources to
enhance their competitive position against competitive threats
– Consider likely changes in competitive threats over time
N
21
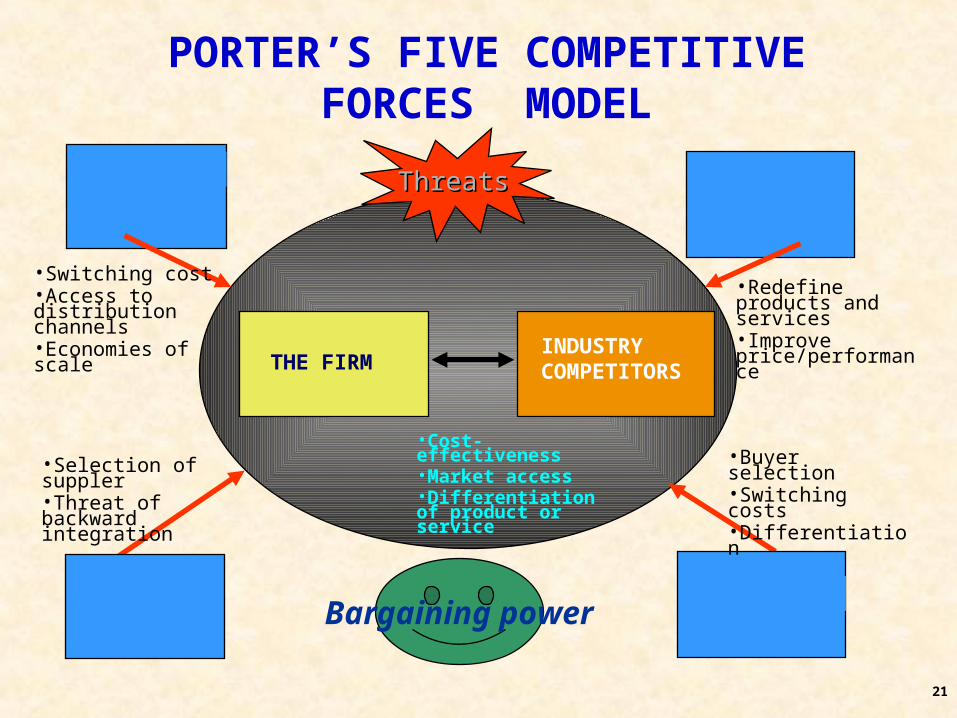
PORTER’S FIVE COMPETITIVE FORCES MODEL
THE FIRMINDUSTRY COMPETITORS
ThreatsThreats
Bargaining power
•Switching cost •Access to distribution channels•Economies of scale
•Redefine products and services•Improve price/performance
•Selection of suppler•Threat of backward integration
•Buyer selection•Switching costs•Differentiation
•Cost-effectiveness•Market access•Differentiation of product or service
22
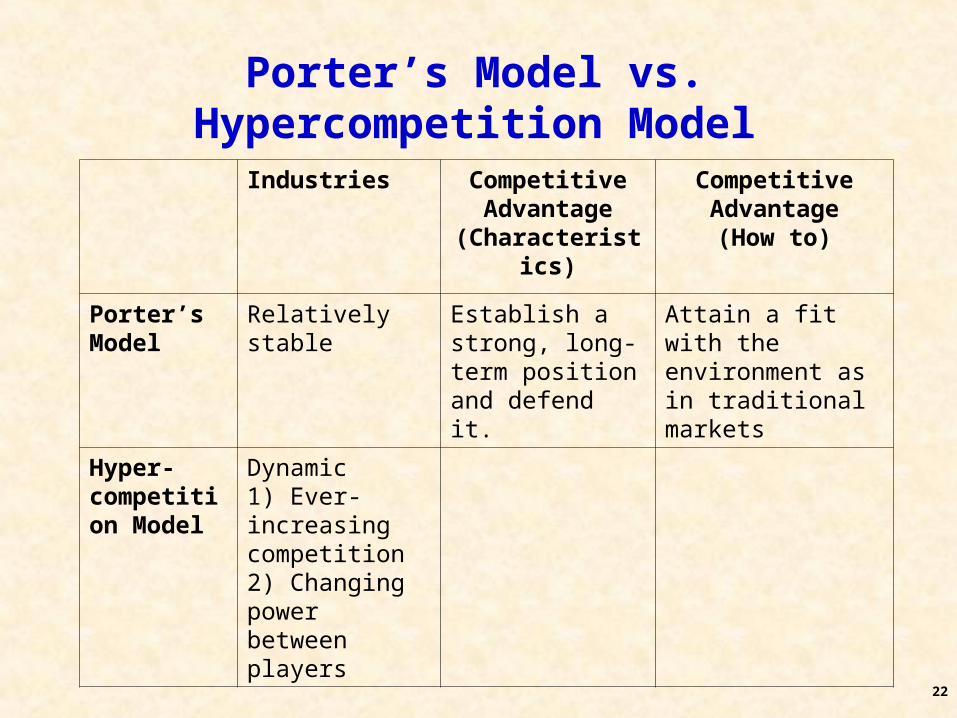
Industries Competitive Advantage
(Characteristics)
Competitive Advantage(How to)
Porter’s Model
Relatively stable Establish a strong, long-term position and defend it.
Attain a fit with the environment as in traditional markets
Hyper-competition Model
Dynamic1) Ever-increasing competition2) Changing power between players
Porter’s Model vs. Hypercompetition Model

23
Porter’s Generic Strategy Framework – 3 Strategies for achieving Competitive Advantage
Competitive Mechanism
Overall Cost Leadership
Focus
DifferentiationIndustry-wide (Broad Target)
Particular Segment only
(Narrow Target)C
om
pet
itiv
e S
cop
e
Lower CostPosition
Uniqueness Perceived by
Customer
Competitive Advantage
24
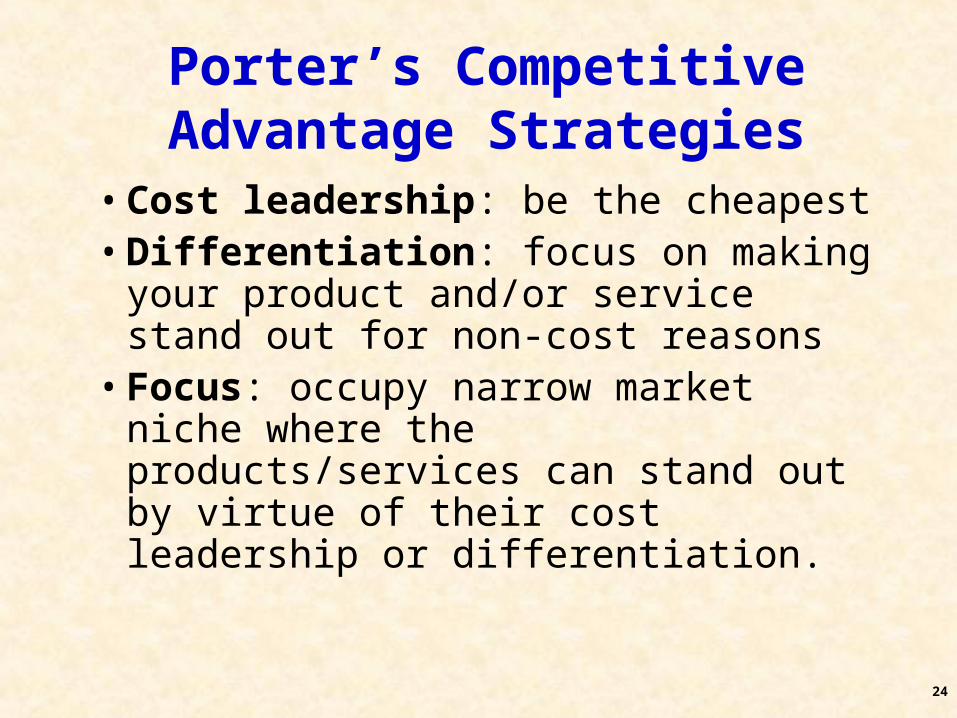
Porter’s Competitive Advantage Strategies
• Cost leadership: be the cheapest• Differentiation: focus on making
your product and/or service stand out for non-cost reasons
• Focus: occupy narrow market niche where the products/services can stand out by virtue of their cost leadership or differentiation.

25
Hypercompetition and the New 7-S’s framework (D’Aveni)
• Every advantage is eroded.• Sustaining an advantage uses too much time
and resources that can be a deadly distraction.
• The goal should be disruption, not sustainability of advantage.
• Initiatives are achieved with a series of small steps.

26
D’Aveni’s Disruption and 7-S’sVision for Disruption
Identifying and creating opportunities fortemporary advantage through understanding• Stakeholder satisfaction• Strategic Soothsayingdirected at identifying new ways to serve existingcustomers better or new customers that are notcurrently served by others
Market Disruption
Capability for DisruptionSustaining momentum by developingflexible capacities for• Speed• SurpriseThat can be applied across actions to Build temporary advantage
Tactics for DisruptionSeizing the initiative to gain advantage by• Shifting the rules• Signaling• Simultaneous and sequential strategic thrustsWith actions that shape, mold, or influencethe direction or nature of the competitor’s response
N
Old 7Ss:structure, strategy, system, style, skills, staff, and super-ordinate goals.

27
Example:• At General Electric, Jack Welch, implemented a
DYB (“Destroy Your Business”) approach by placing employees in the shoes of competitors to highlight weaknesses and find fresh ways of meeting customer needs.
• Similarly GE’s Medical Systems Division used DYB (and GYB strategy) to respond to the challenges posed by the Internet.– Speed,– Stakeholder satisfaction– Strategic Soothsaying– Shifting the rules

28
Industries Competitive Advantage
(Characteristics)
Competitive Advantage(How to)
Porter’s Model
_____________ Establish a strong, long-term position and defend it.
Attain a fit with the environment as in traditional markets
Hyper-competition Model
_____________1) Ever-increasing competition2) Changing power between players
Short-lived, take advantage of any small window of opportunity that arises.
1) change rules of competition2) create disruptions (during which temporary advantages can be exploited)
Porter’s Model vs. Hypercompetition Model

29
Com
petitive
Adv
anta
ge
(Value)
The Value Chain: Process View of the Firm

30
The Value System
• The value chain model can be extended by linking many value chains into a value system.
• Much of the advantage of supply chain management comes from understanding how information is used within each value chain of the system.
• This can lead to the formation of entire new businesses designed to change the information component of value-added activities.

31
The Value System: Interconnecting relationships between organizations
Upstreamvalue
Firmvalue
Downstreamvalue

32
Cost Leadership
Business Strategies and its Competitive Advantage
Cost Focus
Differentiation
Differentiation Focus
Industrywide
(Broad Target)
Particular Segment
only (Narrow Target)
Co
mp
etit
ive
Sco
pe
Competitive Mechanism
Lower CostPosition
Uniqueness Perceived by
Customer
Industrial economy Knowledge-based economy

33
Business Models and Revenue Management
• The framework for making money.
• It is the set of activities which a firm performs, how it performs them, and when it performs them so as to offer its customers benefits they want and to earn a profit.
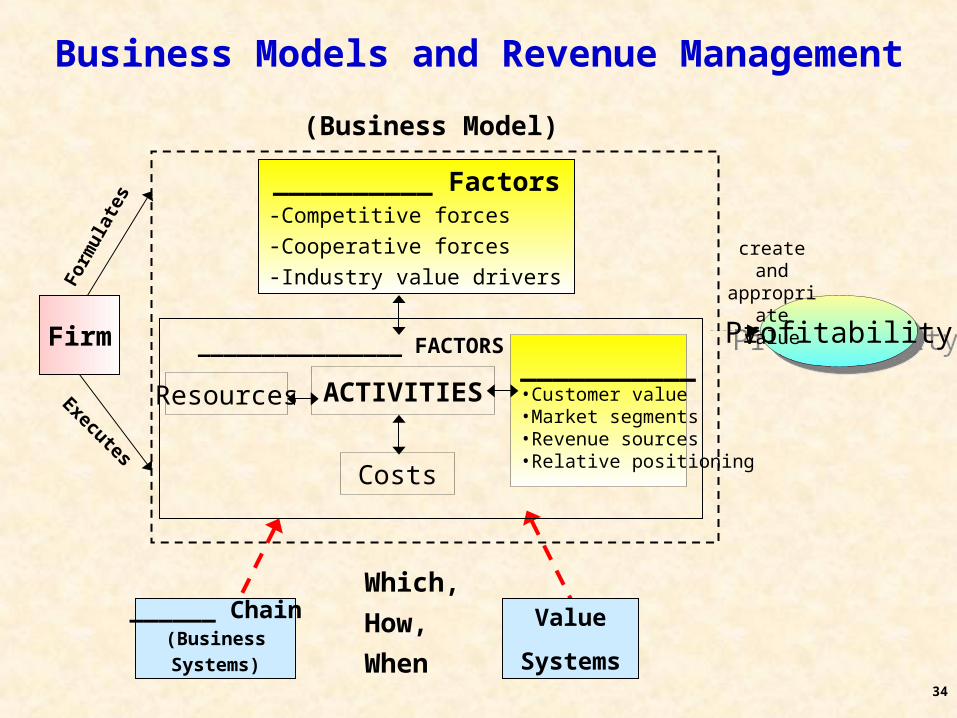
34
Business Models and Revenue Management
__________ Factors-Competitive forces
-Cooperative forces
-Industry value drivers
ProfitabilityProfitability
ACTIVITIES___________•Customer value•Market segments•Revenue sources•Relative positioning
Resources
Costs
create andappropriate
value
Firm
(Business Model)
Form
ulat
es
Executes
Which,
How,
When
______ Chain(Business
Systems)
Value
Systems
________________ FACTORS

35
When to Perform Activities
• Two firms can perform similar activities in similar ways but still end up with business models whose profitabilities are different if the timing of when they perform the activities is different.– First-mover advantage– Windows of opportunities
• periods within which some activities are best performed
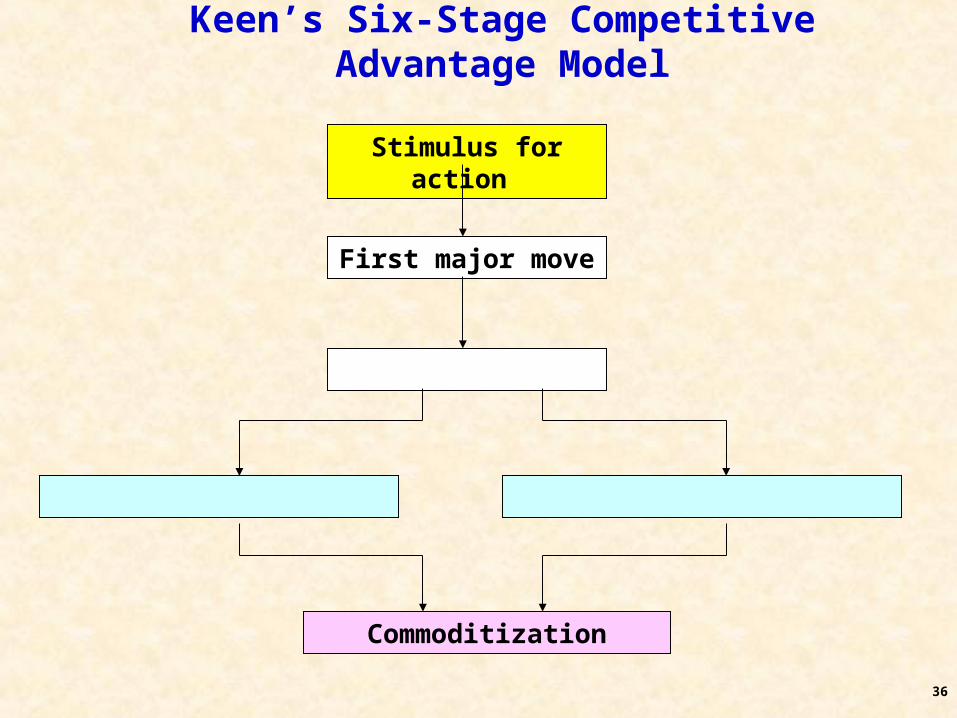
36
Keen’s Six-Stage Competitive Advantage Model
Stimulus for action
Commoditization
First major move

37
-10 -5 0 5 100
50
100
150
200
250
300
Time of market introduction relative to competition (months)
Pro
fits
rel
ativ
e to
co
mp
etit
ion
s (%
)
Relationship between profits and time of market introduction

38
When to Perform Activities
• First Movers
Advantages
• Build brand recognition
• Control scarce resources
• Establish networks
• Early Economies-of-Scale
Disadvantages
• Newer technology
• Higher development costs
• Reverse engineering by competitors

39
Case Example: Wal-Mart• Analysis: Which, How, and When in Wal-
Mart’s Success– Which:
• moved into small towns that its competitors shunned
– How:• Wal-Mart saturated contiguous towns and built
distribution centers and logistics systems
– When:• First mover advantage by capturing scarce
resources, locations, and loyal employees and customers

40
Revenue Management
(a.k.a. yield management)
Expanding or Saving?

41
Revenue Management (RM)
• RM focuses companies on revenue growth, not cost-cutting and downsizing.
• RM drives bottom-line increases through top-line improvements.
• Growth comes from the marketplace, not the workforce.
• The key to real growth is learning how to deal effectively and proactively with a constantly changing markets.

42
Revenue Management (RM) vs. MIS
• MIS is to deliver – the right information, to the right people– at the right time, with the right form
• RM is to sell– the right _______, to the right ______– at the right _____, for the right _____– Thereby maximizing revenue from a
company’s products

43
Examples on Revenue Management
• A No-Tech approach to RM– Barbershop
• A Low-Tech approach to RM– Opera House
• A High-Tech approach to RM– Airlines

44
Other Examples
• ________
• Car rental
• _______
• Broadcasting
• Shipping
• _______
• Etc.
How about your ideas?

45
Some U.S. airline industry observations
• Since deregulation (1978) 137 carriers have filed for bankruptcy.
• From 95-99 (the industry’s best 5 years ever) airlines earned 3.5 cents on each dollar of sales:– The US average for all industries is around 6 cents.– From 90-99 the industry earned 1 cent per $ of sales.
• Carriers typically fill 72.4% of seats and have a break-even load of 70.4%.

46
Matching supply to demand when supply is fixed
• Examples of fixed supply:– Travel industries (fixed number of seats, rooms, cars,
etc).– Advertising time (limited number of time slots).– Telecommunications bandwidth.– Size of the MBA program.– Doctor’s availability for appointments.
• Revenue management is a solution:– If adjusting supply is impossible – adjust the demand!– Segment customers into high willingness to pay and
low willingness to pay.– Limit the number of tickets sold at a low price, i.e.,
control the average price by changing the mix of customers.

47
Revenue management and margin arithmetic
• Small changes in revenue can have a big impact on profit, especially for high gross margin and low net profit % industries:Percentage change in profit for different gross margins, revenue increases and net profits as a
percentage of revenue.
Gross margin 1% 2% 5% 8%
Gross margin 1% 2% 5% 8%
100% 50% 100% 250% 400% 100% 17% 33% 83% 133%90% 45% 90% 225% 360% 90% 15% 30% 75% 120%75% 38% 75% 188% 300% 75% 13% 25% 63% 100%50% 25% 50% 125% 200% 50% 8% 17% 42% 67%25% 13% 25% 63% 100% 25% 4% 8% 21% 33%15% 8% 15% 38% 60% 15% 3% 5% 13% 20%
Revenue increase
Net profit % = 2% Net profit % = 6%
Revenue increase

48
Ugly reality: cancellations and no-shows• Approximately 50% of reservations get cancelled at some
point in time.
• In many cases (car rentals, hotels, full fare airline passengers) there is no penalty for cancellations.
• Problem: – the company may fail to fill the seat (room, car) if the passenger
cancels at the very last minute or does not show up.
• Solution:
– sell more seats (rooms, cars) than capacity.
• Danger:
– some customers may have to be denied a seat even though they have a confirmed reservation.

49
Winners vs. Losers• What separates winners from losers in creating
(ultimate) strategic competitive advantage is neither bleeding-edge technology nor “timing for market entry.”
• It is from “value innovation”
FirmFirmprice
utility
cost
Innovation ValueInnovation
ValueInnovation
align

50
Conclusion
• Value innovation and business models• Revenue management and overbooking give
demand flexibility where supply flexibility is not possible.
• Concept and powerful tools to improve revenue:– American Airlines estimated a benefit of $1.5B over 3
years.– National Car Rental faced liquidation in 1993 but
improved via yield management techniques.– Delta Airlines credits yield management with $300M in
additional revenue annually (about 2% of year 2000 revenue.)

51
The Twenty-first Century will ...
• The twenty-first century will witness only two kinds of companies:– those that – those that

52
Revenue Management
• If you are interested in the issues of RM
• International Journal of Revenue Management
• http://www.inderscience.com/ijrm

53
The Seven Core Concepts ofRevenue Management
1. Focus on price rather than costs when balancing supply and demand.
2. Replace cost-based pricing with market-based pricing.3. Sell to segmented micro markets, not to mass market.4. Save your products for your most valuable customers.5. Make decisions based on knowledge, not supposition.6. Exploit each product’s value circle.7. Continually reevaluate your revenue opportunities.