Value Creation in Mining 2012 Taking the Long …VaLue CreaTion In terms of value creation, the...
36
Taking the Long-Term View in Turbulent Times Value Creation in Mining 2012 Report
Transcript of Value Creation in Mining 2012 Taking the Long …VaLue CreaTion In terms of value creation, the...
Taking the Long-Term View in Turbulent Times
Value Creation in Mining 2012
Report

The Boston Consulting Group (BCG) is a global management consulting firm and the world’s leading advisor on business strategy. We partner with clients from the private, public, and not-for-profit sectors in all regions to identify their highest-value opportunities, address their most critical challenges, and transform their enterprises. Our customized approach combines deep in sight into the dynamics of companies and markets with close collaboration at all levels of the client organization. This ensures that our clients achieve sustainable compet itive advantage, build more capable organizations, and secure lasting results. Founded in 1963, BCG is a private company with 77 offices in 42 countries. For more information, please visit bcg.com.

Value Creation in Mining 2012
Taking The Long-Term View in TurbuLenT Times
GusTavo NiepoNiCe
ThOMas VOGT
TOM KinG
ROss MiddleTOn
ChRisTian Köpp
viCTor sCheiBeheNNe
December 2012 | The Boston Consulting Group

2 | Taking the Long-Term View in Turbulent Times
ConTenTs
3 ExEcutivE Summary
6 a Bonanza DEcaDE for valuE crEationFinding AlphaLessons from the Top TenIn a Two-Speed Decade, the Top Ten Prevail
13 thE outlook for an uncErtain futurE: thrEE mounting riSkS
Market UncertaintyIncreasingly Challenging Economics: Declining Ore Grades and Higher Strip RatiosHeightened Social and Policy Risks
18 riSing to thE challEngELever 1: Revisit and Pressure Test Your Value-Creation StrategyLever 2: Manage Country Risk and Stakeholder RelationsLever 3: Up the Odds of Project Success by Pursuing Project ExcellenceLever 4: Develop an Advantaged Operating System
27 The Long-TeRm View
28 kEy QuEStionS for mining ExEcutivES
30 appEnDix
31 for furthEr rEaDing
32 notE to thE rEaDEr
The Boston Consulting Group | 3
This report is the culmination of several months of analysis, research, and compilation of best practices and new ways of
thinking about managing a mining company. the insights and lessons it contains are drawn from the Boston consulting group’s extensive research and work with leading companies around the globe, both within and outside the mining industry.
the value creation in mining series is an offshoot of Bcg’s annual value creators report, an analysis of the world’s top value creators across a range of industries. this year’s report examines the perfor-mance of 34 leading mining companies over the ten-year period 2001 to 2011. it analyzes the primary drivers of performance, looking in particular at the top ten value creators and how they achieved their extraordinary results.
The mining sector delivered significant shareholder value from 2001 to 2011—a decade hit hard by the global financial crisis. Continued economic expansion in emerging markets (and the re-sulting rise in commodity prices) helped fuel total shareholder return, along with growth in production and margins.
over the decade, the sector averaged an annual tSr of 18 per- •cent—15 percentage points more than the S&p 500. revenue increases due to rising commodity prices accounted for nearly 14 percentage points of the total 18 percent.
the remaining 4 percentage points of tSr were derived from •production increases (5 percentage points), margin expansion (6 points), and contributions from cash flow (1 point), all of which were offset by declining investor expectations (–8 points).
The top ten industry performers achieved an average annual TSR of 39 percent, more than double that of our industry sample. We attribute their performance to three factors.
exeCuTiVe summary

4 | Taking the Long-Term View in Turbulent Times
Excellent Capital Stewardship. • The top ten companies deftly man-aged their capital expenditures and thus were able to optimize cash flows and streamline their use of debt and equity issuance.
Robust Organic Growth. • Strong organic growth yielded rapid increases in profitability for the top ten compared with their peers.
A Strong, Credible Outlook for Value Creation. • a successful track record and strong value-creation outlook kept the valuation multiples of the top ten healthy during the decade, in contrast to their industry peers.
Although average TSR performance was impressive throughout the decade, there were two distinct periods of value creation.
most of the value was generated during the first five-year period •(2001–2006).
During the second half of the decade (2007–2011), mining compa- •nies were hurt by slowing revenue growth, persistent cost pres-sures, a slackening of capital discipline, and diminishing investor expectations that eroded valuation multiples. the top ten, how-ever, were able to continue creating value throughout this period.
The coming years promise continued uncertainty and volatility. Three major risks loom large for mining companies.
There is persistent uncertainty in the financial and capital mar- •kets, as well as in the customer market.
the economics are increasingly challenging due to a combination •of declining ore quality and the need to dig deeper and mine farther afield.
Social and policy risks are growing. these risks underscore the •importance of planning for a range of scenarios and boosting organizational agility and adaptiveness as scenarios change.
We have identified four levers that companies will need to apply in order to continue creating value amid prolonged uncertainty. Although each one is undoubtedly familiar to mining executives, it is essential to consider them holistically as part of a multidisci-plinary effort. In this way, companies can truly achieve bottom-line impact and enduring competitive advantage.
Revisit and pressure test the value creation strategy. • getting capital allocation and portfolio management right is critical. to create long-term value, mining executives need to balance their business, financial, and investor strategies.
Manage country risk and stakeholder relations. • Early-stage, proactive, and ongoing stakeholder management and community develop-ment are increasingly necessary to developing, operating, and sustaining mine sites. Success requires new approaches, new skills,

The Boston Consulting Group | 5
and new types of talent beyond those that served the industry well during past challenges.
Up the odds of project success. • project execution has grown more complex, and megaprojects have become the norm rather than the exception. By focusing on project excellence, companies can achieve desired outcomes while containing capital expenditures—and, in turn, profitably expand production and maintain credibility with investors.
Develop an advantaged operating system. • operating margins remain under pressure owing to uncertain demand, rising costs, ever-harsher economics, and declining labor productivity. companies can counteract these impacts by leveraging untapped opportuni-ties in existing assets, exploring next-generation mining techniques such as automation, and building a strong talent pipeline.

6 | Taking the Long View in Turbulent Times
a bonanza DeCaDe for VaLue CreaTion
In terms of value creation, the decade 2001 to 2011 was a bonanza for the mining
industry. consider the record of 34 of the industry’s largest companies.1 During this decade, average annual total shareholder return for these companies was 18 per-cent—15 percentage points more than the S&p 500.2 (See the sidebar “the components
of tSr” and Exhibit 1.) Even the lowest performers on the list proved to be respect-able investments. given that the second half of the decade was overshadowed by the global financial crisis—a crisis that earned the decade the distinction of being a “lost decade” for investing—such overall perfor-mance is remarkable.
First quartile
Second quartile
Third quartile
Fourth quartile
60Average annual TSR, 2001–2011 (%)
705040302010018%
Mining companies have generated an average annual TSRof 18 percent over the last ten years
Industry-sample average
TSR rank
3%S&P 500
Sources: Thomson Reuters datastream; Thomson Reuters Worldscope; Bloomberg; annual reports; BCG analysis.Note: TsR derived from calendar-year data and weighted by market capitalization.
Exhibit 1 | Mining Created Substantial Value Over the Decade 2001–2011

The Boston Consulting Group | 7
the mining industry clearly benefited from the continued economic expansion in emerg-ing markets, which led to steadily rising com-modity prices. value creation was also fueled by production growth, margin expansion, and cash returned to equity holders. Using BCg’s tSr disaggregation methodology, we ana-lyzed the factors that drove the impressive performance of the industry. (See Exhibit 2.) revenue increases due to rising commodity prices accounted for nearly 14 of the total 18 percentage points of tSr. the other factors driving tSr—those resulting from deliberate action—were production gains (which deliv-
ered 5 percentage points of tSr); margin ex-pansion (6 points); and contributions from cash flow (1 point). Declining investor expec-tations, as reflected in the drop in the enter-prise value to EBitDa multiple, offset these increases by 8 points.
finding alphaEven more spectacular than the industry’s overall 18 percent tSr was the performance of its top-ten value creators—a mix of rapidly growing midtier developers (such as first Quantum minerals and randgold resources)
Total shareholder return is the product of multiple factors. Regular readers of the BCG Value Creators report will be familiar with BCG’s methodology for quantifying the relative contribution of the various sources of TSR. (See the exhibit below.) The methodology uses the combination of revenue (that is, sales) growth and change in margins as an indicator of a company’s improvement in fundamental value. It then uses the change in the company’s valua-tion multiple to determine the impact of investor expectations on TSR. Together, these two factors determine the change in a company’s market capitalization. Finally, the model also tracks the distribution of free cash flow to investors and debt holders in the form of dividends, share repurchases,
or repayments of debt in order to deter-mine the contribution of free-cash-flow payouts to a company’s TSR.
The important thing to remember is that these factors all interact, sometimes in unexpected ways. A company may grow its earnings per share through an acquisition and yet not create any TSR, because the new acquisition has the effect of eroding the company’s gross margins. And some forms of cash contribution (for example, dividends) have a more positive impact on a company’s valuation multiple than others (for example, share buybacks). Because of these interactions, we recommend that companies take a holistic approach to value creation strategy.
THE COMPOnEnTS OF TSR
Source: BCG analysis.Note: “share change” refers to the change in the number of shares outstanding, not to the change in share price.
TSR Is the Product of Multiple Factors
Capital gain
Revenue growth
Margin change
TSR
Valuation multiple change
Dividend yield
Cash flowcontribution
Net debt change
Profit growth
Share change
x
x
ƒ

8 | Taking the Long-Term View in Turbulent Times
and established global producers (including antofagasta and cliffs natural resources). (See Exhibit 3.) these companies generated an aver-age tSr of approximately 39 percent per year—more than twice that of the total sample.
in every dimension—from profit growth to cash flow contributions to multiple expan-sion—the top ten mining companies outper-
formed the rest of the sample. (See Exhibit 4.) Even more impressive was the fact that com-modity exposure had little impact on outper-formance; the top ten included a broad range of mineral producers, from gold and copper to coal and industrial-mineral companies. (for a similar analysis of the largest compa-nies in our sample, see the sidebar “Broader lessons from the large-cap companies.”)
Average annual TSR: 17.7%
Cash flow contribution
–8.4
Fundamental value
Valuation multiple
Multiple change (%)
Gain in marketcapitalization:
16.3%
Cash flowcontribution:
1.4%
Revenue growth (%) Price growth (%) Production growth (%)Margin change (%)Profit growth (%)
18.413.8
4.66.3
24.7
Dividend yield (%)Share change (%)Net debt change (%)
2.6–2.1
0.81.4
Sources: Thomson Reuters datastream; Thomson Reuters Worldscope; Bloomberg; annual reports; BCG analysis.Note: This calculation is based on the sample average; the contribution of each factor is shown in percentage points of average annual TsR from 2001 to 2011. apparent discrepancies in totals are due to rounding.
Exhibit 2 | BCG’s Disaggregation Methodology Identifies the Sources of TSR
Exhibit 3 | The Mining Industry Top Ten, 2001–2011
Rank Company DomicileAverage annual
TSR, 2001–2011 (%)Market value1
($billions)
1 industrias peñoles Mexico 58.2 17.8
2 Grupo México Mexico 49.5 21.6
3 Randgold Resources United Kingdom 45.0 9.4
4 First Quantum Minerals Canada 42.7 9.5
5 inner Mongolia Yitai Coal China 40.2 7.3
6 Cliffs natural Resources United states 40.1 8.9
7 exxaro Resources south africa 39.2 7.5
8 sociedad Química y Minera de Chile (sQM) Chile 36.9 15.1
9 antofagasta United Kingdom 32.4 18.7
10 Yanzhou Coal Mining China 30.1 10.5
Average2 38.5
Sources: Thomson Reuters datastream; Thomson Reuters Worldscope; Bloomberg; annual reports; BCG analysis.Note: The sample comprises 34 global companies with a market valuation greater than $7 billion and a free float of at least 25 percent.1as of december 31, 2011.2Weighted by market capitalization.

The Boston Consulting Group | 9
Annual percentage points of TSR, 2001–201140
30
20
10
0Average TSR,
top ten
38.6
Valuationmultiple change
7.3
Average TSR,total sample
17.7
Profitgrowth
Cash flowcontribution
5.6
8.0
Drivers of TSR outperformance (incremental contribution)
Sources: Thomson Reuters datastream; Thomson Reuters Worldscope; Bloomberg; annual reports; BCG analysis.
Exhibit 4 | The Top Ten Outperformed in All Components of TSR
The lessons derived from the top ten value creators also apply to the largest companies in our sample. Companies whose 2011 market value exceeded $25 billion delivered an aggregate TSR of 16 percent per year from 2001 through 2011—a return close to that of the total 34-company sample.
The best three of these companies, how-ever, outperformed their large-cap peers with an average TSR of 28 percent. They did so using the same approaches characteris-tic of the top ten companies in our overall sample. They enjoyed stronger revenue and margin growth, reduced their debt loads,
paid out heftier dividends, and limited equity dilution. They also resisted the squeeze on multiples that others suffered.
The top three large-cap companies earned their performance premiums in different ways. (See the exhibit below.) MMC norilsk nickel (of Russia) generated the biggest gain in valuation multiple (8.3 percent); Vale (Brazil) enjoyed strong sales growth (25.6 percent); and PotashCorp (Canada) had the greatest margin improvement (11.2 percent). Clearly, the lessons of our study apply to any company, regardless of size.
Broader Lessons from the Large-Cap Companies
Sources: Thomson Reuters datastream; Thomson Reuters Worldscope; Bloomberg; annual reports; BCG analysis.Note: in 2011, ten global companies had a market capitalization greater than $25 billion and a free float of at least 25 percent.1The contribution of each factor is shown as a percentage of the ten-year average annual TsR. any apparent discrepancies in TsR totals are due to rounding.2average annual total shareholder return, 2001–2011.3as of december 31, 2011.4Change in eBiTda.
The Best Large-Cap Companies Created Significant Value Using Different Levers
TSR Disaggregation1
Rank Company LocationTSR2 (%)
Market value3
($billions)
Sales growth
(%)
Margin change
(%)
Multiple change4
(%)
Dividend yield(%)
Share change
(%)
Net debt
change (%)
1 MMC norilsk nickel russia 29.5 30.2 13.1 1.7 8.3 2.9 1.2 2.3
2 vale Brazil 28.2 110.1 25.6 5.3 –6.7 4.4 –1.0 0.6
3 potashCorp Canada 23.6 35.9 15.4 11.2 –6.6 0.9 0.9 1.8
average for the top three large-cap companies
28.0 176.2 21.0 5.3 –2.0 2.8 –0.2 1.1
average for the large-cap sample 16.3 655.1 19.1 5.7 –9.9 2.4 –1.4 0.3

10 | Taking the Long-Term View in Turbulent Times
Lessons from the Top Tenwhat’s behind the top ten’s dramatic out-performance? we have identified three factors.
They were excellent stewards of capital. the top ten managed their capital expenditures and consequent cash flows wisely. The result was evident in their debt management, limited equity dilution, and dividend policies. together, these elements contributed an additional 7 points of tSr for the top ten.
Some of the top ten invested more selectively (or in less capital-intensive projects) than their peers but earned a higher return on capital employed when they did invest. (See Exhibit 5.) this was the case for companies such as antofagasta, industrias peñoles, and grupo méxico.
as a result, in debt management, the top ten stood out dramatically from their industry peers. through skillful cash management and the disciplined use of capital, some top-ten companies were able to reduce their leverage
ratios. randgold, for example, managed to limit its need for additional debt despite hav-ing several projects in development.
The top ten companies man-aged their capex and conse-quent cash flows wisely.
the top ten companies also showed restraint in issuing equity, thus avoiding the dilutive effect of increasing the number of shares out-standing without an accompanying payoff in production growth. equity dilution occurred mostly in the gold sector, where issuances were frequently used to fund projects and acquisitions that ultimately fell short in gen-erating value. finally, the top ten paid higher dividends than the overall sample.
They oversaw robust organic growth. the top ten grew for the most part organically, whereas other companies in the sample
Six of the top ten companies generated highreturns from selective investments
Return on capital employed, 2010
50
40
30
20
10
0Reinvestment intensity,1 2001–2010
140120604020
Industrias Peñoles
GrupoMéxico
Heavy issuers of equity tended to underperform peers2
Annual percentage points of TSR, 2001–2011
20
10
0Light issuers
of equity
19.1
Heavy issuersof equity
14.1
SampleTop ten
Antofagasta
Sources: Thomson Reuters datastream; Thomson Reuters Worldscope; Bloomberg; annual reports; BCG analysis.1Reinvestment intensity is a measure of the ratio of capex to eBiTda over the ten-year period.2heavy/light issuers are those companies whose net equity issuance was greater than/less than average for the sample (n = 17).
Exhibit 5 | High-Performing Companies Were Prudent Users of Both Capex and Equity
The Boston Consulting Group | 11
expanded their production volume largely through mergers and acquisitions. This growth strategy, combined with slightly larger price increases in their product mix, yielded more rapid growth in profitability for the top ten as compared with their peers. in total, these factors contributed 6 percent-age points of tSr outperformance each year.
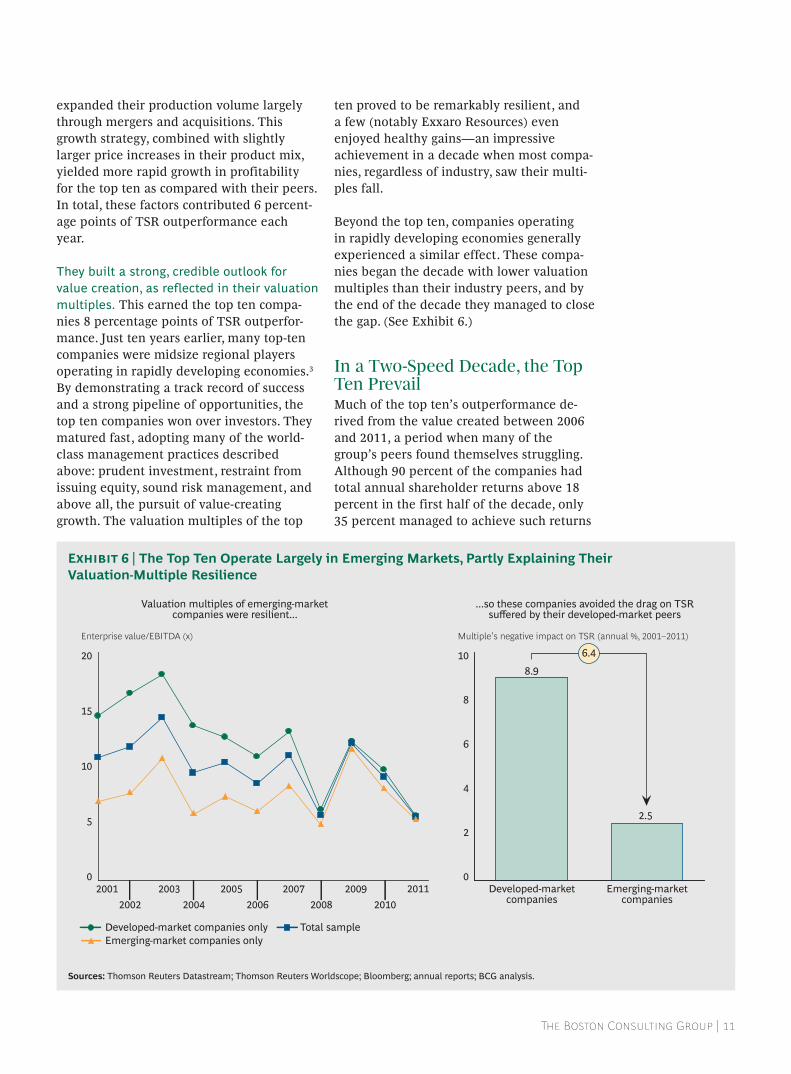
They built a strong, credible outlook for value creation, as reflected in their valuation multiples. this earned the top ten compa-nies 8 percentage points of tSr outperfor-mance. Just ten years earlier, many top-ten companies were midsize regional players operating in rapidly developing economies.3 By demonstrating a track record of success and a strong pipeline of opportunities, the top ten companies won over investors. they matured fast, adopting many of the world-class management practices described above: prudent investment, restraint from issuing equity, sound risk management, and above all, the pursuit of value-creating growth. the valuation multiples of the top
ten proved to be remarkably resilient, and a few (notably Exxaro resources) even enjoyed healthy gains—an impressive achievement in a decade when most compa-nies, regardless of industry, saw their multi-ples fall.
Beyond the top ten, companies operating in rapidly developing economies generally experienced a similar effect. these compa-nies began the decade with lower valuation multiples than their industry peers, and by the end of the decade they managed to close the gap. (See Exhibit 6.)
in a Two-speed Decade, the Top Ten Prevailmuch of the top ten’s outperformance de-rived from the value created between 2006 and 2011, a period when many of the group’s peers found themselves struggling. although 90 percent of the companies had total annual shareholder returns above 18 percent in the first half of the decade, only 35 percent managed to achieve such returns
Enterprise value/EBITDA (x)
20
15
10
5
02011
20102009
20082007
20062005
20042003
20022001 Developed-market
companies
8.9
Multiple’s negative impact on TSR (annual %, 2001–2011)
10
8
6
4
2
0Emerging-market
companies
2.5
Emerging-market companies onlyTotal sampleDeveloped-market companies only
Valuation multiples of emerging-marketcompanies were resilient...
...so these companies avoided the drag on TSRsuffered by their developed-market peers
6.4
Sources: Thomson Reuters datastream; Thomson Reuters Worldscope; Bloomberg; annual reports; BCG analysis.
Exhibit 6 | The Top Ten Operate Largely in Emerging Markets, Partly Explaining Their Valuation-Multiple Resilience
12 | Taking the Long-Term View in Turbulent Times
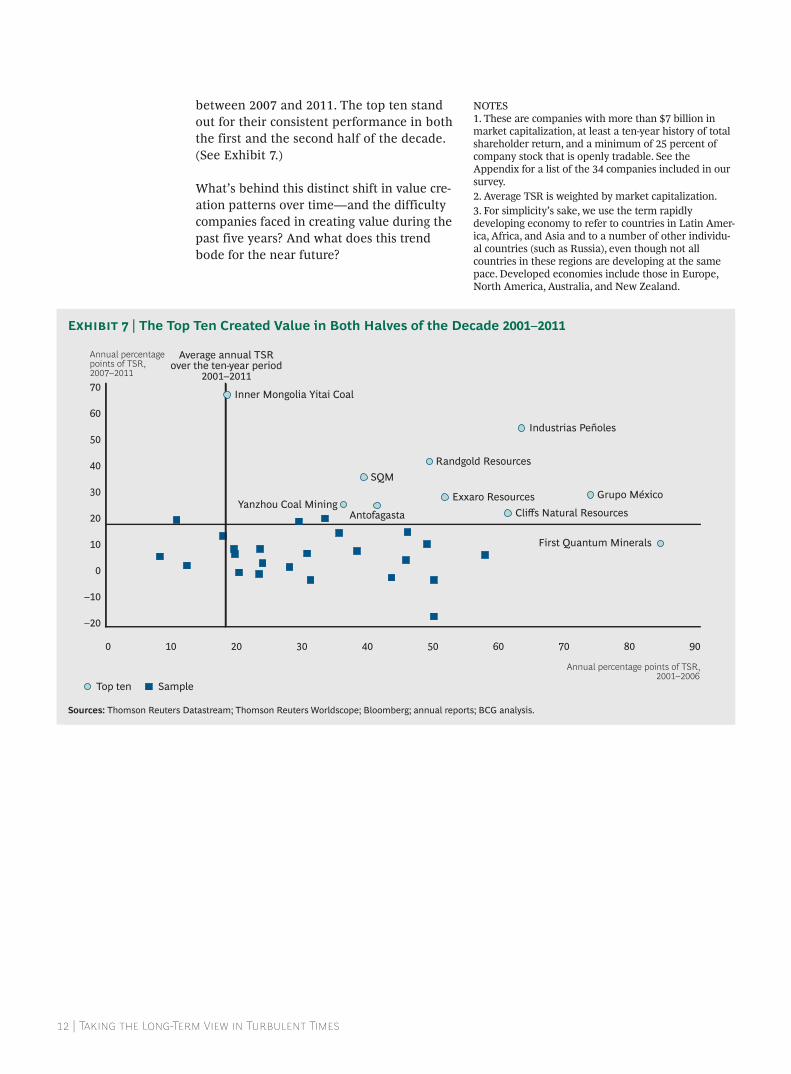
between 2007 and 2011. the top ten stand out for their consistent performance in both the first and the second half of the decade. (See Exhibit 7.)
what’s behind this distinct shift in value cre-ation patterns over time—and the difficulty companies faced in creating value during the past five years? and what does this trend bode for the near future?
notES1. these are companies with more than $7 billion in market capitalization, at least a ten-year history of total shareholder return, and a minimum of 25 percent of company stock that is openly tradable. See the appendix for a list of the 34 companies included in our survey.2. average tSr is weighted by market capitalization.3. for simplicity’s sake, we use the term rapidly developing economy to refer to countries in latin amer-ica, africa, and asia and to a number of other individu-al countries (such as russia), even though not all countries in these regions are developing at the same pace. Developed economies include those in Europe, north america, australia, and new zealand.
80706050400
Inner Mongolia Yitai Coal
Yanzhou Coal Mining
SQM
Antofagasta
Randgold Resources
Exxaro ResourcesCliffs Natural Resources
Industrias Peñoles
Grupo México
3010 20
60
50
Annual percentage points of TSR, 2007–201170
40
30
20
10
0
–10
–20
Annual percentage points of TSR,2001–2006
90
SampleTop ten
Average annual TSRover the ten-year period
2001–2011
First Quantum Minerals
Sources: Thomson Reuters datastream; Thomson Reuters Worldscope; Bloomberg; annual reports; BCG analysis.
Exhibit 7 | The Top Ten Created Value in Both Halves of the Decade 2001–2011

The Boston Consulting Group | 13
The ouTLook for an unCerTain fuTure
Three MounTinG risks
Overall, average TSR performance was strong throughout the period 2001
to 2011, but the decade comprised two distinct periods of value creation. (See Exhibit 8.) most of the value was generated in the first five years, from 2001 to 2006, the result of robust commodity-price growth and optimism about the industry’s continued growth. our 34-company industry sample garnered an average tSr of 27 percent each year during this period. from 2007 to 2011, however, tSr declined by 19 percentage points to just 8 percent a year. what explains the slowdown? we see four clear causes.
Revenue growth has slowed, a function of •decelerating price and production growth. the tSr contribution of price increases, for example, fell to 12 percentage points in the second half of the decade, from 16 in the first half. The revenue slowdown resulted in a loss of 3 points of tSr.
Cost pressures, especially in fuel, labor, and •capital equipment, have been persistent. across many major mining regions, electricity and fuel costs increased fourfold during the decade, labor costs grew fivefold, and steel prices increased
Annual percentage points of TSR30
20
10
0Average TSR,
2007–2011
8
Valuation multiplecompression
6
Slower revenue growthplus cost pressures
11
Reduced cash-flow contributions
3
Average TSR,2001–2006
27
Drivers of TSR underperformance(incremental contribution)
Sources: Thomson Reuters datastream; Thomson Reuters Worldscope; Bloomberg; annual reports; BCG analysis.
Exhibit 8 | The Past Five Years Saw a Distinct Slowdown in TSR
14 | Taking the Long-Term View in Turbulent Times
tenfold. while commodity prices rose rapidly, particularly during the first half of the decade, input cost inflation (and the annual 10 percent growth of unit costs that resulted) was not an issue. although prices grew more slowly in the second half of the decade, costs continued to grow at almost the same rate. margin growth fell, reducing its contribution to tSr from 10 percentage points to 2 percentage points. the slowdown in price growth—which was dramatic for copper, platinum, aluminum, nickel, and, most recently, iron ore—makes rising costs hard to ignore.
Capital discipline has slackened. • the rapid increase in project costs, as well as extensive acquisition activity, left less cash available for shareholders. this resulted in lower dividends, fewer equity repurchases, and higher debt levels than would otherwise be the case. The cash flow contributions of the sample declined by 3 percentage points of tSr from 2001 to 2006 to zero in the second half of the decade.
Diminishing expectations have eroded •valuation multiples. investor expectations rose early in the decade. as companies “grew into” these expectations, multiples naturally contracted. future expectations have been tempered, mainly as a result of the european financial crisis, economic fragility in the united States, and fears of a slowdown in china. uncertainty about potential new tax regimes (a carbon tax and new mining taxes, for example), along with rising expropriation risk in politically unstable regions, also depressed expecta-tions.
when we extrapolate our findings, we see three significant trends that could make the road to healthy returns far bumpier: pro-longed and more pronounced market uncer-tainty, the increasingly challenging economics of the mining business, and elevated social and policy risks.
market uncertaintyheightened market uncertainty has become a familiar feature of the post-financial crisis en-
vironment. commodity prices enjoyed consis-tent increases during the first part of the de-cade but much greater volatility in the last five years. price volatility has, in turn, trig-gered heightened volatility in mining compa-nies’ stock prices. many companies have post-poned or cancelled a number of high-profile projects as a result of cost inflation, sagging revenues, and growing doubts about future prices and demand.
interestingly, fluctuations in metal prices from 2001 to 2012 mirror the fluctuations in china’s real gDp growth rate to a startling degree. (See Exhibit 9.) it’s important to keep this correlation in mind as we examine the macroeconomic prospects of china.
Three significant trends could make the road to healthy returns far bumpier.
given current levels of uncertainty, compa-nies should plan for a range of scenarios—particularly ones that challenge incremental assumptions—rather than rely on simple pro-jections or sensitivities to a single trend.
according to a bullish scenario, for example, based on the theory of a commodities “super-cycle,” recent history is merely a bump in the road. this view holds that industry demand will continue unabated. china’s growth—in-deed, that of all emerging economies—will remain strong and increasingly decoupled from the west’s, with european and U.S. macroeconomic woes insufficient to dent de-mand. in addition, existing supplies of miner-al commodities will be depleted faster than they are restored (from, for example, success-ful exploration), which will keep prices stron-ger for longer. further supporting the bullish scenario is absolute demand: even if gDp growth in the emerging world were to slow, gDp would still be growing from a much larg-er base than ten years ago.
in contrast, the bearish view holds that we are experiencing a more protracted down-ward shift in commodity prices triggered by a

The Boston Consulting Group | 15
significant slowdown in china, worsening debt problems in Europe, and persistent low growth in the united States. according to this scenario, macro imbalances increase the risk of sudden demand shocks, and new projects will eventually lead to a supply glut. con-sumption in china, moreover, will not be suf-ficient to absorb the slack. Supporting this view is the recent slowdown in chinese ex-ports, along with the dramatic drop in the price of iron ore (as low as $89 per ton in Sep-tember 2012).
Both these scenarios have many adherents, are both are quite plausible, which demon-strates the importance of considering a range of likely scenarios. and executives should also recognize the possibility that, regardless of scenario, conditions could change rapidly. (See the sidebar “light at the End of the tunnel.”)
increasingly Challenging economics: Declining ore grades and higher strip ratiosthe economics of mining have grown progres-sively more challenging in recent years. the decline of ore grades worldwide has been well documented for some time. (See Exhibit 10.) copper grades have fallen from 4 percent
to 1 percent over the past century, while aver-age iron-ore grades of approximately 50 per-cent in 2005 are projected to drop roughly 5 percent by 2020. the result, of course, is in-creased pressure on unit costs and productiv-ity that will eventually affect prices and can trigger substitution risk. But lower ore grades are just one part of the problem. miners also face higher strip ratios and deeper deposits, which are increasingly located in far-flung lo-cations with limited infrastructure.
The economics of mining have grown more and more challenging in recent years.
however, history shows that over the longer term, operational and technological develop-ments can mitigate and sometimes erase these obstacles. continual improvements in equipment productivity, for example, have been fueled by the ever-increasing size of haul trucks and loading equipment. Step-change breakthroughs have occurred with the introduction of new technologies and meth-ods like froth flotation, heap leaching, and, more recently, autonomous (driverless) min-
Change in Chinese realGDP growth
6
4
2
0
–2
–4
–6
Metals price change (indexed)
100
75
50
25
0
–25
–50
Chinese real GDP growth
15
14
13
12
11
10
9
8
7
Metals price change (indexed)
100
75
50
25
0
–25
–50
Chinese real GDP growth (%, year-on-year)Metals price change (%, year-on-year)
Metals price change and Chinese real GDPgrowth, 2001–Q3 2012
Metals price change and change in Chinesereal GDP growth, 2001–Q3 2012
Change in Chinese real GDP growth (%, year-on-year)Metals price change (%, year-on-year)
Sources: Bloomberg; economist intelligence Unit; BCG analysis.
Exhibit 9 | Metal Prices Track Fluctuations in Chinese GDP Growth

16 | Taking the Long View in Turbulent Times
To get an idea of how rapidly market conditions can change, and the havoc that rapid change can unleash, one need only look at the coal mining industry in the United States. From a position of relative strength as recently as early 2011, the industry has suffered declining coal prices and falling demand. This sudden weakness is primarily the result of large quantities of cheap shale gas entering the market, along with new sulfur-emissions regulation. Metallurgical coal producers, particularly those at the higher end of the cost curve, are also struggling with weaker demand. The hoped-for growth in coal exports to China, which could have offset slowing U.s. demand, has failed to materialize.
These combined impacts have been striking. Margins have been halved (or worse) since the beginning of 2011, projects have been delayed or cancelled, and several mines have closed. The stock price of most large U.S. coal companies dropped by 60 to 80 percent in the 18 months since early 2011, owing to falling
profitability and multiples. one major company was forced to file for bankruptcy protection under Chapter 11.
The U.S. coal industry provides a caution-ary example of just how quickly industry fortunes can change. Still, opportunities to create value clearly exist: companies with healthier balance sheets can acquire good assets at reasonable prices (or even average mines cheaply, as effectively “out of the money” call options). Another strategy—doubling down on operational excellence programs—can generate propor-tionately more value now than during periods when high prices prevail. Finally, companies with a superior employee value proposition can attract good talent that has been displaced, gaining an intangible asset that promises a considerable future return.
In other words, companies that have exercised discipline in their value-creation strategies and execution can take advan-tage of turbulent times to seize opportuni-ties—and build for the future.
LIGHT AT THE EnD OF THE TUnnEL
Grade (% copper; % nickel; grams/tonne gold)
100.0
10.0
1.0
0.12050200019501900185018001750
Nickel, Canada and AustraliaGold, worldwideCopper, worldwide
Grades have been declining for centuries... ...and will continue to do so
Iron ore, run-of-mine (% iron, worldwide)
55
50
45
40
352020F2015F20102005
Sources: “Changing Copper Yields and Ore Grades, “Mining Journal, October 7, 2011; aMe Group; Gavin Mudd, The Sustainability of Mining in Australia: Key Production Trends and Their Environmental Implications for the Future, Monash University and Mineral policy institute, October 2007.
Exhibit 10 | Ore Grade Decline Is a Permanent Feature of the Industry

The Boston Consulting Group | 17
ing equipment. Companies that seize techno-logical opportunities and innovate can come out ahead. (for more on these innovative technologies and processes, see the chapter “rising to the challenge,” below.)
given the outlook for grades, investment in innovation will again become an important driver of competitive advantage for mining companies. in addition, the search for higher grades and better deposits has encouraged explorers and major players alike to seek out geologically promising, underexplored re-gions. Such regions are often in the early stag-es of economic development. to operate ef-fectively in these environments, mining companies need to develop very different ca-pabilities than those that served them so well in the past.
heightened social and Policy risksmining companies cannot choose where ore deposits are located, of course. yet the risks in their operating environments—in the de-veloped and developing world alike—have been escalating in recent years. indeed, social and labor unrest have been on the rise, from peru to indonesia to South africa.
uncertainty regarding government policy is widespread. recent regulation (and, increas-ingly, court decisions and executive fiat) in-cludes environmental measures (such as the u.S. Epa’s sulfur-emissions policy and Depart-ment of the interior’s withdrawals), as well as trade-related actions (such as indonesia’s ex-port controls). these moves follow the politi-cal winds and public opinion, and are thus dif-ficult to predict and respond to. the same is
true of tax and royalty changes, which are on the rise as governments throughout the world seek new revenues to meet widening deficits or to fund their development agendas. tradi-tionally “safe” jurisdictions such as australia have introduced windfall taxes and unexpect-ed increases in royalty rates (for example, the minerals resource rent tax in 2011 and the Queensland royalty increases in September 2012). cash-strapped governments, such as those in South africa and the ivory coast, are also pursuing royalty increases.
investment in innovation will become an important driver of competitive advantage.
taxation and royalty hikes are just two forms of resource nationalism. at the extreme end is outright nationalization, a trend that threatens to escalate when economies deteri-orate. recent instances include the Democrat-ic republic of the congo and argentina, and other countries are flirting with the idea. in-donesia, for its part, is pursuing the forced spinoff of ownership stakes held by foreign mining companies.
as mining companies make more forays into new regions than they make into new miner-als, it becomes all the more important that they have a clear strategy for dealing with resource nationalism and related policy risks.

18 | Taking the Long View in Turbulent Times
rising To The ChaLLenge
Regardless of macroeconomic scenar-io—whether a rebound in the commod-
ity supercycle or a protracted downturn—uncertainty and risk promise to persist. companies must be prepared to navigate this uncertainty skillfully and profitably.
clearly, executive teams are under tremen-dous pressure to create value in the current environment. avoiding value-destroying traps, such as top-of-the-cycle acquisitions (or the converse, an anemic growth pipeline)—becomes critically important. our observa-tions and analysis suggest that four key levers can help executives in their value-generating efforts.
Revisit and pressure test the company’s •value-creation strategy. getting capital allocation and portfolio management right is critical. companies should address value creation and risk in a systematic way, across different investment options, so they can be confident of making the right tradeoffs.
Manage country risk and stakeholder •relations. Early-stage, proactive, and ongoing stakeholder management and community development are increasingly necessary in developing, operating, and sustaining mine sites. Success requires new approaches, new skills, and new types of talent—entirely different capa-
bilities and approaches from those used to improve safety and environmental performance. for that reason—and because the stakes are so high—it’s crucial that companies not relegate the management of country risk and stake-holder relations to either their health and safety or environmental departments.
Up the odds of project success. • project execution has grown more complex, and megaprojects have become the norm rather than the exception. By focusing on project excellence, companies can achieve desired outcomes while containing capital expenditures—and, in turn, profitably expand production while maintaining credibility with investors.
Develop an advantaged operating system. • operating margins remain under pressure owing to uncertain demand, rising costs, ever-harsher economics, and declining labor productivity. companies can counteract these impacts by leveraging untapped opportunities in existing assets, exploring next-generation mining tech-niques, and building a strong talent pipeline to lead in the current and future industry environment.
mining executives will be familiar with these levers, which are already at the heart of many companies’ strategies. But they are of-

The Boston Consulting Group | 19
ten difficult to implement—largely because each requires a multidisciplinary effort. achieving their bottom-line impact can there-fore be elusive.
Lever 1: revisit and Pressure Test your Value-Creation strategyto create long-term value, executives need to balance their business, financial, and investor strategies. But equally important—and less appreciated—are the fundamentally disparate investment horizons of mining companies and their investors. it typically takes years, if not decades, for a capital investment to produce returns. Yet equity investors often hold short-er-term performance expectations. Because investors set the value of a company, it makes sense to understand their relatively shorter-term interests when developing long-term value-creation plans.
Take the investor into account. to incorpo-rate investor strategy into business planning without falling prey to “flavor of the month” thinking, it’s important to first assess objec-tively what your investor base is seeking. what role does your company play in your in-vestors’ portfolios? Does your strategy align with their needs? identifying mismatches between business and investor objectives creates opportunities to adjust strategies and unlock value.
there are a variety of tools companies can use to understand investor perceptions and what drives (or hinders) their stock’s perfor-mance. Bcg’s Smart multiple methodology, for example, disaggregates the drivers of a company’s valuation multiple, with specific weightings for capital allocation, asset profit-ability, debt, and other key factors. Executives can incorporate it into their strategic-plan-ning efforts to objectively assess the impact of different initiatives using the common yardstick of tSr. investor interviews, an im-portant complement to the Smart multiple methodology, highlight opportunities and ar-eas of dissatisfaction that might not surface in other types of analysis. they can also help set priorities in capital allocation.
a natural resources company recently pur-sued this approach. the Smart multiple mod-
el explained the company’s historical stock price over the past decade, and the company then used it to determine the full tSr impact of different strategic options. Based on the analysis and investor interviews, the compa-ny decided not to make any major new acqui-sitions and instead raised its dividend signifi-cantly. investor reaction was unambiguous. in the week following the announcement of the company’s new capital-allocation strategy, its stock outperformed that of its peers by more than 10 percent, gaining more than $1 billion in market value.
it’s important to assess objectively what your investor base is seeking.
Get capital allocation and portfolio management right. in theory, every invest-ment should be evaluated against a compre-hensive set of investment criteria. in reality, however, it is more practical to explicitly consider different types (or subportfolios) of investments, such as exploration, growth projects, and investments in productivity improvements. companies should set guide-lines for target allocations by investment type. These guidelines can be refined as part of the annual planning cycle. Every invest-ment decision, whether organic or m&a-relat-ed, can then be assessed against comparable alternatives. This approach allows specific lenses to be applied to each investment type, giving the company the ability to consciously accommodate different levels of risk.
for example, smaller deals with junior explo-ration entities or mining companies are an im-portant component of overall m&a activity, making up between 80 and 90 percent of total deal volume (and 10 to 20 percent of total deal value). Juniors, in fact, often serve as long-term call options, contributing to future resources, reserves, and project flow. maintaining a strong pipeline of relationships with juniors is therefore a key success factor in many mining growth strategies. however, such deals have a very different risk-return profile than that of an expanded existing operation or a major

20 | Taking the Long-Term View in Turbulent Times
new capital project. companies need to assess these investments differently and be deliber-ate in the tradeoffs they make.
through our work with clients, we’ve distilled several best practices related to capital alloca-tion and portfolio management:
Maintain capital discipline. • companies should resist the temptation to use cash just because it has accumulated. unless a compelling investment opportunity presents itself, it’s often best to save extra cash for dividends. one useful tactic: putting in place specific guardrails for investing funds in each category.
Manage through the cycle. • for each portion of the portfolio, companies should develop a clear, long-term outlook and manage toward it, maintaining investment discipline even in tough times. this approach helps companies avoid spending cash when costs are high and helps them continue growing when costs are low. a number of natural resources companies have successfully followed this formula.
Be prepared for interim shocks. • recall the companies that were overleveraged when the 2008 financial crisis struck and were forced to sell assets at a heavy discount. apply the lessons of previous periods of market turbulence so you can seize the upside or mitigate the downside of short-term volatility.
Lever 2: manage Country risk and stakeholder relationscountry risk has always been intrinsic to min-ing, but as the world’s supply of quality ore shrinks, companies will be even less able to avoid riskier, but geologically promising, juris-dictions. Beyond that, every jurisdiction car-ries its own mix of risks—local and universal. it is not enough to identify the many forms of country risk at the outset of an investment. country risk is varied, wide ranging, and con-stantly morphing, and managing it in each lo-cation must therefore be a continuous effort.
central to assessing and managing country risk is recognizing the importance of manag-
ing stakeholder relationships over the long term. Beyond an entry strategy, a company should identify the key stakeholders and the media landscape and know how it (and min-ing in general) is perceived by the population. Establishing thoughtful community-develop-ment efforts should be a priority. the benefits extend beyond removing obstacles to operat-ing. many companies (including several based in emerging markets) recognize that good re-lations are an investment for all sides, wheth-er they involve building hydroelectric plants that also provide electricity to local communi-ties or contributing to educational institutions that ultimately build labor capacity.
Managing country risk in each location must be a continuous effort.
recognizing that good, longstanding commu-nity relations can be difficult to achieve, the world economic Forum and BCg launched the responsible mineral Development initia-tive in 2010 to explore the challenges of re-sponsible mineral development from the per-spective of stakeholders.1 through extensive surveys and interviews conducted in 30 min-ing regions worldwide, the study examined participants’ views of the social and econom-ic contributions and costs of mineral develop-ment throughout a mine’s life cycle. it also unearthed important insights into the actions taken by mining companies that stakeholders considered most helpful (or most counterpro-ductive). (for more on cultivating stakeholder relationships as an integral part of managing sovereign risk, see the sidebar “Building Blocks for responsible mineral Development: perspectives from Stakeholders.”)
Lever 3: up the odds of Project success by Pursuing Project excellenceproject excellence is the third major lever companies can apply to enhance tSr. proj-ect excellence is achieved through a disci-plined approach to capital expenditures. it also calls for strengthening project gover-

The Boston Consulting Group | 21
nance, managing projects with an end-to-end view, and managing project resources strategically.
Discipline in project management is particu-larly vital during periods of market uncer-tainty, when demand and price volatility can jeopardize performance. yet a recent trend—the rise of the megaproject—poses one of the greatest challenges to project excellence. more and more mining projects qualify as megaprojects—those costing upwards of $1.5 billion. in copper alone, megaprojects ac-count for more than 75 percent of future pro-duction growth.
what’s behind this trend? mining locations have become more complex, often because they are in the early stages of development and need major infrastructure investments. capex costs, from machinery and under-ground equipment to processing, have been rising steeply.
not surprisingly, megaprojects entail greater execution risk than smaller, simpler projects.
according to the research firm independent project analysis, 70 percent of all megaproj-ects fail.2 of those that do, the average capex overrun is 33 percent, even after adjusting for input cost inflation. in the past three years, the companies in our sample likely incurred up to $45 billion in additional costs owing to capex overruns.3
But capex overruns and missed deadlines are not the only value destroyers. companies also grapple with lower-than-expected ore grades and higher-than-expected maintenance capex and operating costs. these costs are the result of overengineering, of failing to adequately con-sider future operations and maintenance needs, and of taking shortcuts during construction.
project excellence can counteract these value destroyers, reducing capital intensity by 20 to 40 percent. consider the approach that one major mining company followed as part of its project-excellence program. (See Exhibit 11.) the company sought to compress its capex pipeline (worth billions of dollars) while still delivering successful projects on time. By op-
A joint World Economic Forum–BCG study, Responsible Mineral Development Initiative 2011, offers a framework, based on exten-sive stakeholder feedback, of six building blocks for responsible mineral development:
Progressive capacity building and 1. knowledge sharing among all stake-holders
A shared understanding of the costs 2. and benefits, as well as the risks and responsibilities, related to mineral development
Collaborative processes for stakeholder 3. engagement throughout the life cycle of mining projects
Transparent processes and arrange-4. ments
Thorough compliance, monitoring, and 5. enforcement of commitments
Early and comprehensive dispute 6. management
the study also identifies practical applica-tions by companies of these building blocks—applications considered by community members to be the most helpful in advancing responsible mineral development. Among them: using and contributing to a global repository of sound practices, creating tailored training and development programs (from basic literacy education to mining-specific skills for local suppliers), establishing a multistakeholder platform for a national dialogue, and preparing effective mechanisms for resolving disputes.
BUILDInG BLOCkS FOR RESPOnSIBLE MInERAL DEVELOPMEnTPerspectives from Stakeholders

22 | Taking the Long-Term View in Turbulent Times
timizing scope, adopting a lean approach to design and operations, and boosting engage-ment with contractors, the company reduced its capital intensity by 27 percent. (for more on how to contain capex, see the sidebar “lessening capital Spend.”)
capex discipline is a critical means of achiev-ing project excellence. companies also have a variety of enabling tools at their disposal—tools that are too often overlooked, despite their paramount importance to project out-comes.
A Sound Project-Governance Model. • the model should clearly define who’s responsible for what at every stage of the project, what decision-making process will be followed, and the control and quality assurance parameters. it should also outline plans for project management and risk management, as well as performance measurement.
A Strong Owner Team Whose Skills Match •Project Requirements. Studies by indepen-dent project analysis show that projects overseen by owner teams that lack the necessary qualifications are far more
likely to experience capex overruns, schedule slippage, and operational problems after startup.
Strategic EPC/EPCM Contracting and Relation- •ship Management. Because projects are becoming increasingly large in scale and complex—and because engineering, procurement, and construction (Epc) and engineering, procurement, and construction management (ePCm) contractors are often responsible for project design and construc-tion—companies should be more strategic in their selection of these contractors. (one approach is to establish preferred bidder relationships or to contract out multiple projects.) this will help avoid costly changes midstream. once contractors are chosen, companies should actively manage and monitor the relationship.
Rigorous Resource Planning. • one of the most routine causes of schedule slippage is resource bottlenecking—whether of heavy equipment or skilled labor—during the project construction phase. companies can minimize bottlenecking and improve control costs by anticipating critical resources at the outset.
Directcosts (%)2
Other indirectcosts1 (%)
Contingency (%)
Escalation (%)
Estimate aerapplication of project excellence
philosophy
73
37
11
7
172
Original estimate
100
48
16
13
23
Reduced contingency
Reduced indirect costs
Optimized scope
Lean, replicated designBetter engagement with contractors
–27%
Source: BCG case experience.1Common distributables, epCM, owner’s team, operations development and iM costs.2same escalation factor applied to lower base.
Exhibit 11 | Through Project Excellence, One Company Achieved a Significant Reduction in Capital Intensity

The Boston Consulting Group | 23
Companies can streamline project execu-tion sustainably, without sacrificing quality or productivity, by applying BCG’s LESS approach. This framework promotes practices that are lean, efficient and effective, standardized, and structured and systematic.
Lean • addresses the widespread problem of overengineering beyond the point of payoff; it eliminates unnecessary scope and specifications. Lean entails such practices as optimizing site layout, standardizing and replicating design, simplifying design to reduce construc-tion time and cost, and modularizing to reap schedule and offsite fabrication benefits.
Efficient and effective • stresses practices that maximize tool time and equipment utilization to minimize downtime on site.
Standardized • emphasizes standardizing and replicating facilities over time to realize efficiencies.
Structured and systematic • refers to a rigorous change-management process that relies on decision rights, tools, and templates to support fact-based decision making.
LESS can be applied at every level of project organization, as the exhibit below shows. In portfolio governance, it can institutionalize a gated project-develop-ment process. In program excellence, it can guide leaders in strategically sourcing external providers. In project excellence, it helps clarify the right execution strategy. And in people excellence, it can help companies define and develop leadership capabilities.
LESSEnInG CAPITAL SPEnD
Source: BCG analysis.
The LESS Approach Can Be Applied Across the Project Organization
Growthstrategy
Operationalimprovement
Portfolio governance
Governance
People excellence
Organization design
Program excellence
Capital stewardship Talent management
Strategic contractingand procurement
Business controlsProgram planning
EPC/EPCM contractingand management
Program managementoffice
Standardized designs
Appraise Select Define ExecuteBusiness
requirementsScope
optimization
Lean design
Execution strategy Execution planning
Construction productivity
Project excellence
Capital allocation
24 | Taking the Long-Term View in Turbulent Times
A Holistic View of the Project Pipeline. • Silos are barriers to improvement. By taking an integrated view of the project pipe-line, companies can disseminate best practices across projects, adopt standards that create efficiencies, and identify opportunities for savings (notably, in procurement).
like the four levers, many of these strategies and techniques are familiar. But in recent years, process discipline has come under pres-sure from more ambitious deadlines and proj-ect complexity. we cannot understate the im-portance of these project-excellence tools—and the significance of their aggregate impact.
Lever 4: Develop an advantaged operating systemfor most of the past ten years, the mining business has been exceptionally profitable. many mining companies adopted the “bar none” operating philosophy: essentially, throw any and all resources at the mine be-cause everything pays. But as we’ve dis-cussed, the world has changed. the demand outlook remains uncertain, costs keep rising, and labor productivity is declining. in such a precarious environment, agility—the ability to adapt to changing conditions—becomes ever more important.
next-generation mining is emerging as a way to meet industrywide challenges.
to achieve a step change in economics, min-ing companies need to think about their op-erations differently—and develop an advan-taged operating system. Such a system has three essential elements.
Get the fundamentals right. first and fore-most, companies should make the most of existing assets. They should question long-held beliefs, leverage scale to optimize procurement, share best practices, and improve repeatability. common metrics
should be implemented across sites, and those who pursue improvements should be rewarded. External benchmarks, when used carefully, can help pinpoint further opportu-nities for efficiency and improvement. At most companies, we see much untapped potential for value creation. organizational silos are among the greatest barriers to realizing this value. for that reason, culture and change management should be integral to any transformation program. (for more on realizing large-scale efficiencies, see Overhaul-ing Maintenance: Creating Competitive Advan-tage in Transportation, Bcg focus, July 2012, and “You Can’t grow Your way out of inefficiency,” BCg article, September 2010.)
investigate next-generation mining techniques. we use the term next-generation mining (ngm) to describe technology- enabled changes in mining. ngm is emerging as a way to meet some of the industrywide challenges outlined in this report, supported by the increasing commoditization (and thus, availability) of many applicable technologies. in the 1990s, for example, original equipment manufacturers such as caterpillar and komatsu started experimenting with autono-mous trucks using radar technology that had been developed for the military. today, that same technology is being used in luxury automobiles for a fraction of the cost. Simi-larly, connectivity via wireless broadband now permits operations to be performed remotely in a way that was not possible only a few years ago.
ngm encompasses more than islands of tech-nology. it involves new approaches to physi-cal processes, greater availability and use of information, and new ways of working that both enable and are enabled by technological and it developments. the result is a funda-mental shift in competitive position. indeed, it is inevitable that miners will have to follow this path to stay competitive.
among the new physical processes being ex-plored by the industry are advances in auto-mation, both in surface mining and under-ground operations, and the use of remote operations, in which control centers are locat-ed in major population centers. this reduces labor costs, expands the pool of available tal-

The Boston Consulting Group | 25
ent, and greatly increases the opportunities for cross-functional collaboration. there are also a number of new or improved technolo-gies that allow companies to reach previously inaccessible ores and extend the life of exist-ing operations—both important game chang-ers. Such technologies include new recovery and refining methods, tunnel-boring ma-chines for underground development, high-angle conveyors for surface mining, mobile in-pit crushing, and new sensing and ore-sort-ing technologies.
the increasing prevalence of instrumentation on mining equipment, and the increasing in-tegration of engineering systems and enter-prise systems, yield vastly more—and more accurate and timely—data. this abundance of better data supports everything from end-to-end production and supply chain efficiencies to enhanced scheduling, planning, and deci-sion making. companies can get more reliable information (real-time and historical) on the ore body, inventory, and asset health, and they can apply advanced analytics to histori-cal data to support long-term improvement.
finally, new technologies and new ways of us-ing information make it imperative that exec-utives reexamine how their business oper-
ates. geographically dispersed people and skills can become more connected by means of either colocation in operations centers or virtual collaboration tools. production and maintenance planning can become more tightly integrated. operations can become more predictable and decision making more proactive. as collaboration across functional silos becomes easier, companies can unlock value by making better systemwide tradeoff decisions. additionally, advances in ngm will require new workforce skills. For instance, as it and automation become more important strategically and operationally, companies will need to attract more people with deep analytical, it, forecasting, and programming skills. companies will also need operators with a different skill set: computer dexterity.
Create people advantage. mining companies face two pivotal human-capital challenges. as in most industries, talent is in short supply. (in north america, the shortage is exacerbat-ed by attrition from mass retirement.) a second, less visible—and almost counterintui-tive—challenge is the decline of labor productivity in mining, at both the industry and company levels. (See Exhibit 12.) Declin-ing grades and increasing strip ratios cause outputs to shrink, while also making extrac-
U.S.CanadaAustralia
Growth (%)10
5
0
–52000–20071989–2000
Labor productivity by country(selected key regions)
Labor productivity by company
CAGR, 2001–2011 (%)20
10
0
–10
–20 A B C D E F G M N O P Q R S T U V W XCompany
H I J K L
Sources: australian Bureau of Resources and energy economics, Resources and Energy Quarterly, september 2011; annual reports; BCG analysis.Note: labor productivity is calculated as output per full-time employee (with FTe defined by the companies included in the analysis).
Exhibit 12 | Labor Productivity in Mining Is Declining Significantly
26 | Taking the Long-Term View in Turbulent Times
tion more difficult and costly. growth in support functions and overhead has only aggravated these trends.
Drawing on Bcg’s extensive research on tal-ent and people management, we see four ways that mining companies might address the talent shortage and mitigate the decline in labor productivity:
Define the employee value proposition (as 1. part of developing employer brand). the mining industry rarely shows up on leading lists of the best places to work. as we observed earlier, executives must go beyond traditional mining-oriented talent to attract people with new skills that can help their company secure long-term competitive advantage.
Adopt strategic workforce planning to 2. ensure an adequate pipeline in key skill areas based on projected future demand. Strategic workforce planning also allows companies to improve sourcing of indirect labor and nonproduction func-tions, thus enhancing their social license to operate. companies will need to tap more deeply into underrepresented talent pools, including women, indig-enous people, and those from other engineering disciplines.
Manage talent on a continuing basis3. . this includes sourcing and developing employ-ees in strategically important categories, as well as providing leadership develop-
ment, career development, and succession planning programs that advance individu-als while building capacity.
Centralize talent and people management 4. efforts—where it makes sense to do so. the corporate center has the resources and the reach to implement and manage the three preceding elements of people manage-ment. if it does them well, it can also manage indirect labor and overhead, coordinate initiatives, and institute productivity measures.
Talent and productivity issues require long-term effort. for that reason, companies ought to take advantage of market uncertainty to upgrade their talent, address demographic risk, and improve their employer profile. (for more on creating people advantage, see Creat-ing People Advantage 2012: Mastering HR and People Challenges in a Two-Speed World, Bcg report, october 2012.)
notes1. world economic Forum and The Boston Consulting group, The Responsible Mineral Development Initiative 2012, http://www3.weforum.org/docs/weF_mm_Re-port_2011.pdf.2. edward w. merrow, Industrial Megaprojects: Concepts, Strategies, and Practices for Success ( John wiley & Sons, 2011). independent project analysis defines failure as exceeding budgeted capex or schedule by more than 25 percent.3. Based on the application to our sample of indepen-dent project analysis results.
The Boston Consulting Group | 27
The Long-Term View
The turbulence of recent years is likely to continue. Demand will remain
volatile. These difficulties promise continuing challenges for mining companies in bringing projects online and in everything from winning stakeholder support and getting permitted to managing ever-growing capital costs and complexity. operating costs will continue to climb, driven by rising input costs, declining grades, and increasingly challenging geology. Left unchecked, these pressures can severely hamper any mining company’s ability to create value.
Definitive action is a must. yet where should companies focus their energy? the answer will be different for each company and even each operation, depending on individual cir-cumstances and the tradeoffs that must be made. creating long-term value in turbulent times requires a tailored approach—one in-formed by a clear value-creation strategy and supported by a disciplined and agile organi-zation.

28 | Taking the Long-Term View in Turbulent Times
Below is a series of questions that can help mining executives think about
avenues for value creation—the choices they entail and the tensions within and between them.
Lever 1: revisit and pressure test your value-creation strategy
Does your organization have a compre- •hensive value-creation plan that incorpo-rates and balances business, financial, and investor strategies?
Does your value-creation plan consider •different macroeconomic scenarios?
have you explicitly prioritized your capital- •allocation options, and do you know how investors will react to each one?
what are likely to be the biggest hurdles •to achieving your value-creation objec-tives in the next one to three years? the next five to ten?
Lever 2: manage country risk and stakeholder relations
Does each of your sites have a stakeholder •management strategy and plan?
where they exist, how well are they used? •where are they lacking and why?
Do your stakeholder-engagement and •community-development functions perform equally well in different loca-tions?
Are they staffed with the appropriate skills •for each location?
what do your stakeholder-management •and community-relations programs entail? what information, resources, and other inputs do you use to develop and refine them?
Lever 3: up the odds of project success
what is the likelihood of your projects •running over budget or schedule? what mitigations have you put in place?
Do you apply the same rigor to your •project organization and how it functions as you do to the rest of your business?
how much value might be disappearing •as a result of inconsistent planning or overengineering—or simply because people are not seizing opportunities for standardization?
how would a new owner look at your •existing operations? what would he or she change?
key QuesTions for mining exeCuTiVes

The Boston Consulting Group | 29
Lever 4: Develop an advantaged operating system
how much of a step change in your •economics would next-generation mining techniques provide? Do you have an ngm blueprint to guide your efforts?
is your organization built to withstand •short-term shocks—or to capitalize on fleeting opportunities?
what do you use to assess current and •future workforce needs? what plans have you developed to fill key gaps today—and to attract those with the new skill sets needed for the future?

30 | Taking the Long-Term View in Turbulent Times
aPPenDix
Sources: Thomson Reuters datastream; Thomson Reuters Worldscope; Bloomberg; annual reports; BCG analysis.Note: The sample comprises 34 global companies with a market valuation greater than $7 billion and a free float of at least 25 percent.1The contribution of each factor is shown as a percentage of the ten-year average annual TsR; any apparent discrepancies in TsR totals are due to rounding.2average annual TsR, 2001–2011.3as of december 31, 2011.4Change in eBiTda.
The Mining Industry Top Ten, 2001–2011
TSR Disaggregation1
Rank Company Domicile TSR2 (%)
Market value3
($billions)
Sales growth
(%)
Margin change
(%)
Multiple change4
(%)
Dividend yield(%)
Share change
(%)
Net debt change
(%)
1 industrias peñoles Mexico 58.2 17.8 22.8 10.5 9.0 6.2 0.4 9.3 2 Grupo México Mexico 49.5 21.6 14.3 16.5 –5.1 3.6 1.4 21.5 3 Randgold Resources United Kingdom 45.0 9.4 32.5 0.0 13.9 0.3 6.9 5.2
4 First Quantum Minerals Canada 42.7 9.5 34.1 26.6 –13.4 0.6 7.6 2.5
5 inner Mongolia Yitai Coal China 40.2 7.3 30.6 24.3 –19.2 4.7 0.0 –0.3 6 Cliffs natural Resources United states 40.1 8.9 34.6 18.0 –7.0 0.9 –5.4 –0.9 7 exxaro Resources south africa 39.2 7.5 8.7 5.0 15.0 4.5 1.7 7.8 8 sociedad Químicay Minera de Chile (sQM) Chile 36.9 15.1 14.7 6.2 9.4 3.4 0.0 3.2 9 antofagasta United Kingdom 32.4 18.7 23.0 5.8 6.5 5.1 0.0 5.1 10 Yanzhou Coal Mining China 30.1 10.5 23.0 4.2 9.2 4.5 0.7 4.5
• Agrium• Anglo American• AngloGold Ashanti• Antofagasta• Barrick Gold• BHP Billiton• Cameco• Campañia de Minas
Buenaventura• Cliffs Natural Resources• Consol Energy• Exxaro Resources• First Quantum Minerals• Freeport-McMoRan Copper
& Gold• Gold Fields• Goldcorp• Grupo México
• Impala Platinum• Industrias Peñoles• Inner Mongolia Yitai Coal• Israel Chemicals• K+S Group• Kinross Gold• MMC Norilsk Nickel• Mosaic Company• Newcrest Mining• Newmont Mining• Peabody Energy• PotashCorp• Randgold Resources• Rio Tinto• Sociedad Química y Minera
de Chile (SQM)• Teck Resources• Vale• Yanzhou Coal Mining
Location of primary listing The sample
Primary minerals produced
Number of companies
Number of companies
20
10
0Asia-Pacific
4
Africa, Europe, andthe Middle East
11
Americas
19
10
5
0Other
4
Copper
4
Fertilizerand
industrialminerals
6
Diversified
6
Gold
9
5
Coal
Sources: Thomson Reuters datastream; Thomson Reuters Worldscope; Bloomberg; annual reports; BCG analysis.
The Study Sample Comprised 34 Major Mining Companies

The Boston Consulting Group | 31
for furTher reaDing
The Boston Consulting Group publish-es many reports and articles that may be of interest to mining management teams. Recent examples include the publications listed here.
Capital Procurement: The Cornerstone of Successful Projects a Focus by The Boston Consulting Group, October 2012
Eight Key Levers for Effective Large-Capex-Project Managementa Focus by The Boston Consulting Group, October 2012
Mastering HR Challenges in a Two-Speed WorldThe BCG 2012 Creating people advantage report, October 2012
Stakeholder Management: How Much Relationship Capital Do You Have?BCG article, October 2012
How Companies Can Rise Above Faustian EconomicsBCG article, October 2012
The 2012 BCG 50 Chinese Global Challengers: End of Easy Growth: Fast-Growing Companies Face Headwinds as They Expanda Focus by The Boston Consulting Group, september 2012
Improving the Odds: Strategies for Superior Value CreationThe BCG 2012 Value Creators report, september 2012
How M&A Can Grow Portfolio Valuea report by The Boston Consulting Group, august 2012
Six Steps to StabilityBCG article, august 2012
Overhauling Maintenancea Focus by The Boston Consulting Group, July 2012
Effective Community Engagement: Lessons from the Natural Resources IndustryBCG article, May 2012
Winning Practices of Adaptive Leadership Teamsa Focus by The Boston Consulting Group, april 2012
A Framework for Advancing Responsible Mineral Developmenta joint report by The Boston Consulting Group and the World economic Forum, February 2012
You Can’t Grow Your Way Out of InefficiencyBCG article, september 2010
Mastering Complexitya White paper by The Boston Consulting Group, July 2010
Ignore Short-Term Indicators, Focus on the Long HaulBCG article, May 2010

32 | Taking the Long-Term View in Turbulent Times
noTe To The reaDer
About the AuthorsGustavo Nieponice is a partner and managing director in the santiago of-fice of The Boston Consulting Group and the leader of BCG’s base-metals sector worldwide. You may contact him by e-mail at [email protected].
Thomas Vogt is a principal in the firm’s Chicago office. You may contact him by e-mail at vogt.thomas@ bcg.com.
Tom King is a senior partner and managing director in BCG’s Toronto office and the leader of the mining and metals practice in north america. You may contact him by e-mail at [email protected].
Ross Middleton is a partner and managing director in the firm’s Mel-bourne office. You may contact him by e-mail at [email protected].
Christian Köpp is a partner and man-aging director in BCG’s san Francisco office. You may contact him by e-mail at [email protected].
Victor Scheibehenne is a principal in the firm’s Toronto office. You may contact him by e-mail at [email protected].
AcknowledgmentsThe authors would like to acknowledge the contributions of the following glob-al experts in corporate development and mining: Frank plaschke, a partner and managing director in the firm’s Munich office; hady Farag and dirk schilder of BCG’s Munich-based Value Creators research team; decker Walk-er, a principal in the firm’s Chicago of-fice; alex Koch and Grant McCabe, partners in BCG’s perth and Mel-bourne offices; stephen amery, lead researcher in the firm’s mining knowl-edge team in Boston; Jim hemerling, a senior partner in BCG’s san Francisco office; and Joel Janda, a partner in the firm’s seattle office. The authors would also like to thank the team at the BCG valuescience Center in south san Francisco, a re-search center that develops leading-edge valuation tools and techniques for M&a and corporate strategy appli-cations, Collin Galster, an associate in the firm’s Chicago office, agustín Cos-ta, a project leader in the Buenos aires office, and Teddy Kuhn, an associate in the Toronto office for their contribu-tions to the research; Jan Koch for writ-ing assistance; and Katherine an-drews, Gary Callahan, Gina Goldstein, and sara strassenreiter for contribu-tions to the editing, design, and pro-duction of the report.
For Further ContactThis report was sponsored by the in-dustrial Goods practice. BCG works with its clients to deliver solutions to the challenges discussed in this report. These clients include some of the world’s largest and most successful mining companies, in both traditional and emerging economies. if you would like to discuss the insights contained in this report, or learn more about the firm’s capabilities in the mining indus-try, please contact one the authors or your local BCG team.

The Boston Consulting Group | C
© The Boston Consulting Group, inc. 2012. all rights reserved.
For information or permission to reprint, please contact BCG at:e-mail: [email protected]: +1 617 850 3901, attention BCG/permissionsMail: BCG/permissions The Boston Consulting Group, inc. one Beacon street Boston, Ma 02108 usa
To find the latest BCG content and register to receive e-alerts on this topic or others, please visit bcgperspectives.com.
Follow bcg.perspectives on Facebook and Twitter.
12/12 Rev. 3/13

abu DhabiamsterdamathensatlantaaucklandBangkokBarcelonaBeijingBerlinBostonBrusselsBudapestBuenos airescanberracasablancachennai
chicagocolognecopenhagenDallasDetroitDubaiDüsseldorffrankfurtgenevahamburghelsinkihong konghoustonistanbulJakartaJohannesburg
kievkuala lumpurlisbonlondonlos angelesmadridmelbournemexico citymiamimilanminneapolismonterreymontréalmoscowmumbaimunich
nagoyanew Delhinew Jerseynew yorkosloparisperthphiladelphiapraguerio de JaneiroromeSan franciscoSantiagoSão pauloSeattleSeoul
ShanghaiSingaporeStockholmStuttgartSydneytaipeitel avivtokyotorontoviennawarsawwashingtonzurich
bcg.com