From value chain analysis to global value chain analysis ...

Version 3.0November 2018
Value Change in the Value Chain:
BEST PRACTICES IN SCOPE 3GREENHOUSE GAS MANAGEMENT
Supported by

Value Change in the Value Chain: Best Practices in Scope 3 Greenhouse Gas Management | 2
ACKNOWLEDGEMENTS
This guidance was developed by the Science Based Targets initiative, Navigant and the Gold Standard.
The Science Based Targets initiative mobilizes companies to set science-based targets and boost their competitive advantage in the transition to the low-carbon economy. It is a collaboration between CDP, the United Nations Global Compact, World Resources Institute (WRI) and the World Wide Fund for Nature(WWF) and one of the We Mean Business Coalition commitments.
Navigant is a specialized, global professional services firm. Our teams apply experience, foresight, and industry expertise to pinpoint emerging opportunities to help build, manage, and protect the business value of the clients we serve.
Gold Standard develops best practice standards to quantify, certify, and maximise impacts toward the Paris Climate Agreement and the Sustainable Development Goals. Its 1400+ certified projects in over 80 countries have created billions of dollars of shared value from climate and development action worldwide.
Primary authors:Alexander Farsan, WWFAndres Chang, CDPAnnemarie Kerkhof, NavigantBence Cserna, WWFChendan Yan, WRIFernando Rangel Villasana, WWFNicole Labutong, CDP
We would like to thank the following people for their contributions to this publication:Eoin White, CDPSarah Leugers, Gold StandardStudents of Utrecht University: Bauke Ketelaar, David van Petersen, Fleur de Haan, Jippe Beltman, Joyce Swanenberg and Max Uyttewaal The Science Based Targets initiative’s Technical Advisory Group
Supported by:

Value Change in the Value Chain: Best Practices in Scope 3 Greenhouse Gas Management | 3
1 Executive summary
Highlights
Introduction: The need to manage scope 3 emissions
About this guidance
Best practices in reducing scope 3 emissions
Emissions reduction levers
How levers interact with each other
Future work
2 Introduction
Global need for emissions reductions
Emissions scopes
Who is responsible?
Company benefits
Scope and audience of this paper
3 Reducing emissions in scope 3
Collecting scope 3 emissions data
Formulating ambition
Emissions reduction levers
Measuring and tracking impact
Danone: Enable Recognition of Milk Value Chain Intervention through New Accounting Framework
4 Business model innovation
5 Supplier engagement
Supplier Engagement Framework
HPE: Engaging Peers to Drive Sector-Wide Supplier Actions
6 Procurement policy & choices
7 Product/service design
Tennant: Driving Innovations in Product Design to Reduce Downstream Emissions
IKEA: Decoupling emissions from growth through circular economy
8 Customer engagement
9 Operational policies
10 Investment strategy
11 How levers interact with each other
12 Future work
Carbon Analytics and Provenance: Applying blockchain to scope 3 emissions calculation and tracking
5
5
5
6
6
7
7
7
8
8
8
9
10
10
11
11
12
13
15
18
19
21
21
28
29
31
33
35
36
38
40
41
42
43
Table of Contents

Value Change in the Value Chain: Best Practices in Scope 3 Greenhouse Gas Management | 4

Value Change in the Value Chain: Best Practices in Scope 3 Greenhouse Gas Management | 5
EXECUTIVE SUMMARY
HIGHLIGHTS
• Companies must help to prevent the worst impacts of climate change by reducing their greenhouse gas (GHG) emissions as much and as quickly as possible, including reducing value chain (i.e. scope 3) emissions. Scope 3 emissions often represent the largest portion of companies’ GHG inventories.
• This paper describes emissions reduction levers companies can employ to reduce emissions across scope 3.
• Since a company’s scope 3 emissions often overlap with other companies’ emissions, strategies to reduce scope 3 emissions are particularly fertile ground for opportunities to identify synergies and collaborate. Scope 3 emissions reduction efforts by one company can therefore lead to emissions reductions in other companies’ inventories.
INTRODUCTION: THE NEED TO MANAGE SCOPE 3 EMISSIONSIn order to mitigate the worst effects of climate change, the global community must take swift and systemic action to reduce its emissions. At the 21st Conference of Parties, nearly 200 countries pledged to keep global emissions within a 2°C temperature increase above pre-industrial levels and pursue efforts to limit temperature increase to 1.5°C. The business community is responsible for the majority of global emissions and must do its part to meet this goal.
1
There is a growing urgency to reduce GHG emissions wherever possible and this includes reducing scope 3 emissions in addition to scope 1 and 2 emissions.
To date, most companies have been focusing on reducing emissions under their direct ownership or operational control (scope 1) and from their purchase of electricity, heat and steam (scope 2). Indirect emissions upstream and downstream in the company’s value chain (scope 3) are often left unabated. In most sectors these emissions make up the majority of a company’s inventory. This differentiation between emission sources for accounting purposes has often been used by companies as justification for not taking responsibility of scope 3 emissions as they fall outside of the company’s direct control or ownership. The lack of direct control and difficulty collecting high quality data can create barriers to reducing these emissions. Scope 3 emissions are also often accounted for by several different companies, which leads to the question of who is responsible for reducing them.
Despite the challenges of addressing indirect emissions, scope 3 not only has huge potential to prevent the worst impacts of climate change, it can also lead to substantial business benefits. Companies can mitigate risks within their value chains, unlock new innovations and collaborations, and respond to mounting pressure from investors, customers and civil society.
There is enormous potential to reduce scope 3 emissions, which would help preserve the rapidly shrinking global carbon budget. Hundreds of companies are already setting scope 3 reduction targets, and, dozens are in line with best practices according to the Science Based Targets initiative (SBTi), which assesses and approves corporate emissions reduction targets in line with climate science.

Value Change in the Value Chain: Best Practices in Scope 3 Greenhouse Gas Management | 6
ABOUT THIS GUIDANCE
To support the growing number of companies committed to address the climate impact of their value chains, this guidance document summarizes the latest best practices in reducing scope 3 GHG emissions by describing different emissions reduction levers companies can employ. Companies using this guidance should have conducted a screening of their scope 3 emissions and have a robust understanding of the GHG emission hotspots in their value chain to enable them to apply the different emissions reduction levers discussed below. It is intended for readers who have knowledge of the GHG Protocol accounting standards and corporate sustainability practices.
BEST PRACTICES IN REDUCING SCOPE 3 EMISSIONS
It is best practice for companies to set emissions reduction targets and/or set targets to engage their suppliers to reduce their emissions in line with climate science. The Science Based Targets initiative provides guidance on setting GHG reduction goals in line with climate science. Best practices in defining scope 3 target ambition would entail setting targets that are, at a minimum, in line with the percentage reduction of absolute GHG emissions required at a global level over the target timeframe. Alternatively, the company may apply a sector-specific method. Though sector-specific methods (i.e. the Sectoral Decarbonization Approach) are designed for scopes 1 and 2, they may be applied to scope 3 where the sectors and scope 3 categories align, e.g. using transport sector pathways for a company’s transport and distribution emissions. Targets should be expressed as emissions reduction targets on both an absolute (a percentage reduction of emissions from a base to a target year) and intensity (a percentage reduction formulated in emissions per an indicator from base to target year) basis. This provides information on the ambition of the target in terms of the absolute tonnes of GHGs being reduced, as well as the GHG intensity improvements. A further mechanism to drive emissions reduction throughout the value chain is engagement targets. The company can commit to influencing a certain set of actors in their value chain, e.g. a percentage of its suppliers, to have GHG reduction targets in place. It is best practice for the targets these actors set to be in line with climate science as well.
Emissions reduction levers are approaches to reduce a company’s climate impact. In essence, reduction levers can be projects, programs, business decisions or other actions that reduce emissions. The levers outlined in this guidance, though they may seem diverse in nature, all either reduce the activity driving emissions, improve the GHG intensity of those activities, or both.
EXECUTIVE SUMMARY

Value Change in the Value Chain: Best Practices in Scope 3 Greenhouse Gas Management | 7
EMISSIONS REDUCTION LEVERS
Business model innovation• Put a price on carbon.• Increase product lifespans.• Consider shifting toward product-service systems.• Increase efficiency in logistics.
Supplier engagement • Engage with suppliers so that they reduce their
emissions, ideally in line with climate science. Identify key suppliers to engage and maintain a collaboration via two-way communication channels, monitor progress regularly, and create incentives for action.
Procurement policy and choices• Continue purchasing the same products, but from
suppliers with lower carbon footprint.• Shift toward low-carbon alternatives.
Product and service design• Design products that are more efficient so that
lifecycle emissions intensity is lower.• Integrate circular economy principles in product
and service design.
Customer engagement• Engage customers either directly through
education, collaboration or compensation, or indirectly through company regulation or customer motivation via marketing and choice architecture.
Operational policies• Develop operational protocols.• Launching operational incentive programs.
Investment strategy• Invest in low-carbon projects and companies and
resilient development, and shift investment away from fossil fuels, accelerating the transition to a low-carbon economy.
HOW LEVERS INTERACT WITH EACH OTHER
These emissions reduction levers work in conjunction with one another, and the interdependency created by overlapping scope 3 inventories provides companies with opportunities for collaboration and innovation. Efforts on multiple fronts can create a virtuous cycle where every company is actively working to reduce emissions in its value chain and benefits from the efforts of other companies. This also creates more robust data to base targets and performance tracking on and helps to create new innovative solutions built upon a systems perspective of the value chain.
FUTURE WORK
“Fourth Wave” technologies such as data analytics, smart sensors, and blockchain will help companies manage their scope 3 impacts by offering powerful insight into complex, global value chains and will help reduce emissions in new ways. These technologies are playing an increasingly important role in business innovation, and business executives agree that implementing new technologies will not only improve their company’s environmental footprint, but also its bottom line.
EXECUTIVE SUMMARY

Value Change in the Value Chain: Best Practices in Scope 3 Greenhouse Gas Management | 8
GLOBAL NEED FOR EMISSIONS REDUCTIONS
At the 21st Conference of Parties, nearly 200 countries pledged to keep global emissions within a 2°C temperature increase, compared to pre-industrial levels, and pursue efforts to limit temperature increase to 1.5°C. These goals, laid out in what is commonly referred to as the Paris Agreement, aim to prevent the worst impacts of climate change. To achieve this monumental ambition, the global community must take bold action and must do so immediately. Systemic and widespread change is necessary from all actors. In addition to countries’ Nationally Determined Contributions (NDCs), a myriad of actors from cities, states, and regions, civil society organizations, investors, individuals and companies are laying out their climate mitigation plans. As of November 2018, there are over 1,800 companies pledging nearly 3,000 individual actions and 600 cooperative actions to reduce emissions according to the UNFCCC’s NAZCA portal. In addition, there are numerous platforms and initiatives through which companies can showcase their emissions reduction efforts, such as We Mean Business, the Science Based Targets initiative, Net Zero 2050, Cement Sustainability Initiative, Global Green Freight Action Plan, Low-Carbon Sustainable Rail Transport Challenge, Oil & Gas Methane Partnership, WWF Climate Savers and We Are Still In.
While the companies committed to the aforementioned initiatives are demonstrating that they endeavor to mitigate climate change, the majority of the private sector still needs to step up its efforts in
order to do its part to achieve climate goals defined under the Paris Agreement. The Science Based Targets initiative’s (SBTi) goal is to make science-based target setting a standard business practice and have a critical mass of companies set science-based targets (SBTs) by the end of 2020. This collaborative effort - by CDP, the UN Global Compact, the World Resources Institute and WWF - has already received commitments from hundreds of the world’s largest companies to set their emissions reduction targets in line with climate science. It provides resources and guidance that companies in nearly every sector can apply across their emissions scopes.
EMISSIONS SCOPES
Part of the global challenge is defining responsibility for the generation of GHGs. The level of influence and control each company has over its emissions is classified by scopes:
• Scope 1: direct emissions from owned or controlled sources;
• Scope 2: indirect emissions from the generation of purchased energy electricity, heat and steam;
• Scope 3: all indirect emissions (not included in scope 2) that occur in the value chain of the reporting company, including both upstream and downstream emissions.
INTRODUCTION
2

Value Change in the Value Chain: Best Practices in Scope 3 Greenhouse Gas Management | 9
WHO IS RESPONSIBLE?
Scope 3 emissions are the largest source of a company’s emissions in most sectors, often accounting for several times the impact of its scope 1 and 2 emissions. In fact, approximately 40% of global GHG emissions are driven or influenced by companies through their purchases (i.e. purchased goods and services) and through the products they sell (i.e. use of sold products).1
To date, most companies have been focusing their efforts on scopes 1 and 2, where they have more direct control. However, as the remaining global carbon budget is being rapidly depleted, there is a growing need to reduce GHG emissions wherever possible. This means also reducing scope 3 emissions (emissions in the company’s value chain).
Companies may see the division of scopes as justification for not taking responsibility for indirect emissions. Scope 3 emissions do fall outside of the company’s direct control/ownership. It is, therefore, more difficult to collect scope 3 data and the inherent control and ownership structure can create barriers to reduce these emissions. However, how scopes are classified for accounting purposes may divide emissions and activities in somewhat arbitrary ways when it comes to who should take responsibility for reductions. For example, one might expect Apple and Samsung to have similar emissions profiles. Yet, since Apple outsources much of its manufacturing - some of it to Samsung - Apple has a much higher portion of emissions in scope 3 than in scopes 1 and 2 compared to Samsung (over 99% and ~61% of total emissions respectively).2
Indirect emissions are also often double or triple counted, with many companies’ value chains significantly overlapping. One company’s direct emissions can be the upstream and/or downstream emissions of others. This could be used as an excuse for inaction - as one company’s emissions inventory overlaps with those of one or more other companies or consumers, the question of responsibility becomes unclear.
At the same time, this overlap creates collaborative opportunities that increase the likelihood of success in both preserving the global carbon budget and meeting company goals. For example, if two companies request a supplier to disclose to CDP, there is a 68% probability that the supplier will respond. If three companies send a response request, then there is a 76% likelihood they will respond. The more requests a supplier receives, the more likely they are to take action and the more likely it is for these companies to achieve their shared supply chain emission reduction goals.
Companies are already demonstrating that it is possible to address scope 3 emissions. Over 2,800 companies that reported to CDP in 2017 reported scope 3 emissions, and 26.7% of these companies calculated emissions for all categories they consider relevant.
Moreover, 368 companies publicly listed scope 3 emissions reduction targets in their 2017 CDP response and over 150 companies have had their targets approved as ‘science-based’ by the Science Based Targets initiative, ~90% of which had scope 3 targets. The opportunity for companies to use their influence within value chains to act as catalysts for the deep decarbonization of the global economy is immense, particularly those segments that other drivers for reductions have difficulties reaching.
1 Global Supply Chain Report 2018 - CDP2 Hugh Sawbridge, Dr. Paul Griffin: Technical Annex IV: Scope 3 Overview and Modelling CDP Full
GHG Emissions Dataset 2016
INTRODUCTION
Value Change in the Value Chain: Best Practices in Scope 3 Greenhouse Gas Management | 10
In addition to the opportunity this presents in preserving the remaining carbon budget, there are several benefits for companies in reducing scope 3 emissions. Improve risk & cost managementThe GHG-intensive segments of a value chain are inherently more vulnerable to risk from increasing resource prices and a changing regulatory landscape, such as increasing production costs of key suppliers, tightening efficiency standards for products, or taxation on carbon emissions. The mapping and mitigation of these risks requires a sophisticated understanding of key sources, hotspots and drivers of GHG emissions across a company’s value chain. In a world committed to ambitious climate action, a robust system for scope 3 accounting and management is, therefore, an essential component of a company’s strategic risk management, and a valuable tool to proactively address value chain risks.
Unlock business opportunities and innovation
As the global economy decarbonizes, existing markets are disrupted and new markets emerge. Staying competitive in this changing landscape means offering solutions that are fit for a low-carbon world. The map of GHG emission hotspots created through scope 3 accounting can dramatically improve companies’ ability to forecast these changes and thus identify emerging business opportunities, as well as at-risk business segments, early.
Taking scope 3 into account also helps companies understand their value chain from a systems perspective, thereby unlocking opportunities for improved design and collaborative innovation with suppliers. Innovation is further catalyzed by ambitious
long-term reduction targets, helping companies to shift their focus from incremental improvements to transformative change.
Respond to external pressures
Pressure on companies from investors, customers, peers, suppliers and civil society to fully measure, manage and reduce their impact on the climate continues to increase. Consequently, reporting and reducing scope 3 emissions has become an integral aspect of reporting frameworks such as the CDP climate change questionnaire, the recommendations of the Task Force on Climate-related Financial Disclosures (TCFD), and initiatives to drive ambitious corporate action like the Science Based Targets initiative and WWF’s Climate Savers program.
SCOPE AND AUDIENCE OF THIS PAPER
To help address the growing need for companies to reduce their scope 3 emissions, this guidance document summarizes the latest best practices in reducing scope 3 GHG emissions by describing different emissions reduction levers companies can employ. Companies employing this guidance should have conducted a screening of their scope 3 emissions and have knowledge of their value chain hot spots so they can apply the different emissions reduction levers discussed herein. It is intended for readers who have knowledge of the GHG Protocol and corporate sustainability practices.
COMPANY BENEFITS
INTRODUCTION

Value Change in the Value Chain: Best Practices in Scope 3 Greenhouse Gas Management | 11
In line with the oft-quoted adage that “you can’t manage what you can’t measure,” quantifying a company’s scope 3 emissions is an essential starting point for effective management. This paper focuses on emissions reductions, but as an initial step, companies should conduct a scope 3 screening to determine which scope 3 categories are most relevant in their value chain. A number of tools are available for companies to conduct a scope 3 screening, including a free Scope 3 Evaluator Tool by the GHG Protocol. Based on the results of the screening, the company
COLLECTING SCOPE 3 EMISSIONS DATA
should pursue an iterative approach to improve the accuracy of its scope GHG inventory by collecting more granular and accurate data for emission hotspots, using primary data where available. Detailed guidance for the calculation of scope 3 inventories is provided in the GHG Protocol Scope 3 Standard as well as the supplementary Technical Guidance document. Once a baseline GHG inventory is established, a company should formulate ambition through reduction targets, plan interventions towards achieving those targets, and finally, measure and track progress against the targets.
REDUCING EMISSIONS IN SCOPE 3
3
Box 1: Avoided emissions
Companies are increasingly interested in quantifying and communicating the GHG impact of their products in comparison to other products that serve equivalent functions. This comparative impact is calculated as the difference in total life cycle emissions between the two products. If the difference is positive, the product has lower life cycle emissions than the reference product. This positive difference is often referred to as “avoided emissions”.
Avoided emissions should be differentiated from scope 3 emissions, as they occur outside of a product’s life cycle (e.g. low-temperature detergents, building insulation) and are the result of a product or service “avoiding” emissions by substituting for a similar, but more carbon intensive alternative. Scope 3, on the other hand, covers only the emissions directly generated during the product lifecycle, upstream and downstream of the company. Products that avoid emissions provide a lower-emissions alternative to those that are more intensive. However, there is currently no standard to account for these emissions within scope 3. Any claims made of avoided emissions should be reported separately from a company’s scope 3 inventory. Calculating and communicating avoided emissions should not take priority over accounting for and reducing emissions directly within a company’s value chain.

Value Change in the Value Chain: Best Practices in Scope 3 Greenhouse Gas Management | 12
Absolute and intensity GHG emission targets
The most robust approach to formulating an ambition for the reduction of a company’s scope 3 impact is setting quantitative emissions reductions targets. These can either be expressed in absolute terms, where the company commits to an absolute reduction of its scope 3 emissions over a defined time frame (e.g. a 30% reduction in emissions by 2030 from a 2018 base-year), or in intensity terms, where the company commits to the reduction of the scope 3 GHG intensity of its activities as measured against a meaningful physical or economic activity indicator over a defined time frame (e.g. a 30% reduction in CO2e/tonne of steel produced by 2030 from a 2018 base-year). Both approaches have advantages and disadvantages.
From the perspective of preserving the global carbon budget, the more robust approach is setting absolute targets. They provide a higher degree of confidence that a company’s scope 3 emissions will reduce in line with the global reductions required by climate science. However, they sometimes fail to capture a company’s emissions impact relative to its activity. In cases where companies don’t grow or even shrink in size, the ambition indicated by an absolute reduction target can be misleading as it does not necessarily reflect improvements in performance. In these cases, a more meaningful way of setting targets is on an intensity basis, which demonstrates ambition while taking increasing or decreasing output into account. Working towards achieving intensity-based targets also often corresponds more closely with how a company can influence scope 3 emissions, i.e. making improvements linked to a specific indicator or unit of output. However, focusing on emission intensity can mean that absolute
emissions increase if intensity reductions aren’t sufficient to compensate for activity growth. Due to these trade-offs, it is best practice to set both absolute and intensity targets for maximum transparency.
Where possible, scope 3 targets should be set in line with the rate of decarbonization required as defined by climate science. Science-based targets help companies determine how much and how fast they need to reduce their emissions to avoid the worst impacts of climate change. The Science Based Targets initiative provides guidance and tools to support companies in setting these targets. Their criteria and recommendations also define other meaningful aspects of targets such as their timeframe and boundaries.
Engagement and other non-emission targets
In some cases, challenges in developing sufficiently accurate scope 3 GHG inventories that allow the tracking of progress towards quantitative GHG emissions reduction targets lead companies to use alternative target formulations to plan and track interventions to achieve emission reductions. A common example of this is supplier engagement targets, where companies commit to moving their suppliers towards a specific course of action, e.g. to set GHG reduction targets themselves. Further examples are targets to engage customers to change their behavior or context-specific ambitions that demonstrably lead to scope 3 emissions reductions. For these alternative target formulations, it is best practice to estimate the emissions reductions the targets will correspond to and explicitly include these into the target formulation.
FORMULATING AMBITION
REDUCING EMISSIONS IN SCOPE 3
Value Change in the Value Chain: Best Practices in Scope 3 Greenhouse Gas Management | 13
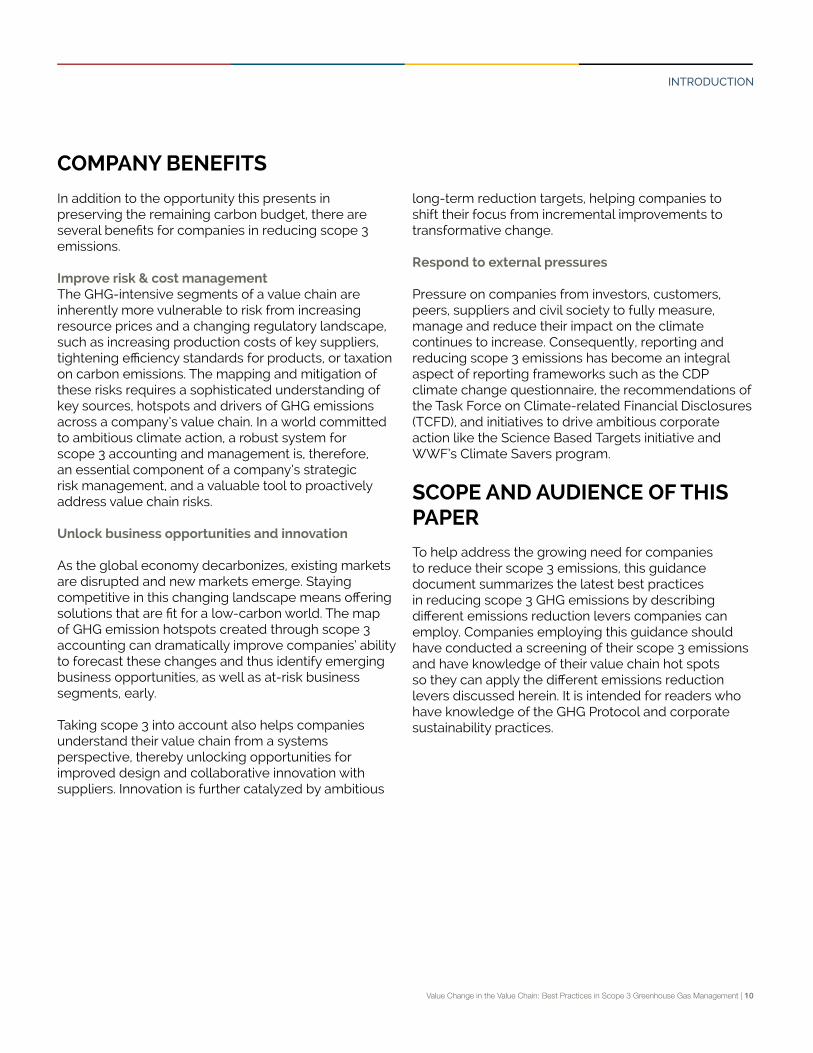
Emissions reduction levers
The GHG impact of any activity can be expressed as a simple product of two drivers: the activity level (e.g. the km driven by a lorry) and the GHG intensity of that
Figure 1: Levers for reducing emissions
Activity level GHG intensity GHG impact
REDUCING EMISSIONS IN SCOPE 3
Many of these reduction measures will have an impact on several different scope 3 categories. Table 1 below provides guidance on which types of measures are most relevant for each scope 3 category. Companies can use the table below to help identify which levers are most relevant for hotspots in their value chain and learn more about the different levers starting in Section 4.
activity (e.g. the amount of CO2e emitted per km driven by a lorry). This relationship is illustrated in Figure 1 below.
These two drivers are simultaneously the levers which companies can address to reduce their GHG impact. Any measure to address one or both of these levers is described as a reduction lever in this guidance. In essence, reduction levers can be projects, programs, business decisions or other actions, which either reduce the level of activity or improve GHG intensity and result in emissions reductions.
The sections below will discuss these different categories of reduction levers:
• Business model innovation • Supplier engagement• Procurement policy and choices • Product and service design • Customer engagement • Operational policies • Investment strategy

Value Change in the Value Chain: Best Practices in Scope 3 Greenhouse Gas Management | 14
Scope 3 Category Most relevant emissions reduction levers
1. Purchased goods and servicesSupplier engagement, procurement policy and choices, product and service design, business model innovation
2. Capital goodsSupplier engagement, procurement policy and choices, product and service design
3. Fuel and energy related activitiesProcurement policy and choices, product and service design, operational policies
4. Upstream transportation and distributionSupplier engagement, procurement policy and choices, product and service design
5. Waste generated in operationsProduct and service design, business model innovation, operational policies
6. Business travel Procurement policy and choices, operational policies
7. Employee commuting Operational policies
8. Upstream leased assets Procurement policy and choices
9. Downstream transportation and distributionSupplier engagement, procurement policy and choices, product and service design
10. Processing of sold products Product and service design, customer engagement
11. Use of sold productsProduct and service design, customer engagement, business model innovation
12. End-of-life treatment of sold productsProduct and service design, customer engagement, business model innovation
13. Downstream leased assets Product and service design, customer engagement
14. Franchises Product and service design, operational policies
15. Investments Investment strategy
Table 1: Levers for reducing emissions by scope 3 category
REDUCING EMISSIONS IN SCOPE 3

Value Change in the Value Chain: Best Practices in Scope 3 Greenhouse Gas Management | 15
While the focus of this paper is emissions reductions in scope 3, measuring and tracking impact is essential to demonstrate progress against reduction targets. Ongoing measurement is needed to validate the effectiveness of interventions towards achieving a company’s reduction targets, including the public reporting of progress to ensure credibility and transparency. A company’s inventory and progress towards its targets should be updated and published on an annual basis.
Approaches to collecting the information needed to track emissions vary by category. While companies with a majority of emissions coming from purchased goods and services might need to engage directly with suppliers to collect data, companies with energy-consuming products could use surveys and polls to map customer behavior. However, while companies need to work on specific solutions individually, the main principles and processes remain the same for all entities.
An example of impact tracking initiatives is the Assessing low-Carbon Transition (ACT) project by ADEME and CDP. The initiative estimates, rates and classifies organizations’ progress in transitioning to a low-carbon economy, including measuring progress toward targets. It predicts future trends based on recent data with sector specific methodologies. The evaluation is based on five aspects of the low-carbon transition: 1) commitment to a low-carbon vision, 2) transition plan to achieve targets, 3) actions to decrease emissions in the short-term and in the long-term, 4) impact of past decisions and 5) strategy
consistency with emissions reduction targets. The method combines quantitative and qualitative information in order to rate the organizations based on performance, assessment and trend ratings.
Standardized Measurement, Reporting and Verification (MRV) processes are already widely applied. For example they provide support for keeping Nationally Determined Contributions on track or for the European Union Emissions Trading System to operate in a robust, consistent and accurate way. Corporations with ambitious emissions reduction targets need to measure and disclose the actual state of their GHG reductions goal to recognize gaps and inform stakeholders.
An MRV process involves three steps:
• Measure or monitor (direct or estimation) of emissions, mitigation measures and support.
• Report the interpreted data and findings in accordance with a standard.
• Verify accuracy and completeness to establish credibility.
MRV processes can be implemented for GHG emissions at national, sub-national, sector, organization, facility or product level. They include measuring or estimating, reporting and verifying emissions over a specified reporting period. MRV can also provide valuable analytical insights into the progress and effectiveness of mitigation measures by assessing emissions reduction projects and actions.3 Companies should build on existing best practice for MRV when designing their internal processes.
3 WRI: MRV 101
MEASURING AND TRACKING IMPACT
REDUCING EMISSIONS IN SCOPE 3
Value Change in the Value Chain: Best Practices in Scope 3 Greenhouse Gas Management | 16
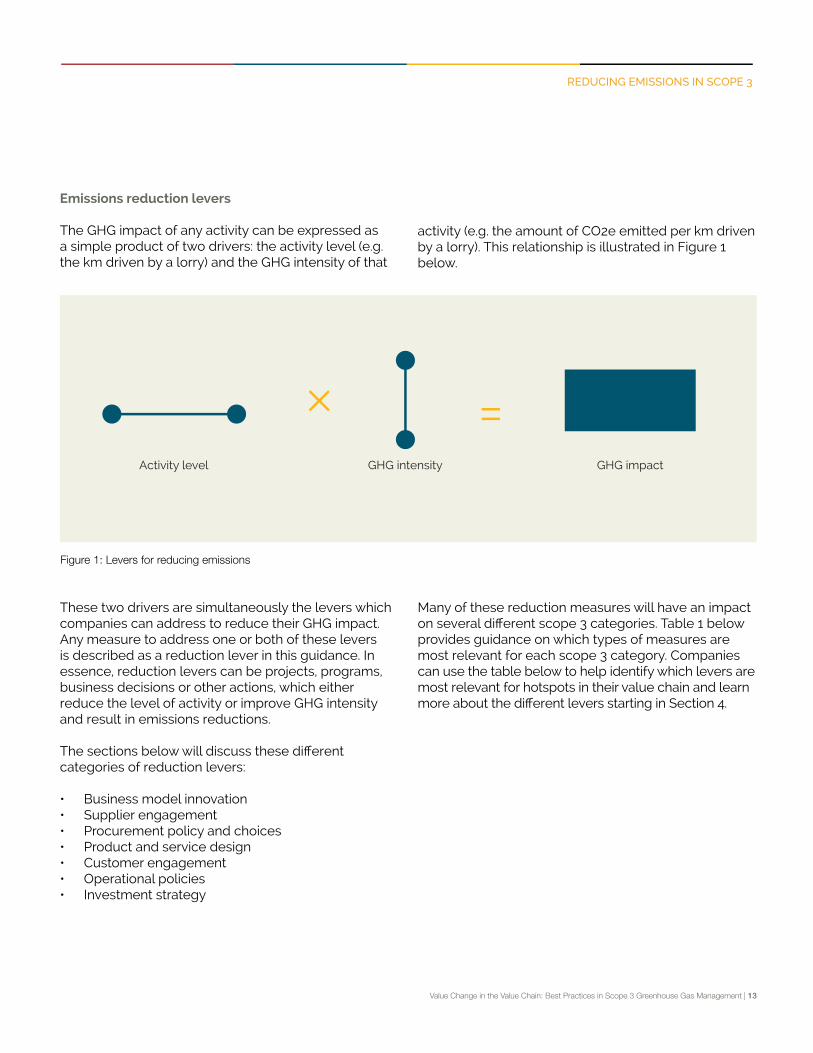
Box 2: Making assumptions to fill gaps in primary scope 3 data
While primary data may often be limited, aggregated data (e.g. information reported to CDP) helps to identify emissions hotspots in different sectors. Where developing a complete scope 3 inventory is impractical, companies can use sectoral information to conduct a gap analysis and determine where to focus measurement efforts. Figure 2 illustrates the average breakdown of scope 3 emissions in each of the GHG Protocol scope 3 categories for the highest emitting sectors.
REDUCING EMISSIONS IN SCOPE 3
Figure 2: Percentage of scope 3 emissions per category for SBTi sectors with the most committed and approved companies as of November 2018
Automobiles & Components
Food & Beverage Progessing Banks, Diverse Financials, Insurance
Banks, Diverse Financials, Insurance
Real Estate
Construction & Engineering Retailing
Pharmaceuticals, Biotechnology & Life Sciences
Electric Utilities &Independent Power Producers
Textiles, Apparel, Footwearand Luxury Goods
Technology Hardware & Equipment Professional Services
Electrical Equipment & Machinery
Software & Services Telecommunication Service
End of life treatment of sold productsDownstream leased assetsFranchisesInvestmentsOthers
EmployeeUpstream leased assetsDownstream transportation and distributionProcessing of sold productsUse of sold products
Purchased goods and servicesCapital goodsFuel-and-energy-related activities (not included in Scope 1 or 2)Upstream transportation and distributionWaste generated in operationsBusiness travel

Value Change in the Value Chain: Best Practices in Scope 3 Greenhouse Gas Management | 17
As mentioned above, creating an inventory is not always straightforward and there may be barriers against formulating robust emissions reduction targets. Firstly, according to the GHG Protocol Scope 3 Standard it is at the discretion of the company to choose between one of three different consolidation approaches to draw the boundaries of the inventory. While the flexibility allows the company structure to be considered, this also provides difficulty with data aggregation, reporting consistency and the comparability of the results. As noted above, classification of scopes may vary significantly within the same sector depending on how the company chooses to draw its boundaries. In addition, emissions can move from one scope to another, leading to reductions in a particular scope, without changing total emissions. Similarly, the criteria for identifying “relevant” scope 3 activities are qualitative, which leads to ambiguity in their interpretation (see Table 6.1 of the GHG Protocol Scope 3 Standard). Furthermore, primary versus modeled data can produce substantially different results. Many companies tend to report more emissions in categories where it’ is easy to collect information (e.g. business travel) despite it being insignificant compared to other categories. Companies should be mindful of these challenges as they make assumptions, set boundaries, and develop their inventory so that they can do their best to avoid overestimating or underestimating their scope 3 emissions.
REDUCING EMISSIONS IN SCOPE 3

Value Change in the Value Chain: Best Practices in Scope 3 Greenhouse Gas Management | 18
Danone: Enable Recognition of Milk Value Chain Intervention through New Accounting Framework
In November 2015, Danone, a leading global food and beverage company, committed to reduce its full scopes 1, 2 and 3 emission intensity by 50% between 2015 and 2030, covering 100% of its total scope 3 emissions.
Danone has implemented numerous emissions reduction measures in the U.S., Europe and Africa, including redesigning farmers’ feeding strategies and capturing and converting biogas emissions from manure to energy. As a top global dairy producer, Danone promotes regenerative milk production practices which improve soil carbon sequestration, a process in which CO2 is removed from the atmosphere and stored in a soil carbon pool that has the capacity to store or release carbon. In France, the company is aiming to leverage regenerative agricultural practices to achieve a 15% reduction in farm-level emissions by 2025.
Danone’s supply chain is complex and global: its milk is sourced directly from 120,000 suppliers, many of which are subsistence farms with fewer than ten cows. Danone has used the Cool Farm Tool to measure the emissions impact of dairy farms. To generate emissions estimates from its global suppliers, the company developed a framework of representative farms across the globe that are monitored daily, and extrapolates data from these farms to similar ones. While recognizing the importance of collecting high-quality data, Danone also sees the importance of identifying which farming practices drive the most improvement in soil carbon sequestration. Instead of striving for exhaustive data collection, which can be costly and overwhelming, Danone’s proxy assessment is more feasible and cost-efficient. The data on soil quality and degradation Danone collects is now quite precise. Though it may not be comprehensive, using a proxy assessment with representative farms is sufficient for Danone to develop strong models to assess the correlation between change in farm practices and change in soil conditions. However, Danone still faces the challenge of accounting for emissions reductions from changes in farm practices in line with Greenhouse Gas Protocol standards and its science-based targets. To address this challenge, in 2018, Danone joined forces with several leading companies to pilot a new Accounting Framework led by the Gold Standard that enables inclusion of value chain activities in reporting towards targets. Using the guidance, companies can account for interventions, include them in emissions reporting to the maximum credible amount.They can also quantify and communicate about any additional emissions reductions and carbon sequestration beyond what can be claimed in their own GHG inventory to capture the “net emissions change” resulting from the interventions they introduce. This framework will be released in 2019 as part of a larger ‘Value Change’ program that includes this guidance document, supported by EIT Climate-KIC. The framework will then seek “built on GHG Protocol” status.
Together with Gold Standard, Danone developed a specific method for calculating and accounting for soil carbon sequestration. With a plan to seek approval for the guidance to use the Built on GHG Protocol mark, Danone will be able to account for emissions reductions for many of its farming practices in a way that is consistent with the GHG Protocol Scope 3 Standard and the Science Based Targets initiative criteria.
Being able to credibly account for emissions reductions and identify the right practices creates strong incentives for Danone to make value chain investments that reduce scope 3 emissions.
REDUCING EMISSIONS IN SCOPE 3

Value Change in the Value Chain: Best Practices in Scope 3 Greenhouse Gas Management | 19
COLLECTING SCOPE 3 EMISSIONS DATA
Companies can shift to or create new innovative business models to substantially reduce their scope 3 emissions. Reconsidering what the company can offer and how it can be offered at a systematic level can help it meet marketplace demands and generate revenue in new ways while reducing emissions across the value chain.
PUT A PRICE ON CARBON
Emissions performance can be assigned a monetary value by putting an internal price on carbon that covers scope 3 emissions. This creates a financial incentive for low-carbon business models and can catalyze the development of innovative approaches. A carbon price can also be used to collect fees that can then be reinvested in new low-carbon activities, products and services.
A price on carbon can cover both upstream and downstream emissions. For upstream emissions, the carbon price can be used, for example, as a factor influencing materials sourcing. Likewise, it can be a metric that can influence supplier behavior or inform a company’s purchasing policy (see Supplier Engagement and Procurement Policy sections). Downstream, a carbon price can help reduce emissions through more informed product designs that reduce waste and emissions in the use or end of life phases of a product. It can also financially quantify the environmental performance of products or services relative to those of a company’s competitors.
According to CDP, in 2017 nearly 1,400 companies were already factoring an internal carbon price into their business plans, an eight-fold increase from four years ago. This includes over 100 Fortune 500 companies with annual revenues of approximately USD$7 trillion.4 The number is expected to continue to increase alongside external pressures from climate regulation and carbon taxes. For those companies that aren’t already setting a price on carbon as a response to policies (most are concentrated in North America and Europe), setting one now can prepare them for future regulation.
Regardless of whether a carbon price is in place, there are two partly related trends companies may want to consider to positively influence emissions performance: increasing product lifespans and shifting from products to services.
INCREASING PRODUCT LIFESPANS
Finding ways to increase product life spans reduces emissions associated with creating new products i.e. the emissions from the embodied energy of materials used to create the new products and the processing of these materials. Business models need to be reconsidered in that customers would likely have to pay a larger upfront cost for a more durable and longer-lasting product, but would save money in the long run by eliminating the need for replacements or repairs. A paper by BSR, Sustainable Business Models: Time for
BUSINESS MODEL INNOVATION
4
4 https://www.cdp.net/en/climate/carbon-pricing

Value Change in the Value Chain: Best Practices in Scope 3 Greenhouse Gas Management | 20
Innovation, provides some innovative prototypes that might inspire new ways of thinking. Another approach to amortize the increased production costs is turning from a product to a service model, discussed below.
PRODUCT-SERVICE SYSTEMS
Finding successful business models that are profitable but reduce the promotion of unnecessary consumerism likewise decrease material demand. Product-service systems, for example, provide services as well as products for collaborative consumption with the intention of reducing environmental impact.
Redefining the way we think about product ownership by sharing products eliminates the aforementioned emissions associated with new products. Belongings can remain idle for long periods of time (e.g. the average European car is only in use 2% of its lifetime).5 Thus, there is an opportunity to decrease material demand by creating services that share high-valued assets among multiple parties (e.g. Lyft). Another example is providing a platform for online shopping thereby reducing the need for brick and mortar stores. Companies can also enable employees to reduce business travel or commuting by using technologies like conferencing services.
While the extension of a product’s life span and a higher rate of use may increase the emissions per product, setting an intensity reduction target with a denominator that takes the full product life cycle and the useful service (e.g. efficiency in the use phase) of the product into account would adjust for
this. An added benefit is that services are also generally associated with higher value added than goods (with some exceptions).
REALISING EFFICIENCIES IN LOGISTICS
Companies should consider optimizing their logistical network to reduce downstream scope 3 emissions. One option is to reduce the distance that goods travel through intelligent route planning systems, strategic placement of warehouse and distribution centers, and minimal intermediate storage. New production sites should be located close to key customers and consumption centers to reduce shipping distances. Additionally, companies should reduce the GHG intensity of a tonne-km by shifting toward more efficient modes of transport e.g. from road haulage to rail or from air freight to sea freight or by improving the efficiency of current transportation modes, which can be achieved by increasing back-haulage, load capacity, and load factors.
The Global Logistics Emissions Council (GLEC) Framework for Logistics Emissions Methodologies provides detailed guidance on accounting for the GHG impact of logistics and shipping. Further guidance for designing interventions to reduce emissions from logistics and shipping can be found in the Low Carbon Freight program of the Low Carbon Technology Partnerships initiative (LCTPi).
5 https://media.sitra.fi/2018/06/12132041/the-circular-economy-a-powerful-force-for-climate-mitigation.pdf
BUSINESS MODEL INNOVATION

Value Change in the Value Chain: Best Practices in Scope 3 Greenhouse Gas Management | 21
Within a company’s value chain, upstream emissions are indirect GHG emissions related to purchased or acquired goods and services, capital goods, upstream transport and distribution, business travel, etc. These emissions span scope 3 categories 1 to 8 of the GHG Protocol.6 The most significant of these stem from purchased goods and services (category 1).
On average, supply chain emissions are approximately four times that of operations; this number is lower for companies further up in the value chain, like energy and mining companies, and higher for companies lower down in the value chain, like retailers.7 A large number of companies are engaging with their supply chain, and the number is quickly growing.
Supply chain emissions can be reduced by one or more of the following:
1. Optimizing a company’s own production processes resulting in reduced demand for goods and services (see Operational Policies section);
2. Making different purchasing decisions to favor low-carbon products or services (see Procurement Policies section);
3. Purchasing from suppliers with a low carbon footprint (see Procurement Policies section); and
4. Engaging with suppliers to reduce emissions across the value chain (see below).
The following section provides a framework for supplier engagement that can be employed by a wide range of companies to address their upstream emissions.
SUPPLIER ENGAGEMENT FRAMEWORK
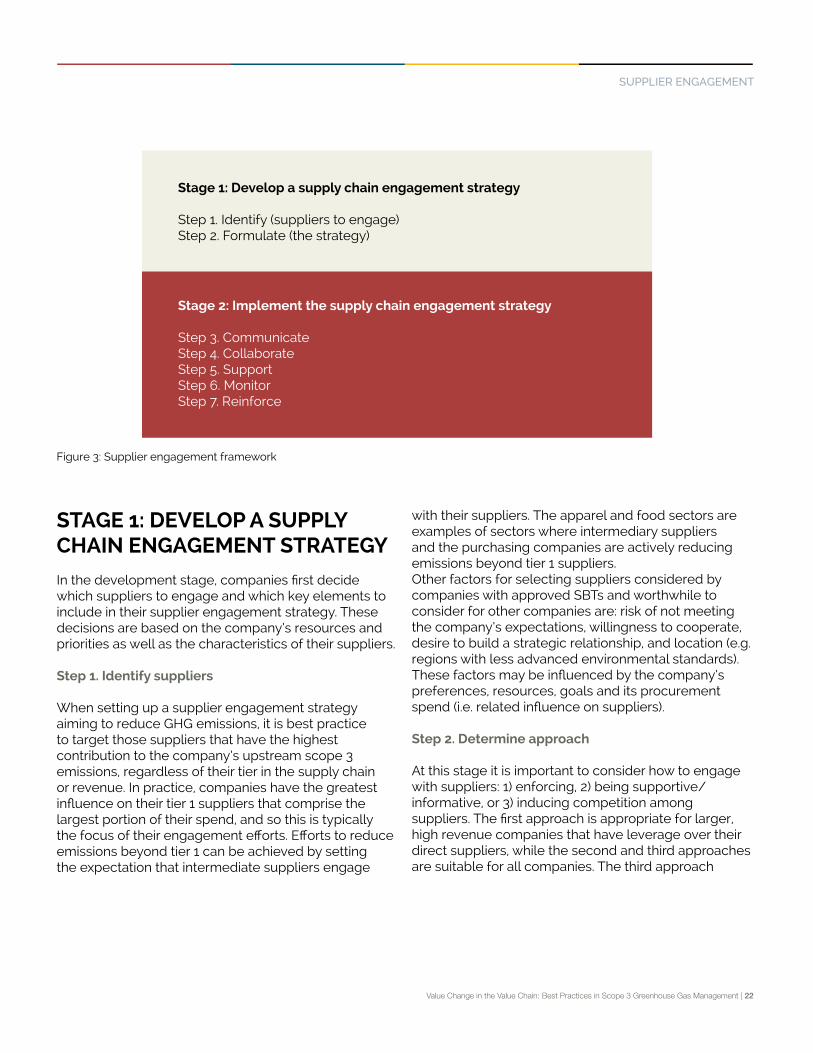
The framework in Figure 3 below describes how an effective supply chain engagement strategy can be developed and implemented. Companies may choose to adopt one or more of these of the options presented at each step of the framework. These best practices are based on an analysis of approaches used by the first 105 companies that have had their science-based targets8 approved through the Science Based Targets initiative (SBTi). Approximately 90% of the first 105 companies with SBTs have targets that address upstream scope 3 emissions. The other 10% only target consumers for reducing downstream scope 3 emissions or do not specify how they influence their suppliers.
SUPPLIER ENGAGEMENT
5
6 GHG Protocol: Corporate value chain (scope 3) accounting and reporting standard7 CDP: Committing to climate action in the supply chain8 Research was carried out by Master students of Utrecht University Navigant in 2018
Value Change in the Value Chain: Best Practices in Scope 3 Greenhouse Gas Management | 22
STAGE 1: DEVELOP A SUPPLY CHAIN ENGAGEMENT STRATEGY
In the development stage, companies first decide which suppliers to engage and which key elements to include in their supplier engagement strategy. These decisions are based on the company’s resources and priorities as well as the characteristics of their suppliers.
Step 1. Identify suppliers
When setting up a supplier engagement strategy aiming to reduce GHG emissions, it is best practice to target those suppliers that have the highest contribution to the company’s upstream scope 3 emissions, regardless of their tier in the supply chain or revenue. In practice, companies have the greatest influence on their tier 1 suppliers that comprise the largest portion of their spend, and so this is typically the focus of their engagement efforts. Efforts to reduce emissions beyond tier 1 can be achieved by setting the expectation that intermediate suppliers engage
with their suppliers. The apparel and food sectors are examples of sectors where intermediary suppliers and the purchasing companies are actively reducing emissions beyond tier 1 suppliers.Other factors for selecting suppliers considered by companies with approved SBTs and worthwhile to consider for other companies are: risk of not meeting the company’s expectations, willingness to cooperate, desire to build a strategic relationship, and location (e.g. regions with less advanced environmental standards).These factors may be influenced by the company’s preferences, resources, goals and its procurement spend (i.e. related influence on suppliers).
Step 2. Determine approach
At this stage it is important to consider how to engage with suppliers: 1) enforcing, 2) being supportive/informative, or 3) inducing competition among suppliers. The first approach is appropriate for larger, high revenue companies that have leverage over their direct suppliers, while the second and third approaches are suitable for all companies. The third approach
Figure 3: Supplier engagement framework
Stage 1: Develop a supply chain engagement strategy
Step 1. Identify (suppliers to engage)Step 2. Formulate (the strategy)
Stage 2: Implement the supply chain engagement strategy
Step 3. CommunicateStep 4. CollaborateStep 5. SupportStep 6. MonitorStep 7. Reinforce
SUPPLIER ENGAGEMENT
Value Change in the Value Chain: Best Practices in Scope 3 Greenhouse Gas Management | 23
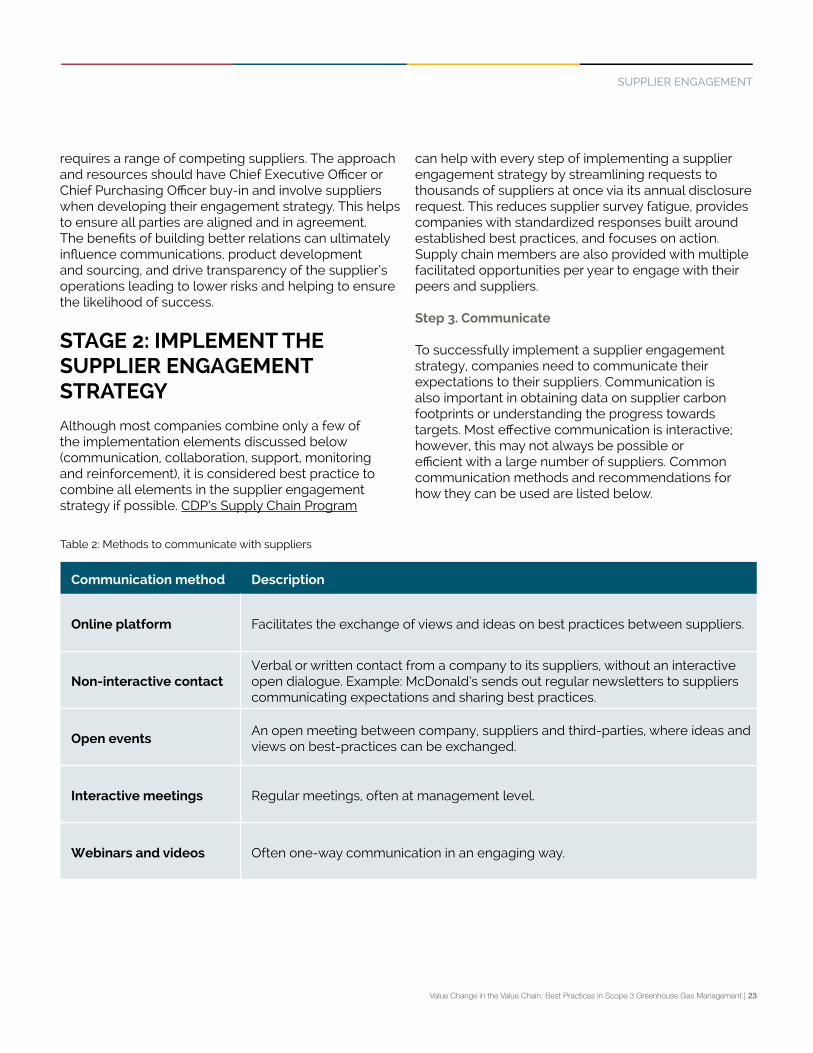
Communication method Description
Online platform Facilitates the exchange of views and ideas on best practices between suppliers.
Non-interactive contactVerbal or written contact from a company to its suppliers, without an interactive open dialogue. Example: McDonald’s sends out regular newsletters to suppliers communicating expectations and sharing best practices.
Open eventsAn open meeting between company, suppliers and third-parties, where ideas and views on best-practices can be exchanged.
Interactive meetings Regular meetings, often at management level.
Webinars and videos Often one-way communication in an engaging way.
Table 2: Methods to communicate with suppliers
requires a range of competing suppliers. The approach and resources should have Chief Executive Officer or Chief Purchasing Officer buy-in and involve suppliers when developing their engagement strategy. This helps to ensure all parties are aligned and in agreement. The benefits of building better relations can ultimately influence communications, product development and sourcing, and drive transparency of the supplier’s operations leading to lower risks and helping to ensure the likelihood of success.
STAGE 2: IMPLEMENT THE SUPPLIER ENGAGEMENT STRATEGY
Although most companies combine only a few of the implementation elements discussed below (communication, collaboration, support, monitoring and reinforcement), it is considered best practice to combine all elements in the supplier engagement strategy if possible. CDP’s Supply Chain Program
can help with every step of implementing a supplier engagement strategy by streamlining requests to thousands of suppliers at once via its annual disclosure request. This reduces supplier survey fatigue, provides companies with standardized responses built around established best practices, and focuses on action. Supply chain members are also provided with multiple facilitated opportunities per year to engage with their peers and suppliers.
Step 3. Communicate
To successfully implement a supplier engagement strategy, companies need to communicate their expectations to their suppliers. Communication is also important in obtaining data on supplier carbon footprints or understanding the progress towards targets. Most effective communication is interactive; however, this may not always be possible or efficient with a large number of suppliers. Common communication methods and recommendations for how they can be used are listed below.
SUPPLIER ENGAGEMENT

Value Change in the Value Chain: Best Practices in Scope 3 Greenhouse Gas Management | 24
Types of agreements
Description Recommended use Company Examples
Company-set standards
General minimum requirements set for suppliers, for example with a code of conduct or section in the contract.
Companies with goals distinct from those described in third-party standards.
Capgemini Group: every supplier has to accept and acknowledge the Supplier Standards of Conduct. Capgemini only works with suppliers and partners who accept and operate under its core principles.
Promote action
Promote action for GHG emissions reduction by supplier, usually without obligations. This includes marketing, informing, communicating expectations, and lobbying. A soft agreement, that can be applied to direct and indirect suppliers.
For companies that want a less direct approach, perhaps with suppliers who are not as far along in their emissions reduction journey.
Tesco: informs suppliers through the Tesco Supplier Network, an online engagement platform, Tesco employees, and expert organizations. An active online community of suppliers, who are engaged on the issue of carbon reductions, in which practical advice on carbon reduction and sustainability is shared.
Joint venture/ project
A project regarding GHG emissions reduction measures, undertaken in equal measure by a company and supplier, retaining their distinct identities.
For companies with intertwined activities with the supplier e.g. in emissions sources, location, operations, equity.
Suez: collaborates with upstream and downstream partners through industrial symbiosis, e.g. the industrial symbiosis initiative with Shanghai Chemical Industry Park (SCIP), which is among Asia’s biggest petrochemical platforms.
Third-party standards
Minimum requirements set for suppliers, as defined by an external independent organization, such as ISO.
For companies that seek established recognition and want to invest limited time in developing bespoke requirements.
Coca-Cola HBC: recognize supplier certifications as per international standards (ISO9001,14001,50001, FSSC2200 & OHSAS18001).
Rating / scoring system
A comparative assessment of supplier standards, quality, GHG emissions reduction performance and progress, creating competition.
For companies that want to engage large numbers of suppliers and assess them against widely-recognized best practices.
Hewlett Packard Enterprise: HPE’s manufacturing spend has a social and environmental responsibility (SER) scorecard. A supplier’s SER score acts as a multiplier to its general supplier management score. This allows suppliers with strong SER performance greater opportunities for new or expanded business with HPE.
Table 3: Methods to collaborate with suppliers and company examples
SUPPLIER ENGAGEMENT
Value Change in the Value Chain: Best Practices in Scope 3 Greenhouse Gas Management | 25
Step 4. Collaborate
This is arguably the most important element of the engagement strategy. How a company sets collaboration agreements with their suppliers differs based on how they wish to influence the behavior of the suppliers they are targeting. Methods can be forceful (‘company-set standards’, ‘third party standards’ and ‘tailor-made contracts’), voluntary (‘promotion of GHG reduction’) or competitive (‘rating/scoring system’). ‘Company-set standards’ and ‘promoted action’ are the most commonly used methods since influencing suppliers to reduce emissions is a new working field, and these two methods can augment existing sustainability strategies. For example, if a company has already set certain standards for their suppliers, like a Request for Proposal or in contracts, including GHG emissions reduction can be a relatively easy addition.
Two other agreements, ‘joint venture/project’ and “cascade’, are complementary to those above because they are most often found in combination with one of the other five types of agreement. In the ‘cascade” method a company encourages a number of suppliers to take certain measures, which require the supplier to request a similar action from their suppliers. This is useful for companies where most emissions
stem from beyond tier 1. In a tailor-made contract minimum requirements are set for individual suppliers, depending on the characteristics of the supplier. This approach is recommended for companies that want to emphasize specific actions from suppliers, especially those that have a high potential to drive emissions impact.
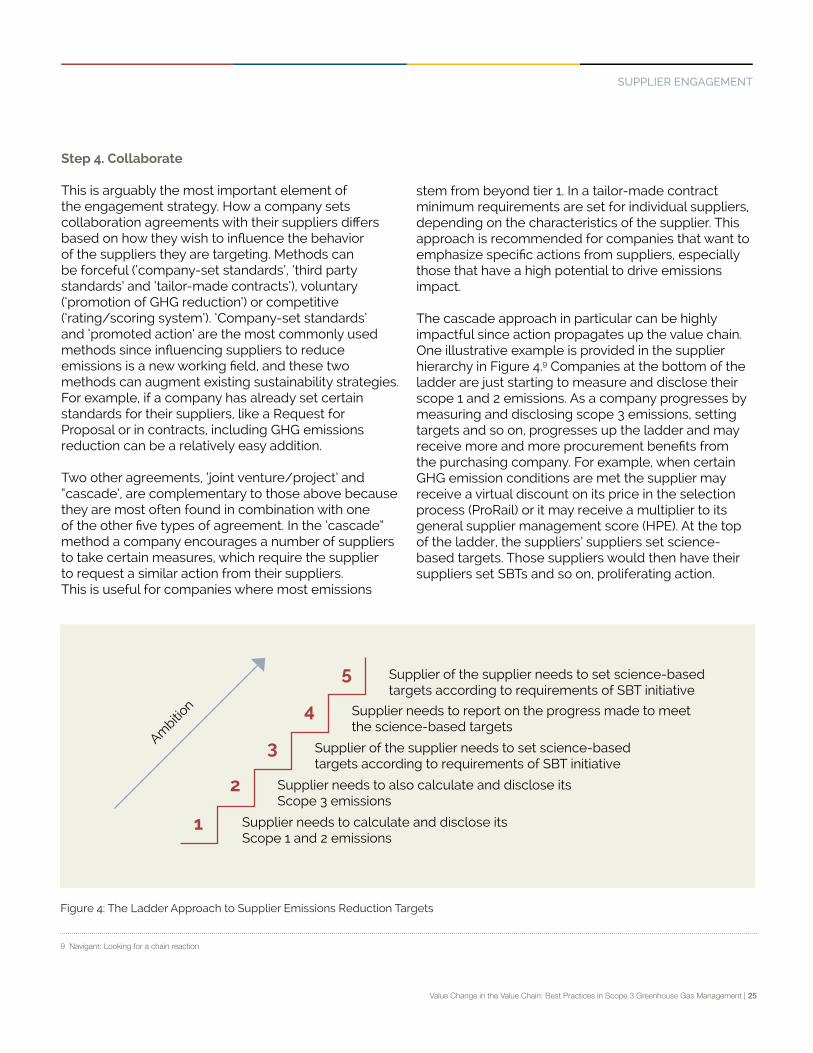
The cascade approach in particular can be highly impactful since action propagates up the value chain. One illustrative example is provided in the supplier hierarchy in Figure 4.9 Companies at the bottom of the ladder are just starting to measure and disclose their scope 1 and 2 emissions. As a company progresses by measuring and disclosing scope 3 emissions, setting targets and so on, progresses up the ladder and may receive more and more procurement benefits from the purchasing company. For example, when certain GHG emission conditions are met the supplier may receive a virtual discount on its price in the selection process (ProRail) or it may receive a multiplier to its general supplier management score (HPE). At the top of the ladder, the suppliers’ suppliers set science-based targets. Those suppliers would then have their suppliers set SBTs and so on, proliferating action.
9 Navigant: Looking for a chain reaction
1 Supplier needs to calculate and disclose its Scope 1 and 2 emissions
Supplier of the supplier needs to set science-based targets according to requirements of SBT initiative
2
3
4
5
Supplier of the supplier needs to set science-based targets according to requirements of SBT initiative
Supplier needs to also calculate and disclose its Scope 3 emissions
Supplier needs to report on the progress made to meet the science-based targets
Ambitio
n
Figure 4: The Ladder Approach to Supplier Emissions Reduction Targets
SUPPLIER ENGAGEMENT

Value Change in the Value Chain: Best Practices in Scope 3 Greenhouse Gas Management | 26
Engagement actors Types of support
Company to supplier
• Workshop / training• Goal setting• Technical guidance• Financial support
Supplier to supplier • Knowledge sharing
Third party to supplier• Workshop / training• Tools (e.g. frameworks or software)
Methods to track progress Description and recommendations for use
Private reporting of supplier to company
• Reporting information can be tailored to the company’s specific needs.
Public reporting of supplier• Established mechanisms and questionnaires can streamline
information asks to suppliers from multiple purchasers.
Audits • Costly and time consuming but the most accurate.
Table 4: Ways companies can support suppliers by engagement actor
Table 5: Methods to track supplier progress
Step 5. Support
Companies can provide financial support, resources, or information to help suppliers meet their agreements. Some methods are more time and labor intensive to carry out than others. As an example, Tetrapak provided all of its base material suppliers with training, support and material for data collection. The interaction is handled by the purchasing organization as an integral part of their ongoing partnership. The types of support
Step 6. Monitor
This step tracks whether or not parties are sticking to the agreements they made with the company, and
listed below are grouped by the source of support:
Some suppliers have also started to hold their purchasers accountable as well. The Better Buying Index empowers suppliers to assess apparel, footwear, and household textile retailer purchasing practices. This anonymous platform allows suppliers to share information about the companies they work with.
whether GHG emissions reductions are resulting from these agreements. Methods are described in Table 5.
SUPPLIER ENGAGEMENT

Value Change in the Value Chain: Best Practices in Scope 3 Greenhouse Gas Management | 27
Methods to reinforce supplier behavior
Description and recommendations for use
Priority in contract procurementGiving high-performing suppliers priority in contract biddings, or making environmental performance a part of the procurement decision in a different way.
Improvement programMandatory implementation of an improvement program to measure and reduce the climate impact of the supplier.
Switch supplierChanging to another supplier, when supplier is not fulfilling the agreement. Likely a last resort for failure to comply.
Private appraisal Award a supplier with non-public appraisal.
Table 6: Methods to reinforce supplier behavior
Step 7. Reinforce
This important step involves providing incentives for the suppliers to uphold their end of the agreement. The company can choose to enforce positive or negative
consequences as a response to the success or failure of a supplier in carrying out an agreement as outlined in Table 6.
SUPPLIER ENGAGEMENT

Value Change in the Value Chain: Best Practices in Scope 3 Greenhouse Gas Management | 28
HPE: Engaging Peers to Drive Sector-Wide Supplier Actions
A radical transformation in IT procurement is happening today as manufacturers feel the increasing weight of sustainability in purchasing decisions. It is increasingly clear that collective action is needed to drive low-carbon strategies. Solutions lie in the innovations and standards that companies like Hewlett Packard Enterprise (HPE) drive.
In 2017, HPE launched the world’s first comprehensive supply chain management program based on science to manage the climate impact of its suppliers. To create a long-term commercial incentive for its suppliers, HPE committed that by 2025, 80% of HPE’s manufacturing spend will go to suppliers with science-based targets in place. As part of the goal, HPE will reduce manufacturing-related GHG emissions on an absolute basis within its supply chain by 15% by 2025. HPE was an early mover in the IT industry to establish a supply chain goal that is in line with climate science.
HPE is enabling its suppliers to set science-based targets within their own operations.The company is working with partners to develop tools that suppliers can use to customize and achieve their own science-based targets. HPE is also providing them with tailored feedback, as well as webinars on setting and achieving SBTs, best-in-class climate management systems and renewable energy procurement. This helps suppliers overcome complexities involved in target-setting, measuring ongoing progress and achieving reductions.
The IT industry has a complex supply chain with a vast global reach and suppliers that often share multiple customers. The shared supply chain of the electronics industry provides an opportunity to send a strong and consistent signal from customers and the industry broadly to adopt SBTs. HPE sees the need to create a unified approach to enable climate ambition by ensuring suppliers are held to a common standard with common goals derived from a common set of values, and encourages companies to use accountability and transparency as a lever for action. There is opportunity for the industry to align by replicating HPE’s best-in-class measures such as publicly reporting supplier social and environmental responsibility (SER) performance, or tying SER performance directly to purchasing decisions via scorecards that align with CDP leadership standards.
Holistically, this is a commitment to taking a leadership stance with a goal to catalyse the industry and set a new global standard. Partnering with BSR and POINT380, HPE is creating a white paper that outlines a supply chain standard for GHG emissions engagement and abatement. Much like assessment fatigue and duplication of data collection may be overcome via collaboration, reducing duplication and the value of consistent messages from customers is clear. A group of customers requesting a supplier complete a common training on a common topic is much more impactful than a single customer.
To be released in the first half of 2019, the white paper will shed light on HPE’s emissions calculation method and science-based target setting process and methods. It will also highlight the business case for the IT industry to act on climate change. Most importantly, It will serve as a call to action to the IT industry and beyond — helping laggard suppliers progress to a leadership position by providing them with a pathway to a best-in-class SBT strategy as part of an industry standardized approach.
In order to truly move the needle in the IT industry and beyond, HPE is challenging other companies to join them in compelling their suppliers to set science-based targets and work collectively across the IT supply chain to implement best in class capability-building programs.
SUPPLIER ENGAGEMENT
Value Change in the Value Chain: Best Practices in Scope 3 Greenhouse Gas Management | 29
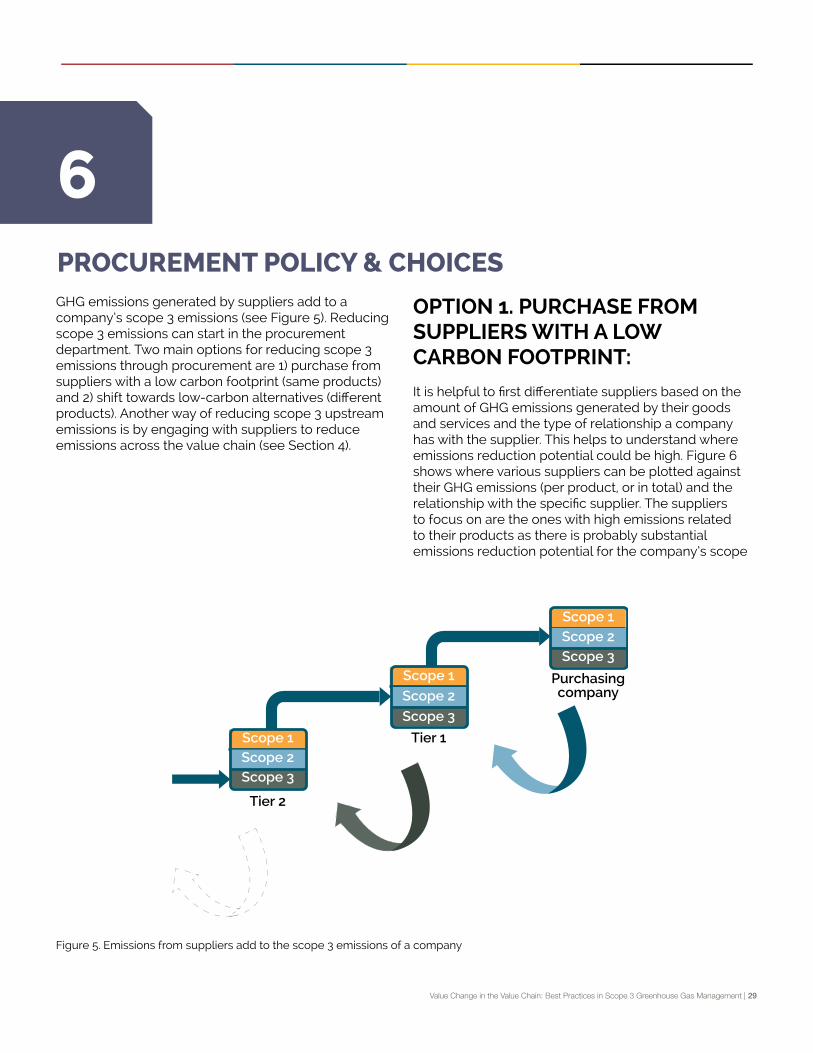
GHG emissions generated by suppliers add to a company’s scope 3 emissions (see Figure 5). Reducing scope 3 emissions can start in the procurement department. Two main options for reducing scope 3 emissions through procurement are 1) purchase from suppliers with a low carbon footprint (same products) and 2) shift towards low-carbon alternatives (different products). Another way of reducing scope 3 upstream emissions is by engaging with suppliers to reduce emissions across the value chain (see Section 4).
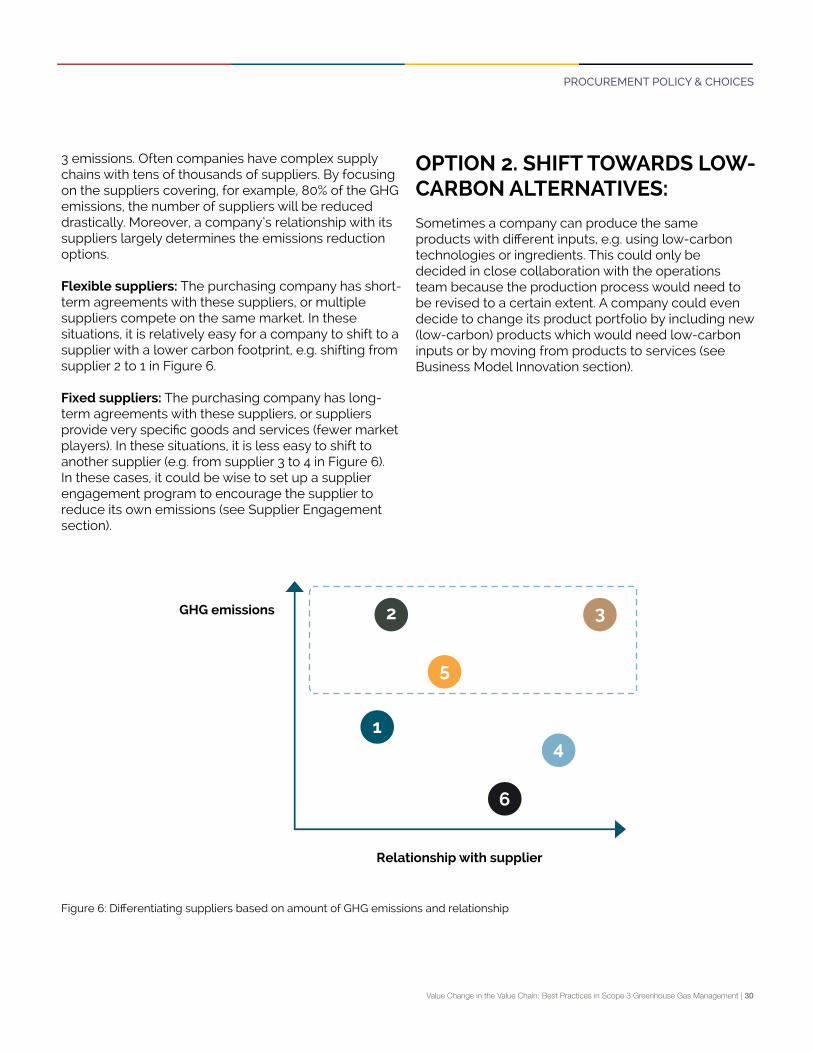
OPTION 1. PURCHASE FROM SUPPLIERS WITH A LOW CARBON FOOTPRINT:
It is helpful to first differentiate suppliers based on the amount of GHG emissions generated by their goods and services and the type of relationship a company has with the supplier. This helps to understand where emissions reduction potential could be high. Figure 6 shows where various suppliers can be plotted against their GHG emissions (per product, or in total) and the relationship with the specific supplier. The suppliers to focus on are the ones with high emissions related to their products as there is probably substantial emissions reduction potential for the company’s scope
PROCUREMENT POLICY & CHOICES
6
Figure 5. Emissions from suppliers add to the scope 3 emissions of a company
Tier 2
Tier 1
Purchasingcompany
Scope 1
Scope 1
Scope 2
Scope 2
Scope 3
Scope 3
Scope 3
Scope 1Scope 2
Value Change in the Value Chain: Best Practices in Scope 3 Greenhouse Gas Management | 30
OPTION 2. SHIFT TOWARDS LOW-CARBON ALTERNATIVES: Sometimes a company can produce the same products with different inputs, e.g. using low-carbon technologies or ingredients. This could only be decided in close collaboration with the operations team because the production process would need to be revised to a certain extent. A company could even decide to change its product portfolio by including new (low-carbon) products which would need low-carbon inputs or by moving from products to services (see Business Model Innovation section).
Figure 6: Differentiating suppliers based on amount of GHG emissions and relationship
3 emissions. Often companies have complex supply chains with tens of thousands of suppliers. By focusing on the suppliers covering, for example, 80% of the GHG emissions, the number of suppliers will be reduced drastically. Moreover, a company’s relationship with its suppliers largely determines the emissions reduction options.
Flexible suppliers: The purchasing company has short-term agreements with these suppliers, or multiple suppliers compete on the same market. In these situations, it is relatively easy for a company to shift to a supplier with a lower carbon footprint, e.g. shifting from supplier 2 to 1 in Figure 6.
Fixed suppliers: The purchasing company has long-term agreements with these suppliers, or suppliers provide very specific goods and services (fewer market players). In these situations, it is less easy to shift to another supplier (e.g. from supplier 3 to 4 in Figure 6). In these cases, it could be wise to set up a supplier engagement program to encourage the supplier to reduce its own emissions (see Supplier Engagement section).
Relationship with supplier
GHG emissions 2
1
5
6
4
3
PROCUREMENT POLICY & CHOICES
Value Change in the Value Chain: Best Practices in Scope 3 Greenhouse Gas Management | 31
Among the most powerful tools for a company to mitigate its scope 3 emissions is a focus on lowering lifecycle GHG emissions during the design of products and services. The design process can play a crucial role in defining the range of GHG intensity reductions that can be achieved through other reduction measures. The impact of these different design choices do not simply aggregate, but often interact in complex ways to create trade-offs. In the face of this complexity, it is best practice to include agile product lifecycle GHG assessment approaches in the product design phase to carefully weigh the impact of different choices.
PRODUCT DESIGN AS A LEVER FOR PRODUCT USE PHASE EMISSIONS
How customers ultimately use products is strongly influenced by the specific design of each product and its user-interface, for example the difference between wasteful and efficient application of the product, or one-way use versus circular reintegration of materials.Basic aspects of product design such as weight and size of the product, as well as packaging choices, will also have significant implications for emissions from logistics.
An example for a sector where emissions from the product use phase make up the bulk of scope 3 emissions is electrical and electronic equipment (EEE) manufacturers.The key drivers for emissions from the use of EEE are the products’ energy efficiency and
the GHG intensity of the electricity consumed. For some product categories, a further significant source of emissions can be fugitive emissions from these products, e.g. leaked refrigerants from HVAC systems.
These drivers also represent the key levers for reductions of use phase emissions from EEE. Depending on the market that manufacturers operate in, energy efficiency standards and labelling may already set a floor for equipment performance. However, there are several ways for EEE manufacturers to push further reductions:
• Align measurement of performance with energy efficiency ratings and aim for the highest levels of ratings.
• Focus on improving aspects of the equipment that might not be captured by standards, e.g. reducing base load demand by optimizing standby and auto switch-off settings.
• Market equipment based on lifecycle costs, rather than upfront investment costs, to encourage customers to purchase efficient equipment, even if at higher upfront cost.
Furthermore, companies should establish eco-design principles to reduce life cycle emissions by identifying opportunities for optimization through product characteristics, such as energy and material efficiency, weight, durability, substitution of hazardous materials or refrigerants, and opportunities for end-of-life treatment (e.g. product recovery management), as outlined above.
PRODUCT/SERVICE DESIGN
7

Value Change in the Value Chain: Best Practices in Scope 3 Greenhouse Gas Management | 32
Another sector where product design focused on use phase efficiency is critical is vehicle manufacturers. Transport accounts for 28% of global final energy demand and 23% of global carbon dioxide (CO2) emissions from fuel.12 If unchecked, transport emissions could increase 60% by 2050 largely owing to increased use of road transport for freight and passenger travel.13 Vehicle manufacturers have a crucial role in enabling a transition to low-carbon transport, particularly since most (~80%) of cradle-to-grave emissions for road vehicles happen during the use phase and are generated from fossil fuel combustion, or in
12 IEA. “Energy Technology Perspectives 2017 - Catalyzing Energy Technology Transformations.” https://www.iea.org/etp2017/ 13 OECD/ITF. “Transport Outlook 2017”. https://www.itf-oecd.org/transport-outlook-2017 14 CDP. “Bridging low-carbon technologies.” http://cdp.net/en/reports/downloads/3668
the case of electric or hybrid drivetrains, emissions from electricity generation. However, the quality of disclosure and management of scope 3 emissions is still low and lagging in the automotive sector, and a push towards better accounting practices in the sector is urgently needed.14 The Science Based Targets initiative has developed specific guidance and tools to support vehicle manufacturers in addressing the use phase emission of their products and aligning their performance with the rate of decarbonization required to meet a 2C pathway.
PRODUCT/SERVICE DESIGN

Value Change in the Value Chain: Best Practices in Scope 3 Greenhouse Gas Management | 33
Tennant: Driving Innovations in Product Design to Reduce Downstream Emissions
Tennant Company might not immediately ring a bell in everyday consumers’ minds. With a focus on enterprise customers that often operate “behind the scenes,” Tennant is a leading U.S.-based company for premium cleaning products, solutions and customer support. The company which operates in Europe-Middle East-Africa, the Americas and Asia-Pacific geographies, has a top global market share of 20% in the industrial cleaning sector and offers a diverse product portfolio, serving customers in vertical sectors ranging from retail to manufacturing to mining.
Tennant is focused on enterprise sustainability, guided by data and analytics. The company was aware that indirect emissions from usage of its products could be significant, but it was not until Trucost S&P Global - a company that assesses climate-related risks - conducted a scope 3 screening (economic input/output LCA methodology based on spend) that Tennant quantified this scope 3 category as over 68% of its total greenhouse gas emissions. That’s around 12 times its scope 1 and 2 emissions combined. In 2017, along with a target to reduce 25% of its scope 1 and 2 emissions, Tennant developed a target to reduce emissions from its scope 3 use of sold products category 50% per USD of equipment revenue by 2030 from a 2016 base-year.
With a history of investing in product differentiation with eco-advantages, setting a scope 3 target was a natural evolution for Tennant. Actual implementation of the reduction goal, however, required the company to create a new position in the Sustainable Enterprise team. The newly hired Senior Product Stewardship Engineer initiated a three-month internal stakeholder engagement process and developed relevant methodologies and tools to calculate use of sold products emissions. With as many as six to seven product development teams working on the pipeline simultaneously, the product stewardship engineer is involved in a very early stage to influence the strategic choices and specifications of equipment design. Indeed, in 2014, Tennant integrated sustainability into its New Product Development (NPD) process. Not only are sustainability concerns embedded into NPD templates, tools, and resources, each cross-functional product development team is committed to developing meaningful, quantifiable targets for environmental impact reduction. Achievement of targets is measured as each product is launched. With the new scope 3 use of sold products target now in place, a high priority for each specific project will be carbon emissions reduction.
In 2008, Tennant introduced one of its signature product innovations, ec-H2O™ technology. This product electrically converts tap water into a floor cleaning solution to replace conventional chemicals. Using results from a Life Cycle Assessment (LCA) done for ec-H2O™, which compares emissions from using packaged cleaning chemicals to that of ec-H2O, Tennant reported that this novel product has helped its customers avoid more than 75,000 metric tons of CO2e, while generating over $1.2 billion in revenue for the company. This amount of avoided emissions, reported separately from Tennant’s scope 3 inventory, is equivalent to more than two years of Tennant’s total global GHG emissions.15
Tennant has also been at the forefront of product electrification. The Tennant overall product mix is increasingly electric and this trend has been playing out for many years. Battery technology continues to improve, while internal combustion (IC) related fuel and service costs increase. Those trends make battery power the lowest total cost answer for more customers each year. In most applications, Tennant products are used indoors and do not run continuously. With a total cost benefit, along with the increasing importance of indoor air quality, Tennant customers continue switching to battery power. As a result, fewer IC products are developed and sold. As time progresses, the IC power source will be available only on the larger equipment that is more likely to be used outdoors. These trends will contribute to Tennant Company achieving the new scope 3 target.
15 Please refer to Box 1. Avoided emissions for guidance on making claims about avoided emissions
PRODUCT/SERVICE DESIGN
Value Change in the Value Chain: Best Practices in Scope 3 Greenhouse Gas Management | 34
If a product is designed to be manufactured using a specific material, the possibilities to lower embodied GHG emissions and processing emissions; the range of options for upstream and downstream logistics; the optimum possible use phase efficiency, and the feasible end-of-life treatments are all invariably determined by this design choice. Making sound design choices for products and services enables more possibilities to lower embodied emissions in raw materials, and to reduce emissions from processing, upstream and downstream transportation, use phase efficiency and end-of-life treatments.
A robust framework for the accounting of lifecycle emissions from products and services is provided in the GHG Protocol Product Life Cycle Accounting and Reporting Standard. Furthermore, a broad range of tools and analysis services is offered by specialised commercial providers, including Quantis, thinkstep, and the Carbon Trust.
A circular economy approach can achieve large improvements in environmental performance by redesigning systems and business models to simultaneously reduce upstream and downstream emissions. Prevailing linear processes consume resources and generate waste (‘take ⇀ make ⇀ use ⇀ dispose’). By closing the loop and recirculating materials, companies extend product lifespans and reduce new material demand and waste. This in turn
reduces the embodied energy of the new materials as well as their processing, which according to the 2018 report by Material Economics: The Circular Economy: A Powerful Force for Climate Mitigation,16 is essential for meeting the Paris Agreement’s long-term goal of net zero emissions. Industry currently accounts for approximately 40% of global emissions and demand is expected to increase two to four-fold by 2100. Most of the emissions reduction potential lies on the demand side, calling for innovative methods to reuse or recycle existing materials that have already been produced. The report estimates that a circular economy could reduce up to 3.6 billion tCO2 in heavy industry per year globally.17
As a first step, companies should consider where to reduce material inputs. This includes using more efficient materials as well as designing products that require less material. This eliminates any lifecycle emissions associated with the material. Examples include high-strength steel in construction, design and logistics systems that minimize material needed for packaging, and creating smaller cars that are more suitable for fewer passengers which are expected to be in higher demand as shared ride services become more popular. In addition, shifting from primary to secondary materials in production prevents waste by effective re-utilisation of materials. This is contingent upon designing products so components can be disassembled and sorted for recycling.18
16 The Circular Economy A Powerful Force for Climate Mitigation17 Ibid.18 Ibid.
INTEGRATE CIRCULAR ECONOMY PRINCIPLES INTO PRODUCT AND SERVICE DESIGN
PRODUCT/SERVICE DESIGN

Value Change in the Value Chain: Best Practices in Scope 3 Greenhouse Gas Management | 35
IKEA, a Swedish multinational group, has been the world’s largest furniture retailer since 2008. In June 2018, INGKA Group (the largest IKEA franchisee) announced its science- based targets to reduce scope 1 and 2 emissions 80% from 2016 to 2030. Inter IKEA Group, the worldwide IKEA franchisor and entity responsible for the company’s supply chain, commits to reduce value chain GHG emissions by at least 15% over the same time period. This translates to a 70% reduced climate footprint on average per IKEA product. The announcement is part of the IKEA commitment to become climate positive by 2030 by reducing more GHG emissions than the IKEA value chain emits, while growing the IKEA business. This will be achieved without using any carbon offsets. To transform into a low-carbon business, IKEA is going in the following directions:• Become truly circular and ensure all products are designed from the very beginning to be repurposed,
repaired, reused, resold and recycled;• Strive towards 100% renewable energy throughout the entire IKEA value chain;• Inspire and enable people to live a better life within the limits of the planet. IKEA made several ambitious commitments to make the transformation, including to use only renewable and recycled materials and removing all single-use plastic products globally by 2030. IKEA also made a commitment to increase plant-based food, such as the veggie hot dog, which launched globally in August 2018. IKEA approached the process of determining the ambition of its scope 3 target with a fact-based mindset that turns the high-level climate agenda into hands-on actions. In spring 2017, a simulation tool was developed internally to help IKEA determine its scope 3 target goal based on what’s known and what potential there is for innovation. Covering 99% of the scope 3 emissions, with focus on raw materials extraction and processing, production, food ingredients, customer travel, deliveries and product use in customers’ homes, the simulation tool evaluates the potential outcome of different actions, e.g. 100% renewable electricity at first tier suppliers. It also generates a gap analysis on what innovation is needed to fulfill the goal. Based on this tool, IKEA mapped out concrete road maps to achieve its targets. For instance, with raw materials, the company compiled a base year inventory with purchased material volume and emission factors. It then mapped out areas of actions among its suppliers and identified top parameters that would influence emissions impact, including sourcing country and if materials were recycled or renewable. With aluminum, for example, the three key parameters are whether the material is recycled, where it’s sourced from and the renewable electricity share during production. The climate footprint of recycled aluminum is significantly lower than that made from virgin material. Since significant amounts of electricity is used in the extraction of bauxite ore to produce aluminum, IKEA also takes the sourcing region into consideration as aluminum from regions with carbon-intensive electricity generation can have a much higher carbon footprint. Over time, as more primary data is collected and the emissions factors used for recycled materials become more specific, IKEA can better assess the feasibility and value of materials substitutions and capture the emissions reduction impacts of its circular economy initiatives.
IKEA: Decoupling emissions from growth through circular economy
PRODUCT/SERVICE DESIGN
Value Change in the Value Chain: Best Practices in Scope 3 Greenhouse Gas Management | 36
CUSTOMER ENGAGEMENTAn important lever for reducing downstream emissions is customer engagement. There are several different approaches a company can take to deliver such an intervention. Customers can be engaged either directly through education, collaboration or compensation, or indirectly through company regulation or customer motivation via marketing and choice architecture. Furthermore, companies can use reactive strategies that respond only to customer demand for more low-carbon products or active strategy to attempt to change the existing customer demand towards low-carbon alternatives.19
The fundamental challenge in managing downstream emissions is the limited influence a company has over how its products are processed, used, transported, and disposed of once they leave its direct sphere of control. Upstream emissions are also considered outside the company’s direct control, but the influence the company has on upstream emissions by being a customer affords relatively more control than over its downstream emissions. Another complication is distinguishing between direct use-phase emissions (e.g. the use phase of an auto manufacturer’s car) and indirect use-phase emissions (e.g. the emissions associated with heating the water in the wash cycle for a fast-moving consumer goods company’s (FMCG) detergent). The vehicle manufacturer has more control over the fuel efficiency and fuel type used during vehicle operation than the FMCG company. What distinguishes it as direct emissions is that the fuel use is within the lifecycle of the car. The FMCG in this case has less control over the intensity of the wash cycle. Nevertheless, some design considerations can be
8
made to reduce indirect use-phase emissions such as creating a cold-water detergent.
In addition to designing efficient products and applying circularity principles, corporates can influence consumers to positively influence behavior to promote intended and expected use patterns. Introducing customer engagement interventions can have cross-cutting impacts on several downstream emission categories including processing (e.g. preparing food), use (e.g. driving vehicles, washing clothes) and disposal of sold products (e.g. recycle opportunities) and can affect leased assets as well. These actions are key to addressing the downstream emissions that companies have less control over. Commitments to engage customers to change their behavior demonstrably lead to emission reductions in a company’s value chain and help to build stakeholder relationships. End-user education and behavioral change efforts usually aim to encourage less GHG intensive utilization patterns (e.g. product/user-interface design, consumer engagement campaigns or collaboration with downstream segments of the value chain that foster circular end-of-life treatment of products and downstream logistic efficiency).These interventions are an important component in reducing emissions by complementing technological changes and allowing emissions reduction targets to be reached more cost-effectively overall. A reduction in GHG emissions via energy efficiency in household and organizational settings encompasses a wide range of relevant interventions that stimulate behavioral changes including recycling, domestic heating,
19 ACT – Assessing low-Carbon Transition Retail methodology: http://actproject.net/wp-content/uploads/2017/02/ACT-Pilot-Retail-methodology-Final-draft-6-0-0.pdf
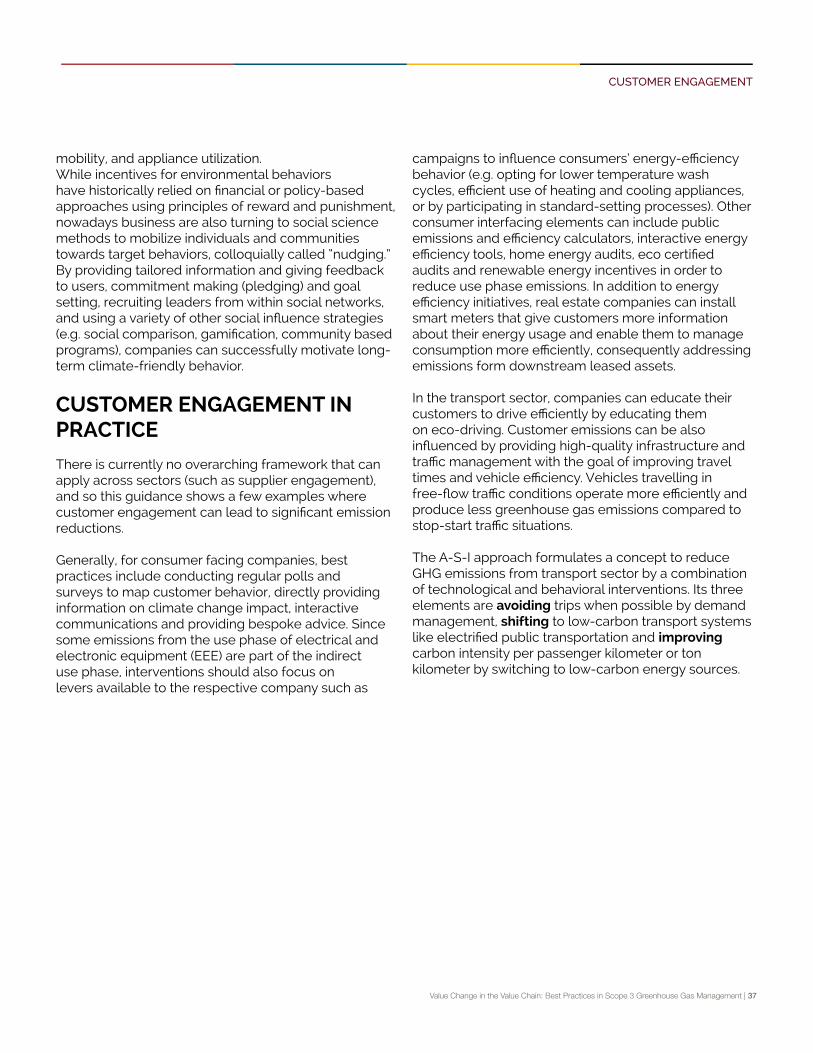
Value Change in the Value Chain: Best Practices in Scope 3 Greenhouse Gas Management | 37
mobility, and appliance utilization.While incentives for environmental behaviors have historically relied on financial or policy-based approaches using principles of reward and punishment, nowadays business are also turning to social science methods to mobilize individuals and communities towards target behaviors, colloquially called “nudging.” By providing tailored information and giving feedback to users, commitment making (pledging) and goal setting, recruiting leaders from within social networks, and using a variety of other social influence strategies (e.g. social comparison, gamification, community based programs), companies can successfully motivate long-term climate-friendly behavior.
CUSTOMER ENGAGEMENT IN PRACTICE
There is currently no overarching framework that can apply across sectors (such as supplier engagement), and so this guidance shows a few examples where customer engagement can lead to significant emission reductions.
Generally, for consumer facing companies, best practices include conducting regular polls and surveys to map customer behavior, directly providing information on climate change impact, interactive communications and providing bespoke advice. Since some emissions from the use phase of electrical and electronic equipment (EEE) are part of the indirect use phase, interventions should also focus on levers available to the respective company such as
campaigns to influence consumers’ energy-efficiency behavior (e.g. opting for lower temperature wash cycles, efficient use of heating and cooling appliances, or by participating in standard-setting processes). Other consumer interfacing elements can include public emissions and efficiency calculators, interactive energy efficiency tools, home energy audits, eco certified audits and renewable energy incentives in order to reduce use phase emissions. In addition to energy efficiency initiatives, real estate companies can install smart meters that give customers more information about their energy usage and enable them to manage consumption more efficiently, consequently addressing emissions form downstream leased assets.
In the transport sector, companies can educate their customers to drive efficiently by educating them on eco-driving. Customer emissions can be also influenced by providing high-quality infrastructure and traffic management with the goal of improving travel times and vehicle efficiency. Vehicles travelling in free-flow traffic conditions operate more efficiently and produce less greenhouse gas emissions compared to stop-start traffic situations.
The A-S-I approach formulates a concept to reduce GHG emissions from transport sector by a combination of technological and behavioral interventions. Its three elements are avoiding trips when possible by demand management, shifting to low-carbon transport systems like electrified public transportation and improving carbon intensity per passenger kilometer or ton kilometer by switching to low-carbon energy sources.
CUSTOMER ENGAGEMENT

Value Change in the Value Chain: Best Practices in Scope 3 Greenhouse Gas Management | 38
OPERATIONAL POLICIES Operational policies encourage sustainable decision-making by aligning business goals and employee satisfaction with GHG reduction measures. These internal guidelines are especially important for companies with significant commuting and business travel emissions and companies that produce large amounts of waste. Additionally, operational policies are commonly used to promote energy efficiency and reduce scope 2 emissions, which has the co-benefit of reducing scope 3 fuel-and-energy related activity emissions.
Most operational policies can be classified as protocols or incentive programs. Protocols tend to be most effective at achieving specific, predetermined targets by shifting business procedures and KPIs, while incentive programs are commonly used to reinforce protocols and to encourage employees to make “greener” choices related to travel and commuting.
DEVELOPING OPERATIONAL PROTOCOLS
As a first step, companies should collect data and develop an understanding of their “baseline” processes, for example, by completing an inventory of waste sources and flows or a review of energy expenditures and the age of equipment. In cases where the initial inventory relies heavily on estimation, operational protocols should also include steps to improve data collection over time.
9
The results of a waste inventory will shed light on specific opportunities to reduce emissions, while also generating value and social benefits. Walmart, in pursuit of their Zero Waste by 2025 target, not only uses data-driven forecasting to minimize unsold food, but the company also discounts food that is close to its expiration date, donates unpurchased food, and converts inedible food into animal feed, compost or energy20. In addition to directly affecting operations, waste protocols may specify a company’s stance on key decision such as advocating for refurbishment and repair of company goods rather than new purchases or setting a preference for recycled materials. There is strong potential for these protocols to overlap with other levers such as procurement policy & choices and business model innovation, particularly for companies that are drawn to circular economic practices. Energy efficiency goals, such as ensuring that a certain proportion of company buildings are ENERGY STAR or LEED certified or upgrading electrical equipment, primarily affect scope 2 emissions, but may consequently reduce scope 3 fuel-and-energy related emissions.
LAUNCHING OPERATIONAL INCENTIVE PROGRAMS
By encouraging employees to commute sustainably (e.g. via bicycle, mass transit, or carpool) and to travel less for business, companies may reduce their scope 3 emissions, while also improving employee
20 https://corporate.walmart.com/2018grr/reducing-waste
Value Change in the Value Chain: Best Practices in Scope 3 Greenhouse Gas Management | 39
wellbeing and retention. The most common bike-to-work incentives include onsite bicycle storage, locker rooms and showers, bike-to-work subsidies, bike paths around the workplace, and bike-share memberships.21 Companies may also provide shuttle service to employees to supplement existing transit routes. An important step, regardless of which incentives are offered, is to make employees aware of their commuting options by providing information on transit routes, tax benefits, and potential savings.
Companies may reduce their emissions from business travel and long commutes by encouraging employees to video conference rather than travel for short meetings. While occasional business travel
may still be necessary, video conferencing has many benefits: more frequent meetings between offices and with remote colleagues, reduced travel costs, minimal time lost to travel, and reduced travel burden on employees. Research also supports that in many cases, employees are more productive when permitted to work from home.22 These examples, which cover employee commuting and business travel, are the most common scope 3 operational incentive programs; however, incentives can be formulated for processes such as waste management and resource efficiency by aligning KPIs and bonuses with best practices. These incentive programs may be an important driver of GHG reductions for companies with franchise emissions.
OPERATIONAL POLICIES
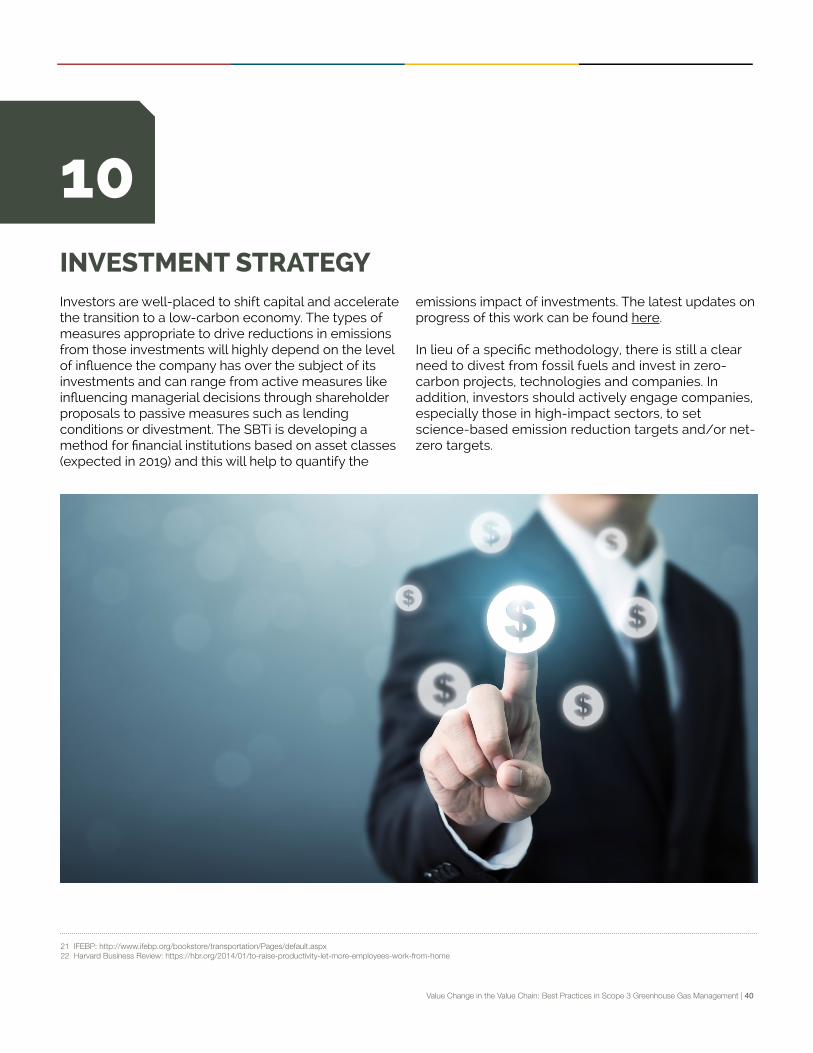
Value Change in the Value Chain: Best Practices in Scope 3 Greenhouse Gas Management | 40
INVESTMENT STRATEGYInvestors are well-placed to shift capital and accelerate the transition to a low-carbon economy. The types of measures appropriate to drive reductions in emissions from those investments will highly depend on the level of influence the company has over the subject of its investments and can range from active measures like influencing managerial decisions through shareholder proposals to passive measures such as lending conditions or divestment. The SBTi is developing a method for financial institutions based on asset classes (expected in 2019) and this will help to quantify the
10
21 IFEBP: http://www.ifebp.org/bookstore/transportation/Pages/default.aspx 22 Harvard Business Review: https://hbr.org/2014/01/to-raise-productivity-let-more-employees-work-from-home
emissions impact of investments. The latest updates on progress of this work can be found here.
In lieu of a specific methodology, there is still a clear need to divest from fossil fuels and invest in zero-carbon projects, technologies and companies. In addition, investors should actively engage companies, especially those in high-impact sectors, to set science-based emission reduction targets and/or net-zero targets.

Value Change in the Value Chain: Best Practices in Scope 3 Greenhouse Gas Management | 41
As has been emphasized multiple times through this guidance, the scope 3 emissions of a company overlap with the emissions of other companies. The emission reduction levers described above are not deployed in isolation. Rather, these levers work in conjunction with one another, and the boundaries defined by greenhouse gas accounting standards create opportunities for collaboration and innovation.
As each company’s position in the value chain is a matter of perspective, a company may be upstream and/or downstream from another company depending on what point of reference and what value chain is being used. Customers help to drive the demand to be met by producers who create the supply. The inverse is just as true. Producers can create innovative business models that open up new markets and shift the way we do business towards a low-carbon economy. As more actors in the private sector take action, more data will become available to create more accurate and robust targets and reduction strategies and there will be more potential to accurately track the progress against these targets in a reinforcing feedback mechanism of action.
All these efforts taken together can help build a more resilient and effective network that will increase the
likelihood that the planet avoids the worst effects of climate change. The benefits of such a network are similar to those displayed by distributed networks. In Figure 7 we see the transition from one (centralized system) to several (decentralized system) to all actors working together (distributed system) toward a common goal.
In a distributed system each node is a company actively trying to reduce its scope 3 emissions and in turn supporting the emission reduction goals of others. Rather than relying on a few climate leaders, it is everyone’s shared responsibility to reduce emissions. Accountability is distributed and therefore a single node or few nodes (i.e. company) do not carry the responsibility the system’s failure or success. This structure also helps any innovative tools, products and/or services that are built upon it to come to scale more quickly since there will be more actors using them and more opportunity for those ideas to flourish as the network grows as a whole. With all actors working together at once, every company can help to solve a bit of this global, complex issue threatening our planet. It is everyone’s responsibility to take whatever actions possible to mitigate climate change and avoid further adverse effects and we need to do so immediately.
HOW LEVERS INTERACT WITH EACH OTHER
11
Figure 7: A distributed system of climate actors working toward common emission reduction goals
Centralized Decentralized Distributed
Value Change in the Value Chain: Best Practices in Scope 3 Greenhouse Gas Management | 42
“Fourth Wave” technologies such as data analytics, smart sensors, and blockchain will help companies manage their scope 3 impacts by offering powerful insight into complex, global value chains. These technologies are playing an increasingly important role in business innovation, and business executives agree that implementing new technologies will not only improve their companies’ environmental footprints, but also their bottom lines.23 A key step in unlocking the potential of emerging technologies is to identify areas where business and environmental goals align. For example, the use of smart sensors in manufacturing and transportation can improve efficiency and provide greater supplier transparency, while also enabling companies to produce more accurate scope 3 emissions inventories and track progress toward goals.
With hardware spending on the “Internet of Things” (IoT) expected to reach almost $3 trillion for business applications alone in 2020, companies that utilize digital infrastructure to monitor external services will have the opportunity to connect with suppliers to track production activity and transportation in almost real time.24 Smart sensors will facilitate the collection and sharing of various streams of data, enabling multinational corporations to engage with suppliers and assess their progress toward meeting scope 3 targets. Similarly, IoT technology and artificial intelligence (AI) can be incorporated into end products that adapt to usage patterns and automatically schedule tasks to optimize energy efficiency. Data analytics will translate these into actionable insights
for reporting corporations, suppliers, and consumers alike. To provide the greatest degree of transparency, operational data should conform to a “Single Source of Truth” (SSOT) model, where possible. Blockchain is one example of an SSOT technology because each transaction is securely validated with a digital “signature” and all parties access information from the same, immutable database.
Online sharing platforms are an increasingly important way that companies can drive cooperative action, facilitating collaboration and communication between purchasing companies and suppliers, as well as the sharing of best practices amongst both suppliers and consumers. Companies should implement transparent data analytics into these platforms, increasing trust between parties and enabling participants to reduce their own emissions more easily. These benefits are not limited to a corporation and its tier 1 suppliers: sharing platforms can be used to link suppliers, operators, and consumers up and down the value chain, empowering a vast network of actors by providing greater transparency and highlighting shared values. The tech startup Provenance, which uses blockchain to log primary data at every step in the supply chain to be shared with consumers (see case study)25, is just one example of how fourth wave technologies may enable companies to improve not only their environmental impact, but also their service offerings and reputation.
FUTURE WORK
12
23 EDF: Business and the fourth wave of Environmentalism 24 WEF: Impact of the Fourth Industrial Revolution on Supply Chains25 Provenance: https://www.provenance.org/how-it-works
FOURTH WAVE TECHNOLOGIES

Value Change in the Value Chain: Best Practices in Scope 3 Greenhouse Gas Management | 43
Consumers are increasingly aware of the roles they play in combating climate change and interested in the carbon footprints of the products they purchase. While businesses are becoming better equipped to measure the impact of their own operations, there is a gap for tools and methods with which they can measure, track, and clearly communicate the scope 3 footprint of their products. Without credible data and methodology for measuring and communicating product carbon footprints, sustainability claims can easily be perceived as “greenwashing.” Besides consumers, there is also growing interests from businesses to increase the level of accuracy in measuring THE supply chain and product-level carbon footprint from their suppliers.
Responding to the needs of existing customers and backed by an Innovate UK grant at the end of 2017, Provenance partnered with Carbon Analytics — pioneers in environmental impact measurement — to develop a blockchain-based solution to enable businesses to track and communicate supply chain emissions (scope 3) using a consistent, industry-comparable methodology.
The project is about to complete the initial phase of technological platform integration. It is preparing to start the pilot testing phase with several companies, which will be followed by multiple rounds of iterations. The pilot companies are mainly from the Food and Beverage sector as it’s currently an area with strong consumer interests. The relatively simple sector supply chain structure of food also makes it an ideal fit for the initial testing phase of the project. The pilot results will be launched next year.
Companies will be able to combine Provenance’s transparency and traceability software service with Carbon Analytics’ platform to measure and communicate their business-level carbon footprint. Carbon Analytics has developed a method to estimate a company’s carbon impact from every monetary transaction made, including electricity, water, stationery, etc. Public information about suppliers’ resource consumption is used to calculate the resulting impact of a transaction. With this method, companies can use financial data that’s readily available to link to carbon emission impacts. The fundamental motivation behind the method is to embed the carbon impact into each financial transaction to surface the negative externalities from the very beginning.
The platform currently provides an estimation of corporate level emissions with companies that have simple product offerings. Over time, as the method is gradually refined, it will be able to provide emissions estimates from a product perspective. The guiding standards used for the method are Greenhouse Gas Protocol and the PAS 2050 method for assessing the lifecycle greenhouse gas emissions of goods and services.
As applications of blockchain to areas such as product traceability, food safety, certification, and fair trade are quickly emerging, the use of blockchain for scope 3 data collection is still a nascent field. However, the introduction of the most cutting-edge technology to scope 3 emissions tracking will help increase awareness and resources to continuously improve the system over time.
Carbon Analytics and Provenance: Applying blockchain to scope 3 emissions calculation and tracking
FUTURE WORK

SCIENCE_ BASED TARGETS
Gold Standard·� ,_ Clima�e_ Secu�ty&:.._Sustainable Development