Valuation Consulting Assignment Menlo Gateway Project ...
58
Valuation Consulting Assignment Menlo Gateway Project (Office/Retail Portion) U.S. Highway 101 and Marsh Road Menlo Park, San Mateo County, CA 94025 Prepared on: March 24, 2010 Analysis Date: Land Valuation: January 1, 2010 Proposed Project: January 1, 2014 Market Feasibility: January 1, 2010 Prepared For: City of Menlo Park 701 Laurel Street Menlo Park, CA 94025 Prepared By: Cushman & Wakefield Western, Inc. Valuation & Advisory Services 560 S. Winchester Boulevard, Suite 200 San Jose, CA 95128 C&W File ID: 10-31010-9009-1
Transcript of Valuation Consulting Assignment Menlo Gateway Project ...
Valuation Consulting Assignment
Menlo Gateway Project (Office/Retail Portion) U.S. Highway 101 and Marsh Road Menlo Park, San Mateo County, CA 94025
Prepared on: March 24, 2010
Analysis Date: Land Valuation: January 1, 2010 Proposed Project: January 1, 2014 Market Feasibility: January 1, 2010 Prepared For: City of Menlo Park 701 Laurel Street Menlo Park, CA 94025 Prepared By: Cushman & Wakefield Western, Inc. Valuation & Advisory Services 560 S. Winchester Boulevard, Suite 200 San Jose, CA 95128 C&W File ID: 10-31010-9009-1
VALUATION SERVICES
Robby D. Perrino, MAI, CRE, CCIM Executive Managing Director
Cushman & Wakefield Western, Inc. 560 S. Winchester Boulevard Suite 200 San Jose, CA 95128 (408) 436 5500 Tel (408) 572 4134 Direct (408) 348 5168 Cell (408) 434 1554 Fax [email protected]
March 24, 2010 Glen Rojas City Manager CITY OF MENLO PARK 701 Laurel Street Menlo Park, CA 94025 William L. McClure City Attorney CITY OF MENLO PARK 1100 Alma Street, Suite 210 Menlo Park, CA 94025 Re: Menlo Gateway Project (Office/Retail Portion) U.S. Highway 101 and Marsh Road Menlo Park, CA Dear Messrs. Rojas and McClure:
In fulfillment of our agreement as outlined in the Letter of Engagement, we are pleased to transmit our valuation consulting assignment of the above referenced property. This report has been prepared in accordance with our interpretation of the Uniform Standards of Professional Practice (USPAP). The scope of the assignment is as follows:
• Subject property inspection to the extent necessary to adequately identify the real estate
• Research relevant market data, in terms of quantity, quality, and geographic comparability, to the extent necessary to produce credible valuation consulting results
• Review of architectural renderings
• Review relevant studies prepared by other consultants
• Interview the developer
• Review and analyze developer's development cost estimates and pro-forma
• Interview Menlo Park Planning Personnel assigned to the Menlo Gateway Project
Messrs. Rojas and McClure March 24, 2010 Page 2
VALUATION SERVICES
• Develop a market value estimate of the fee simple interest, as of January 1, 2010, for the subject land based on current zoning assuming a maximum Floor Area Ratio (FAR) of 45%
• Develop a market value estimate of the fee simple interest, as of January 1, 2010, for the subject land based on the proposed FAR of 137.5%Determine the general overall feasibility of the office/retail component of the project by utilizing the discounted cash-flow (DCF) methodology. (Important to note: Feasibility is not just about optimal financial outcomes. Intangible community and institutional values may be just as important)
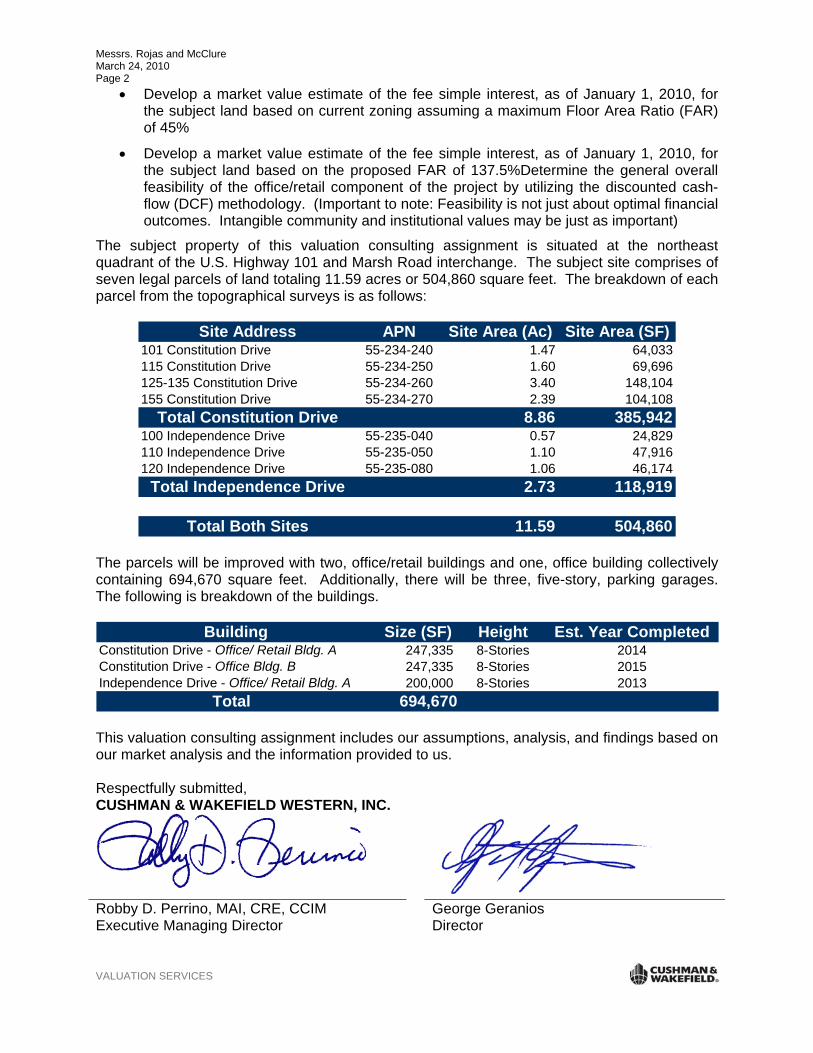
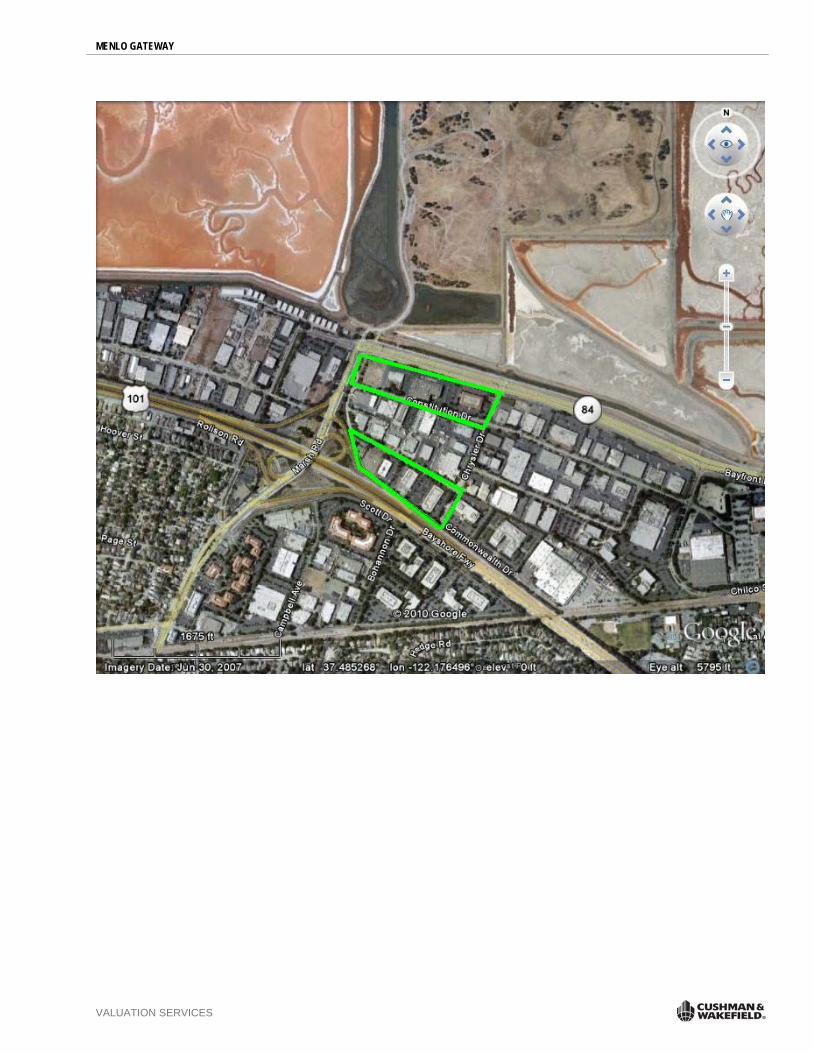
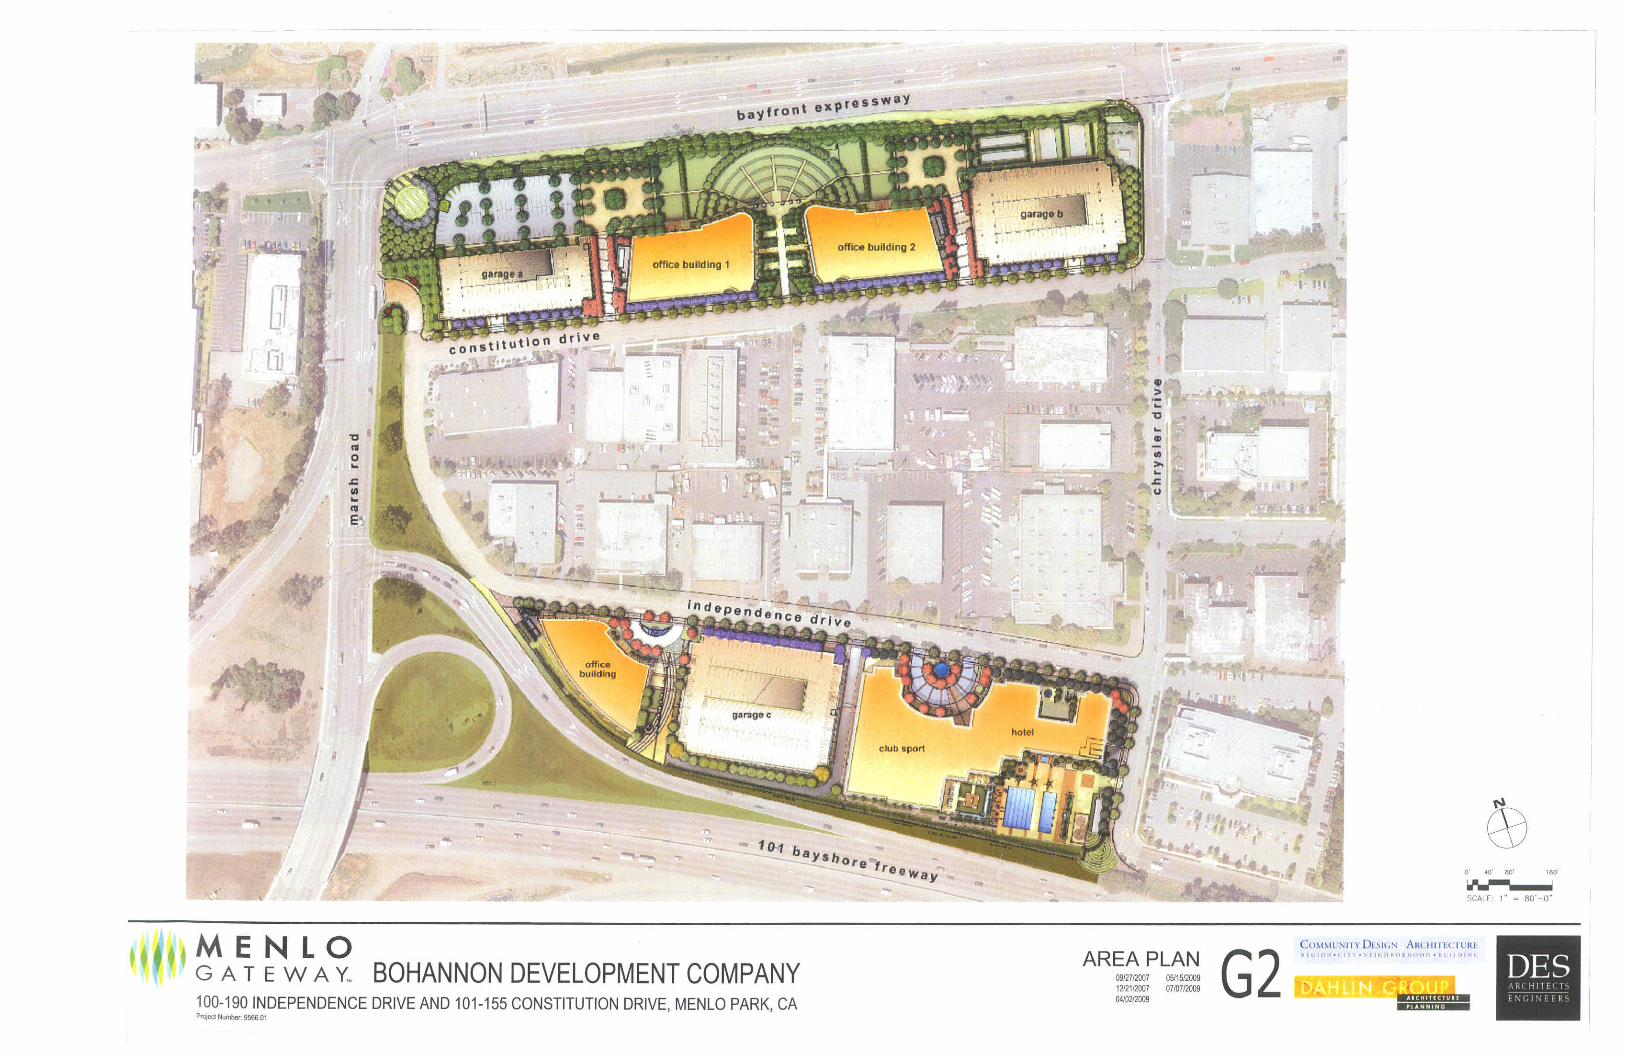
The subject property of this valuation consulting assignment is situated at the northeast quadrant of the U.S. Highway 101 and Marsh Road interchange. The subject site comprises of seven legal parcels of land totaling 11.59 acres or 504,860 square feet. The breakdown of each parcel from the topographical surveys is as follows:
Site Address APN Site Area (Ac) Site Area (SF)101 Constitution Drive 55-234-240 1.47 64,033115 Constitution Drive 55-234-250 1.60 69,696125-135 Constitution Drive 55-234-260 3.40 148,104155 Constitution Drive 55-234-270 2.39 104,108
Total Constitution Drive 8.86 385,942100 Independence Drive 55-235-040 0.57 24,829110 Independence Drive 55-235-050 1.10 47,916120 Independence Drive 55-235-080 1.06 46,174
Total Independence Drive 2.73 118,919
Total Both Sites 11.59 504,860
The parcels will be improved with two, office/retail buildings and one, office building collectively containing 694,670 square feet. Additionally, there will be three, five-story, parking garages. The following is breakdown of the buildings.
Building Size (SF) Height Est. Year CompletedConstitution Drive - Office/ Retail Bldg. A 247,335 8-Stories 2014Constitution Drive - Office Bldg. B 247,335 8-Stories 2015Independence Drive - Office/ Retail Bldg. A 200,000 8-Stories 2013
Total 694,670 This valuation consulting assignment includes our assumptions, analysis, and findings based on our market analysis and the information provided to us. Respectfully submitted, CUSHMAN & WAKEFIELD WESTERN, INC.
Robby D. Perrino, MAI, CRE, CCIM Executive Managing Director
George Geranios Director
MENLO GATEWAY
VALUATION SERVICES

MENLO GATEWAY 1
VALUATION SERVICES
MARKET OBSERVATIONS
MENLO GATEWAY 2
VALUATION SERVICES
G R E A T E R S I L I C O N V A L L E Y O F F I C E M A R K E T A N A L Y S I S INTRODUCTION
CURRENT TRENDS In 2008, and markedly through 2009, the region’s office market has responded to the local, national, and global economic recessions and rising unemployment with increased vacancy rates, descending effective rental rates, and ongoing negative absorption.
Listed below are highlights in the Greater Silicon Valley office market through fourth quarter 2009:
In the Greater Silicon Valley, year-end 2009 absorption stood at negative 2.2 million square feet, a 10.percent decline from the year-end 2008 absorption of negative 2.0 million square feet. There was a reversal of this trend in the fourth quarter as the overall net absorption was positive 358,000 square feet. As one economist noted, “less bad is the new good”, an indicator that economic recovery may be slowly underway.
In the Greater Silicon Valley, the overall vacancy rate declined slightly in fourth quarter to 19.9 percent from 20.3 percent in the prior quarter, and from 16.1 percent a year ago. The overall vacancy rates at 22.2 percent in Silicon Valley and 17.0 percent in the Peninsula market both increased from 17.2 percent and 14.8 percent in fourth quarter 2008. The weakened tenant demand coinciding with ramped up construction has impacted vacancy rates.
In fourth quarter 2009, overall average asking rents in Greater Silicon Valley decreased 16.9 percent to $2.51 per square foot per month (fully-serviced) since fourth quarter 2008, and decreased 4.9 percent over the prior quarter. Silicon Valley asking rents decreased from $2.54 per square foot per month in third quarter to $2.36 in fourth quarter, while the San Francisco Peninsula saw a decrease over the quarter from $2.80 to $2.76 per square foot per month.
In fourth quarter 2009, about 1.0 million square feet were under construction in the region, all within the Silicon Valley submarkets of San Jose, Sunnyvale and Santa Clara. By year-end 2009, nearly 1.8 million square feet of office space were completed, primarily in the Sunnyvale, San Jose and Downtown San Jose, South San Francisco and Cupertino submarkets.
Reported asking rents continue to rise as the older vacant office space is being marketed at negotiable rental rates. Therefore, the higher asking rents for newer office space are moving averages upward.

MENLO GATEWAY 3
VALUATION SERVICES
MARKET CHARACTERISTICS The Greater Silicon Valley office market, totaling nearly 78.3 million square feet of office space, encompasses both the Silicon Valley and San Francisco Peninsula markets. The majority of the office space, 43.5 million square feet (55 percent), is located in the Silicon Valley office market, with the remaining 34.8 million square feet (45 percent) located in the San Francisco Peninsula office market.
Further details follow:
The Silicon Valley office market is comprised of 13 submarkets, located predominantly in Santa Clara County, and also includes the Newark and Fremont submarkets in southern Alameda County. The Silicon Valley market consists of:
Downtown San Jose CBD (6.5 million square feet);
Non-CBD portion of the city of San Jose (12.0 million square feet);
City of Santa Clara (7.7 million square feet); and,
Ten other cities within Santa Clara and southern Alameda counties (17.0 million square feet).
The San Francisco Peninsula office market is divided into three sub-regions:
North County (9.7 million square feet);
Central County (8.8 million square feet); and,
South County (16.2 million square feet).
These sub-regions are further divided into 15 submarkets and consist of cities located primarily in San Mateo County, as well as Palo Alto and Palo Alto/Stanford Research Park, which are located in northern Santa Clara County.
MENLO GATEWAY 4
VALUATION SERVICES
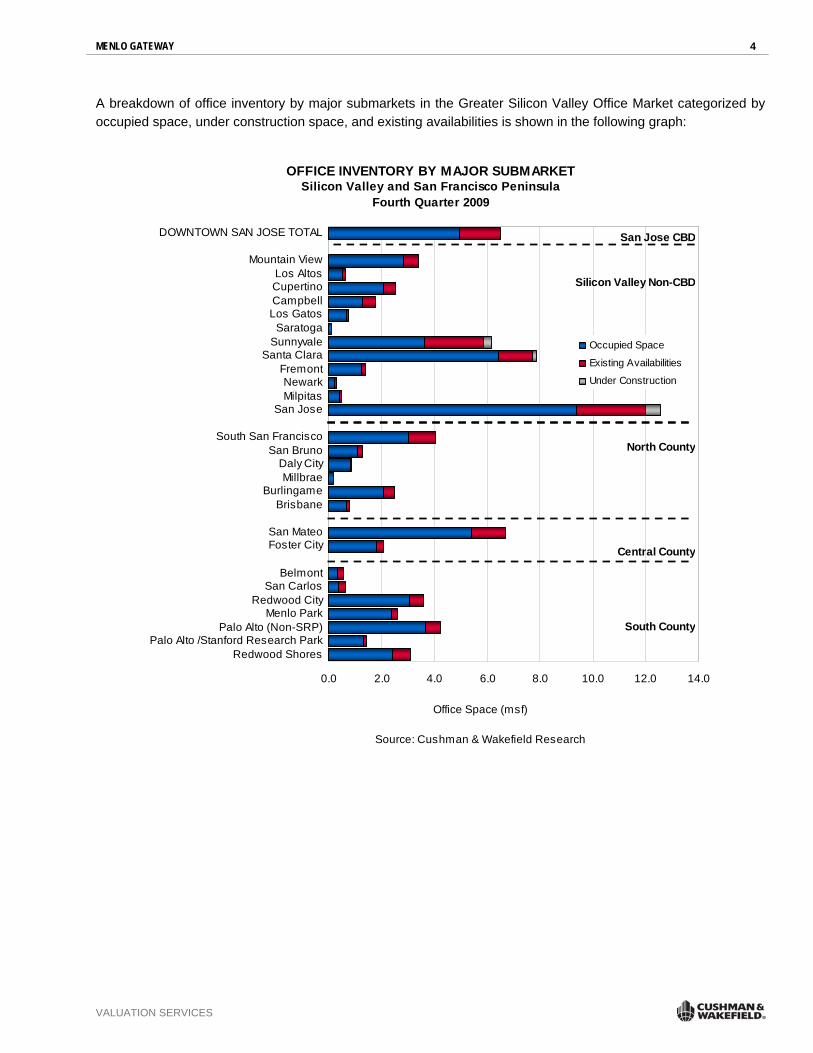
A breakdown of office inventory by major submarkets in the Greater Silicon Valley Office Market categorized by occupied space, under construction space, and existing availabilities is shown in the following graph:
OFFICE INVENTORY BY MAJOR SUBMARKETSilicon Valley and San Francisco Peninsula
Fourth Quarter 2009
0.0 2.0 4.0 6.0 8.0 10.0 12.0 14.0
DOWNTOWN SAN JOSE TOTAL
Mountain ViewLos AltosCupertinoCampbellLos Gatos
SaratogaSunnyvale
Santa ClaraFremontNewarkMilpitas
San Jose
South San FranciscoSan Bruno
Daly CityMillbrae
BurlingameBrisbane
San MateoFoster City
BelmontSan Carlos
Redwood CityMenlo Park
Palo Alto (Non-SRP)Palo Alto /Stanford Research Park
Redwood Shores
Office Space (msf)
Source: Cushman & Wakefield Research
Occupied Space
Existing Availabilities
Under Construction
San Jose CBD
Silicon Valley Non-CBD
North County
Central County
South County

MENLO GATEWAY 5
VALUATION SERVICES
A map of the Greater Silicon Valley (Silicon Valley-San Francisco Peninsula) office submarkets follows:
MENLO GATEWAY 6
VALUATION SERVICES
SUPPLY ANALYSIS
VACANCY Although the second quarter 2009 office vacancy rate in Greater Silicon Valley rose to its highest since 2004, the overall vacancy rate decreased slightly in the second half of 2009 from 20.3 percent in third quarter to 19.9 percent in third quarter. Vacancy has increased 23.6 percent from 16.1 percent a year ago.
The following points concern fourth quarter 2009 vacancy within the Greater Silicon Valley office market:
In fourth quarter 2009, Silicon Valley’s overall vacancy decreased to 22.2 from 23.1 percent over the prior quarter, while the Peninsula’s overall vacancy slightly increased to 17.0 percent from 16.9 percent.
Within the major markets of Silicon Valley, the highest vacancy rate as of fourth quarter 2009 was 38.1 percent in the Sunnyvale submarket, up significantly from 34.7 percent at fourth quarter 2008, and 25.2 percent in the Campbell submarket, up from 21.6 percent over the prior year. As noted above, a majority of newly completed space, almost 2.0 million square feet, was added to the Sunnyvale submarket in 2008 and 2009.
The North County’s 19.0 percent vacancy rate represents the highest overall vacancy in the Peninsula regional market, where the South San Francisco submarket recorded 25.3 percent vacancy. However, this represents a decrease over the year ago vacancy of 29.1 percent, and from 25.9 percent over the prior quarter.
Among the submarkets with inventory greater than one million square feet, Fremont was the tightest in Silicon Valley, with a 14.0 percent overall vacancy rate; a decrease over the prior quarter’s 14.7 percent vacancy.
Palo Alto/Stanford Research Park’s vacancy rate stood at 7.1 percent, followed by Menlo Park at 8.7 percent, and Foster City at 12.1 percent. These submarkets had the lowest overall vacancy rates among the Peninsula’s submarkets.
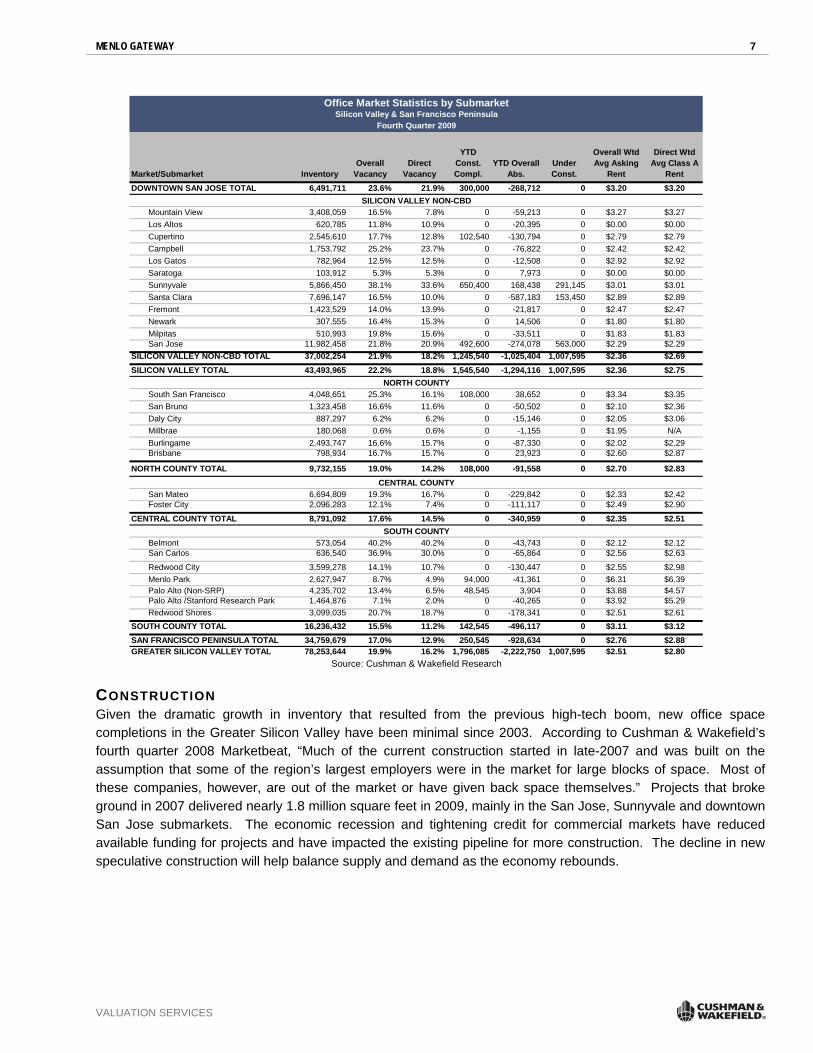
The table below summarizes the current statistics of the Silicon Valley-San Francisco Peninsula office market by submarket:
MENLO GATEWAY 7
VALUATION SERVICES
Market/Submarket Inventory Overall
Vacancy Direct
Vacancy
YTD Const. Compl.
YTD Overall Abs.
Under Const.
Overall Wtd Avg Asking
Rent
Direct Wtd Avg Class A
RentDOWNTOWN SAN JOSE TOTAL 6,491,711 23.6% 21.9% 300,000 -268,712 0 $3.20 $3.20
Mountain View 3,408,059 16.5% 7.8% 0 -59,213 0 $3.27 $3.27 Los Altos 620,785 11.8% 10.9% 0 -20,395 0 $0.00 $0.00 Cupertino 2,545,610 17.7% 12.8% 102,540 -130,794 0 $2.79 $2.79 Campbell 1,753,792 25.2% 23.7% 0 -76,822 0 $2.42 $2.42 Los Gatos 782,964 12.5% 12.5% 0 -12,508 0 $2.92 $2.92 Saratoga 103,912 5.3% 5.3% 0 7,973 0 $0.00 $0.00 Sunnyvale 5,866,450 38.1% 33.6% 650,400 168,438 291,145 $3.01 $3.01 Santa Clara 7,696,147 16.5% 10.0% 0 -587,183 153,450 $2.89 $2.89 Fremont 1,423,529 14.0% 13.9% 0 -21,817 0 $2.47 $2.47 Newark 307,555 16.4% 15.3% 0 14,506 0 $1.80 $1.80 Milpitas 510,993 19.8% 15.6% 0 -33,511 0 $1.83 $1.83 San Jose 11,982,458 21.8% 20.9% 492,600 -274,078 563,000 $2.29 $2.29
SILICON VALLEY NON-CBD TOTAL 37,002,254 21.9% 18.2% 1,245,540 -1,025,404 1,007,595 $2.36 $2.69 SILICON VALLEY TOTAL 43,493,965 22.2% 18.8% 1,545,540 -1,294,116 1,007,595 $2.36 $2.75
South San Francisco 4,048,651 25.3% 16.1% 108,000 38,652 0 $3.34 $3.35 San Bruno 1,323,458 16.6% 11.6% 0 -50,502 0 $2.10 $2.36 Daly City 887,297 6.2% 6.2% 0 -15,146 0 $2.05 $3.06 Millbrae 180,068 0.6% 0.6% 0 -1,155 0 $1.95 N/A Burlingame 2,493,747 16.6% 15.7% 0 -87,330 0 $2.02 $2.29 Brisbane 798,934 16.7% 15.7% 0 23,923 0 $2.60 $2.87
NORTH COUNTY TOTAL 9,732,155 19.0% 14.2% 108,000 -91,558 0 $2.70 $2.83
San Mateo 6,694,809 19.3% 16.7% 0 -229,842 0 $2.33 $2.42 Foster City 2,096,283 12.1% 7.4% 0 -111,117 0 $2.49 $2.90
CENTRAL COUNTY TOTAL 8,791,092 17.6% 14.5% 0 -340,959 0 $2.35 $2.51
Belmont 573,054 40.2% 40.2% 0 -43,743 0 $2.12 $2.12 San Carlos 636,540 36.9% 30.0% 0 -65,864 0 $2.56 $2.63
Redwood City 3,599,278 14.1% 10.7% 0 -130,447 0 $2.55 $2.98 Menlo Park 2,627,947 8.7% 4.9% 94,000 -41,361 0 $6.31 $6.39 Palo Alto (Non-SRP) 4,235,702 13.4% 6.5% 48,545 3,904 0 $3.88 $4.57 Palo Alto /Stanford Research Park 1,464,876 7.1% 2.0% 0 -40,265 0 $3.92 $5.29 Redwood Shores 3,099,035 20.7% 18.7% 0 -178,341 0 $2.51 $2.61
SOUTH COUNTY TOTAL 16,236,432 15.5% 11.2% 142,545 -496,117 0 $3.11 $3.12 SAN FRANCISCO PENINSULA TOTAL 34,759,679 17.0% 12.9% 250,545 -928,634 0 $2.76 $2.88 GREATER SILICON VALLEY TOTAL 78,253,644 19.9% 16.2% 1,796,085 -2,222,750 1,007,595 $2.51 $2.80
Source: Cushman & Wakefield Research
Office Market Statistics by SubmarketSilicon Valley & San Francisco Peninsula
Fourth Quarter 2009
SOUTH COUNTY
CENTRAL COUNTY
NORTH COUNTY
SILICON VALLEY NON-CBD
CONSTRUCTION Given the dramatic growth in inventory that resulted from the previous high-tech boom, new office space completions in the Greater Silicon Valley have been minimal since 2003. According to Cushman & Wakefield’s fourth quarter 2008 Marketbeat, “Much of the current construction started in late-2007 and was built on the assumption that some of the region’s largest employers were in the market for large blocks of space. Most of these companies, however, are out of the market or have given back space themselves.” Projects that broke ground in 2007 delivered nearly 1.8 million square feet in 2009, mainly in the San Jose, Sunnyvale and downtown San Jose submarkets. The economic recession and tightening credit for commercial markets have reduced available funding for projects and have impacted the existing pipeline for more construction. The decline in new speculative construction will help balance supply and demand as the economy rebounds.
MENLO GATEWAY 8
VALUATION SERVICES
Further 2009 construction highlights follow:
In the first half of 2009, nearly 1.6 million square feet were delivered in the Greater Silicon Valley. This new inventory, heavily concentrated in Silicon Valley and dominated by The Moffett Towers, is a speculative 1.8 million square foot campus that Jay Paul has built to shell construction in the Sunnyvale submarket. The campus consists of seven, architecturally distinctive, eight-story office towers and a 40,000-square foot fitness center. The project is one of the first new “green” class A projects to be delivered to the market, which indicates builders have shifted their focus to green building as it has become more important to tenants seeking the benefits of cheaper operating costs to offset rising rental rates in the valley. Buildings A, B and C were completed between the first and third quarters of 2008, bringing more than 913,000 square feet to the market. Buildings D through G, totaling about 872,000 square feet, were completed in the first quarter of 2009. At the end of 2009, no leases in the entire development had been signed.
In addition to Moffett Towers, America Center I, consisting of 427,600 square feet in two, six-story office buildings in north San Jose, was completed to “shell” construction in June 2009. No leases have been signed in this development. River Park Towers II (300,000 square feet) in the San Jose CBD was also completed to “shell” construction in June 2009. It also remains vacant. Currently under construction in the San Jose (Non-CBD) submarket is Brocade’s 563,000 square foot build-to-suit office building. This is the former “Palm Site” which was being marketed as the proposed spec buildings project known as “@First”. Brocade subsequently purchased the site for construction and occupancy and plans to occupy the buildings in second quarter of 2010.
Along the Peninsula, about 126,000 square feet of new office space was completed in second quarter in South County’s Menlo Park and Palo Alto submarkets. According to Cushman and Wakefield Research, there is currently no new speculative construction projects scheduled to break ground in 2009, which should help prevent additional significant increases in vacancy during the remainder of the year.
In response to current market conditions, developers have chosen to put a hold on projects that already broke ground, including the 153,450 square foot development at Campus at Lawson Lane in Santa Clara and 45,554 square feet at the Offices in Downtown Sunnyvale. Although the projects were under construction, the developers put them on hold indefinitely until market conditions improve.
In South San Francisco, Myers Development broke ground in April 2007 on the $300 million Centennial Towers, with 325,400 square feet of class A office space delivered in December 2008. At year-end 2008, the developer halted construction of the 21-story North Tower building of the Centennial Towers because of the financial crisis. The developer reported that the South Tower has yet to secure tenants. The project includes 2,000 parking stalls, 25,000 square feet of retail space, a 100-child daycare center, and a 200-seat performing arts center.
MENLO GATEWAY 9
VALUATION SERVICES
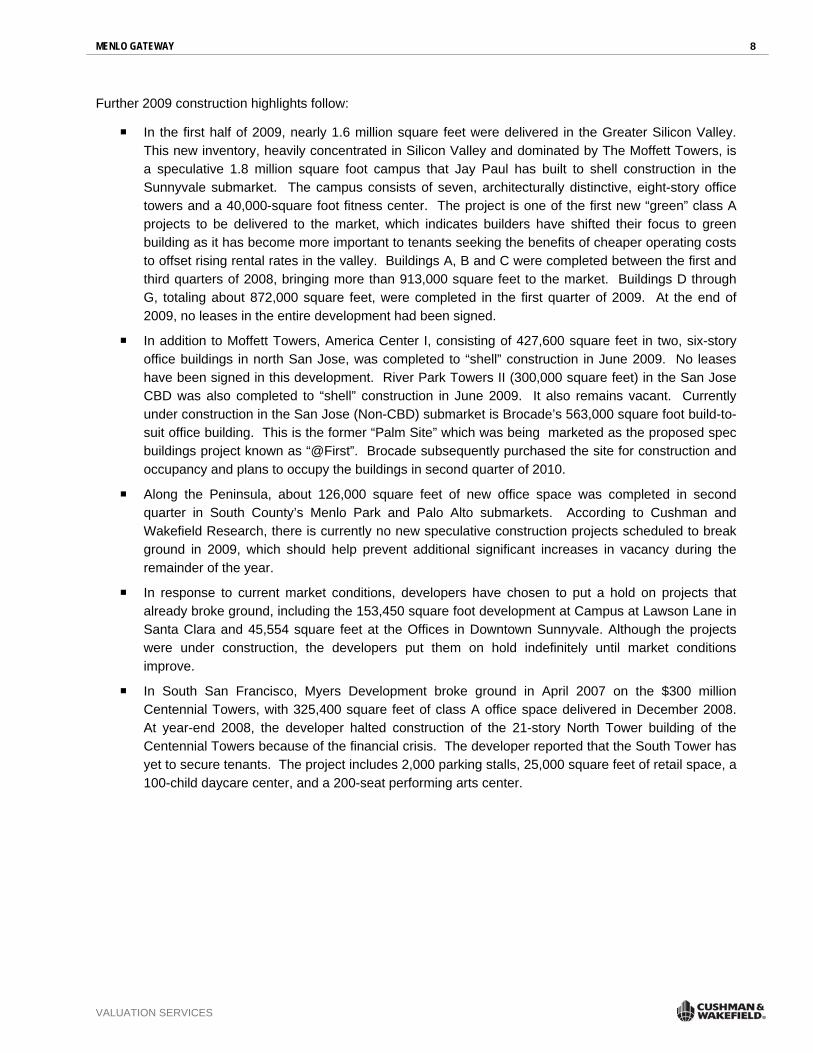
The following graph summarizes construction completions in the Silicon Valley-San Francisco Peninsula office market from 1999 through fourth quarter 2009:
CONSTRUCTION COMPLETIONSSV-SFP Office Market, 2002-2009 YTD
1.6 1.82.0
0.00.20.00.0
3.23.8
3.0
0.0
2.0
4.0
6.0
8.0
10.0
1999 2000 2001 2002 2003 2004 2005 2006 2007 2008 2009
Source: Cushman & Wakefield Research
mill
ion
squa
re fe
et
SFP NON-CBD
SV NON-CBD
SV CBD
7.
OVERALL AVERAGE ASKING RENTS Overall average asking rents in the Greater Silicon Valley fell to $2.51 per square foot per month (fully-serviced) in fourth quarter 2009, a 4.9 percent decrease over third quarter asking rents. It should be noted that all rental rates shown are fully-serviced.
The following points summarize overall asking rents for fourth quarter 2009 in the Greater Silicon Valley office market:
In fourth quarter 2009, the Silicon Valley market’s average asking rent decreased to $2.36 per square foot per month, from $2.54 per square foot per month over the prior quarter, and the Peninsula market’s overall average asking rent posted a decrease from $2.80 to $2.76 per square foot per month over the quarter. Over the same period in 2008, rents decreased 11.6 percent from $2.67 per square foot per month in Silicon Valley, and decreased 21.4 percent from $3.51 per square foot per month in the Peninsula.
In fourth quarter, asking rents ranged from $1.77 to $6.31 per square foot per month over all markets. The lowest rents are found in southern Alameda County with the highest rents found in the South County area, particularly Menlo Park’s Sand Hill Road area and Palo Alto.
The largest decline in asking rents in fourth quarter occurred in Silicon Valley’s Cupertino submarket, and the Peninsula’s Menlo Park submarket. Rents fell in Cupertino 15.5 percent from $3.16 per square foot per month in third quarter to $2.67 per square foot per month in fourth quarter. In Menlo Park rents fell 8.5 percent from $6.90 to $6.31 per square foot per month during the same period. The largest fourth quarter increase in asking rents occurred in the Silicon Valley’s Non-CBD Saratoga submarket. Rents rose 8.8 percent from $2.62 to $2.85 per square foot per month.
MENLO GATEWAY 10
VALUATION SERVICES
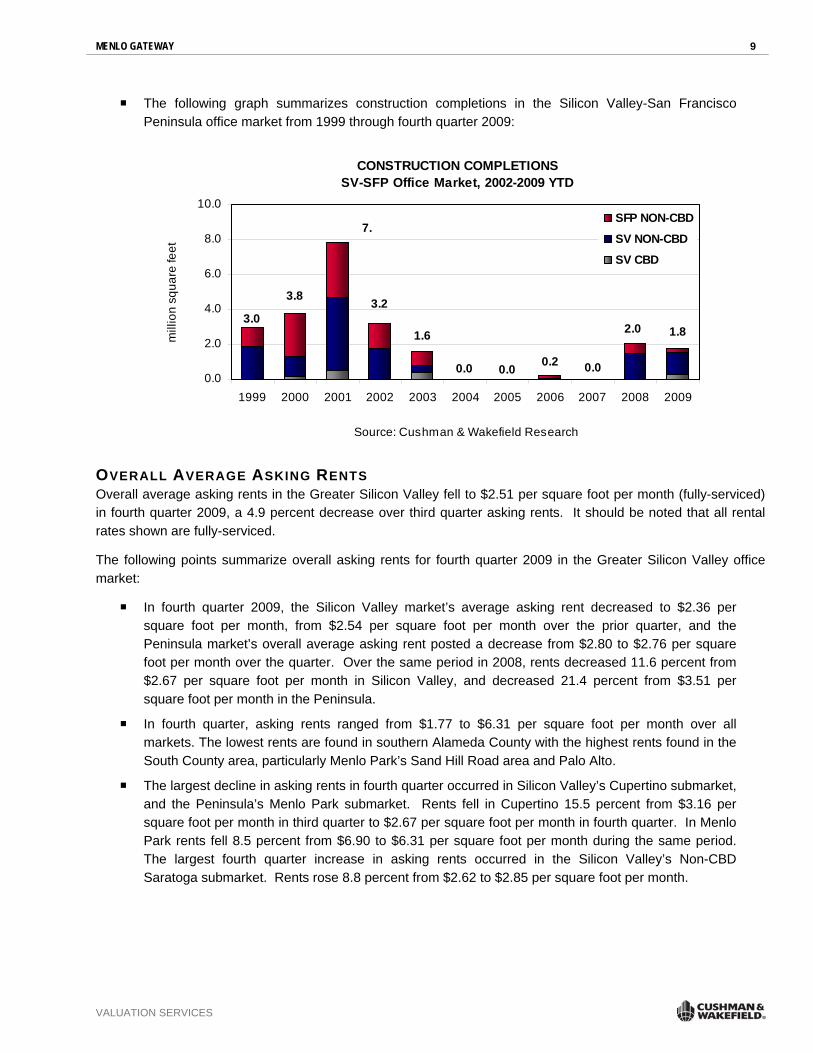
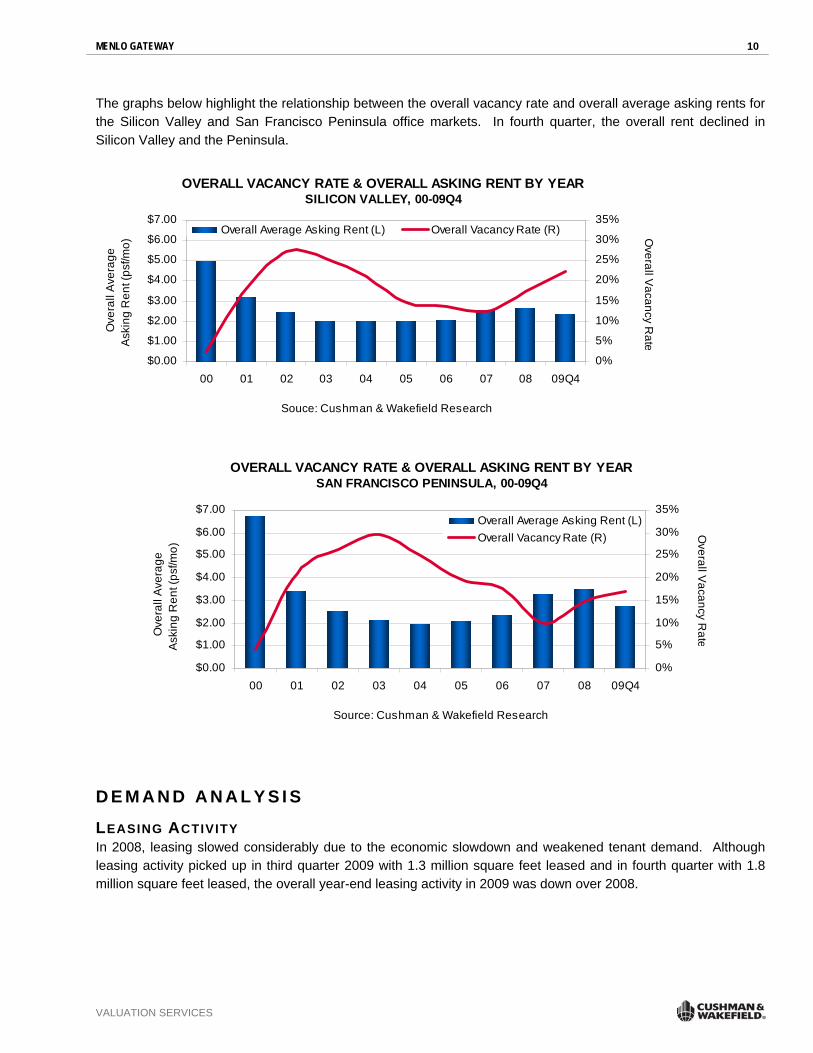
The graphs below highlight the relationship between the overall vacancy rate and overall average asking rents for the Silicon Valley and San Francisco Peninsula office markets. In fourth quarter, the overall rent declined in Silicon Valley and the Peninsula.
OVERALL VACANCY RATE & OVERALL ASKING RENT BY YEARSILICON VALLEY, 00-09Q4
$0.00
$1.00
$2.00
$3.00
$4.00
$5.00
$6.00
$7.00
00 01 02 03 04 05 06 07 08 09Q4
Souce: Cushman & Wakefield Research
Ove
rall
Ave
rage
Ask
ing
Ren
t (ps
f/mo)
0%
5%
10%
15%
20%
25%
30%
35%
Overall Vacancy R
ate
Overall Average Asking Rent (L) Overall Vacancy Rate (R)
OVERALL VACANCY RATE & OVERALL ASKING RENT BY YEARSAN FRANCISCO PENINSULA, 00-09Q4
$0.00
$1.00
$2.00
$3.00
$4.00
$5.00
$6.00
$7.00
00 01 02 03 04 05 06 07 08 09Q4
Source: Cushman & Wakefield Research
Ove
rall
Ave
rage
Ask
ing
Ren
t (ps
f/mo)
0%
5%
10%
15%
20%
25%
30%
35%
Overall Vacancy R
ate
Overall Average Asking Rent (L)Overall Vacancy Rate (R)
D E M A N D A N A L Y S I S
LEASING ACTIVITY In 2008, leasing slowed considerably due to the economic slowdown and weakened tenant demand. Although leasing activity picked up in third quarter 2009 with 1.3 million square feet leased and in fourth quarter with 1.8 million square feet leased, the overall year-end leasing activity in 2009 was down over 2008.
MENLO GATEWAY 11
VALUATION SERVICES
Greater Silicon Valley office leasing activity through fourth quarter 2009 is summarized in the following points:
Leasing activity in 2009 totaled approximately 5.3 million square feet within the Silicon Valley and Peninsula office markets, 8.3 percent less than the same period a year ago.
In 2009, a majority of the leases have been transacted for Class A space, suggesting an ongoing flight to quality among tenants.
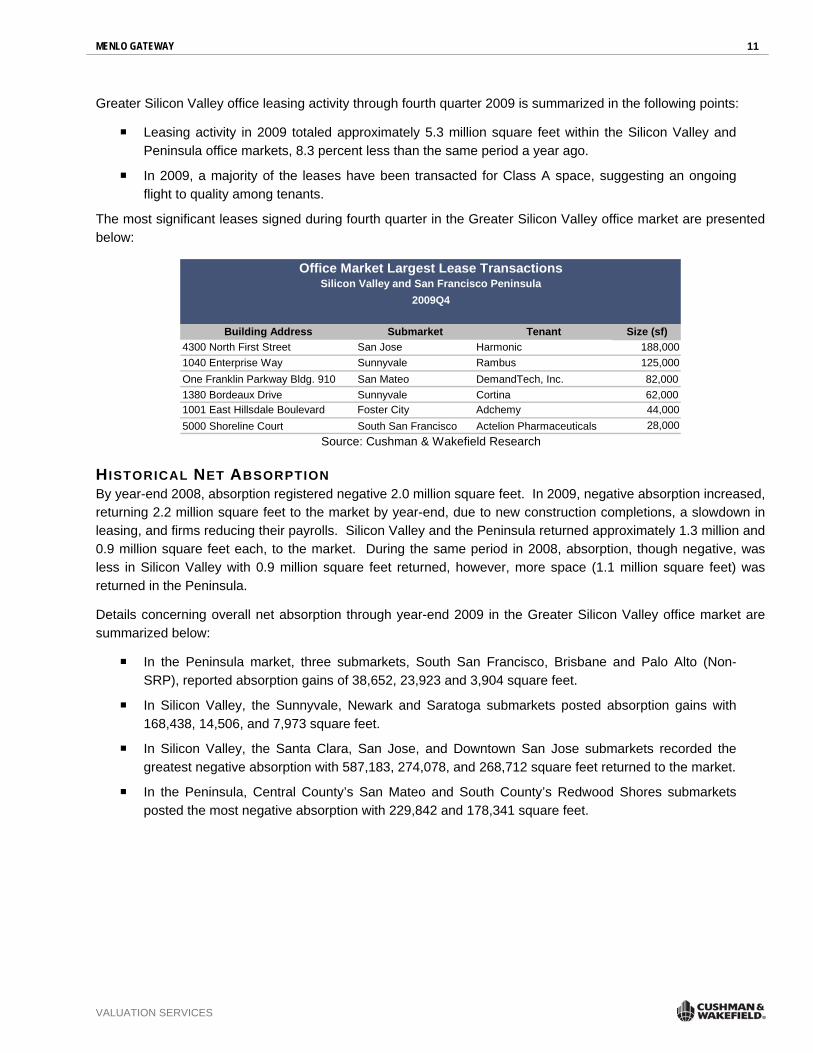
The most significant leases signed during fourth quarter in the Greater Silicon Valley office market are presented below:
Building Address Submarket Tenant Size (sf)4300 North First Street San Jose Harmonic 188,0001040 Enterprise Way Sunnyvale Rambus 125,000One Franklin Parkway Bldg. 910 San Mateo DemandTech, Inc. 82,0001380 Bordeaux Drive Sunnyvale Cortina 62,0001001 East Hillsdale Boulevard Foster City Adchemy 44,0005000 Shoreline Court South San Francisco Actelion Pharmaceuticals 28,000
Office Market Largest Lease TransactionsSilicon Valley and San Francisco Peninsula
2009Q4
Source: Cushman & Wakefield Research
HISTORICAL NET ABSORPTION By year-end 2008, absorption registered negative 2.0 million square feet. In 2009, negative absorption increased, returning 2.2 million square feet to the market by year-end, due to new construction completions, a slowdown in leasing, and firms reducing their payrolls. Silicon Valley and the Peninsula returned approximately 1.3 million and 0.9 million square feet each, to the market. During the same period in 2008, absorption, though negative, was less in Silicon Valley with 0.9 million square feet returned, however, more space (1.1 million square feet) was returned in the Peninsula.
Details concerning overall net absorption through year-end 2009 in the Greater Silicon Valley office market are summarized below:
In the Peninsula market, three submarkets, South San Francisco, Brisbane and Palo Alto (Non-SRP), reported absorption gains of 38,652, 23,923 and 3,904 square feet.
In Silicon Valley, the Sunnyvale, Newark and Saratoga submarkets posted absorption gains with 168,438, 14,506, and 7,973 square feet.
In Silicon Valley, the Santa Clara, San Jose, and Downtown San Jose submarkets recorded the greatest negative absorption with 587,183, 274,078, and 268,712 square feet returned to the market.
In the Peninsula, Central County’s San Mateo and South County’s Redwood Shores submarkets posted the most negative absorption with 229,842 and 178,341 square feet.

MENLO GATEWAY 12
VALUATION SERVICES
The following charts depict historical net absorption trends in the Silicon Valley-San Francisco Peninsula office market, and also by the CBD and non-CBD submarkets since 2002. As noted, the Silicon Valley market returned the greatest amount of space to the market by year-end 2009.
OVERALL NET ABSORPTION SV-SFP Office Market, 2002-2009 YTD
-2.2
-4.1
-1.6
1.1
3.2
0.1
1.9
-2.0
-6.0
-4.0
-2.0
0.0
2.0
4.0
6.0
2002 2003 2004 2005 2006 2007 2008 2009
Source: Cushman & Wakefield Research
mill
ion
squa
re fe
et
OVERALL NET ABSORPTIONBY CBD & NON-CBD
SV-SFP Office Market, 2002-2009 YTD
-3.0
-2.0
-1.0
0.0
1.0
2.0
3.0
2002 2003 2004 2005 2006 2007 2008 2009
Source: Cushman & Wakefield Research
mill
ion
squa
re fe
et
SV CBDSV NON-CBDSFP NON-CBD
DEMAND DRIVERS Silicon Valley is considered the hub of the high-tech industry in the United States, and continues to be one of the top research and development centers in the world. Being the most innovative and inventive cities in America, the region has received more patents than any other technology region in the United States. The area is considered an attractive location for corporate headquarters, as well as startup companies. Silicon Valley is home to 17 of the 2009 Fortune 500 corporations. Although the high-tech sector has shown considerable

MENLO GATEWAY 13
VALUATION SERVICES
resiliency through the economic slowdown, the industry has weakened. In the second half of 2008 to present, the tech sector has taken hits as firms have downsized their workforce. Even though companies are doing what is necessary to weather the economic storm, the following attributes continue to make the region a desirable location for the business community and workforce:
A highly skilled, well-educated workforce of engineers and scientists from major universities in the area
Silicon Valley’s venture capital investments are the largest in the nation
Technology breakthroughs in life sciences and clean industries continue to create a new avenue of growth for the region
Silicon Valley enjoys strong cultural and economic ties to some of the prominent economies in the world, including China, India, Taiwan and Europe.
OFFICE-USING EMPLOYMENT Office-using employment in the Greater Silicon Valley market is most highly concentrated east of Interstate 280, along US-101, and west of Interstate 880.
Further details follow:
Between 1999 and 2008, office-using employment growth in the Greater Silicon Valley was negative, with an average decrease of 0.6 percent per year, compared to the 1.1 percent average growth rate on the national level.
However, between 2009 and 2013, Greater Silicon Valley is projected to slightly exceed the U.S. in terms of office-using employment growth, with 0.9 percent growth per year versus 0.8 percent growth for the U.S.
The graph below depicts the annual growth rates in office-using employment from the most recent economic stabilization in 2004, through 2013:
Office-Using Employment GrowthSV-SFP vs. United States, 2004-2013
0.5%
-4.4%
2.5%
1.9%
3.7%4.2%
0.2%
1.7%
-0.1%
1.4% 1.0%2.3%1.1%
1.8%
0.2% 1.4%
3.4% 3.3%
-3.6%-0.7%
-6.0%
-4.0%
-2.0%
0.0%
2.0%
4.0%
6.0%
2004 2005 2006 2007 2008 2009 2010 2011 2012 2013
Source: Data Courtesy of Moody's Economy.com
SV_SFPUnited States

MENLO GATEWAY 14
VALUATION SERVICES
DEMAND ANALYSIS Demand for office space within the market is tied to changes in office-using employment over the next several years. Using office-using employment forecasts and assumptions on space per employee and each submarket’s share of demand, a reasonable estimate of office space demand can be compiled.
Based upon an analysis of historical employment and office space data, the following assumptions are applied in the demand forecast:
Office-using employment growth is related to increases in non-manufacturing employment. Since nominal office demand is generated by the manufacturing sector, manufacturing jobs are excluded from the analysis.
Using employment figures supplied by Moody’s Economy.com, Silicon Valley office-using employment, including both private and public office space, comprises roughly 63.0 percent of total non-manufacturing employment. Office-using employment in this demand analysis includes financial services, information technology, professional and business services, education and health services, government, and other services.
The office space per employee allocated by companies ranges widely, based upon the type of industry and the dynamics (particularly cost) prevailing within the local market. Office ratios quoted by firms and industries range from 75 to well over 300 square feet per person. For this analysis, an average space-per-employee ratio of 200 square feet is deemed reasonable.
The demand capture ratios for the major markets are based upon actual historical space demand within each market as a percent of total demand in the overall Greater Silicon Valley market.
The demand analysis results are presented in the table that follows. Highlights of the analysis include:
Office-using employment increases are expected to translate into a projected average annual demand of almost 1.2 million square feet of space per year. This is in line with the Greater Silicon Valley office market absorption over the past fours years where an average of about 1.1 million square feet were absorbed each year through 2008. However, due to strained market conditions, absorption turned negative in 2008 and 2009.
Though not included in the analysis, there are 1.0 million square feet of space currently under construction in the Greater Silicon Valley office market. The impact of its delivery, if included in the demand analysis, would slightly increase the oversupply to 3.94 years.
MENLO GATEWAY 15
VALUATION SERVICES
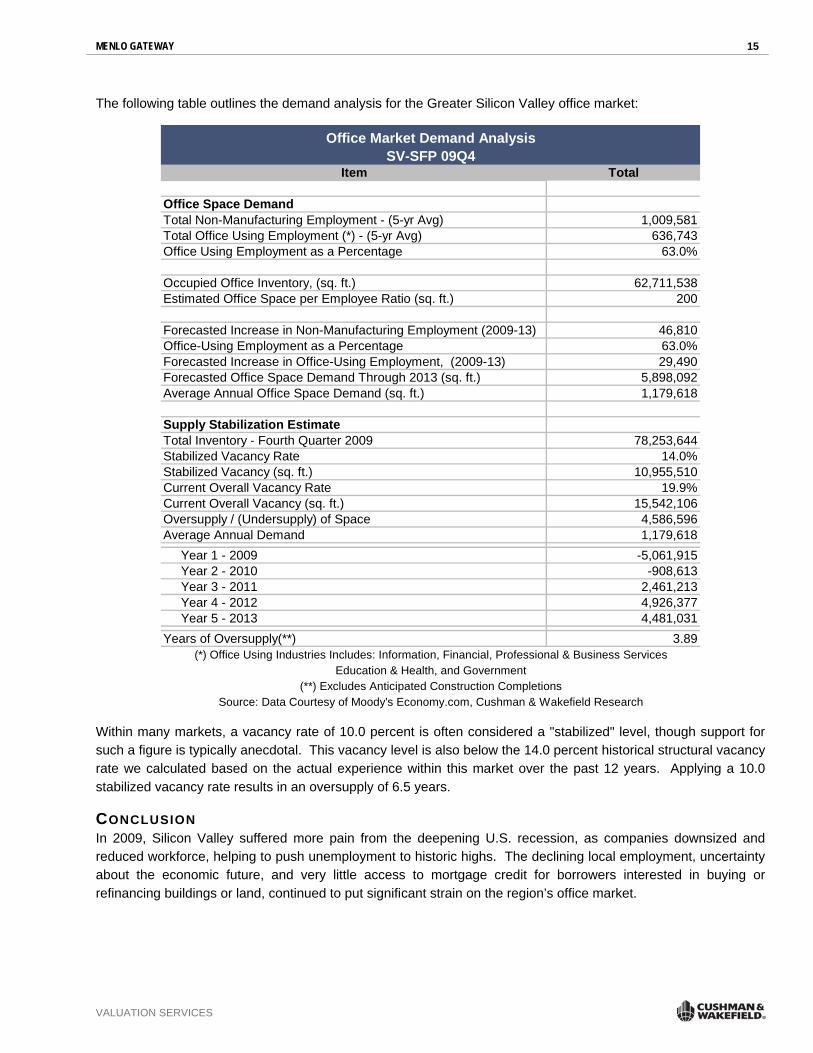
The following table outlines the demand analysis for the Greater Silicon Valley office market:
Item Total
Office Space DemandTotal Non-Manufacturing Employment - (5-yr Avg) 1,009,581Total Office Using Employment (*) - (5-yr Avg) 636,743Office Using Employment as a Percentage 63.0%
Occupied Office Inventory, (sq. ft.) 62,711,538Estimated Office Space per Employee Ratio (sq. ft.) 200
Forecasted Increase in Non-Manufacturing Employment (2009-13) 46,810Office-Using Employment as a Percentage 63.0%Forecasted Increase in Office-Using Employment, (2009-13) 29,490Forecasted Office Space Demand Through 2013 (sq. ft.) 5,898,092Average Annual Office Space Demand (sq. ft.) 1,179,618
Supply Stabilization EstimateTotal Inventory - Fourth Quarter 2009 78,253,644Stabilized Vacancy Rate 14.0%Stabilized Vacancy (sq. ft.) 10,955,510Current Overall Vacancy Rate 19.9%Current Overall Vacancy (sq. ft.) 15,542,106Oversupply / (Undersupply) of Space 4,586,596Average Annual Demand 1,179,618 Year 1 - 2009 -5,061,915 Year 2 - 2010 -908,613 Year 3 - 2011 2,461,213 Year 4 - 2012 4,926,377 Year 5 - 2013 4,481,031Years of Oversupply(**) 3.89
Office Market Demand AnalysisSV-SFP 09Q4
(*) Office Using Industries Includes: Information, Financial, Professional & Business Services
(**) Excludes Anticipated Construction CompletionsSource: Data Courtesy of Moody's Economy.com, Cushman & Wakefield Research
Education & Health, and Government
Within many markets, a vacancy rate of 10.0 percent is often considered a "stabilized" level, though support for such a figure is typically anecdotal. This vacancy level is also below the 14.0 percent historical structural vacancy rate we calculated based on the actual experience within this market over the past 12 years. Applying a 10.0 stabilized vacancy rate results in an oversupply of 6.5 years.
CONCLUSION In 2009, Silicon Valley suffered more pain from the deepening U.S. recession, as companies downsized and reduced workforce, helping to push unemployment to historic highs. The declining local employment, uncertainty about the economic future, and very little access to mortgage credit for borrowers interested in buying or refinancing buildings or land, continued to put significant strain on the region’s office market.
MENLO GATEWAY 16
VALUATION SERVICES
Further considerations follow:
Although development activity in the region has fallen significantly over the past year and will continue to do so, there remains 1.0 million square feet under construction. This new inventory, along with slower leasing activity, and downsizing of companies has created an imbalance of supply and demand of space, pushing vacancy rates higher. However, according to December 2009, Moody’s | Economy.com report on the region, “While the oversupply of office buildings will dampen interest in new construction in the near term, San Jose will avoid the large-scale loss of office-using employment that it experienced at the end of the tech boom of the 1990’s. The most recent peak-to-trough loss of office-using employment is forecast to total 5.0 percent—a fifth of the loss registered during the prior recession.”
It’s a favorable time to be a tenant, evidenced by greater leasing activity in fourth quarter 2009, as well as positive absorption for the quarter (a first for 2009). Office rental rates have declined, and are expected to continue downward going into 2010. Tenants in the market seeking new space are negotiating for lower rents and shorter lease terms, and tenants who have time remaining on their leases are going to landlords seeking early lease renewal negotiations to lower their rates. The downturn in the economy has also prompted landlords to offer free rent as incentives to lease space in their buildings.
According to the California Employment Development Department, Silicon Valley saw its unemployment rate hit 11.5 percent in December 2009, down from 11.9 percent the prior month, and well-above the 7.8 percent in December 2008. Between December 2008 and December 2009, employment fell by 36,200 jobs or 4.0 percent. Hiring is not expected to result in significant job gains in the near term. Job loss will continue to be a drag on the economy, impacting office demand in 2010.
MENLO GATEWAY 17
VALUATION SERVICES
Investment Considerations THE FINANCIAL CRISIS The credit crunch that began to unfold in the U.S. in mid-2007 evolved into a global financial crisis by October 2008, soon after the Lehman Brothers bankruptcy. Many market observers equate this crisis as the greatest challenge to the world’s economic health since the Great Depression. Its effects have radically reshaped the financial sector, and its consequences continue to impact nearly every other industry. Although many financial experts believe that the worst may be behind us, economic conditions remain fragile. Concerns about a “double dip” loom large in early 2010, while job creation becomes the next big obstacle to tackle.
From the start, government efforts to combat the crisis were not only robust but unprecedented. The Emergency Economic Stabilization Act of October 2008 (EESA) allowed Treasury to facilitate the $700.0 billion Troubled Asset Relief Program (TARP) also known as “the bailout”. In February of 2009, the American Recovery and Reinvestment Act of 2009 (AARA) was enacted by Congress and signed into law. Better known as the “stimulus bill”, the $787.0 billion package included federal tax cuts and extended unemployment benefits, in addition to increasing domestic spending on education, health care, and infrastructure. So far, about a third of the “stimulus” money has been spent. Time will tell if a second “stimulus” is needed, as many leading economists argue that such a step is necessary. For the time being, however, it appears that government policies have successfully reinvigorated the financial markets.
The fallout from the crisis was significant, widespread, and permanently altered the financial landscape. Institutions such as Lehman Brothers, which had been around for well over a century, were acquired, filed for Chapter 11 bankruptcy protection, or placed into federal conservatorship. Money from TARP flooded these companies with the much needed cash to stay afloat, pulling them, and the economy at large, from the brink of collapse. To date, a few major institutions such as Bank of America, JPMorgan Chase, and Goldman Sachs have repaid their TARP loans; however, most of this has been done with capital raised from the issuance of equity securities and debt, not necessarily guaranteed by the federal government.
ECONOMIC IMPACT The U.S. officially entered this recession in December 2007, although the National Bureau of Economic Research (NBER) didn’t declare it until a year later. At the moment, no official end has been announced, but the economy grew by 2.2 percent in the third quarter of 2009, and preliminary estimates expect the fourth quarter GDP figure to come in at around 3.0 percent. The 2010 average GDP is expected to be around the same. Should consumer spending and other indicators continue along their current paths, the NBER will announce second quarter 2009 as the end of the recession. At eighteen months, this will be the longest post-war recession for the U.S.
Listed below are some notable economic trends:
• There will be job growth in 2010, but it is not expected to curb the unemployment rate. As of January 2010, the national unemployment rate dipped slightly to 9.7 percent; however, the White House reported that the 2010 unemployment rate will average about 10.0 percent. Despite this, job growth is still expected to climb at a rate of 95,000 per month.
• January 2010’s same-store retail sales beat expectations, bolstering talk of a budding rebound for the nation’s malls and discounters. Thomson Reuters, reported that January 2010 same-store retail sales increased by 3.3 percent, significantly higher than the 5.7 percent decline last January. Furthermore, this is the fifth consecutive month, indicating that a trend is emerging.

MENLO GATEWAY 18
VALUATION SERVICES
• Home prices continued their downward spiral and fell by 11.9 percent in 2009. Still, the National Association of Realtors found the latest quarter-over-quarter drop (2.9 percent) encouraging as it was the smallest price decline in nearly two years. Also notable, was the increase in the number of homes sold. Between October and December 2009, more than 6 million homes changed hands, a 27.2 percent increase from the same time period in 2008.
COMMERCIAL REAL ESTATE MARKET IMPACT Commercial real estate is expected to be the next big phase in the credit crisis, and the slump could rival or even exceed the one experienced in the early 1990s. An analysis of FDIC data shows that the write-off and delinquency rate for commercial real estate loans at all banks increased precipitously. The third quarter 2009 figure stands at 8.7 percent, nearly double the rate of 4.7 percent a year prior. Experts warn that this rate may reach as high as 12.1 percent over the next two years due to billions of dollars of pro forma loans that never stabilized in tandem with the resetting of partial interest only loans.
Reduced credit availability and sellers’ refusals to lower pricing, despite investor concerns over market turmoil, translated into significantly reduced transaction volume. According to Real Capital Analytics, the dollar volume of commercial real estate sales increased about 310.0 percent between 2003 and 2007, but decreased by 72.0 percent in 2008. For 2009, total sales volume is down 63.5 percent from 2008, and by about 90.0 percent from the height of the market in 2007.
When looking at data on a quarter-by-quarter basis, however, it becomes evident that total sales volume began to pick up some steam in 2009, particularly towards the end of the year. In fact, between the first and last quarters of 2009, total sales volume increased by 74.4 percent, with more than half of that sales volume transpiring during fourth quarter. Compared to fourth quarter 2008, sales volume was down 9.9 percent; however, this is a significant improvement over the 83.5 percent drop between fourth quarter 2007 and fourth quarter 2008. This information implies that the seller/buyer disconnect is closing and that some life may be restored to the investment market in 2010. Still, mounting foreclosures will be a thorn in recovery’s side and will temper any significant growth that occurs.
The following graph displays national transaction activity by property type between 2001 and 2009:
0.050.0
100.0150.0200.0250.0300.0350.0400.0450.0500.0550.0
01 02 03 04 05 06 07 08 09*
National Transaction Activity by Property Type
Apartment Hotel Industrial Office Retail
Source: Real Capital Analytics, Inc.Notes: * year-end 2009, Hotel data not avail. until 2004, Numbers ref lect billions
MENLO GATEWAY 19
VALUATION SERVICES
While it is difficult to get an accurate reading on the investment market because of the scarcity of transactions, this much is certain: prices are down, cap rates are up, and real estate capital and risk have been fundamentally re-priced for the foreseeable future. What impact this will have on long-term allocation to the sector remains to be seen, but certain trends and considerations are apparent, including:
Current market turmoil is generating continued reassessment of market and property-level risk by market participants. In valuation terms, this risk re-pricing is reflected in our estimates of rent and expense growth, capitalization rates, internal rates of return, and other assumptions underlying cash flow forecasts.
We are also considering the impact of the cost of capital. Mortgage-equity models reflect an increase in overall capitalization rates if interest rates rise or there is an increase in the proportion of equity to debt. The current market has been witnessing both events.
Over the past few years, real estate benefited from a lack of attractive alternatives for equity investors with an abundance of capital. With highly-leveraged buyers removed from the market, we may see that re-sale risk has increased in the short term as a result of this “de-levering.”
To facilitate a transaction in the market, assumable or seller financing is desirable to generate investor interest. With financing from banks and traditional sources unavailable and/or at terms disagreeable to purchasers, alternatives are required for negotiations to gain traction, even for deals considered to be “typically” leveraged by historical standards.
Purchasers must now provide higher equity contributions and lenders are adhering to more conventional underwriting standards. This de-levering mitigates risk and will benefit credit and real estate markets over the long term.
The actions listed above have been or are expected to be implemented by investors to offset the risks associated with the uncertainties in the credit markets. These actions are reflected in our rate selections along with property specific considerations.
CONCLUSION As market observers who simulate behavior rather than affect it, we await market evidence as to the long term impact of the credit crisis. Risk is considered in the context of our anticipation of rental growth and most vividly in our cap and discount rate selections. Current investor behavior reflects a higher cost of capital, concern about the economy, a reduced pool of investors, and more conservative rent growth and cash flow modeling assumptions. We recognize also that the new market purchasers will have a greater equity interest and lenders will be working with more conventional lending margins, debt and equity coverage ratios.
MENLO GATEWAY 20
VALUATION SERVICES
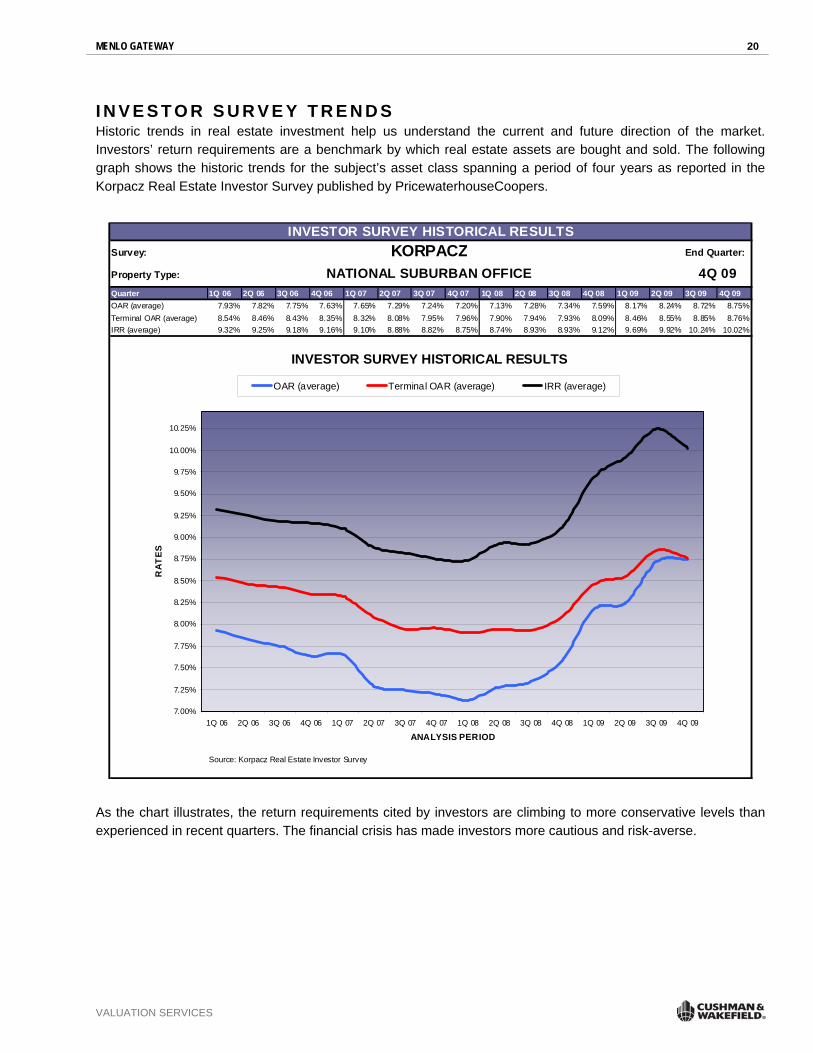
I N V E S T O R S U R V E Y T R E N D S Historic trends in real estate investment help us understand the current and future direction of the market. Investors’ return requirements are a benchmark by which real estate assets are bought and sold. The following graph shows the historic trends for the subject’s asset class spanning a period of four years as reported in the Korpacz Real Estate Investor Survey published by PricewaterhouseCoopers.
INVESTOR SURVEY HISTORICAL RESULTSSurvey: KORPACZ End Quarter:
Property Type:
Quarter 1Q 06 2Q 06 3Q 06 4Q 06 1Q 07 2Q 07 3Q 07 4Q 07 1Q 08 2Q 08 3Q 08 4Q 08 1Q 09 2Q 09 3Q 09 4Q 09OAR (average) 7.93% 7.82% 7.75% 7.63% 7.65% 7.29% 7.24% 7.20% 7.13% 7.28% 7.34% 7.59% 8.17% 8.24% 8.72% 8.75%Terminal OAR (average) 8.54% 8.46% 8.43% 8.35% 8.32% 8.08% 7.95% 7.96% 7.90% 7.94% 7.93% 8.09% 8.46% 8.55% 8.85% 8.76%IRR (average) 9.32% 9.25% 9.18% 9.16% 9.10% 8.88% 8.82% 8.75% 8.74% 8.93% 8.93% 9.12% 9.69% 9.92% 10.24% 10.02%
Source: Korpacz Real Estate Investor Survey
NATIONAL SUBURBAN OFFICE 4Q 09
INVESTOR SURVEY HISTORICAL RESULTS
7.00%
7.25%
7.50%
7.75%
8.00%
8.25%
8.50%
8.75%
9.00%
9.25%
9.50%
9.75%
10.00%
10.25%
1Q 06 2Q 06 3Q 06 4Q 06 1Q 07 2Q 07 3Q 07 4Q 07 1Q 08 2Q 08 3Q 08 4Q 08 1Q 09 2Q 09 3Q 09 4Q 09
ANALYSIS PERIOD
RA
TE
S
OAR (average) Terminal OAR (average) IRR (average)
As the chart illustrates, the return requirements cited by investors are climbing to more conservative levels than experienced in recent quarters. The financial crisis has made investors more cautious and risk-averse.

MENLO GATEWAY 21
VALUATION SERVICES
C A P I T A L I Z A T I O N R A T E A N A L Y S I S On the following pages we discuss the process of how we determine an appropriate overall capitalization rate to apply to the subject’s forecast net income.
C A P I T A L I Z A T I O N R A T E F R O M I N V E S T O R S U R V E Y S We have considered data extracted from the Korpacz Real Estate Investor Survey for competitive properties. The most recent information from this survey is listed below:
CAPITALIZATION RATESSurvey Date AverageKorpacz Fourth Quarter 2009 6.75% - 12.00% 8.75%Korpacz - Refers to National Suburban Office market regardless of class or occupancy
Range
No Property Location / Address Building TypeYear Built orRenovated Seller Buyer
CloseDate Total Sale Price
Sale Price per SF Total SF
Capilization Rate NOI / SF
Occupancy at Sale
1 3373-3375 Hillview AvenuePalo Alto, CA Class A Office/Lab 2005 Hillview Avenue Realty LLC
(IDT Corp.)BGR Associates (Wareham
Development) 7/09 $62,730,000 $522.75 120,000 7.16% $37.41 100.0%
2 18880 Homestead RoadCupertino, CA Office/R&D 2008 iStar Financial Menlo Equities 10/08 $37,800,000 $368.46 102,588 6.86% $25.29 100.0%
3 Ygnacio Center2001 & 2003 North Main Street1990 North CaliforniaWalnut Creek, CA
Class A Office/Streetfront retail 2003 Pembroke Real Estate
(Fidelity) Legacy Partners 3/08 $175,000,000 $350.00 500,000 5.77% $20.20 89.0%
4 900 & 910 East Hamilton AvenueCampbell, CA Class A Office 1989 Ohio State Teachers
Retirement System Legacy Partners 1/08 $131,100,000 $374.73 349,849 5.72% $21.45 82.0%
5 Parkside Towers1001 & 1051 East HillsdaleFoster City, CA
Class A Office 2001 Parkside Associates NF LP Parkside Towers LP 12/07 $179,750,000 $450.03 399,422 5.49% $24.72 99.0%
6 601 California AvenuePalo Alto, CA Class A Office 1998 601 California Avenue JV,
LLCSRI Eight 601 California
LLC (Shorenst 12/07 $85,000,000 $761.29 111,653 5.69% $43.32 100.0%
7 1184, 1194, & 1220 North MathildaSunnyvale, CA Class A Office 2000 GE Asset Management Tishman Speyer 7/07 $226,200,000 $532.45 424,825 7.45% $39.65 100.0%
8 McCandless Towers3845-3965 Freedom CircleSanta Clara, CA
Class A Office 1986 McCandless Towers Phase I and Birk S. Tishman Speyer Properties 6/07 $212,500,000 $508.52 417,876 5.26% $26.74 96.0%
9 650 Page Mill RoadPalo Alto, CA Class A Office 1994 Hewlett-Packard Hines 5/07 $98,000,000 $532.08 184,182 6.28% $33.40 100.0%
10 Pacific Shores Center1400 & 1500 Seaport BoulevardRedwood City, CA
Class A Office 2001 US/D2 Holdings(Starwood Capital Group) Shorenstein Development 4/07 $245,000,000 $547.18 447,747 7.01% $38.36 100.0%
11 Park Place @ Bay Meadows1010-1060, 100 & 1200 Park PlaceSan Mateo, CA
Class A Office 2002 Bay Meadows Park Place Investors, LLC JP Morgan 3/07 $152,000,000 $650.00 233,846 5.20% $33.80 99.0%
12 701 Gateway BoulevardSouth San Francisco, CA Class A Office 1998 CF Gateway LLC Broadway 701 Gateway Fee
LLC 3/07 $66,000,000 $387.39 170,369 5.70% $22.08 96.0%
Sources: C&W Valuation Advisory Services, C&W Market Research, CoStar
Building Sales - Silicon Valley and San Francisco Peninsula
C A P I T A L I Z A T I O N R A T E C O N C L U S I O N We have considered all aspects of the subject property that would influence the overall rate. Based on investor surveys and comparable building sales, our analysis suggests that a going-in capitalization rate of 8.5 percent represents reasonable investor criteria under current market conditions.

MENLO GATEWAY 22
VALUATION SERVICES
FINANCIAL ANALYSIS
MENLO GATEWAY 23
VALUATION SERVICES
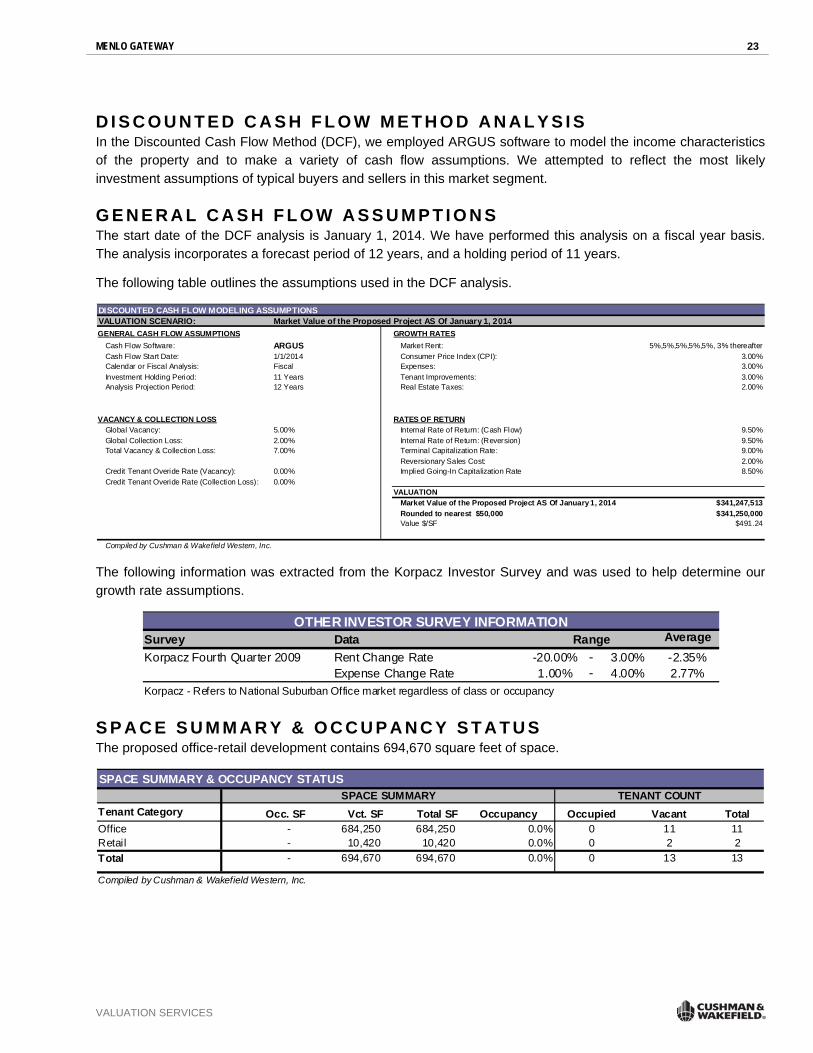
D I S C O U N T E D C A S H F L O W M E T H O D A N A L Y S I S In the Discounted Cash Flow Method (DCF), we employed ARGUS software to model the income characteristics of the property and to make a variety of cash flow assumptions. We attempted to reflect the most likely investment assumptions of typical buyers and sellers in this market segment.
G E N E R A L C A S H F L O W A S S U M P T I O N S The start date of the DCF analysis is January 1, 2014. We have performed this analysis on a fiscal year basis. The analysis incorporates a forecast period of 12 years, and a holding period of 11 years.
The following table outlines the assumptions used in the DCF analysis.
DISCOUNTED CASH FLOW MODELING ASSUMPTIONSVALUATION SCENARIO: Market Value of the Proposed Project AS Of January 1, 2014GENERAL CASH FLOW ASSUMPTIONS GROWTH RATES
Cash Flow Software: ARGUS Market Rent: 5%,5%,5%,5%,5%, 3% thereafterCash Flow Start Date: 1/1/2014 Consumer Price Index (CPI): 3.00%Calendar or Fiscal Analysis: Fiscal Expenses: 3.00%Investment Holding Period: 11 Years Tenant Improvements: 3.00%Analysis Projection Period: 12 Years Real Estate Taxes: 2.00%
na na
VACANCY & COLLECTION LOSS RATES OF RETURNGlobal Vacancy: 5.00% Internal Rate of Return: (Cash Flow) 9.50%Global Collection Loss: 2.00% Internal Rate of Return: (Reversion) 9.50%Total Vacancy & Collection Loss: 7.00% Terminal Capitalization Rate: 9.00%
Reversionary Sales Cost: 2.00%Credit Tenant Overide Rate (Vacancy): 0.00% Implied Going-In Capitalization Rate 8.50%Credit Tenant Overide Rate (Collection Loss): 0.00%
VALUATIONCAPITAL EXPENDITURES Market Value of the Proposed Project AS Of January 1, 2014 $341,247,513
Rounded to nearest $50,000 $341,250,000Value $/SF $491.24
Compiled by Cushman & Wakefield Western, Inc.
The following information was extracted from the Korpacz Investor Survey and was used to help determine our growth rate assumptions.
OTHER INVESTOR SURVEY INFORMATIONSurvey Data AverageKorpacz Fourth Quarter 2009 Rent Change Rate -20.00% - 3.00% -2.35%
Expense Change Rate 1.00% - 4.00% 2.77%Korpacz - Refers to National Suburban Office market regardless of class or occupancy
Range
S P A C E S U M M A R Y & O C C U P A N C Y S T A T U S The proposed office-retail development contains 694,670 square feet of space.
SPACE SUMMARY & OCCUPANCY STATUSSPACE SUMMARY TENANT COUNT
Tenant Category Occ. SF Vct. SF Total SF Occupancy Occupied Vacant TotalOffice - 684,250 684,250 0.0% 0 11 11Retail - 10,420 10,420 0.0% 0 2 2Total - 694,670 694,670 0.0% 0 13 13
Compiled by Cushman & Wakefield Western, Inc.
MENLO GATEWAY 24
VALUATION SERVICES
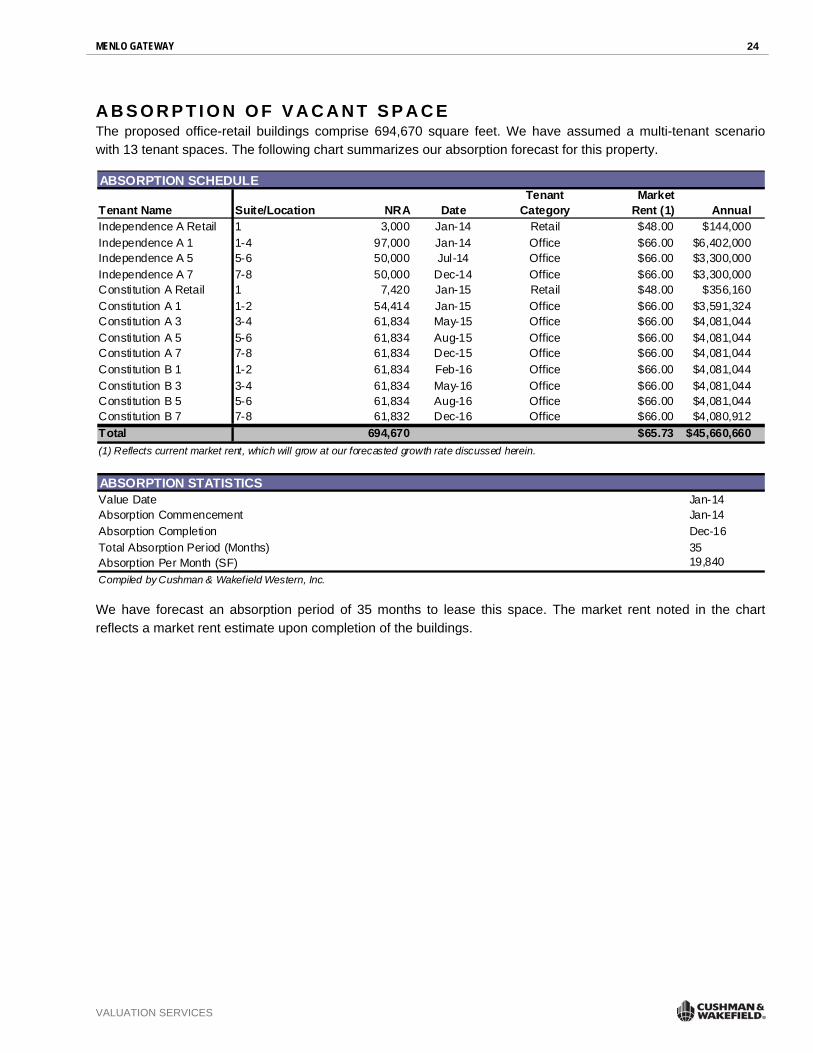
A B S O R P T I O N O F V A C A N T S P A C E The proposed office-retail buildings comprise 694,670 square feet. We have assumed a multi-tenant scenario with 13 tenant spaces. The following chart summarizes our absorption forecast for this property.
ABSORPTION SCHEDULE
Tenant Name Suite/Location NRA DateTenant
CategoryMarket
Rent (1) AnnualIndependence A Retail 1 3,000 Jan-14 Retail $48.00 $144,000Independence A 1 1-4 97,000 Jan-14 Office $66.00 $6,402,000Independence A 5 5-6 50,000 Jul-14 Office $66.00 $3,300,000Independence A 7 7-8 50,000 Dec-14 Office $66.00 $3,300,000Constitution A Retail 1 7,420 Jan-15 Retail $48.00 $356,160Constitution A 1 1-2 54,414 Jan-15 Office $66.00 $3,591,324Constitution A 3 3-4 61,834 May-15 Office $66.00 $4,081,044Constitution A 5 5-6 61,834 Aug-15 Office $66.00 $4,081,044Constitution A 7 7-8 61,834 Dec-15 Office $66.00 $4,081,044Constitution B 1 1-2 61,834 Feb-16 Office $66.00 $4,081,044Constitution B 3 3-4 61,834 May-16 Office $66.00 $4,081,044Constitution B 5 5-6 61,834 Aug-16 Office $66.00 $4,081,044Constitution B 7 7-8 61,832 Dec-16 Office $66.00 $4,080,912Total 694,670 $65.73 $45,660,660(1) Reflects current market rent, which will grow at our forecasted growth rate discussed herein.
ABSORPTION STATISTICSValue Date Jan-14Absorption Commencement Jan-14Absorption Completion Dec-16Total Absorption Period (Months) 35Absorption Per Month (SF) 19,840Compiled by Cushman & Wakefield Western, Inc.
We have forecast an absorption period of 35 months to lease this space. The market rent noted in the chart reflects a market rent estimate upon completion of the buildings.
MENLO GATEWAY 25
VALUATION SERVICES
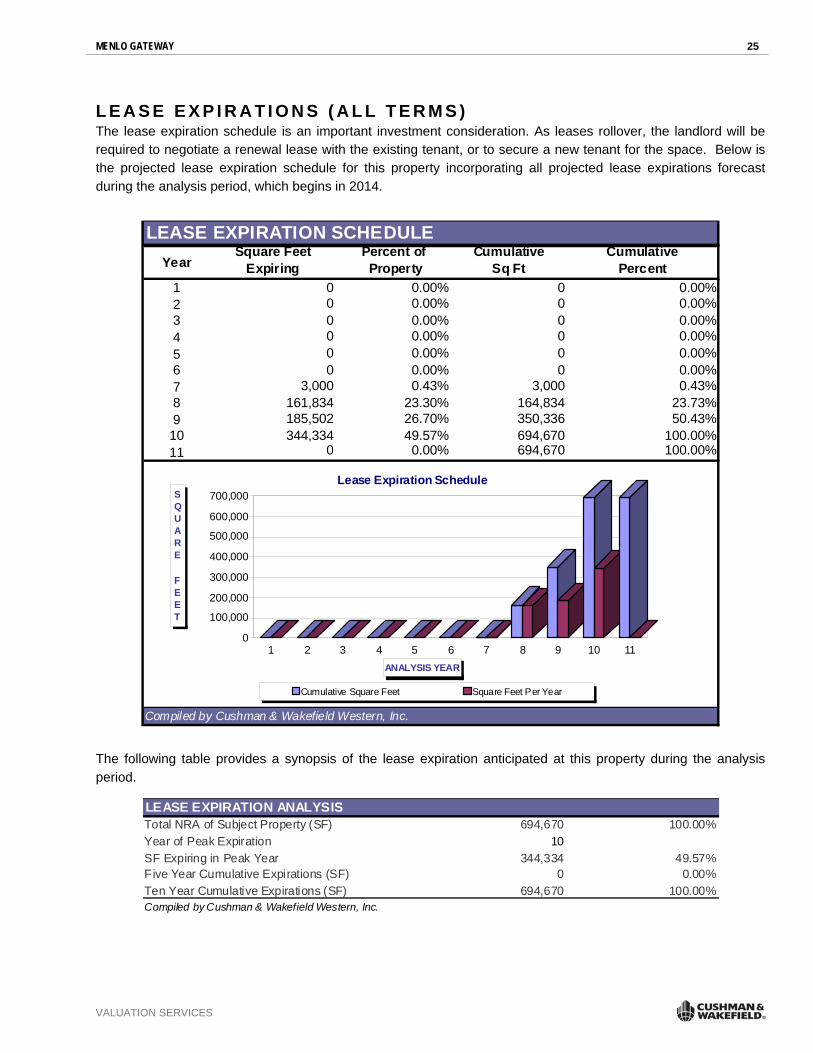
L E A S E E X P I R A T I O N S ( A L L T E R M S ) The lease expiration schedule is an important investment consideration. As leases rollover, the landlord will be required to negotiate a renewal lease with the existing tenant, or to secure a new tenant for the space. Below is the projected lease expiration schedule for this property incorporating all projected lease expirations forecast during the analysis period, which begins in 2014.
LEASE EXPIRATION SCHEDULEYear
Square Feet Expiring
Percent of Property
CumulativeSq Ft
Cumulative Percent
1 0 0.00% 0 0.00%2 0 0.00% 0 0.00%3 0 0.00% 0 0.00%4 0 0.00% 0 0.00%5 0 0.00% 0 0.00%6 0 0.00% 0 0.00%7 3,000 0.43% 3,000 0.43%8 161,834 23.30% 164,834 23.73%9 185,502 26.70% 350,336 50.43%10 344,334 49.57% 694,670 100.00%11 0 0.00% 694,670 100.00%
Compiled by Cushman & Wakefield Western, Inc.
0
100,000
200,000
300,000
400,000
500,000
600,000
700,000SQUARE FEET
1 2 3 4 5 6 7 8 9 10 11ANALYSIS YEAR
Lease Expiration Schedule
Cumulative Square Feet Square Feet Per Year
The following table provides a synopsis of the lease expiration anticipated at this property during the analysis period.
LEASE EXPIRATION ANALYSISTotal NRA of Subject Property (SF) 694,670 100.00%Year of Peak Expiration 10SF Expiring in Peak Year 344,334 49.57%Five Year Cumulative Expirations (SF) 0 0.00%Ten Year Cumulative Expirations (SF) 694,670 100.00%Compiled by Cushman & Wakefield Western, Inc.
MENLO GATEWAY 26
VALUATION SERVICES
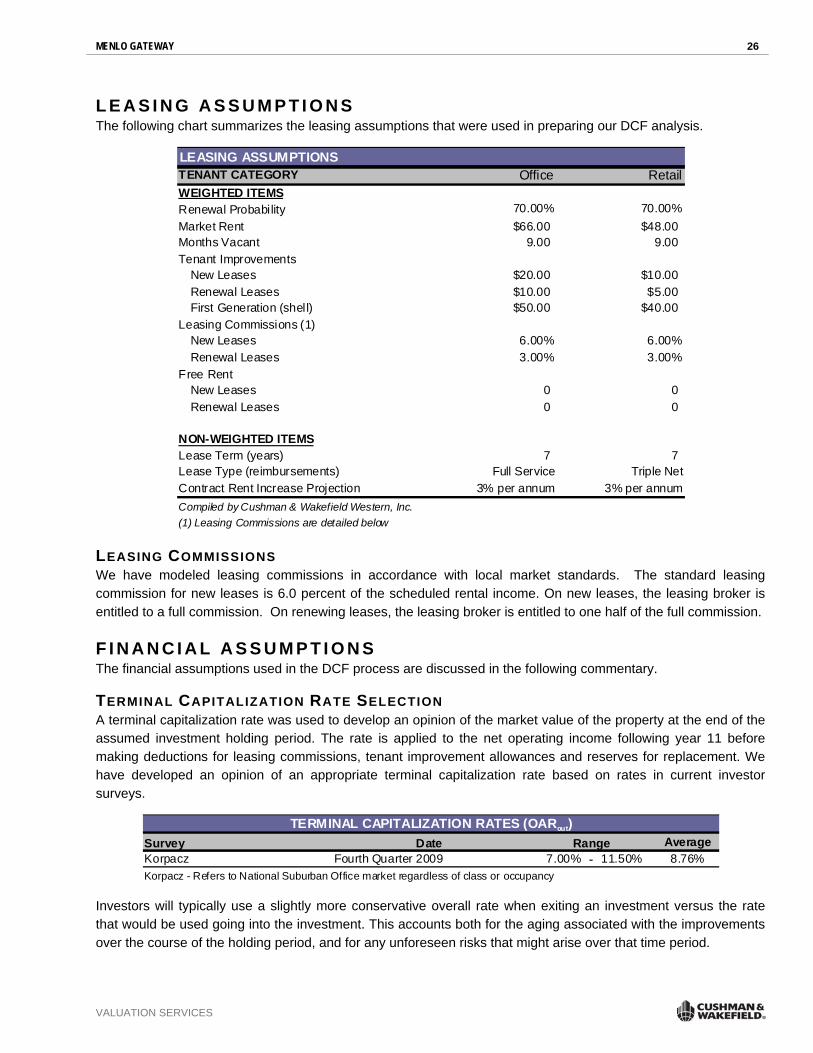
L E A S I N G A S S U M P T I O N S The following chart summarizes the leasing assumptions that were used in preparing our DCF analysis.
LEASING ASSUMPTIONSTENANT CATEGORY Office RetailWEIGHTED ITEMSRenewal Probability 70.00% 70.00%Market Rent $66.00 $48.00Months Vacant 9.00 9.00Tenant Improvements
New Leases $20.00 $10.00Renewal Leases $10.00 $5.00First Generation (shell) $50.00 $40.00
Leasing Commissions (1)New Leases 6.00% 6.00%Renewal Leases 3.00% 3.00%
Free RentNew Leases 0 0Renewal Leases 0 0
NON-WEIGHTED ITEMSLease Term (years) 7 7Lease Type (reimbursements) Full Service Triple NetContract Rent Increase Projection 3% per annum 3% per annumCompiled by Cushman & Wakefield Western, Inc.(1) Leasing Commissions are detailed below
LEASING COMMISSIONS We have modeled leasing commissions in accordance with local market standards. The standard leasing commission for new leases is 6.0 percent of the scheduled rental income. On new leases, the leasing broker is entitled to a full commission. On renewing leases, the leasing broker is entitled to one half of the full commission.
F I N A N C I A L A S S U M P T I O N S The financial assumptions used in the DCF process are discussed in the following commentary.
TERMINAL CAPITALIZATION RATE SELECTION A terminal capitalization rate was used to develop an opinion of the market value of the property at the end of the assumed investment holding period. The rate is applied to the net operating income following year 11 before making deductions for leasing commissions, tenant improvement allowances and reserves for replacement. We have developed an opinion of an appropriate terminal capitalization rate based on rates in current investor surveys.
TERMINAL CAPITALIZATION RATES (OARout)Survey Date AverageKorpacz Fourth Quarter 2009 7.00% - 11.50% 8.76%Korpacz - Refers to National Suburban Office market regardless of class or occupancy
Range
Investors will typically use a slightly more conservative overall rate when exiting an investment versus the rate that would be used going into the investment. This accounts both for the aging associated with the improvements over the course of the holding period, and for any unforeseen risks that might arise over that time period.
MENLO GATEWAY 27
VALUATION SERVICES
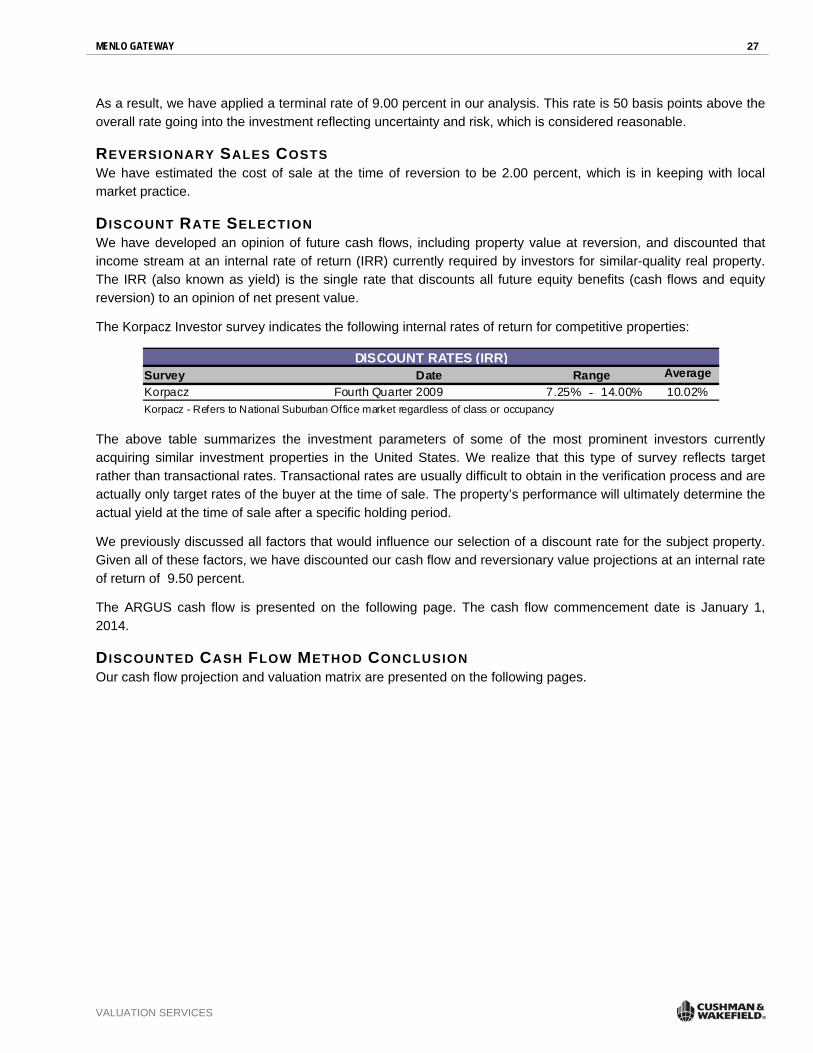
As a result, we have applied a terminal rate of 9.00 percent in our analysis. This rate is 50 basis points above the overall rate going into the investment reflecting uncertainty and risk, which is considered reasonable.
REVERSIONARY SALES COSTS We have estimated the cost of sale at the time of reversion to be 2.00 percent, which is in keeping with local market practice.
DISCOUNT RATE SELECTION We have developed an opinion of future cash flows, including property value at reversion, and discounted that income stream at an internal rate of return (IRR) currently required by investors for similar-quality real property. The IRR (also known as yield) is the single rate that discounts all future equity benefits (cash flows and equity reversion) to an opinion of net present value.
The Korpacz Investor survey indicates the following internal rates of return for competitive properties:
DISCOUNT RATES (IRR)Survey Date AverageKorpacz Fourth Quarter 2009 7.25% - 14.00% 10.02%Korpacz - Refers to National Suburban Office market regardless of class or occupancy
Range
The above table summarizes the investment parameters of some of the most prominent investors currently acquiring similar investment properties in the United States. We realize that this type of survey reflects target rather than transactional rates. Transactional rates are usually difficult to obtain in the verification process and are actually only target rates of the buyer at the time of sale. The property’s performance will ultimately determine the actual yield at the time of sale after a specific holding period.
We previously discussed all factors that would influence our selection of a discount rate for the subject property. Given all of these factors, we have discounted our cash flow and reversionary value projections at an internal rate of return of 9.50 percent.
The ARGUS cash flow is presented on the following page. The cash flow commencement date is January 1, 2014.
DISCOUNTED CASH FLOW METHOD CONCLUSION Our cash flow projection and valuation matrix are presented on the following pages.
MENLO GATEWAY 28
VALUATION SERVICES
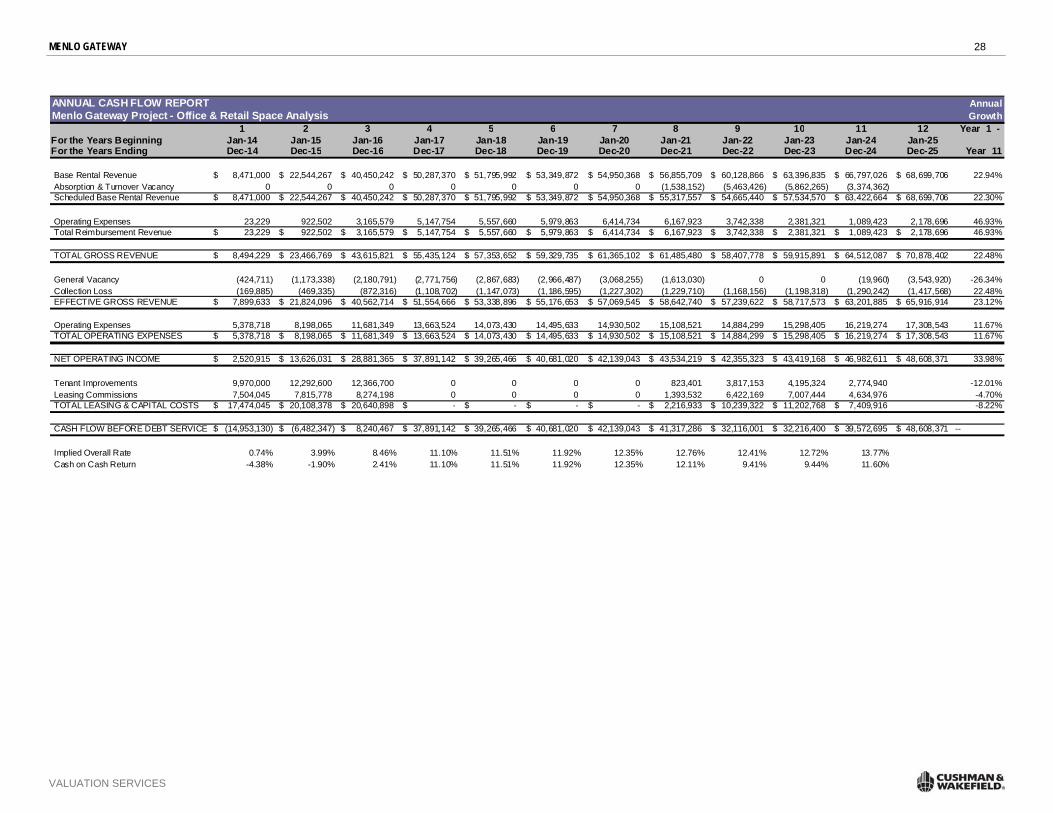
ANNUAL CASH FLOW REPORT AnnualMenlo Gateway Project - Office & Retail Space Analysis Growth
1 2 3 4 5 6 7 8 9 10 11 12 Year 1 - For the Years Beginning Jan-14 Jan-15 Jan-16 Jan-17 Jan-18 Jan-19 Jan-20 Jan-21 Jan-22 Jan-23 Jan-24 Jan-25For the Years Ending Dec-14 Dec-15 Dec-16 Dec-17 Dec-18 Dec-19 Dec-20 Dec-21 Dec-22 Dec-23 Dec-24 Dec-25 Year 11
Base Rental Revenue 8,471,000$ 22,544,267$ 40,450,242$ 50,287,370$ 51,795,992$ 53,349,872$ 54,950,368$ 56,855,709$ 60,128,866$ 63,396,835$ 66,797,026$ 68,699,706$ 22.94%Absorption & Turnover Vacancy 0 0 0 0 0 0 0 (1,538,152) (5,463,426) (5,862,265) (3,374,362)Scheduled Base Rental Revenue 8,471,000$ 22,544,267$ 40,450,242$ 50,287,370$ 51,795,992$ 53,349,872$ 54,950,368$ 55,317,557$ 54,665,440$ 57,534,570$ 63,422,664$ 68,699,706$ 22.30%
Operating Expenses 23,229 922,502 3,165,579 5,147,754 5,557,660 5,979,863 6,414,734 6,167,923 3,742,338 2,381,321 1,089,423 2,178,696 46.93%Total Reimbursement Revenue 23,229$ 922,502$ 3,165,579$ 5,147,754$ 5,557,660$ 5,979,863$ 6,414,734$ 6,167,923$ 3,742,338$ 2,381,321$ 1,089,423$ 2,178,696$ 46.93%
TOTAL GROSS REVENUE 8,494,229$ 23,466,769$ 43,615,821$ 55,435,124$ 57,353,652$ 59,329,735$ 61,365,102$ 61,485,480$ 58,407,778$ 59,915,891$ 64,512,087$ 70,878,402$ 22.48%
General Vacancy (424,711) (1,173,338) (2,180,791) (2,771,756) (2,867,683) (2,966,487) (3,068,255) (1,613,030) 0 0 (19,960) (3,543,920) -26.34%Collection Loss (169,885) (469,335) (872,316) (1,108,702) (1,147,073) (1,186,595) (1,227,302) (1,229,710) (1,168,156) (1,198,318) (1,290,242) (1,417,568) 22.48%EFFECTIVE GROSS REVENUE 7,899,633$ 21,824,096$ 40,562,714$ 51,554,666$ 53,338,896$ 55,176,653$ 57,069,545$ 58,642,740$ 57,239,622$ 58,717,573$ 63,201,885$ 65,916,914$ 23.12%
Operating Expenses 5,378,718 8,198,065 11,681,349 13,663,524 14,073,430 14,495,633 14,930,502 15,108,521 14,884,299 15,298,405 16,219,274 17,308,543 11.67%TOTAL OPERATING EXPENSES 5,378,718$ 8,198,065$ 11,681,349$ 13,663,524$ 14,073,430$ 14,495,633$ 14,930,502$ 15,108,521$ 14,884,299$ 15,298,405$ 16,219,274$ 17,308,543$ 11.67%
NET OPERATING INCOME 2,520,915$ 13,626,031$ 28,881,365$ 37,891,142$ 39,265,466$ 40,681,020$ 42,139,043$ 43,534,219$ 42,355,323$ 43,419,168$ 46,982,611$ 48,608,371$ 33.98%
Tenant Improvements 9,970,000 12,292,600 12,366,700 0 0 0 0 823,401 3,817,153 4,195,324 2,774,940 -12.01%Leasing Commissions 7,504,045 7,815,778 8,274,198 0 0 0 0 1,393,532 6,422,169 7,007,444 4,634,976 -4.70%TOTAL LEASING & CAPITAL COSTS 17,474,045$ 20,108,378$ 20,640,898$ -$ -$ -$ -$ 2,216,933$ 10,239,322$ 11,202,768$ 7,409,916$ -8.22%
CASH FLOW BEFORE DEBT SERVICE (14,953,130)$ (6,482,347)$ 8,240,467$ 37,891,142$ 39,265,466$ 40,681,020$ 42,139,043$ 41,317,286$ 32,116,001$ 32,216,400$ 39,572,695$ 48,608,371$ --
Implied Overall Rate 0.74% 3.99% 8.46% 11.10% 11.51% 11.92% 12.35% 12.76% 12.41% 12.72% 13.77%Cash on Cash Return -4.38% -1.90% 2.41% 11.10% 11.51% 11.92% 12.35% 12.11% 9.41% 9.44% 11.60%
MENLO GATEWAY 29
VALUATION SERVICES
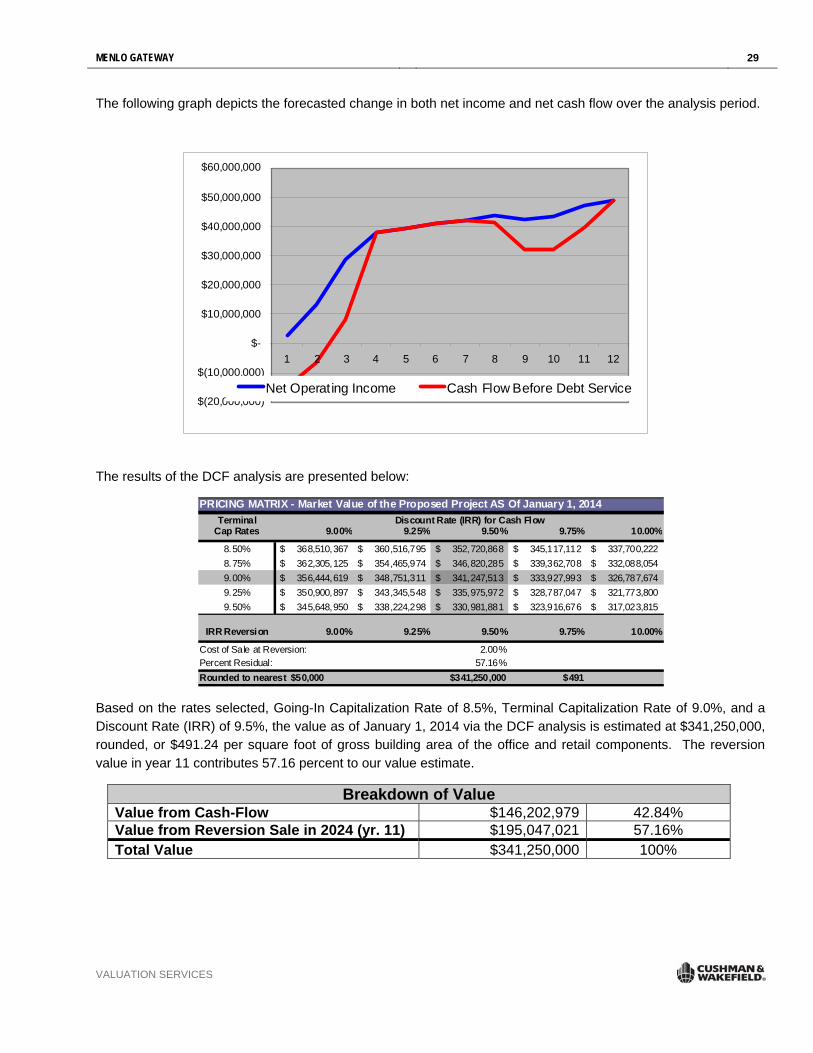
The following graph depicts the forecasted change in both net income and net cash flow over the analysis period.
$(20,000,000)
$(10,000,000)
$-
$10,000,000
$20,000,000
$30,000,000
$40,000,000
$50,000,000
$60,000,000
1 2 3 4 5 6 7 8 9 10 11 12
Net Operating Income Cash Flow Before Debt Service
The results of the DCF analysis are presented below:
PRICING MATRIX - Market Value of the Proposed Project AS Of January 1, 2014Terminal
Cap Rates 9.00% 9.25% 9.50% 9.75% 10.00%
8.50% 368,510,367$ 360,516,795$ 352,720,868$ 345,117,112$ 337,700,222$ 8.75% 362,305,125$ 354,465,974$ 346,820,285$ 339,362,708$ 332,088,054$ 9.00% 356,444,619$ 348,751,311$ 341,247,513$ 333,927,993$ 326,787,674$ 9.25% 350,900,897$ 343,345,548$ 335,975,972$ 328,787,047$ 321,773,800$ 9.50% 345,648,950$ 338,224,298$ 330,981,881$ 323,916,676$ 317,023,815$
IRR Reversion 9.00% 9.25% 9.50% 9.75% 10.00%
Cost of Sale at Reversion: 2.00%Percent Residual: 57.16%
$341,250,000 $491
Discount Rate (IRR) for Cash Flow
Rounded to nearest $50,000
Based on the rates selected, Going-In Capitalization Rate of 8.5%, Terminal Capitalization Rate of 9.0%, and a Discount Rate (IRR) of 9.5%, the value as of January 1, 2014 via the DCF analysis is estimated at $341,250,000, rounded, or $491.24 per square foot of gross building area of the office and retail components. The reversion value in year 11 contributes 57.16 percent to our value estimate.
Breakdown of Value Value from Cash-Flow $146,202,979 42.84% Value from Reversion Sale in 2024 (yr. 11) $195,047,021 57.16% Total Value $341,250,000 100%

MENLO GATEWAY 30
VALUATION SERVICES
LAND RESIDUAL ANALYSIS

MENLO GATEWAY 31
VALUATION SERVICES
Best Case Worst Case
Average Annual Rent per SF NNN $21.00 $15.00
Potential Annual Rental Income $21.00 $15.00Less: Vacancy and Collection Loss at 10% (2.10) (1.50)Effective Gross Income (EGI) $18.90 $13.50Less: Expenses (Triple Net) 3.0% of EGI (0.57) (0.41)
Net Operating Income $18.33 $13.10
Overall Capitalization Rate 9.0% 9.0%
Estimated Property Value/SF $203.70 $145.50
Estimated Construction Costs(1) ($73.97) ($73.97) Entrepreneurial Incentive 15.0% ($11.10) ($11.10)
Total: Estimated Construction Costs & Profit ($85.06) ($85.06)
Estimated Land Value per Buildable Foot $118.64 $60.44
Maximum Coverage Ratio 45% 45%
Total Gross Land Area (acres) (2) 15.94 15.94
Total Potential Net Rentable Area (square feet) 312,456 312,456
Estimated Land Value $37,068,708 $18,883,776 Less: Cost of Sales 1.0% ($370,687) ($188,838)Estimated Land Value $36,698,021 $18,694,938Final Estimated Land Value, Rounded $36,700,000 $18,700,000Estimated Land Value per Gross SF $52.86 Avg. $26.93
39.89$
(1) Construction costs are taken from Marshall & Swift and developers in the marketplace.(2) APNs: 55-234-240, 250, 260, 270 and 55-235-040, 050, 080, 100, & 110
LAND RESIDUAL ANALYSIS - Current Zoning Assuming Maximum Allowable FAR of 45%
MENLO GATEWAY 32
VALUATION SERVICES
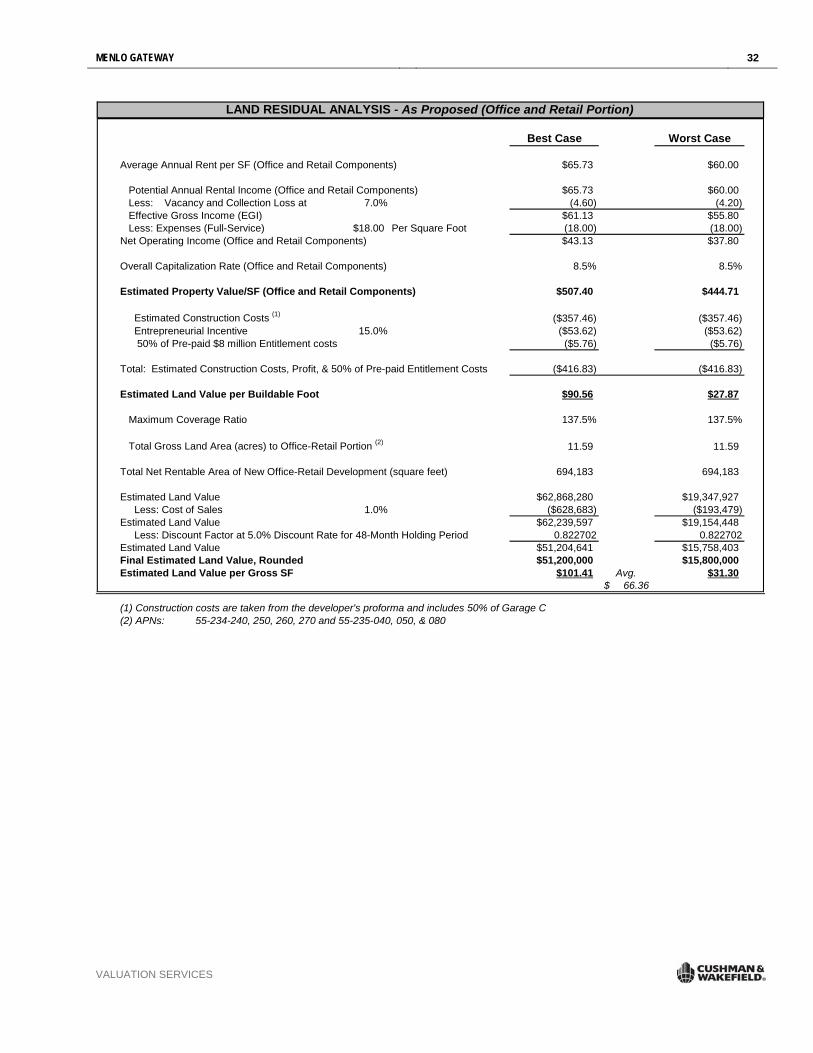
Best Case Worst Case
Average Annual Rent per SF (Office and Retail Components) $65.73 $60.00
Potential Annual Rental Income (Office and Retail Components) $65.73 $60.00Less: Vacancy and Collection Loss at 7.0% (4.60) (4.20)Effective Gross Income (EGI) $61.13 $55.80Less: Expenses (Full-Service) $18.00 Per Square Foot (18.00) (18.00)
Net Operating Income (Office and Retail Components) $43.13 $37.80
Overall Capitalization Rate (Office and Retail Components) 8.5% 8.5%
Estimated Property Value/SF (Office and Retail Components) $507.40 $444.71
Estimated Construction Costs (1) ($357.46) ($357.46) Entrepreneurial Incentive 15.0% ($53.62) ($53.62) 50% of Pre-paid $8 million Entitlement costs ($5.76) ($5.76)
($416.83) ($416.83)
Estimated Land Value per Buildable Foot $90.56 $27.87
Maximum Coverage Ratio 137.5% 137.5%
Total Gross Land Area (acres) to Office-Retail Portion (2) 11.59 11.59
Total Net Rentable Area of New Office-Retail Development (square feet) 694,183 694,183
Estimated Land Value $62,868,280 $19,347,927 Less: Cost of Sales 1.0% ($628,683) ($193,479)Estimated Land Value $62,239,597 $19,154,448 Less: Discount Factor at 5.0% Discount Rate for 48-Month Holding Period 0.822702 0.822702Estimated Land Value $51,204,641 $15,758,403Final Estimated Land Value, Rounded $51,200,000 $15,800,000Estimated Land Value per Gross SF $101.41 Avg. $31.30
66.36$
(1) Construction costs are taken from the developer's proforma and includes 50% of Garage C(2) APNs: 55-234-240, 250, 260, 270 and 55-235-040, 050, & 080
LAND RESIDUAL ANALYSIS - As Proposed (Office and Retail Portion)
Total: Estimated Construction Costs, Profit, & 50% of Pre-paid Entitlement Costs
MENLO GATEWAY 33
VALUATION SERVICES
CONSTRUCTION PRO-FORMA

MENLO GATEWAY 34
VALUATION SERVICES
Hotel Clubsport ReversionNet Operating Income 15,406,000$ Terminal Capitalization Rate 8.50% Indicated Reversion Value 181,247,059$ Less: Sales Costs @ 3.0% (5,437,412)$ Net Sales Proceeds 175,809,647$
Office/Retail Component ReversionNet Operating Income-Reversion 48,608,371$ Terminal Capitalization Rate 9.00% Indicated Rerversion Value 540,093,011$ Less: Sales Costs @ 2.0% (10,801,860)$ Net Sales Proceeds 529,291,151$
1 2 3 4 5 6 7 8 9 10 11 12 13 14 15 Total 12/2010 12/2011 12/2012 12/2013 12/2014 12/2015 12/2016 12/2017 12/2018 12/2019 12/2020 12/2021 12/2022 12/2023 12/2024 Hotel Clubsport Component $111,094,000 $0 $0 $0 $0 $6,153,000 $9,069,000 $10,378,000 $11,009,000 $11,483,000 $11,841,000 $12,209,000 $12,589,000 $12,980,000 $13,383,000 $0Office-Retail Component $381,296,303 $0 $0 $0 $0 $2,520,915 $13,626,031 $28,881,365 $37,891,142 $39,265,466 $40,681,020 $42,139,043 $43,534,219 $42,355,323 $43,419,168 $46,982,611Total Net Income $492,390,303 $0 $0 $0 $0 $8,673,915 $22,695,031 $39,259,365 $48,900,142 $50,748,466 $52,522,020 $54,348,043 $56,123,219 $55,335,323 $56,802,168 $46,982,611
Hotel Clubsport Reversion $175,809,647 $0 $0 $0 $0 $0 $0 $0 $0 $0 $0 $0 $0 $0 175,809,647$ $0Office-Retail Reversion $529,291,151 $0 $0 $0 $0 $0 $0 $0 $0 $0 $0 $0 $0 $0 $0 $529,291,151Total Reversionary Value $705,100,798 $0 $0 $0 $0 $0 $0 $0 $0 $0 $0 $0 $0 $0 $232,611,815 $576,273,762
Site Costs Constitution Dr. @ $39.89/sf (est. Land Value) $15,395,226 $15,395,226 $0 $0 $0 $0 $0 $0 $0 $0 $0 $0 $0 $0 $0 $0Site Costs Independence Dr. @ $39.89/sf (est. Land Value) $12,302,275 $12,302,275 $0 $0 $0 $0 $0 $0 $0 $0 $0 $0 $0 $0 $0 $0Infrastructure - Constitution Drive $5,174,019 $0 $0 $0 $5,174,019 $0 $0 $0 $0 $0 $0 $0 $0 $0 $0 $0Infrastructure - Independence Drive $5,884,055 $0 $5,884,055 $0 $0 $0 $0 $0 $0 $0 $0 $0 $0 $0 $0 $0Vertical Costs - Constitution Drive $128,421,799 $0 $0 $0 $0 $64,210,900 $64,210,899 $0 $0 $0 $0 $0 $0 $0 $0 $0Vertical Costs - Independence Drive $191,248,223 $0 $0 $20,874,460 $170,373,763 $0 $0 $0 $0 $0 $0 $0 $0 $0 $0 $0Project Management $14,698,053 $0 $205,942 $730,606 $6,144,172 $3,721,831 $3,895,502 $0 $0 $0 $0 $0 $0 $0 $0 $0Future Tenant Improvements on Renewals $11,610,818 $0 $0 $0 $0 $0 $0 $0 $0 $0 $0 $0 $823,401 $3,817,153 $4,195,324 $2,774,940Leasing Commissions $43,052,142 $0 $0 $0 $0 $7,504,045 $7,815,778 $8,274,198 $0 $0 $0 $0 $1,393,532 $6,422,169 $7,007,444 $4,634,976Cost Contingency $20,997,218 $0 $294,203 $1,043,723 $8,777,389 $5,316,901 $5,565,002 $0 $0 $0 $0 $0 $0 $0 $0 $0Entitlements $8,000,000 $8,000,000 $0 $0 $0Less: Remaining Development Costs: $456,783,828 $35,697,501 $6,384,200 $22,648,789 $190,469,343 $80,753,677 $81,487,181 $8,274,198 $0 $0 $0 $0 $2,216,933 $10,239,322 $11,202,768 $7,409,916Net Cash Flows: $740,707,273 ($35,697,501) ($6,384,200) ($22,648,789) ($190,469,343) ($72,079,762) ($58,792,150) $30,985,167 $48,900,142 $50,748,466 $52,522,020 $54,348,043 $53,906,286 $45,096,001 $221,409,047 $568,863,846Net Cummulative Cash Flows: ($35,697,501) ($42,081,701) ($64,730,490) ($255,199,833) ($327,279,595) ($386,071,745) ($355,086,578) ($306,186,436) ($255,437,970) ($202,915,950) ($148,567,907) ($94,661,621) ($49,565,620) $171,843,427 $740,707,273Projected IRR 12.68%Projected NPV at 15.0% ($35,585,154) $0 #REF!
Menlo Gateway - As Proposed Construction Pro-Forma for Office and Hotel
MENLO GATEWAY ASSUMPTIONS AND LIMITING CONDITIONS 35
VALUATION SERVICES
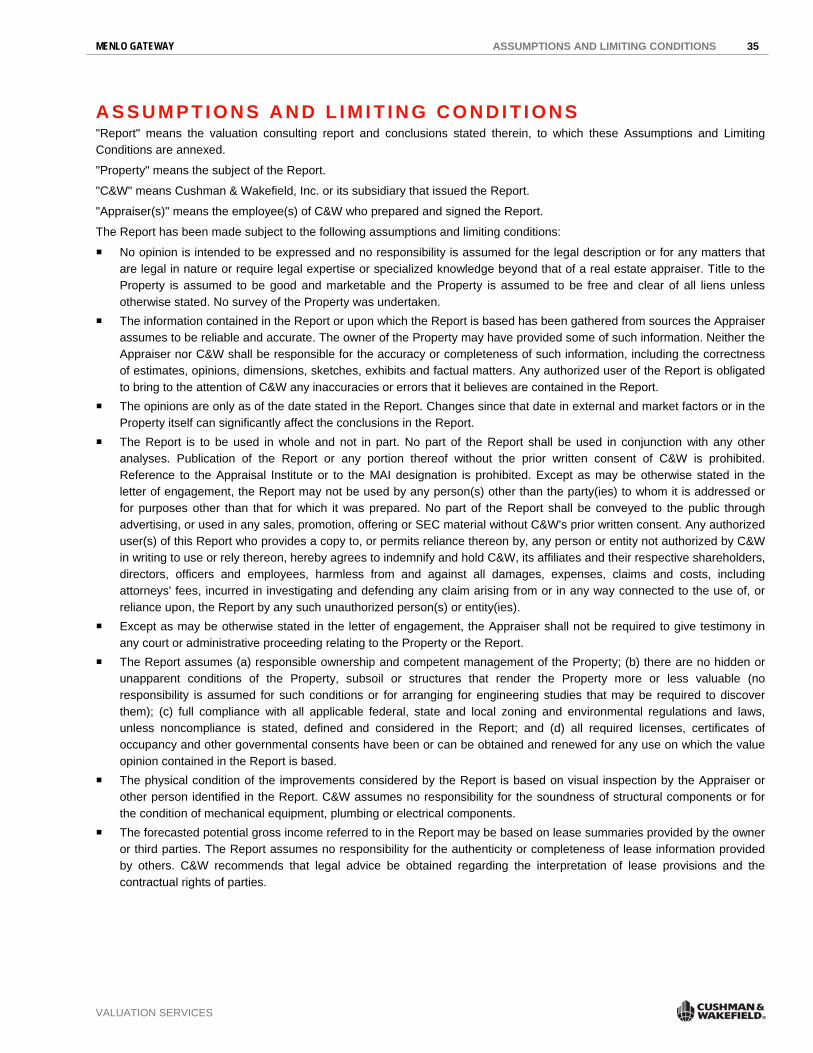
A S S U M P T I O N S A N D L I M I T I N G C O N D I T I O N S "Report" means the valuation consulting report and conclusions stated therein, to which these Assumptions and Limiting Conditions are annexed.
"Property" means the subject of the Report.
"C&W" means Cushman & Wakefield, Inc. or its subsidiary that issued the Report.
"Appraiser(s)" means the employee(s) of C&W who prepared and signed the Report.
The Report has been made subject to the following assumptions and limiting conditions:
No opinion is intended to be expressed and no responsibility is assumed for the legal description or for any matters that are legal in nature or require legal expertise or specialized knowledge beyond that of a real estate appraiser. Title to the Property is assumed to be good and marketable and the Property is assumed to be free and clear of all liens unless otherwise stated. No survey of the Property was undertaken.
The information contained in the Report or upon which the Report is based has been gathered from sources the Appraiser assumes to be reliable and accurate. The owner of the Property may have provided some of such information. Neither the Appraiser nor C&W shall be responsible for the accuracy or completeness of such information, including the correctness of estimates, opinions, dimensions, sketches, exhibits and factual matters. Any authorized user of the Report is obligated to bring to the attention of C&W any inaccuracies or errors that it believes are contained in the Report.
The opinions are only as of the date stated in the Report. Changes since that date in external and market factors or in the Property itself can significantly affect the conclusions in the Report.
The Report is to be used in whole and not in part. No part of the Report shall be used in conjunction with any other analyses. Publication of the Report or any portion thereof without the prior written consent of C&W is prohibited. Reference to the Appraisal Institute or to the MAI designation is prohibited. Except as may be otherwise stated in the letter of engagement, the Report may not be used by any person(s) other than the party(ies) to whom it is addressed or for purposes other than that for which it was prepared. No part of the Report shall be conveyed to the public through advertising, or used in any sales, promotion, offering or SEC material without C&W's prior written consent. Any authorized user(s) of this Report who provides a copy to, or permits reliance thereon by, any person or entity not authorized by C&W in writing to use or rely thereon, hereby agrees to indemnify and hold C&W, its affiliates and their respective shareholders, directors, officers and employees, harmless from and against all damages, expenses, claims and costs, including attorneys' fees, incurred in investigating and defending any claim arising from or in any way connected to the use of, or reliance upon, the Report by any such unauthorized person(s) or entity(ies).
Except as may be otherwise stated in the letter of engagement, the Appraiser shall not be required to give testimony in any court or administrative proceeding relating to the Property or the Report.
The Report assumes (a) responsible ownership and competent management of the Property; (b) there are no hidden or unapparent conditions of the Property, subsoil or structures that render the Property more or less valuable (no responsibility is assumed for such conditions or for arranging for engineering studies that may be required to discover them); (c) full compliance with all applicable federal, state and local zoning and environmental regulations and laws, unless noncompliance is stated, defined and considered in the Report; and (d) all required licenses, certificates of occupancy and other governmental consents have been or can be obtained and renewed for any use on which the value opinion contained in the Report is based.
The physical condition of the improvements considered by the Report is based on visual inspection by the Appraiser or other person identified in the Report. C&W assumes no responsibility for the soundness of structural components or for the condition of mechanical equipment, plumbing or electrical components.
The forecasted potential gross income referred to in the Report may be based on lease summaries provided by the owner or third parties. The Report assumes no responsibility for the authenticity or completeness of lease information provided by others. C&W recommends that legal advice be obtained regarding the interpretation of lease provisions and the contractual rights of parties.
MENLO GATEWAY ASSUMPTIONS AND LIMITING CONDITIONS 36
VALUATION SERVICES
The forecasts of income and expenses are not predictions of the future. Rather, they are the Appraiser's best opinions of current market thinking on future income and expenses. The Appraiser and C&W make no warranty or representation that these forecasts will materialize. The real estate market is constantly fluctuating and changing. It is not the Appraiser's task to predict or in any way warrant the conditions of a future real estate market; the Appraiser can only reflect what the investment community, as of the date of the Report, envisages for the future in terms of rental rates, expenses, and supply and demand.
Unless otherwise stated in the Report, the existence of potentially hazardous or toxic materials that may have been used in the construction or maintenance of the improvements or may be located at or about the Property was not considered in arriving at the opinion of value. These materials (such as formaldehyde foam insulation, asbestos insulation and other potentially hazardous materials) may adversely affect the value of the Property. The Appraisers are not qualified to detect such substances. C&W recommends that an environmental expert be employed to determine the impact of these matters on the opinion of value.
Unless otherwise stated in the Report, compliance with the requirements of the Americans with Disabilities Act of 1990 (ADA) has not been considered in arriving at the opinion of value. Failure to comply with the requirements of the ADA may adversely affect the value of the Property. C&W recommends that an expert in this field be employed to determine the compliance of the Property with the requirements of the ADA and the impact of these matters on the opinion of value.
If the Report is submitted to a lender or investor with the prior approval of C&W, such party should consider this Report as only one factor, together with its independent investment considerations and underwriting criteria, in its overall investment decision. Such lender or investor is specifically cautioned to understand all Extraordinary Assumptions and Hypothetical Conditions and the Assumptions and Limiting Conditions incorporated in this Report.
In the event of a claim against C&W or its affiliates or their respective officers or employees or the Appraisers in connection with or in any way relating to this Report or this engagement, the maximum damages recoverable shall be the amount of the monies actually collected by C&W or its affiliates for this Report and under no circumstances shall any claim for consequential damages be made.
If the Report is referred to or included in any offering material or prospectus, the Report shall be deemed referred to or included for informational purposes only and C&W, its employees and the Appraiser have no liability to such recipients. C&W disclaims any and all liability to any party other than the party that retained C&W to prepare the Report.
Any estimate of insurable value, if included within the agreed upon scope of work and presented within this report, is based upon figures derived from a national cost estimating service and is developed consistent with industry practices. However, actual local and regional construction costs may vary significantly from our estimate and individual insurance policies and underwriters have varied specifications, exclusions, and non-insurable items. As such, we strongly recommend that the Client obtain estimates from professionals experienced in establishing insurance coverage for replacing any structure. This analysis should not be relied upon to determine insurance coverage. Furthermore, we make no warranties regarding the accuracy of this estimate.
By use of this Report each party that uses this Report agrees to be bound by all of the Assumptions and Limiting Conditions, Hypothetical Conditions and Extraordinary Assumptions stated herein.

MENLO GATEWAY CERTIFICATION 37
VALUATION SERVICES
C E R T I F I C A T I O N We certify that, to the best of our knowledge and belief:
The statements of fact contained in this report are true and correct. The reported analyses, opinions, and conclusions are limited only by the reported assumptions and limiting conditions,
and are our personal, impartial, and unbiased professional analyses, opinions, and conclusions. We have no present or prospective interest in the property that is the subject of this report, and no personal interest with
respect to the parties involved. We have no bias with respect to the property that is the subject of this report or to the parties involved with this
assignment. Our engagement in this assignment was not contingent upon developing or reporting predetermined results. Our compensation for completing this assignment is not contingent upon the development or reporting of a predetermined
value or direction in value that favors the cause of the client, the amount of the value opinion, the attainment of a stipulated result, or the occurrence of a subsequent event directly related to the intended use of this report.
The reported analyses, opinions, and conclusions were developed, and this report has been prepared, in conformity with the requirements of the Code of Professional Ethics & Standards of Professional Appraisal Practice of the Appraisal Institute, which include the Uniform Standards of Professional Appraisal Practice.
The use of this report is subject to the requirements of the Appraisal Institute relating to review by its duly authorized representatives.
Robby D. Perrino, MAI, CRE, CCIM did make a personal inspection of the property that is the subject of this report. George Geranios did not make a personal inspection of the property that is the subject of this report.
Robby D. Perrino, MAI, CRE, CCIM and George Geranios have not provided services regarding the subject property within the prior three years.
No one provided significant real property valuation assistance to the persons signing this report. As of the date of this report, Robby D. Perrino, MAI, CRE, CCIM has completed the continuing education program of the
Appraisal Institute.
Robby D. Perrino, MAI, CRE, CCIM Executive Managing Director CA Certified General Appraiser License No. AG002595 [email protected] (408) 572-4134 Office Direct (408) 434-1554 Fax
George Geranios Director CA Certified General Appraiser License No. AG011942 [email protected] (408) 572-4106 Office Direct (408) 434-1554 Fax
MENLO GATEWAY CERTIFICATION 38
VALUATION SERVICES
ADDENDA
Comparable Land Sales Comparable Leases Market Trend Charts Engagement Letter
Qualifications of Professionals
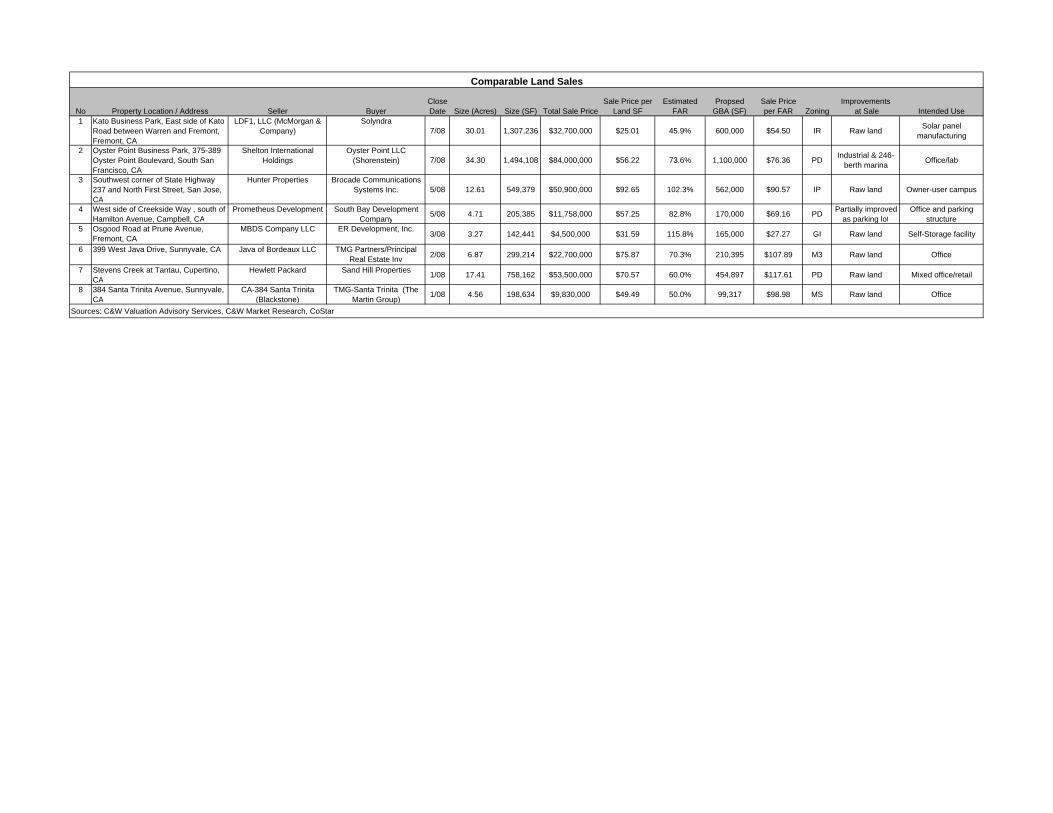
No Property Location / Address Seller BuyerCloseDate Size (Acres) Size (SF) Total Sale Price
Sale Price per Land SF
Estimated FAR
Propsed GBA (SF)
Sale Price per FAR Zoning
Improvements at Sale Intended Use
1 Kato Business Park, East side of Kato Road between Warren and Fremont, Fremont, CA
LDF1, LLC (McMorgan & Company)
Solyndra7/08 30.01 1,307,236 $32,700,000 $25.01 45.9% 600,000 $54.50 IR Raw land Solar panel
manufacturing
2 Oyster Point Business Park, 375-389 Oyster Point Boulevard, South San Francisco, CA
Shelton International Holdings
Oyster Point LLC (Shorenstein) 7/08 34.30 1,494,108 $84,000,000 $56.22 73.6% 1,100,000 $76.36 PD Industrial & 246-
berth marina Office/lab
3 Southwest corner of State Highway 237 and North First Street, San Jose, CA
Hunter Properties Brocade Communications Systems Inc. 5/08 12.61 549,379 $50,900,000 $92.65 102.3% 562,000 $90.57 IP Raw land Owner-user campus
4 West side of Creekside Way , south of Hamilton Avenue, Campbell, CA
Prometheus Development South Bay Development Company 5/08 4.71 205,385 $11,758,000 $57.25 82.8% 170,000 $69.16 PD Partially improved
as parking lotOffice and parking
structure5 Osgood Road at Prune Avenue,
Fremont, CAMBDS Company LLC ER Development, Inc.
3/08 3.27 142,441 $4,500,000 $31.59 115.8% 165,000 $27.27 GI Raw land Self-Storage facility
6 399 West Java Drive, Sunnyvale, CA Java of Bordeaux LLC TMG Partners/Principal Real Estate Inv 2/08 6.87 299,214 $22,700,000 $75.87 70.3% 210,395 $107.89 M3 Raw land Office
7 Stevens Creek at Tantau, Cupertino, CA
Hewlett Packard Sand Hill Properties 1/08 17.41 758,162 $53,500,000 $70.57 60.0% 454,897 $117.61 PD Raw land Mixed office/retail
8 384 Santa Trinita Avenue, Sunnyvale, CA
CA-384 Santa Trinita (Blackstone)
TMG-Santa Trinita (The Martin Group) 1/08 4.56 198,634 $9,830,000 $49.49 50.0% 99,317 $98.98 MS Raw land Office
Sources: C&W Valuation Advisory Services, C&W Market Research, CoStar
Comparable Land Sales
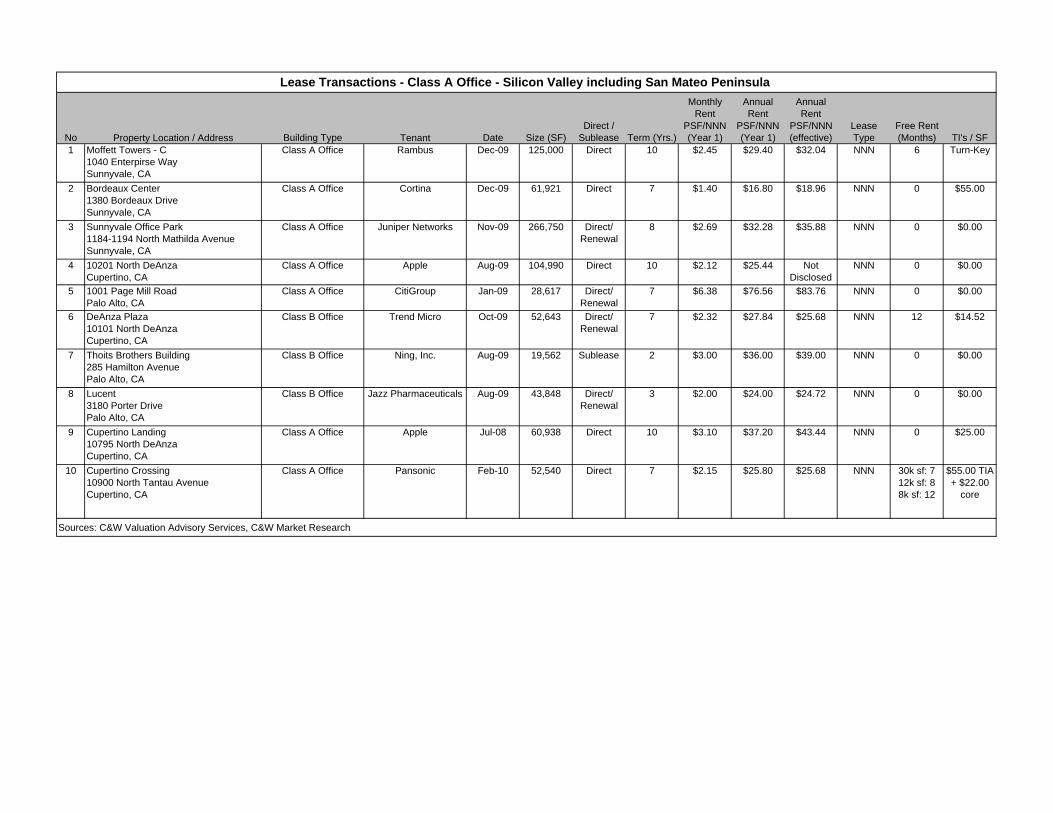
No Property Location / Address Building Type Tenant Date Size (SF)Direct /
Sublease Term (Yrs.)
Monthly Rent
PSF/NNN(Year 1)
Annual Rent
PSF/NNN(Year 1)
Annual Rent
PSF/NNN(effective)
LeaseType
Free Rent (Months) TI's / SF
1 Moffett Towers - C1040 Enterpirse WaySunnyvale, CA
Class A Office Rambus Dec-09 125,000 Direct 10 $2.45 $29.40 $32.04 NNN 6 Turn-Key
2 Bordeaux Center1380 Bordeaux DriveSunnyvale, CA
Class A Office Cortina Dec-09 61,921 Direct 7 $1.40 $16.80 $18.96 NNN 0 $55.00
3 Sunnyvale Office Park1184-1194 North Mathilda AvenueSunnyvale, CA
Class A Office Juniper Networks Nov-09 266,750 Direct/ Renewal
8 $2.69 $32.28 $35.88 NNN 0 $0.00
4 10201 North DeAnzaCupertino, CA
Class A Office Apple Aug-09 104,990 Direct 10 $2.12 $25.44 Not Disclosed
NNN 0 $0.00
5 1001 Page Mill RoadPalo Alto, CA
Class A Office CitiGroup Jan-09 28,617 Direct/ Renewal
7 $6.38 $76.56 $83.76 NNN 0 $0.00
6 DeAnza Plaza10101 North DeAnzaCupertino, CA
Class B Office Trend Micro Oct-09 52,643 Direct/ Renewal
7 $2.32 $27.84 $25.68 NNN 12 $14.52
7 Thoits Brothers Building285 Hamilton AvenuePalo Alto, CA
Class B Office Ning, Inc. Aug-09 19,562 Sublease 2 $3.00 $36.00 $39.00 NNN 0 $0.00
8 Lucent3180 Porter DrivePalo Alto, CA
Class B Office Jazz Pharmaceuticals Aug-09 43,848 Direct/ Renewal
3 $2.00 $24.00 $24.72 NNN 0 $0.00
9 Cupertino Landing10795 North DeAnzaCupertino, CA
Class A Office Apple Jul-08 60,938 Direct 10 $3.10 $37.20 $43.44 NNN 0 $25.00
10 Cupertino Crossing10900 North Tantau AvenueCupertino, CA
Class A Office Pansonic Feb-10 52,540 Direct 7 $2.15 $25.80 $25.68 NNN 30k sf: 712k sf: 88k sf: 12
$55.00 TIA + $22.00
core
Sources: C&W Valuation Advisory Services, C&W Market Research
Lease Transactions - Class A Office - Silicon Valley including San Mateo Peninsula
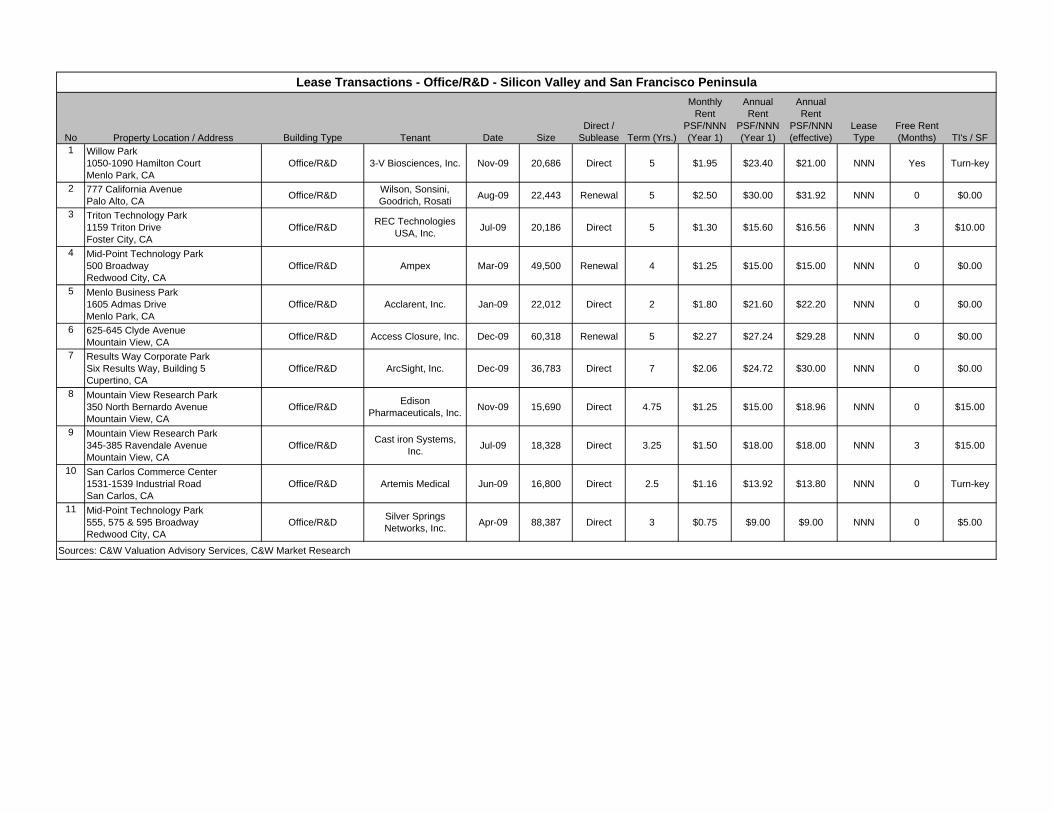
No Property Location / Address Building Type Tenant Date SizeDirect /
Sublease Term (Yrs.)
Monthly Rent
PSF/NNN(Year 1)
Annual Rent
PSF/NNN(Year 1)
Annual Rent
PSF/NNN(effective)
LeaseType
Free Rent(Months) TI's / SF
1 Willow Park1050-1090 Hamilton CourtMenlo Park, CA
Office/R&D 3-V Biosciences, Inc. Nov-09 20,686 Direct 5 $1.95 $23.40 $21.00 NNN Yes Turn-key
2 777 California AvenuePalo Alto, CA Office/R&D Wilson, Sonsini,
Goodrich, Rosati Aug-09 22,443 Renewal 5 $2.50 $30.00 $31.92 NNN 0 $0.00
3 Triton Technology Park1159 Triton DriveFoster City, CA
Office/R&D REC Technologies USA, Inc. Jul-09 20,186 Direct 5 $1.30 $15.60 $16.56 NNN 3 $10.00
4 Mid-Point Technology Park500 BroadwayRedwood City, CA
Office/R&D Ampex Mar-09 49,500 Renewal 4 $1.25 $15.00 $15.00 NNN 0 $0.00
5 Menlo Business Park1605 Admas DriveMenlo Park, CA
Office/R&D Acclarent, Inc. Jan-09 22,012 Direct 2 $1.80 $21.60 $22.20 NNN 0 $0.00
6 625-645 Clyde AvenueMountain View, CA Office/R&D Access Closure, Inc. Dec-09 60,318 Renewal 5 $2.27 $27.24 $29.28 NNN 0 $0.00
7 Results Way Corporate ParkSix Results Way, Building 5Cupertino, CA
Office/R&D ArcSight, Inc. Dec-09 36,783 Direct 7 $2.06 $24.72 $30.00 NNN 0 $0.00
8 Mountain View Research Park350 North Bernardo AvenueMountain View, CA
Office/R&D Edison Pharmaceuticals, Inc. Nov-09 15,690 Direct 4.75 $1.25 $15.00 $18.96 NNN 0 $15.00
9 Mountain View Research Park345-385 Ravendale AvenueMountain View, CA
Office/R&D Cast iron Systems, Inc. Jul-09 18,328 Direct 3.25 $1.50 $18.00 $18.00 NNN 3 $15.00
10 San Carlos Commerce Center1531-1539 Industrial RoadSan Carlos, CA
Office/R&D Artemis Medical Jun-09 16,800 Direct 2.5 $1.16 $13.92 $13.80 NNN 0 Turn-key
11 Mid-Point Technology Park555, 575 & 595 BroadwayRedwood City, CA
Office/R&D Silver Springs Networks, Inc. Apr-09 88,387 Direct 3 $0.75 $9.00 $9.00 NNN 0 $5.00
Sources: C&W Valuation Advisory Services, C&W Market Research
Lease Transactions - Office/R&D - Silicon Valley and San Francisco Peninsula
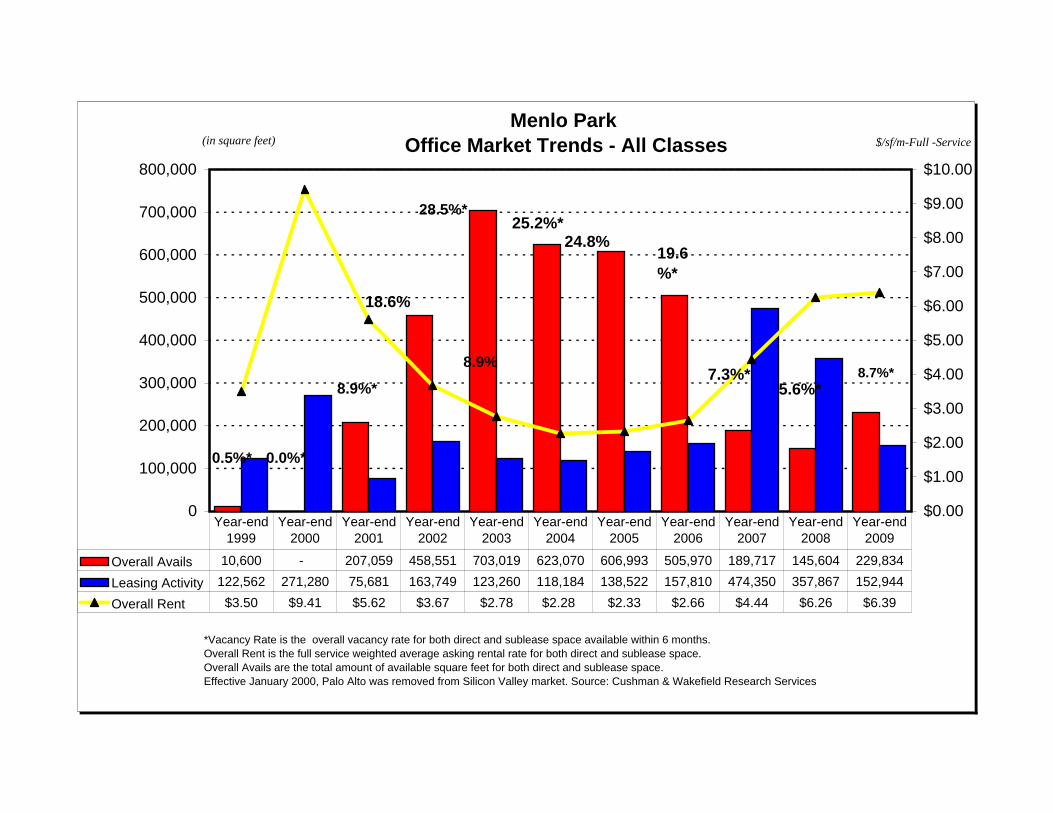
Menlo Park Office Market Trends - All Classes
0
100,000
200,000
300,000
400,000
500,000
600,000
700,000
800,000
(in square feet)
$0.00
$1.00
$2.00
$3.00
$4.00
$5.00
$6.00
$7.00
$8.00
$9.00
$10.00
$/sf/m-Full -Service
Overall Avails 10,600 - 207,059 458,551 703,019 623,070 606,993 505,970 189,717 145,604 229,834
Leasing Activity 122,562 271,280 75,681 163,749 123,260 118,184 138,522 157,810 474,350 357,867 152,944
Overall Rent $3.50 $9.41 $5.62 $3.67 $2.78 $2.28 $2.33 $2.66 $4.44 $6.26 $6.39
Year-end 1999
Year-end 2000
Year-end 2001
Year-end 2002
Year-end 2003
Year-end 2004
Year-end 2005
Year-end 2006
Year-end 2007
Year-end 2008
Year-end 2009
0.5%* 0.0%*
8.9%*
*Vacancy Rate is the overall vacancy rate for both direct and sublease space available within 6 months.Overall Rent is the full service weighted average asking rental rate for both direct and sublease space.Overall Avails are the total amount of available square feet for both direct and sublease space.Effective January 2000, Palo Alto was removed from Silicon Valley market. Source: Cushman & Wakefield Research Services
28.5%*
8.9%
18.6%
25.2%*24.8%
19.6%*
7.3%*5.6%*
8.7%*
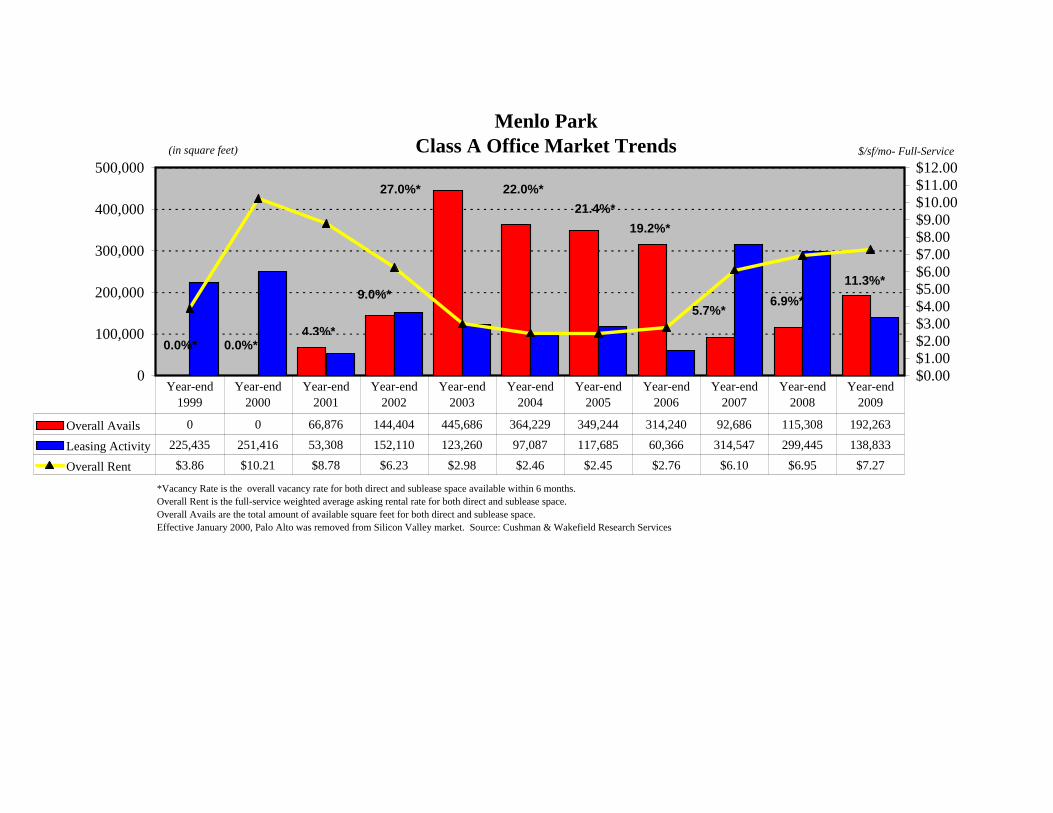
116,171 76,825 77,593 78,597 16,709Menlo Park
Class A Office Market Trends
0
100,000
200,000
300,000
400,000
500,000(in square feet)
$0.00$1.00$2.00$3.00$4.00$5.00$6.00$7.00$8.00$9.00$10.00$11.00$12.00
$/sf/mo- Full-Service
Overall Avails 0 0 66,876 144,404 445,686 364,229 349,244 314,240 92,686 115,308 192,263
Leasing Activity 225,435 251,416 53,308 152,110 123,260 97,087 117,685 60,366 314,547 299,445 138,833
Overall Rent $3.86 $10.21 $8.78 $6.23 $2.98 $2.46 $2.45 $2.76 $6.10 $6.95 $7.27
Year-end 1999
Year-end 2000
Year-end 2001
Year-end 2002
Year-end 2003
Year-end 2004
Year-end 2005
Year-end 2006
Year-end 2007
Year-end 2008
Year-end 2009
0.0%* 0.0%*4.3%*
9.0%*
27.0%*
*Vacancy Rate is the overall vacancy rate for both direct and sublease space available within 6 months.Overall Rent is the full-service weighted average asking rental rate for both direct and sublease space.Overall Avails are the total amount of available square feet for both direct and sublease space.Effective January 2000, Palo Alto was removed from Silicon Valley market. Source: Cushman & Wakefield Research Services
11.3%*6.9%*
19.2%*21.4%*
5.7%*
22.0%*
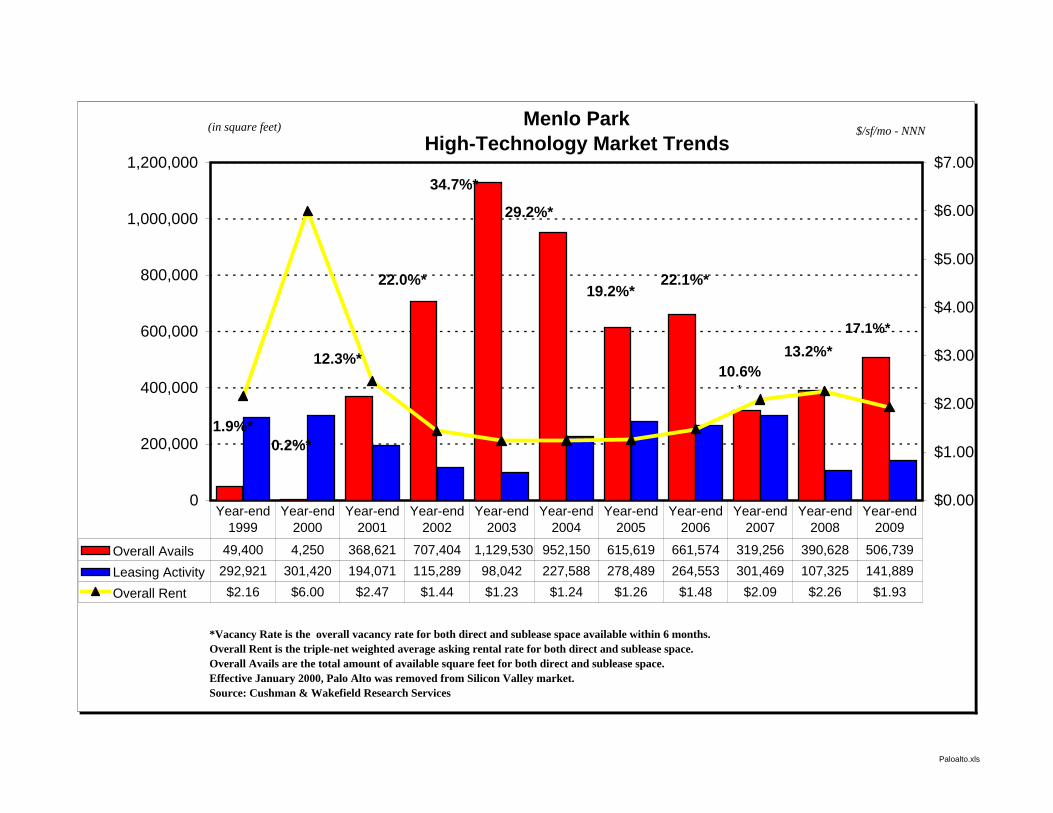
Paloalto.xls
Menlo ParkHigh-Technology Market Trends
0
200,000
400,000
600,000
800,000
1,000,000
1,200,000
(in square feet)
$0.00
$1.00
$2.00
$3.00
$4.00
$5.00
$6.00
$7.00
$/sf/mo - NNN
Overall Avails 49,400 4,250 368,621 707,404 1,129,530 952,150 615,619 661,574 319,256 390,628 506,739
Leasing Activity 292,921 301,420 194,071 115,289 98,042 227,588 278,489 264,553 301,469 107,325 141,889
Overall Rent $2.16 $6.00 $2.47 $1.44 $1.23 $1.24 $1.26 $1.48 $2.09 $2.26 $1.93
Year-end 1999
Year-end 2000
Year-end 2001
Year-end 2002
Year-end 2003
Year-end 2004
Year-end 2005
Year-end 2006
Year-end 2007
Year-end 2008
Year-end 2009
*Vacancy Rate is the overall vacancy rate for both direct and sublease space available within 6 months.Overall Rent is the triple-net weighted average asking rental rate for both direct and sublease space.Overall Avails are the total amount of available square feet for both direct and sublease space.Effective January 2000, Palo Alto was removed from Silicon Valley market.Source: Cushman & Wakefield Research Services
0.2%*
12.3%*10.6%
*
13.2%*
1.9%*
29.2%*
22.0%*
34.7%*
22.1%*19.2%*
17.1%*


PROFESSIONAL QUALIFICATIONS
Robby D. Perrino, MAI, CRE, CCIM Executive Managing Director, Valuation & Advisory Services DRE LIC. #01034857 Cushman & Wakefield Western, Inc. Robby D. Perrino serves as an Executive Managing Director of Cushman & Wakefield’s Valuation & Advisory Services. In this capacity, Mr. Perrino is responsible for the everyday operation of the Northern California and Pacific Northwest offices. He also serves as a consultant/fiduciary advisor providing strategic advice to corporations, institutional clients, and developers/investors.
Cushman & Wakefield Valuation & Advisory Services comprises over 400 professionals worldwide who provide strategic advice and execution of sophisticated transactions, with particular emphasis on Finance, Strategy, and Valuation.
Experience
Prior to becoming an Executive Managing Director, Mr. Perrino was the Senior Managing Director of the Northern California offices (San Francisco, San Jose and Sacramento). Before being promoted into management, he was an Associate Director of Valuation & Advisory Services for Cushman & Wakefield, Inc in San Jose, CA. He performed appraisal and consulting services throughout Northern California on all types of income producing properties including industrial facilities, corporate headquarter campuses, office complexes, retail centers, automobile dealerships, apartments, vacant land, and residential subdivisions. The intended uses of these assignments were for mergers & acquisitions, mortgage lending, corporate advisory, disposition, acquisition, assessment districts, tax appeal purposes, litigation, and lease arbitration.
Education
Mr. Perrino received his Bachelor of Arts Degree in Economics from the University of Southern California in 1989.
Appraisal Education
Mr. Perrino has successfully completed all courses and experience requirements to qualify for the MAI designation. Also, he has completed the requirements of the continuing education program of the Appraisal Institute.
Memberships, Licenses and Professional Affiliations
Member Appraisal Institute (MAI No. 11406) The Counselors of Real Estate (CRE ID: 12895) Member Commercial Investment Real Estate Institute (CCIM No. 8219) Certified General Real Estate Appraiser, State of California (No. AG002595) Broker License, State of California (No. 01034857)
Special Awards
Mr. Perrino was the recipient of the Francis Corcoran Award as the Outstanding Cushman & Wakefield Valuation & Advisory Services Manager of the Year for 2000 due to his leadership and successful initiatives. During his tenure as an Associate Director, Mr. Perrino was recognized as one of Cushman & Wakefield’s Valuation & Advisory Services Top Producers, qualifying for Cushman & Wakefield’s Achievement Conference in 1998 and 1999. Additionally, he was the recipient of the Cushman & Wakefield Northern California Service Excellence Award in 1998 and 1999.
PROFESSIONAL QUALIFICATIONS George J. Geranios Director, Valuation & Advisory Services George J. Geranios is a Director of Valuation & Advisory Services of Cushman & Wakefield’s San Jose office. Mr. Geranios is a member of Cushman & Wakefield’s Retail Industry specialty practice and also specializes in the valuation of automobile dealerships. Cushman & Wakefield’s Valuation & Advisory Services staffs approximately 400 professionals in the U.S. with additional offices around the globe providing services for a wide variety of users including financial institutions, law firms, corporations, pension funds, pension fund advisors, developers, investors and government agencies to cite a few.
Experience
Mr. Geranios was made a Director in 2006. Prior to becoming an Associate Director in 2003, Mr. Geranios was the Director of Marketing for Colliers Investment Services Group-Silicon Valley, where he was responsible for financial analysis, preparation of marketing proposals and offering memoranda for institutional properties valued in excess of $10 million. Throughout his appraisal career, he has performed appraisal and consulting services throughout Northern California on all types of income producing properties including industrial facilities, corporate headquarter campuses, office complexes, retail centers, automobile dealerships, apartments, vacant land, and residential subdivisions. The intended uses of these assignments were for mortgage lending, corporate advisory, off-balance sheet financing, disposition, acquisition, assessment districts, tax appeal purposes, litigation support, and rent arbitration. During the 1980’s, Mr. Geranios was a commercial broker for Cushman & Wakefield in Silicon Valley specializing in the leasing of office/research and development buildings. Prior to that time, he was an Innkeeper of a Holiday Inn franchisee in the Northeast.
Education
Mr. Geranios received his Bachelor of Arts Degree in Behavioral and Social Sciences from Hellenic College.
Appraisal Education
Mr. Geranios is in the process of completing his final requirement for the Appraisal Institute’s commercial designation - the demonstration appraisal report.
Memberships, Licenses and Professional Affiliations
General Associate Member of the Appraisal Institute Certified General Real Estate Appraiser, State of California (No. AG011942)
Special Awards
In 2004, Mr. Geranios was a co-recipient of the 2004 Achievement Award for the Top New Assignment - Northern California. This consulting assignment was for the development of the Master Real Estate Plan for the County of Santa Clara, California. Mr. Geranios was the recipient of the Cushman & Wakefield Northern California Service Excellence Award in 1997. Litigation Mr. Geranios has qualified as an expert in the following courts: Federal Bankruptcy Court-Oakland