Aligning Continuous Integration Deployment: Automated Validation of OpenStack Deployments

Department of Engineering and Mathematics, Sheffield Hallam University, Sheffield, United Kingdom, [email protected] Department of Engineering and Mathematics, Sheffield Hallam University, Sheffield, United Kingdom [email protected]
Validation of Continuous Improvement Tracking
Model (CITM)
Sameh M. Saad
Maan N. Al Afifi
Abstract The purpose of this paper is to validate a newly developed model, called the Continuous Improvement
Tracking Model (CITM), for the first time. The Continuous Improvement Tracking Model (CITM) is a
model developed by Nasser Lootah, the Executive Vice President of the Dubai Electricity and Water
Authority in an attempt to manage the process improvement. A feedback mechanism is introduced in
order to take an action that is based on the degree of deviations. The validation is carried out by an
ABCD Model Analysis (Saad & Al Afifi, 2015) which is based on the set of steps Analyze, Build, Check,
and then Decide. The core of the validation tool development is formed by a combination of well-
known quality management tools: the Deming Cycle, RADAR logic and the application of statistical
tools: structural equation modeling, SPSS and AMOS.
In this paper the focus is to analyze the effectiveness of CITM implementation according to an ABCD
model analysis. Results were obtained from eight teams of managers, using research hypotheses and a
RADAR instrument, which were used to facilitate, analyze, and test the model and to check the built
model to verify the analysis that was made on the Continuous Improvement Tracking Model (CITM).
Keywords: Dubai Government Excellence Award (DGEP), Business Excellence Model, Validation
Process, ABCD Model Analysis
I. Introduction
Nasser Lootah (2014), the Executive Vice President in the Generation division at the Dubai
Electricity and Water Authority (DEWA), has developed three components of creative
culture: Principles & Engines, Mechanism & Tools and Feedback [1]. Mechanism and tools
are defined as the ways in which people approach problems. Mechanism and tools are
often a function of creativity and work style. Feedback is induced from the mechanism and
tools and has a great impact on creativity. The Continuous Improvement Tracking Model

Proceedings of the International Conference on Contemporary Management Practices (CAASR-ICCMP `15)
© 2015, by CAASR Ltd| CANADA Press [18]
plays an important feedback role in practice, based on the core concept of the 10-step
Continuous Improvement Process, as can be seen in Figure1.
A. Feedback- Continuous Improvement Tracking Model
The Continuous Improvement Tracking Model (CITM) was developed to guide process
owners to systematically identify process performance deviations and other feedback
systems (suggestions/complaints, benchmarking/best practice, stakeholder
survey/feedback, innovation, internal & external assessments, SWOT analysis, etc) that
could trigger continuous process
improvements, in line with an
organization’s policy/rules &
regulations/strategic objectives
& initiatives.
This model is shared with all
DEWA divisions/departments
and is an example of the
realization of a comprehensive
deployment of the Process
Management Approach adopted
within the Organizational
Excellence Model. This model
satisfies the following requirements:
Complies with Process Management Criteria adopted by DEWA.
Consistent with RADAR assessment logic.
Ensures that process design and improvement is aligned with the organization’s
strategy.
As can be seen in Figure 2, CITM is a control system model that is based on a set point and
a deviation error that compares the set point with the feedback. The size of deviation
determines the type of action required. For example, if the deviation is zero, it means that
the target set point is met and the colour will be indicated as green; in the case of a large
positive deviation, this indicates that the target is set very low and needs to be reviewed.
The colour coding in this case is blue. In the case of a small negative deviation, the yellow
indication will be shown as an alarm for an early response. Greater deviation will cause the
colour to change from orange and red, depending on the size of the negative deviation.
Figure 1. Three components of creative culture: Principles & Engines,
Mechanism & Tools and Feedback

Article ISBN: 978-0-9948937-0-3
© 2015, by CAASR Ltd| CANADA Press [19]
Figure 1: Continuous Improvement Tracking Model (CITM) [1]
Figure 2: ABCD Model Analysis [2]

Proceedings of the International Conference on Contemporary Management Practices (CAASR-ICCMP `15)
© 2015, by CAASR Ltd| CANADA Press [20]
CITM can be applied to any engineering or business management system in any
organization.
As can be seen, CITM consists of the strategy and the defined strategic objectives that set
the targets, in the form of Key Performance Indicators or KPIs (Quality, Time, and Cost).
These are then fed as an input into the CITM; the target setting is either by the strategic
prospective or system or process.
This is measured through an output feedback, to measure the KPI of any deviation.
Depending on the degree of the deviation, the corrective action can be elevated from just a
performance deviation to an objective deviation, as shown in the right side of Figure 3.
Four-colour coding is used for the performance deviations to trigger the process of
improvement, while one colour code is used for objective deviation which will lead to
serious review by the management to reconsider new and different strategic objectives.
There are ten methods suggested in the CITM model for process improvement: 1)
Suggestion scheme and complains; 2) Benchmarking; 3) Stakeholder feedback/survey; 4)
Innovation; 5) Internal and External Assessments; 6) Internal and External Audits; 7)
Strategy; 8) Policy/Requirements; 9) SWOT Analysis; 10) Process Improvement. All these
process improvements should meet the company mission and vision, and policy and
regulations, and there should be no contradiction or violation of any existing rules. The
changes will be in the form of management feedback.
In summary there are two measurement feedbacks: one is measuring output feedback; and
the second is management feedback.
B. Continuous Improvement Mechanism
Continuous improvement is ensured through a set of mechanisms or processes that are
derived from the ten steps of process improvement shown in Figure 4. These sets of
processes are aligned with the RADAR tool for assessment as per the European Foundation
for Quality Management (EFQM) and Dubai Government Excellence Program (DGEP)
Models. RADAR, which stands for results, approach, deployment, assess and refine, which
correspond to the following six processes. The first process is to design and understand
the process; it includes identification of strategic objectives, initiatives and major
processes pertaining to the divisional or departmental level, determination of input as
form of strategic objectives and targets (quality, time and cost), and the output in the form
of Key Performance Indicators (KPIs) such as quality, time and cost, or associated with
strategic objectives for major processes.

Article ISBN: 978-0-9948937-0-3
© 2015, by CAASR Ltd| CANADA Press [21]
Figure 3: 10-Step Continuous Improvement Process
The first process (design and understanding) also covers the identification of control
measures and drivers that impact strategic and process performance, in addition to
brainstorming, conducting techno-economic feasibility studies, and providing initiates to
spread creativity and innovation culture among employees.
The second process is planning; it consists of detailed analysis of the selected
improvement initiatives, determination of the required resources including budget, if
required, and preparation of a proposal for management approval, highlighting the
benefits based on a techno-economic feasibility study. In this process the required
resources for implementation must be in place.
The third process is the implementation of initiatives as per the approved plan, in
compliance with the rules and regulations.
The fourth process is monitoring and review, which is important, to confirm that the actual
results are in line with the expected output. In this process any deviations are identified.
The fifth process is corrective action to ensure the projected target is met by the
implemented initiatives. The main step is to identify/develop initiatives to spread
creativity and innovation culture among division and other division/department
employees.
The sixth process is feedback; it is based on a closed loop system that depends on the
feedback process, which can be determined by the periodic progress and lessons learned.

Proceedings of the International Conference on Contemporary Management Practices (CAASR-ICCMP `15)
© 2015, by CAASR Ltd| CANADA Press [22]
II. Analysis
The analysis in this paper uses ABCD Model Analysis [2] as a guide in order to carry out
the validation process for the Continuous Improvement Tracking Model (CITM). There are
four basic ABCD steps: Analyze, Build, Check and Decide.
A. Analyse (Purpose and Approach)
The first requirement of ABCD Model Analysis is to identify the purpose and the approach.
The purpose of validation with the Continuous Improvement Tracking Model (CITM) (that
is developed to track the management implementation towards the set targets and identify
the deviation with the measurement) is to see whether this system is effective or not. The
selected approach is to validate the implementation process and verify its suitability of
use.
The commissioning management teams used a developed management model based on
RADAR that defined the results and the approach through Commissioning Management
Result (CMR), and monitored the progress based on Commissioning Management Review
(CMR-1), identified the deviations and provided corrective measures on each deviation at
Commissioning Management Refine (CMR-2) as shown in Figure 5.
ABCD Model analysis is used to ease the analysis and testing with the CITM model as
shown in Figure 5.
B. Build (Measurement Model)
The business excellence model is built according to the purpose and approach. Define
abbreviations and acronyms the first time they are used in the text, even after they have
been defined in the abstract.

Article ISBN: 978-0-9948937-0-3
© 2015, by CAASR Ltd| CANADA Press [23]
Figure 5: Integration of CMR and CITM
Abbreviations such as IEEE, SI, MKS, CGS, sc, dc, and rms do not have to be defined. Do not
use abbreviations in the title or headings unless they are unavoidable.
The building of a measurement model structure is a simple way to visualize causal
information between variables and latent variables. Figure 6 shows the measurement
model of CITM implementation.
Proceedings of the International Conference on Contemporary Management Practices (CAASR-ICCMP `15)
© 2015, by CAASR Ltd| CANADA Press [24]
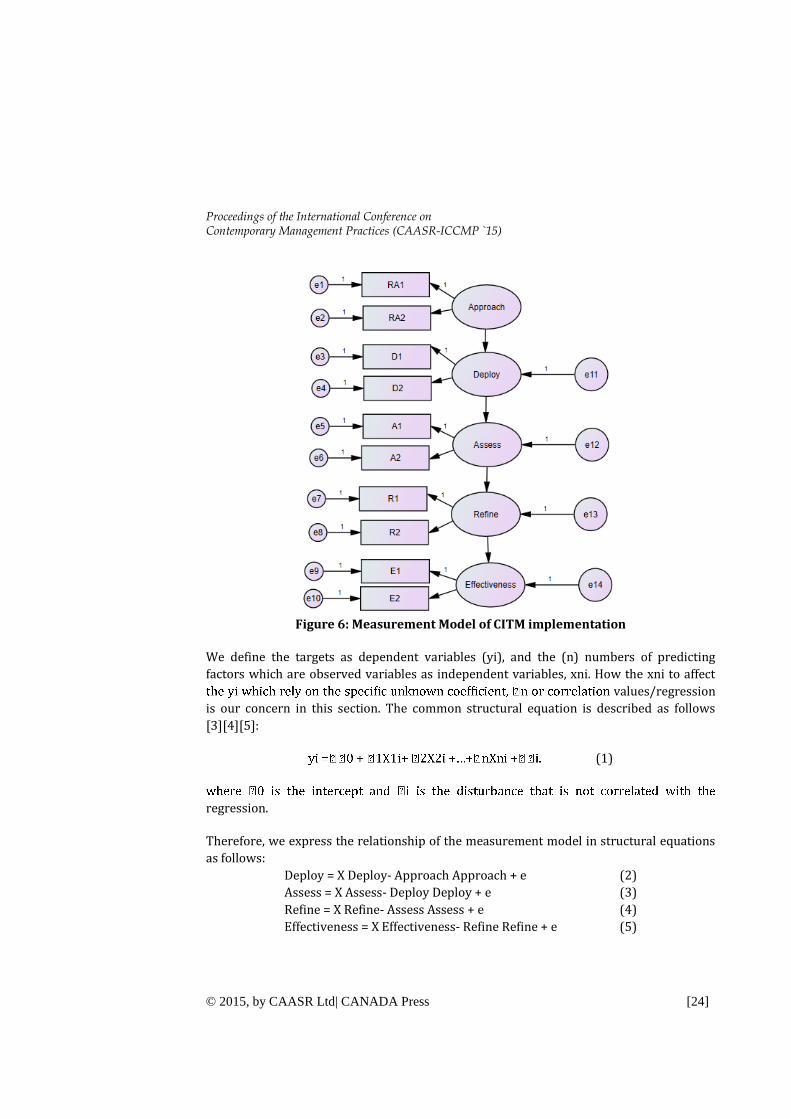
Figure 6: Measurement Model of CITM implementation
We define the targets as dependent variables (yi), and the (n) numbers of predicting
factors which are observed variables as independent variables, xni. How the xni to affect
values/regression
is our concern in this section. The common structural equation is described as follows
[3][4][5]:
(1)
regression.
Therefore, we express the relationship of the measurement model in structural equations
as follows:
Deploy = X Deploy- Approach Approach + e (2)
Assess = X Assess- Deploy Deploy + e (3)
Refine = X Refine- Assess Assess + e (4)
Effectiveness = X Effectiveness- Refine Refine + e (5)

Article ISBN: 978-0-9948937-0-3
© 2015, by CAASR Ltd| CANADA Press [25]
C. Check (Data Collection and Feedback)
The fitness of the business excellence model is tested by a series of tests and analysis to
validate the measurement model and the fit for purpose.
Table 1 shows total of 200 sets of CMR- CITM reports were collected from the department
managers in a determined frequency within 50 days. The reports were primarily evaluated
based on the documented evidence with the following RADAR concept:
Approach
a) The CITM report covers the scope and targets (RA1)
b) The Action Plan based on targets are updated (RA2)
Deploy
a) Submission frequency is determined and agreed (D1)
b) CITM reports are submitted on time (D2)
Assess
a) Identification of the deviation from the target (A1)
b) Availability of measured action to deviation (A2)
Refine
a) Implementation of measurement against the deviation (R1)
b) Positive result of measurement carried out (R2)
Effectiveness
a) The outcome of CITM is as per expectation (E1)
b) The latest outcome is improved when compare with the previous outcome (E2)
The evaluated data is processed into the SPSS, in which it statistically verifies the accurate
values, the confidence level and the variance, and fed to the built-in software AMOS in the
validation stage. In the final part of the research methodology, there are two main terms,
latent variables and manifest variables: “latent variables” describes the hidden or
unobserved variables.

Proceedings of the International Conference on Contemporary Management Practices (CAASR-ICCMP `15)
© 2015, by CAASR Ltd| CANADA Press [26]
Table 1: Evaluation of CITM Reports
Evidence
Evaluation
Co
mp
reh
en
siv
e e
vid
en
ce
(sca
le 5
)
Cle
ar
ev
ide
nce
(s
cale
4)
Ma
rgin
al
ev
ide
nce
(s
cale
3)
So
me
ev
ide
nce
(s
cale
2)
No
ev
ide
nce
/
ve
ry l
ess
e
vid
en
ce
(sca
le 1
)
RA1 Quantity 186 5 9 0 0 % 93 2.5 4.5 0 0
RA2 Quantity 187 4 9 0 0 % 93.5 2 4.5 0 0
D1 Quantity 164 10 26 0 0 % 82 5 13 0 0
D2 Quantity 163 11 26 0 0 % 81.5 5.5 13 0 0
A1 Quantity 150 1 7 42 0 % 75 0.5 3.5 21 0
A2 Quantity 162 4 18 16 0 % 81 2 9 8 0
R1 Quantity 165 3 14 18 0 % 82.5 1.5 7 9 0
R2 Quantity 166 8 21 5 0 % 83 4 10.5 2.5 0
E1 Quantity 159 10 13 18 0 % 79.5 5 6.5 9 0
E2 Quantity 159 19 17 5 0 % 79.5 9.5 8.5 2.5 0
Table 2: Reliability Test
Factor Item Reliability- Cronbach's Alpha
Approach 2 0.9799
Deploy 2 0.9812
Assess 2 0.8667
Refine 2 0.9475
Effectiveness 2 0.9563
Table 3: Model identification- degree of freedom
Unmodified After Modification Model Degree of Freedom Status Degree of Freedom Status CITM 34 Over identified 32 Over identified
Cronbach’s Alpha Reliability Test is normally conducted to evaluate the reliability of a set
of measurement data such as from a questionnaire or survey. Nunnally [6] indicated that

Article ISBN: 978-0-9948937-0-3
© 2015, by CAASR Ltd| CANADA Press [27]
in the reliability result should be at least 0.7 to be accepted for further estimation and
calculation. The results in Table 2 indicate the high reliability of the data.
Before testing the relationship among model components/variables, the model must be
over-identified, i.e. the degrees of freedom are positive or the number of known
parameters is more than unknown, as shown in Table 3, which is the only over-identified
model able to be evaluated. If the model is merely identified or under-identified, a
necessary fixing action should be carried out, such as adding variables to the model. The
degrees of freedom may be changed during model modification to improve the fit.
Therefore it is necessary to maintain an “over-identified” status.
The regression results determine and calculate the correlation between the variables
considered in the model. The modification of the model is only required if the model needs
to be improved to obtain a better fitting one. Figure 7 and Table 4 indicate the regression
estimation result from AMOS.
Table 4: Regression Analysis
Before Modification
Un
sta
nd
ard
ize
d
Sta
nd
ard
ize
d
Aft
er
Mo
dif
ica
tio
n
Un
sta
nd
ard
ize
d
Sta
nd
ard
ize
d
Est
ima
te
Est
ima
te
Est
ima
te
Est
ima
te
Deploy <--- Approach 0.281 0.174 Deploy <--- Approach 0.281 0.174 Assess <--- Deploy 0.373 0.237 Assess <--- Deploy 0.379 0.239 Refine <--- Assess 0.789 0.878 Refine <--- Assess 0.778 0.871
Effectiveness <--- Refine 0.967 0.97 Effectiveness <--- Refine 0.967 0.97 RA1 <--- Approach 1 0.961 RA1 <--- Approach 1 0.961 RA2 <--- Approach 1.03 1 RA2 <--- Approach 1.03 1 D1 <--- Deploy 1 0.988 D1 <--- Deploy 1 0.988 D2 <--- Deploy 0.989 0.975 D2 <--- Deploy 0.989 0.975 A1 <--- Assess 1 0.862 A1 <--- Assess 1 0.868 A2 <--- Assess 0.82 0.921 A2 <--- Assess 0.824 0.924 R1 <--- Refine 1 1 R1 <--- Refine 1 1 R2 <--- Refine 0.732 0.92
5 R2 <--- Refine 0.745 0.927
Effectiveness1 <--- E1 1 1 Effectiveness1 <--- E1 1 1 Effectiveness2 <--- E2 0.705 0.91
5 Effectiveness2 <--- E2 0.721 0.917
Proceedings of the International Conference on Contemporary Management Practices (CAASR-ICCMP `15)
© 2015, by CAASR Ltd| CANADA Press [28]
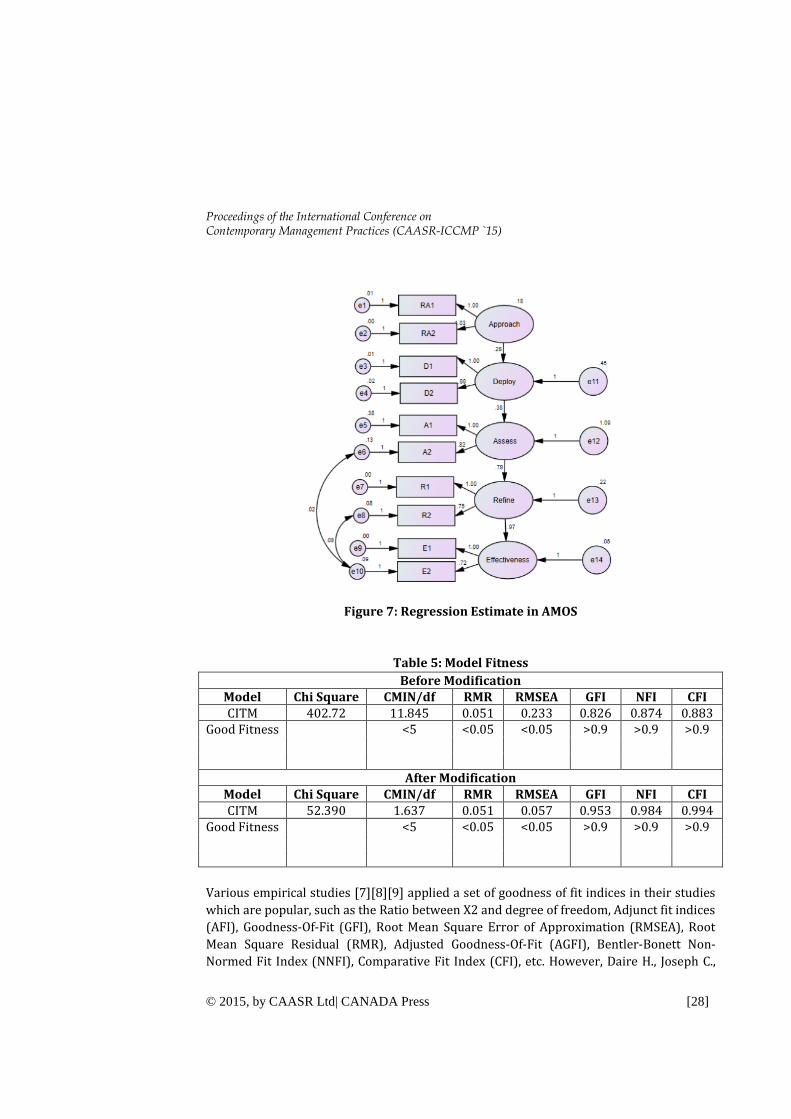
Figure 7: Regression Estimate in AMOS
Table 5: Model Fitness
Before Modification Model Chi Square CMIN/df RMR RMSEA GFI NFI CFI CITM 402.72 11.845 0.051 0.233 0.826 0.874 0.883
Good Fitness <5 <0.05 <0.05 >0.9 >0.9 >0.9
After Modification Model Chi Square CMIN/df RMR RMSEA GFI NFI CFI CITM 52.390 1.637 0.051 0.057 0.953 0.984 0.994
Good Fitness <5 <0.05 <0.05 >0.9 >0.9 >0.9
Various empirical studies [7][8][9] applied a set of goodness of fit indices in their studies
which are popular, such as the Ratio between X2 and degree of freedom, Adjunct fit indices
(AFI), Goodness-Of-Fit (GFI), Root Mean Square Error of Approximation (RMSEA), Root
Mean Square Residual (RMR), Adjusted Goodness-Of-Fit (AGFI), Bentler-Bonett Non-
Normed Fit Index (NNFI), Comparative Fit Index (CFI), etc. However, Daire H., Joseph C.,

Article ISBN: 978-0-9948937-0-3
© 2015, by CAASR Ltd| CANADA Press [29]
and Michael R. M., [10] state that though fit indices are a useful guide, a structural model
should also be examined with respect to substantive theory.
Measurement models achieve most of the fitness criteria listed in Table 5, therefore no
further modification is required.
In AMOS, the chi-square value is called CMIN, which is the goodness of fit, and it is
sometimes called the discrepancy function; the second criterion is the Chi Square/df – it
also should be < 5, which is the minimum discrepancy, and it is divided by the degree of
freedom df; the third criterion is the Root Mean Square (RMR) and should be < 0.05; the
fourth criterion is Root Mean Square Error of Approximation (RMSEA), also < 0.05; the
fifth criterion is the Goodness-of-Fit Index (GFI), which should be > 0.9; the sixth criterion
is the Normed Fit Index (NFI), which should also be > 0.9; and the seventh criterion is the
CFI and should also be > 0. The results from AMOS revealed a large variation of model fit
indices out of range of the model fit criteria, which is in agreement with many published
papers [11] [12] [13] [14] [15].
D. Decide model interpretation
The validity of the business excellence model is decided for the theory, measurement and
final interpretation, and determined the correlation values, the regression and Model
fitness tests, and finally decided that the fitness of the model.
The regression in the present implementation of CITM indicates the success of
improvement feedback. The interpretations are shown as following:-
Deploy = 0.28 Approach + e (6)
Assess = 0.38 Deploy + e (7)
Refine = 0.78 Assess + e (8)
Effectiveness = 0.97 Refine + e (9)
III. Discussion
It is noted in our paper, as mentioned in the previous section, that the validation could not
be carried out in all the six processes, but was based on the effectiveness of the use of, and
the direct relation to the outcome of, the model involved. The difficulty of training the
managers about the CITM was the first challenge in this exercise. Once the managers
understood the importance and the seriousness of the issue, they positively reported the
use of the CITM day-to-day. The CITM was used as a process by the teams to commission a
2000 MW power plant, and to provide an accurate tracking system to monitor and control
the major issues that relate to the safety, quality, availability and reliability of the power
plant. The teams use commissioning management review (CMR), which is based on the
RADAR instrument used for review and improvement. The validation process used (ABCD
Model Analysis) to carry out the validation did not cover each part of the CITM which

Proceedings of the International Conference on Contemporary Management Practices (CAASR-ICCMP `15)
© 2015, by CAASR Ltd| CANADA Press [30]
consist of the six processes. Other findings were that the CITM lacks a clear description of
the main process, even though the CITM has proved its validity and fitness of use based on
the results obtained in the analysis section.
The study conducted a vertical path analysis; there were some difficulties in arranging
models in the software. Many errors and unknown results were foreseen during the design
testing. Many or almost all of the published cases presented a 2 latent variables model; we
had difficulty finding a similar 9 main latent variables model, if not more. However, this
was overcome by limiting the process to one vertical path that includes five latent
variables, covering the four parts of RADAR, and linked with the effectiveness of the CITM
model.
IV. Conclusion
In this paper, the validation of CITM revealed that the model is considered fit after
necessary modification. However, the horizontal models could not be validated due to the
difficulty of the design of the CITM (which is considered a complex model). A complete
validation is only possible if the CITM under goes further improvement. To ensure a model
fitness it is necessary to standardize the model to evaluate future data, and does not
require further re-specification. The final models used in the existing study focus on the
explanation on causal effect and the correlation between the factors studied. The overall
conclusion indicates that the CITM model validation process was successful, and can be
used as a reference for further improvements. The importance of the validation process
will determine the sensibility, feasibility and acceptability of the modified model to be
introduced.
References
1. DEWA, (2011), Generation Division Improvement Report, Unpublished internal
document, DEWA Generation Division
2. Saad, S. M., & Al Afifi, M. N (2015) ABCD Model Analysis: A Critical Validation
Management Tool for Business Excellence Models. Synthesis, 4, 5.
3. Gupta, Vijay (2000) ‘Regression Explained in Simple Terms’ VJBook Inc. Retrieved:
August 2, 2014, from
ftp://131.252.97.79/Transfer/ES.../regression_explained_SPSS.doc
4. Kline, R.B. (2005) ‘Principles and Practice of Structural Equation Modeling’ (2nd
Edition ed.). New York: The Guilford Press.
5. Greene, W. H. (2007) ‘Multiple Regression Basic Collection’ New York University.
6. Nunnally, J. C. (1978) ‘Psychometric theory’ (2nd ed.). New York: McGraw-Hill.
7. Chen, C. H., & Lee, H. Y. (2008). ‘Empirical analysis of the customer loyalty problem
in the international logistics market’. WSEAS Transactions on business and
economics, 5(4), 107-117.

Article ISBN: 978-0-9948937-0-3
© 2015, by CAASR Ltd| CANADA Press [31]
8. Shih, M. L., Lin, S. H., Hsiao, S. H., Huang, L. M., Chiu, C. C., & Chen, K. Y. (2009), “‘The
study of the correlation among personality traits, leadership competence and
organizational performance”, WSEAS Transactions on Business and Economics,
1(6), 11-20.
9. Wong, Hsien-Lun & Tsai, Mei-Chi, (2010), “‘The Effects of Service Encounter and
Experiential Value on Consumer Purchasing Behavior”, Wseas Transactions on
Business and Economic, 2(7), 59-68
10. Daire Hooper, Joseph Coughlan, and Michael R. Mullen, (2008), “Structural Equation
Modelling: Guidelines for Determining Model Fit”, Electronic Journal of Business
Research Methods, Volume 6 Issue 1 2008 (53-60)
11. Hu, L.T. and Bentler, P.M. (1999), “Cutoff Criteria for Fit Indexes in Covariance
Structure Analysis: Conventional Criteria Versus New Alternatives”, Structural
Equation Modeling, 6 (1), 1-55.
12. Ahmed, P. and Rafiq, M., (1998), “Integrated benchmarking: a holistic examination
of select techniques for benchmarking analysis”, Benchmarking: An International
Journal, Vol. 5 Iss: 3 pp. 225 – 242. ,
13. Badri, M., Selim, H. Alshare, K, GrandonE, Younis, H., Abdulla,M.(2006), “The
Baldrige Education Criteria for Performance Excellence Framework: Empirical test
and validation”, International Journal of Quality & Reliability Management, Vol. 23
Iss: 9 pp. 1118 – 1157
14. Bassioni,H. A T.M. Hassan, T.M and. Price, A.D.F, (2008), “Evaluation and analysis of
criteria and sub-criteria of a construction excellence model’, Engineerin”,
Construction and Architectural Management, ISSN 0969-9988, 2008, Volume 15,
Issue 1, pp. 21 - 41
15. Bollen, K. (1989), “Structural Equations with Latent Variables”, Wiley, New York,
NY.