Validation of an acoustic head simulator for the...
52
Validation of an acoustic head simulator for the evaluation of personal hearing protection devices Sharon M. Abel Patricia Odell Garry Dunn Defence R&D Canada – Toronto Technical Report DRDC Toronto TR 2004-138 November 2004
Transcript of Validation of an acoustic head simulator for the...

Validation of an acoustic head simulator for the evaluation of personal hearing protection devices
Sharon M. Abel Patricia Odell Garry Dunn
Defence R&D Canada – Toronto Technical Report DRDC Toronto TR 2004-138 November 2004

DRDC Toronto TR 2004-138
iii
Abstract A study was carried out to assess the validity of using an acoustic test fixture (ATF) designed to measure the sound reduction afforded by personal hearing protection devices. The ATF under review consists of a head simulator cast from aluminum-filled epoxy and covered with artificial skin. Cavities milled out on either side allow for the insertion of ear modules that incorporate a mechanical reproduction of human aural tissues. The ear canal is terminated by Zwislocki coupler and Etymotic ER-11 measurement microphone and models the impedance of the human ear. The experiment was carried out in a semi-reverberant chamber. On two separate occasions scheduled four months apart, the right ear of the ATF was fitted with an earmuff (E-A-R 3000), an earplug (E-A-R Classic foam plug), and the muff and plug in combination. The non test ear was fitted with an E-A-R Classic plug. The stimulus was continuous pink noise, presented free-field at a level of 86 dB SPL using a bank of low, middle and high frequency speakers. Monaural sound level measurements were made under each of these conditions, as well as with the test ear unoccluded. These were replicated three times within each of the two test sessions using two different settings of the measurement microphone, diffuse-field equalization and flat frequency response. Measurements were recorded and subsequently subjected to a one-third octave band analysis from 12.5 Hz to 20 kHz. The results showed that the measurements were highly stable within and across sessions. Differences in the sound pressure level due to the setting of the measurement microphone were in line with published specifications. These did not affect insertion loss values. When corrected for the effects of bone conduction, occlusion and physiological masking, insertion loss values (the difference between unoccluded and protected levels), closely matched real-ear attenuation at threshold data collected from human observers in the range of 500 Hz to 8 kHz.

DRDC Toronto TR 2004-138
iv
Résumé Une étude a été effectuée afin d’évaluer la validité de l’utilisation d’un « dispositif d’essai acoustique » (acoustic test fixture, ou ATF) destiné à mesurer l’affaiblissement acoustique offert par des dispositifs de protection personnelle de l’ouie. L’ATF à l’étude consiste en un simulateur de tête époxy chargé d’aluminium et recouvert de peau artificielle. Les cavités de chaque côté permettent l’insertion de modules d’oreilles qui reproduisent les mécanismes des tissus auriculaires humains. Le conduit auditif externe, qui aboutissait dans un coupleur de Zwislocki et un micro de mesure Etymotic ER-11, a servi de modèle d’impédance acoustique de l’oreille humaine. L’expérience a eu lieu dans une chambre semi-réverbérante. Au cours de deux expériences distinctes, effectuées à quatre mois d’intervalle, on a successivement placé sur l’oreille droite de l’ATF un cache-oreilles antibruit (E.A.R. 3000), un bouchon d’oreille (bouchon-mousse E.A.R. Classic) et à la fois le cache-oreilles et le bouchon d’oreille. On a posé un bouchon-mousse E.A.R. Classic sur l’oreille non testée. Le stimulus était un bruit rose continu, présenté dans une chambre sourde à 86 dB SPL au moyen d’un ensemble de hauts-parleurs à fréquences basses, moyennes et hautes. Les mesures du niveau sonore monaural ont été effectuées avec chacun des dispositifs, les deux ensemble ainsi qu’avec aucun des deux. On a répété les essais trois fois durant chacune des deux séries d’essais en utilisant deux réglages différents pour le micro de mesure, l’égalisation acoustique en champ diffus et la réponse en fréquence uniforme. Les mesures ont été enregistrées puis soumises à une analyse par bande de tiers d’octave de 12,5 Hz à 20 kHz. Les résultats ont démontré que les mesures étaient très stables durant chacune des séries d’essais ainsi que d’une série à l’autre. Les différences au chapitre de la pression acoustique dues aux réglages du micro de mesure étaient conformes aux spécifications publiées. Ces différences n’ont pas influé sur la perte d’insertion. Après correction pour tenir compte des effets de la conduction osseuse et de l’occlusion et du masquage physiologique, la perte d’insertion (différence selon que le sujet portait ou non les dispositifs de protection de l’ouïe) présentait une corrélation étroite avec l’atténuation acoustique effective au niveau liminaire observé chez des sujets humains dans le plage de 500 Hz à 8 kHz.
DRDC Toronto TR 2004-138
v
Executive summary This study determined the validity of using an acoustic test fixture (ATF) in place of human subjects to assess the sound reduction afforded by personal hearing protection devices. The ATF allows for the measurement of sound reduction (insertion loss) at supra threshold levels for both continuous and impulse noise that might be outside the frequency range of or injurious to human hearing. Potential drawbacks are that the ATF may not accurately model human peripheral auditory pathways and does not provide an opportunity to assess the variability in outcome due to individual differences in the fit of candidate devices. The ATF that was used in the present investigation was developed at the Institute of Biomedical Engineering, University of Toronto, under contract to DRDC Toronto. It comprises a head simulator cast from aluminum-filled epoxy and covered with artificial skin. The head is supported by a compliant neck module, attached to a standard KEMAR torso mounted on an adjustable stand. It is separable into two halves along the mid sagittal plane with a hollow interior for instrumentation. Cavities milled out on either side accommodate snap in ear modules. The test ear canal is terminated by a Zwislocki coupler. The experiment was conducted in a semi-reverberant sound isolation room. The stimulus was 86 dB SPL continuous pink noise presented over a bank of speakers facing the ATF at a distance of about 4 m. Monaural sound level measurements were made at the “eardrum” using an Etymotic ER-11 microphone set in one of two modes: flat frequency and equalized flat frequency response. The latter measures the simulated diffuse-field response. Measurements were made with the pinna of the test ear unoccluded and protected with an E-A-R 3000 earmuff, E-A-R Classic foam earplug and the muff and plug in combination. The non test ear was fitted with an E-A-R Classic foam plug. The response was recorded for later third octave analysis at thirty-three centre frequencies from 12.5 Hz to 20 kHz. Insertion loss values were calculated as the difference between the protected and unoccluded measurement at each frequency. Each of the eight ear by microphone setting conditions was replicated three times in close succession so that the reliability of the outcome could be assessed. The devices were refit for each measurement. The entire experiment was repeated after an interval of four months. The results indicated that the sound level measurements were highly repeatable. Within each session, standard deviations were less than 2 dB for the most part. Across test sessions, the differences between mean values were generally no greater than 6 dB. As specified by the manufacturer, sound levels were less for the diffuse-field equalization setting than the flat frequency response setting of the microphone, ranging from 2 to 15 dB across frequency bands, with a maximum at 2.5 kHz. The microphone setting did not affect the insertion loss values. For the muff, insertion loss values were generally within 4 dB of published sound attenuation results derived from human subjects experiments from 125 Hz to 8 kHz. Differences as large as 18 dB were observed for the plug. Closer fits in the order of 5 dB were obtained from 500 Hz to 8 kHz when insertion loss values were corrected for the limiting effects of human bone conduction, perceptual masking effects and physiological noise at low frequencies.
Abel, S.M., Odell, P. and Dunn, G. 2004. Validation of an acoustic head simulator for the evaluation of personal hearing protection devices. TR 2004-138 DRDC Toronto.

DRDC Toronto TR 2004-138
vi
Sommaire Cette étude a porté sur la validité de l’utilisation d’un « dispositif d’essai acoustique » (acoustic test fixture, ou ATF) au lieu de sujets humains pour mesurer l’affaiblissement acoustique offert par des dispositifs de protection personnelle de l’ouïe. L’ATF permet de mesurer l’affaiblissement acoustique (perte d’insertion) à des niveaux supraliminaires, tant pour les bruits continus que pour les bruits impulsifs qui pourraient se situer à l’extérieur du spectre sonore de l’humain ou causer des lésions chez l’humain. Parmi les inconvénients potentiels, il se peut que l’ATF ne reproduise pas efficacement le système auditif périphérique de l’humain et qu’il ne permette pas d’évaluer la variation des résultats due aux différences individuelles en ce qui a trait à l’ajustement des dispositifs candidats. L’ATF utilisé dans le cadre de la présente étude a été mis au point à l’Institut de génie biomédical de l’Université de Toronto en sous-traitance pour RDDC Toronto. Il consiste en un simulateur de tête époxy chargé d’aluminium et recouvert de peau artificielle. La tête est soutenue par un module de cou souple rattaché à un torse de mannequin KEMAR monté sur un support ajustable. La tête se divise en deux dans l’axe du plan sagittal médian; elle est creuse afin qu’on puisse y placer des instruments. Les cavités de chaque côté permettent l’insertion de modules d’oreilles. Le conduit auditif externe servant à l’essai aboutissait dans un coupleur de Zwislocki. L’expérience a eu lieu dans une chambre semi-réverbérante insonorisée. Le stimulus était un bruit rose continu, présenté dans une chambre sourde à 86 dB SPL au moyen d’un ensemble de hauts-parleurs disposés devant l’ATF, à une distance d’environ 4 m. Les mesures du niveau sonore monaural ont été prises au niveau de la « membrane du tympan » à l’aide d’un micro Etymotic ER-11 réglé dans un des deux modes suivants : fréquence uniforme et réponse en fréquence uniforme égalisée. Le mode réponse en fréquence uniforme égalisée mesure la réponse en champ diffus simulé. Les mesures ont été prises dans les conditions suivantes : pavillon de l’oreille testée non bouché, pavillon protégé par le cache-oreilles antibruit E.A.R. 3000, pavillon protégé par le bouchon-mousse E.A.R. Classic et pavillon protégé à la fois par le cache-oreilles et le bouchon-mousse. On a posé un bouchon-mousse E.A.R. Classic sur l’oreille non testée. La réponse a été enregistrée en vue d’une analyse ultérieure par bande de tiers d’octave faisant appel à 33 fréquences centrales allant de 12,5 Hz à 20 kHz. La perte d’insertion a été calculée comme la différence avec et sans les dispositifs de protection de l’ouïe à chaque fréquence. Chacune des huit conditions d’essai a été reproduite trois fois à des intervalles rapprochés, de manière que la fiabilité des résultats puisse être évaluée. Les dispositifs ont été ajustés de nouveau pour chaque mesure. L’expérience entière a été répétée après un intervalle de quatre mois. Les résultats ont montré que les mesures du niveau sonore étaient hautement reproductibles. Les écarts types ont été inférieurs à 2 dB durant la plupart des séances d’essai. Les différences entre les valeurs moyennes d’une séance d’essai à l’autre n’ont généralement pas dépassé 6 dB. Tel qu’indiqué par le fabricant, les niveaux sonores ont été moins élevés lorsque le micro était en mode égalisation acoustique en champ diffus que lorsqu’il était en mode réponse en fréquence uniforme, variant de 2 à 15 dB selon la fréquence utilisée (la plus haute étant 2,5 kHz). Le réglage du micro n’a pas influé sur la perte d’insertion. Avec le cache-oreilles antibruit, la perte d’insertion s’est généralement située à 4 dB ou moins des résultats publiés des essais d’atténuation acoustique sur des sujets humains à des fréquences de 125 Hz à 8 kHz. On a relevé des différences allant jusqu’à 18 dB avec le bouchon-mousse. On a obtenu des concordances de l’ordre de 5 dB pour la gamme de 500 Hz à 8 kHz après avoir corrigé les valeurs de perte d’insertion en fonction des effets limitatifs de
DRDC Toronto TR 2004-138
vii
la conduction osseuse chez l’humain, des effets du masquage perceptuel et du bruit physiologique à des fréquences basses.
Abel, S.M., Odell, P. and Dunn, G. 2004. Validation of an acoustic head simulator for the evaluation of personal hearing protection devices. TR 2004-138 DRDC Toronto.

DRDC Toronto TR 2004-138
viii
This page intentionally left blank.
DRDC Toronto TR 2004-138
ix
Table of contents
Abstract ................................................................................................................................... iii
Résumé ................................................................................................................................... iv
Executive summary .................................................................................................................... v
Sommaire................................................................................................................................... vi
Table of contents ....................................................................................................................... ix
List of figures ............................................................................................................................. x
List of tables .............................................................................................................................. xi
Acknowledgements .................................................................................................................. xii
Introduction………………………………………………………………………………......... 1
Methods and materials………………………………………………………..…. ..................... 3 Experimental design…………………………………………………………… .......... 3 Procedure ……………………………………………………………………… .......... 4
Results………………………………………………………………………………………..... 5 Discussion ………………………………………………………………….............................. 7
Conclusions ................................................................................................................... 8 References……………………………………………………………………………………... 9
Figures……………………………………………………………………………… .............. 11
Tables…… ............................................................................................................................... 23
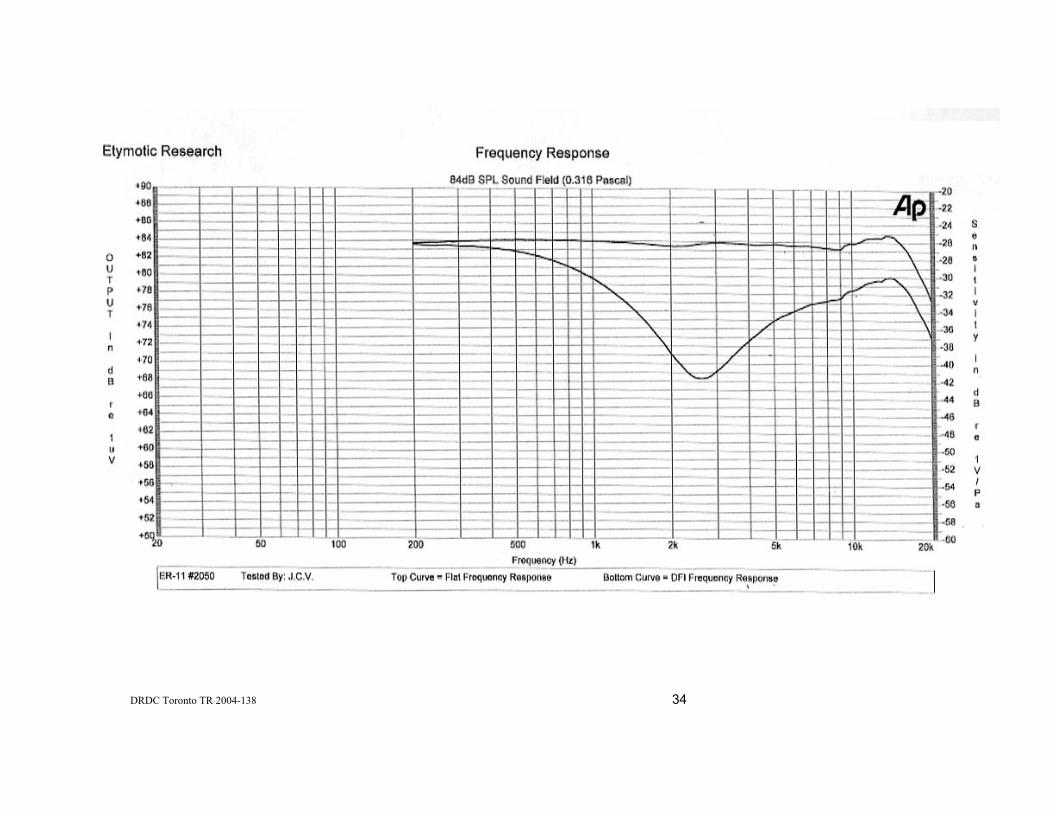
Annex A Output of the Etymotic ER-11 microphone with diffuse-field equalization and flat frequency response settings. Published specifications.. ........................................... 33
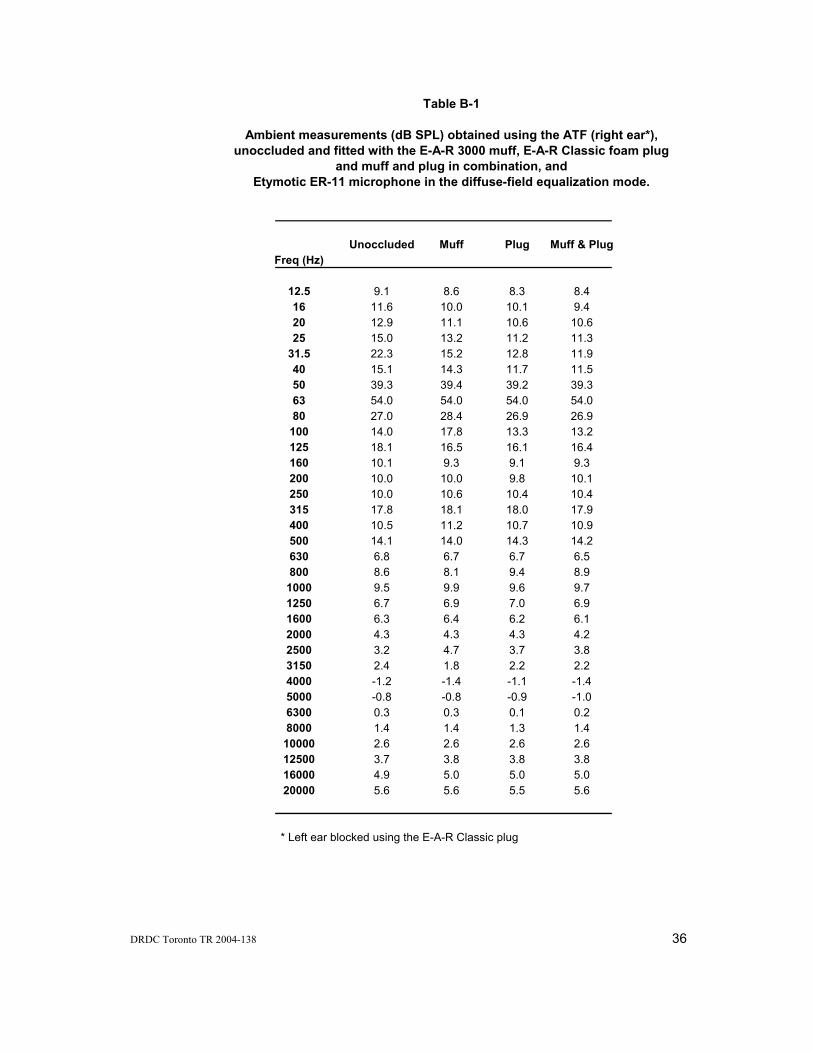
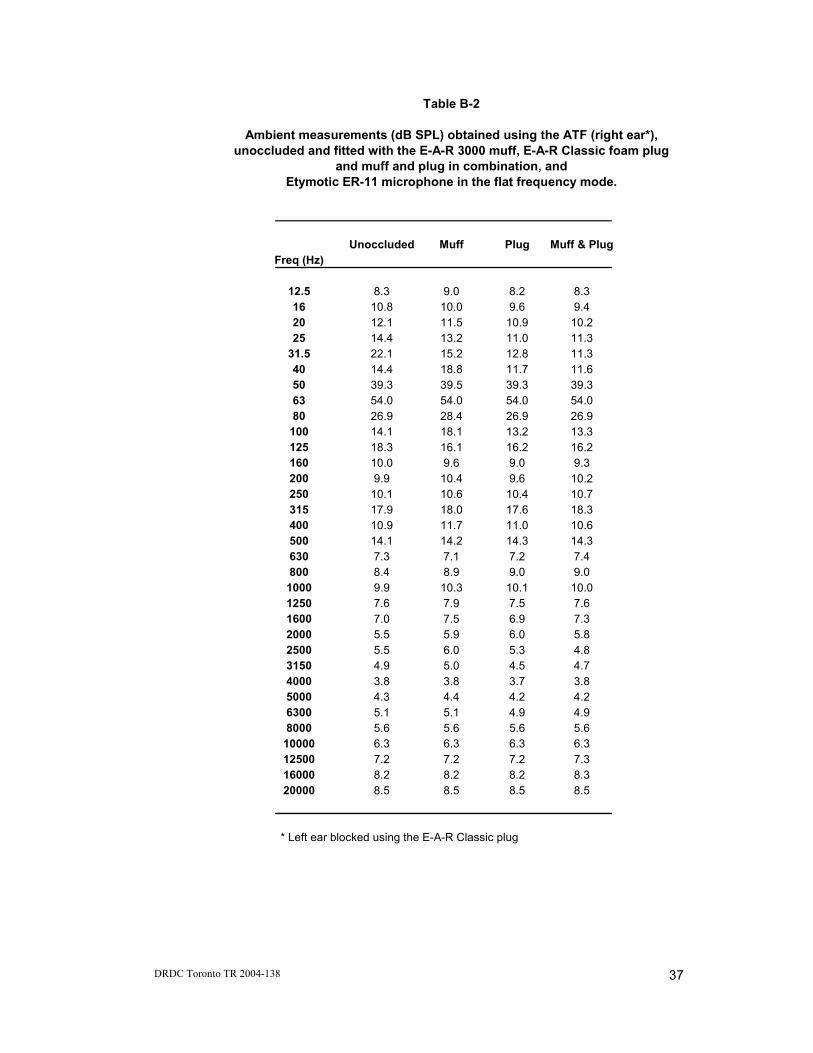
Annex B Ambient noise levels in the test chamber................................................................. 35
DRDC Toronto TR 2004-138
x
List of figures
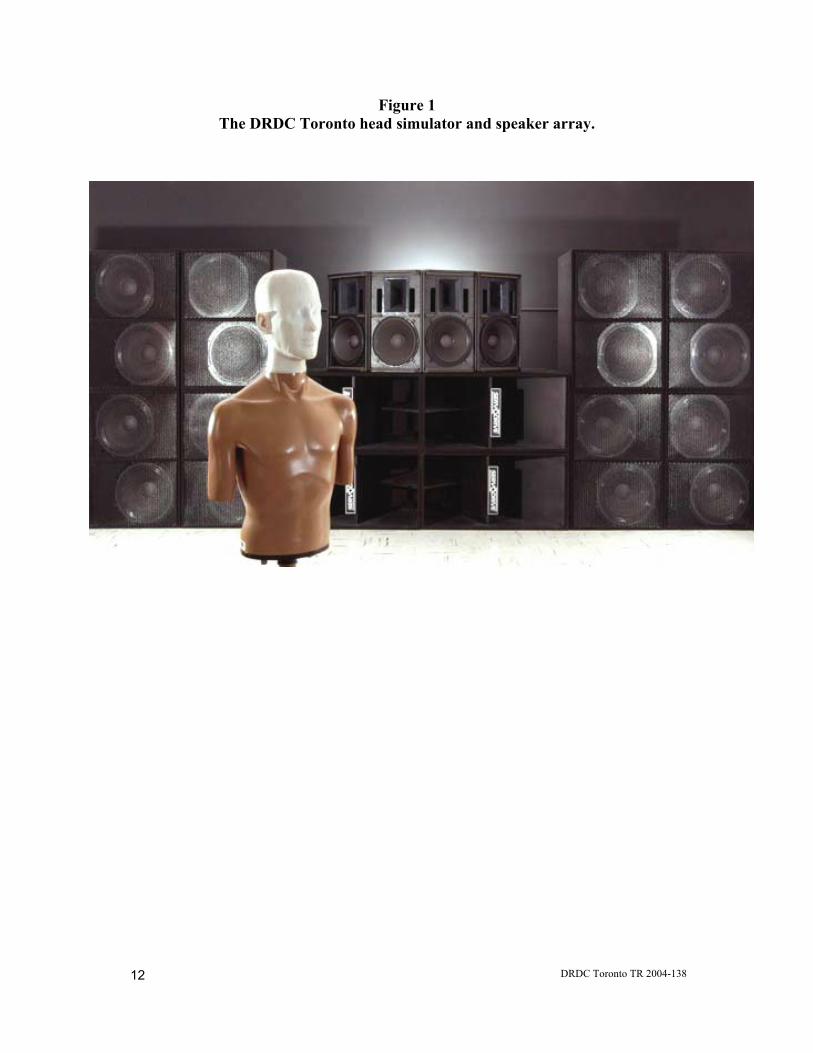
Figure 1. The DRDC Toronto head simulator and speaker array... .......................................... 12
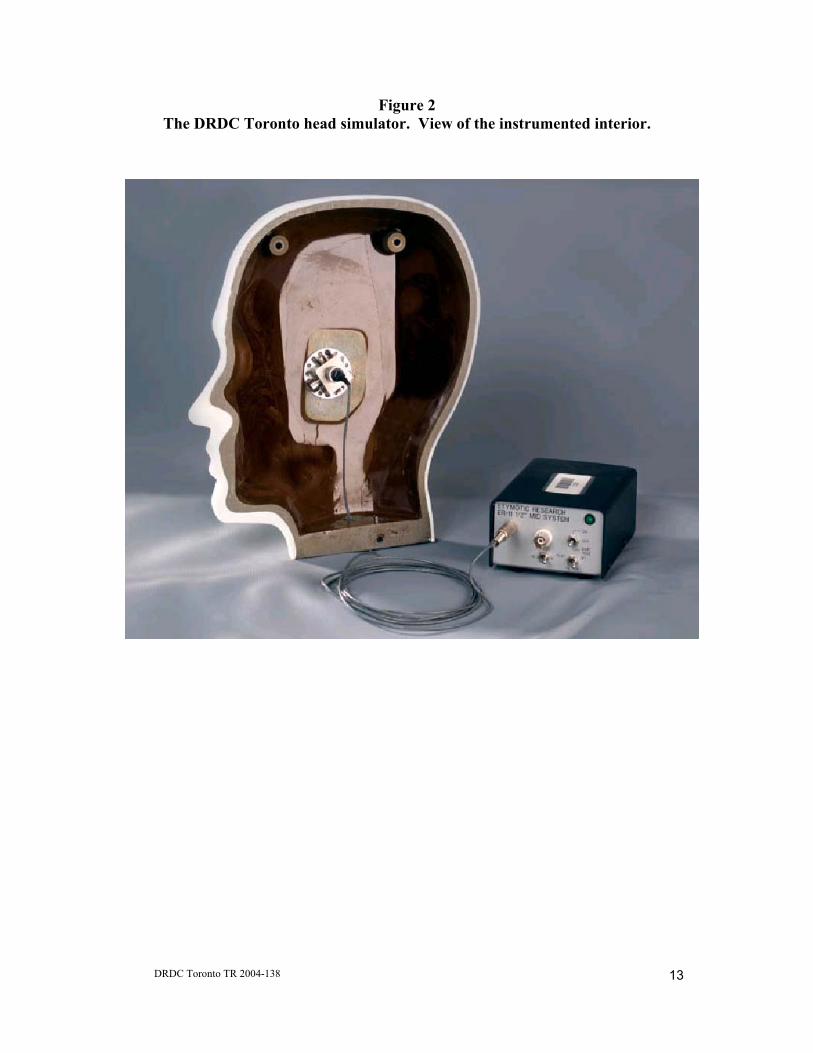
Figure 2. The DRDC Toronto head simulator. View of the instrumented interior................. 13
Figure 3. Sound level measurements obtained using the ATF (right ear), and Etymotic ER-11 Microphone in the diffuse-field equalization mode. Results are presented for the four ear conditons, averaged across Tests 1 and 2.......................................................................... 14
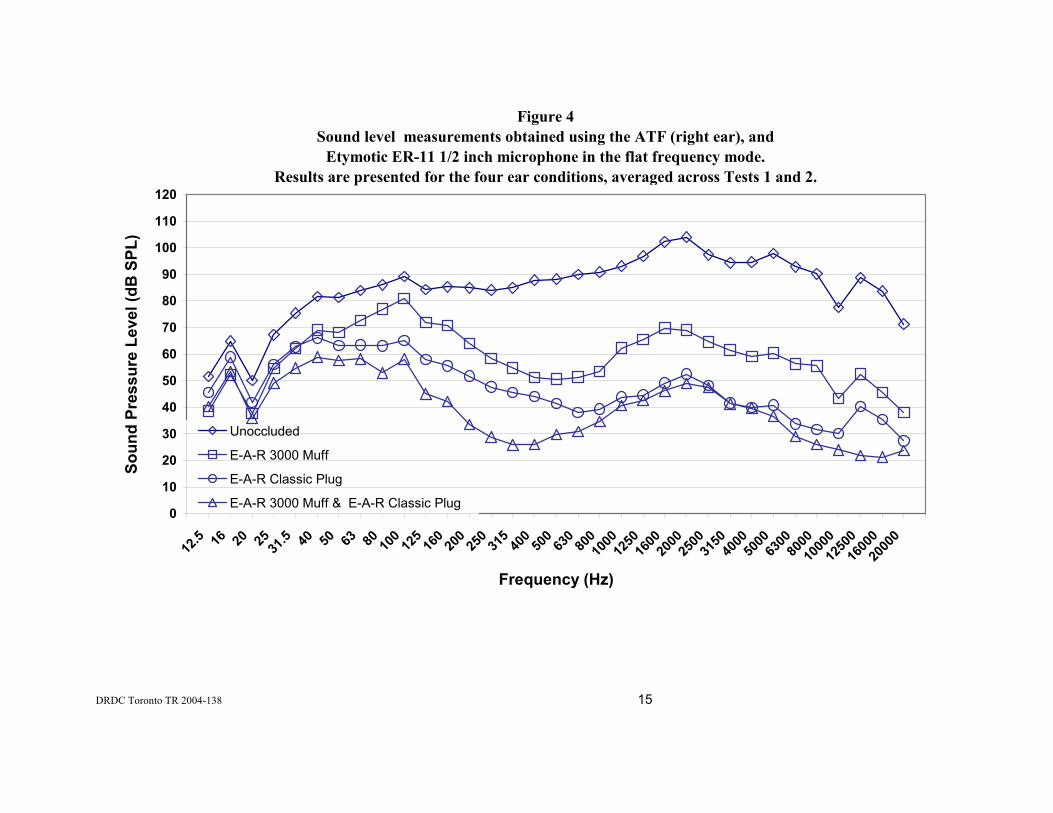
Figure 4. Sound level measurements obtained using the ATF (right ear), and Etymotic ER-11 Microphone in the flat frequency response mode. Results are presented for the four ear conditons, averaged across Tests 1 and 2.......................................................................... 15
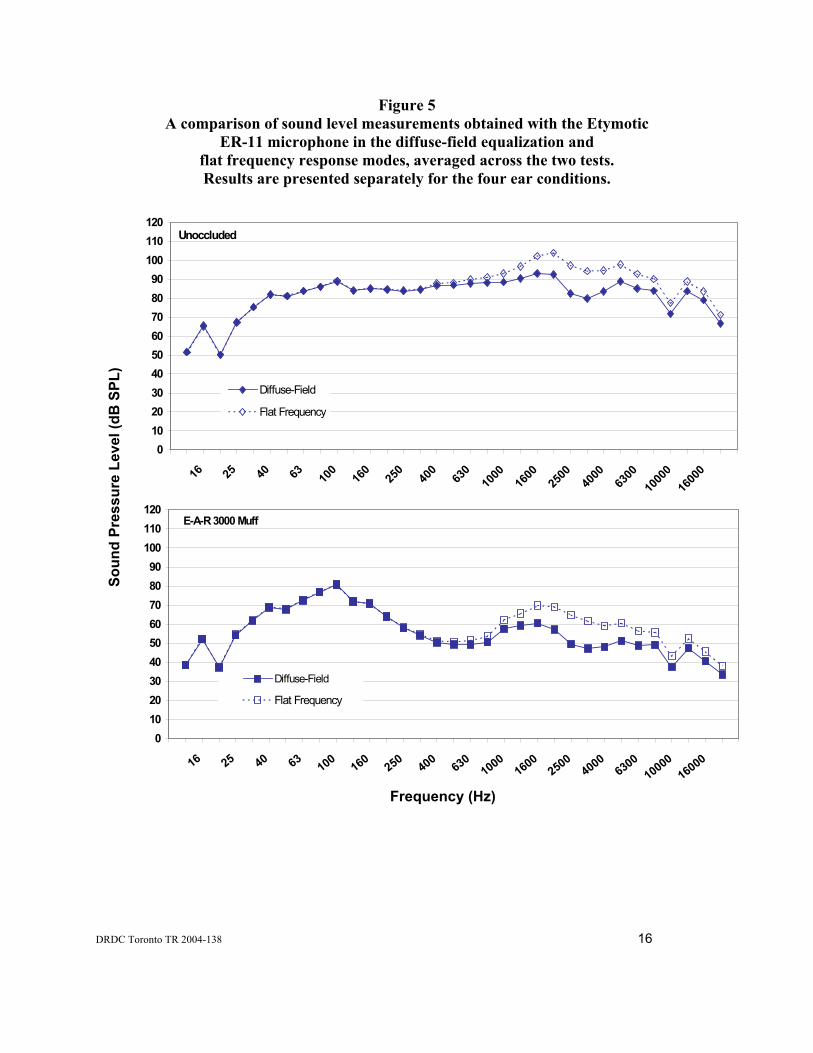
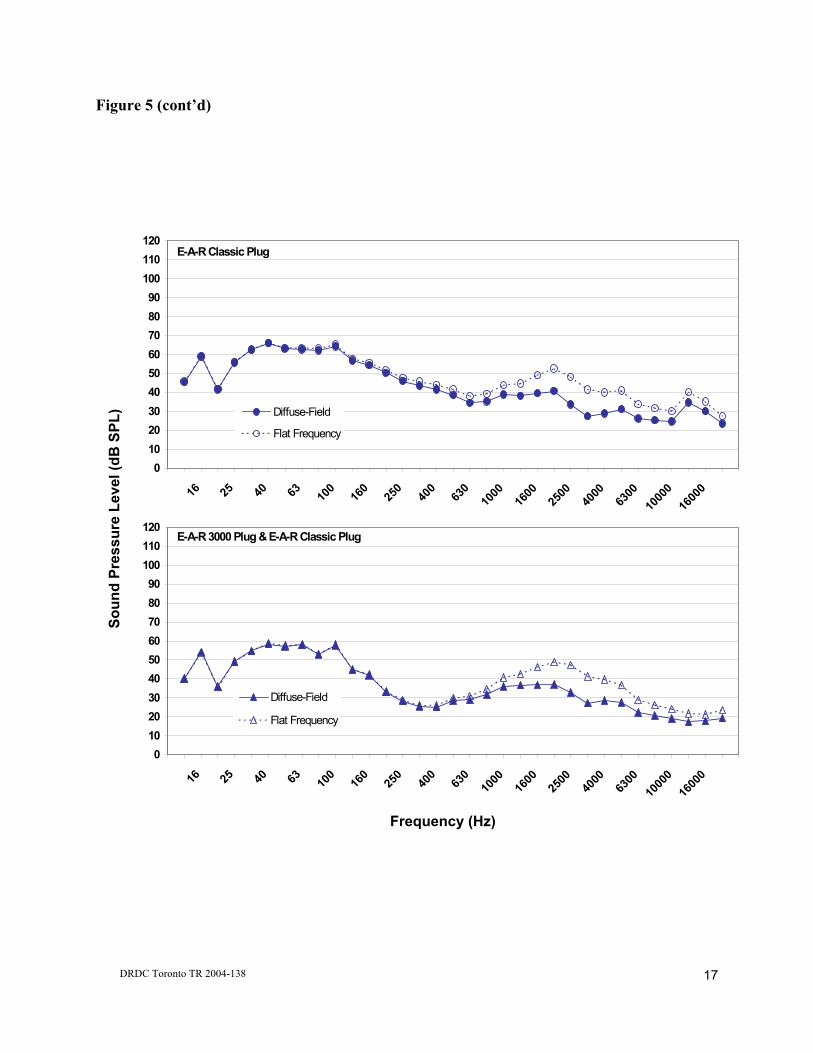
Figure 5. A comparison of sound level measurements obtained with the Etymotic ER-11 microphone in the diffuse-field equalization and flat frequency response modes, averaged across the two tests. Results are presented separately for the four ear conditions ........... 16
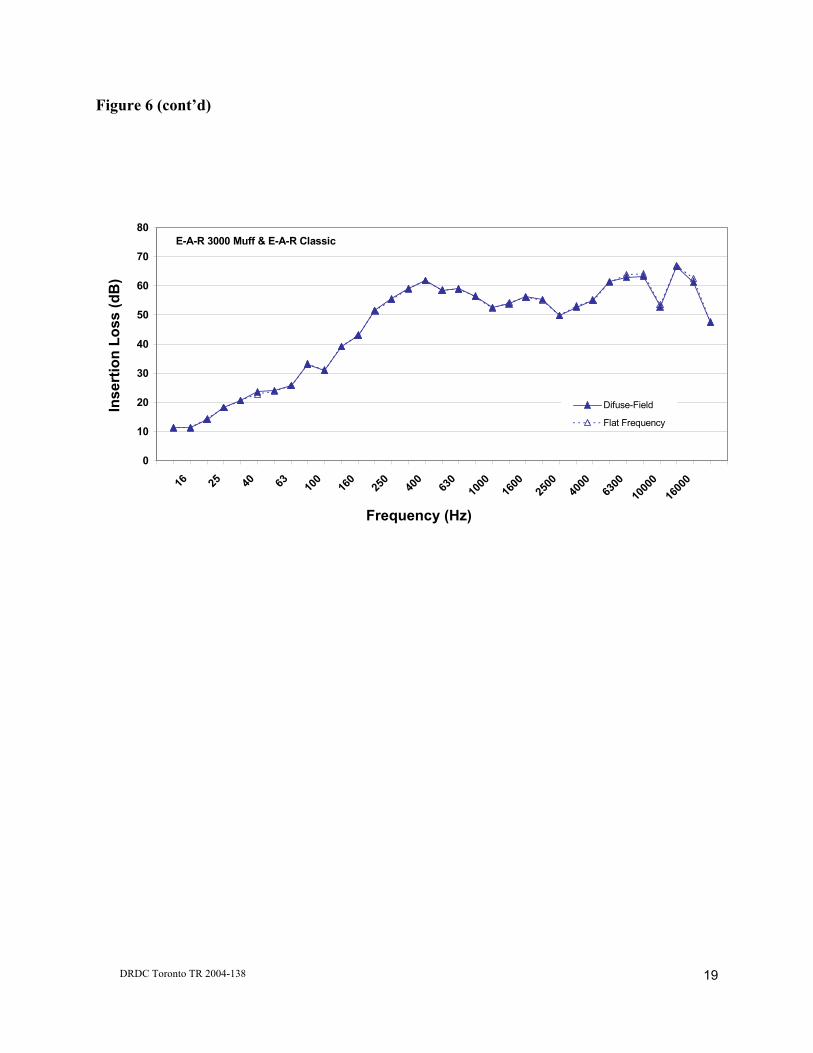
Figure 6. A comparison of insertion loss values obtained with the Etymotic ER-11 microphone in the diffuse-field equalization and flat frequency response modes, averaged across the two tests. Results are presented separately for the three protector conditions 18
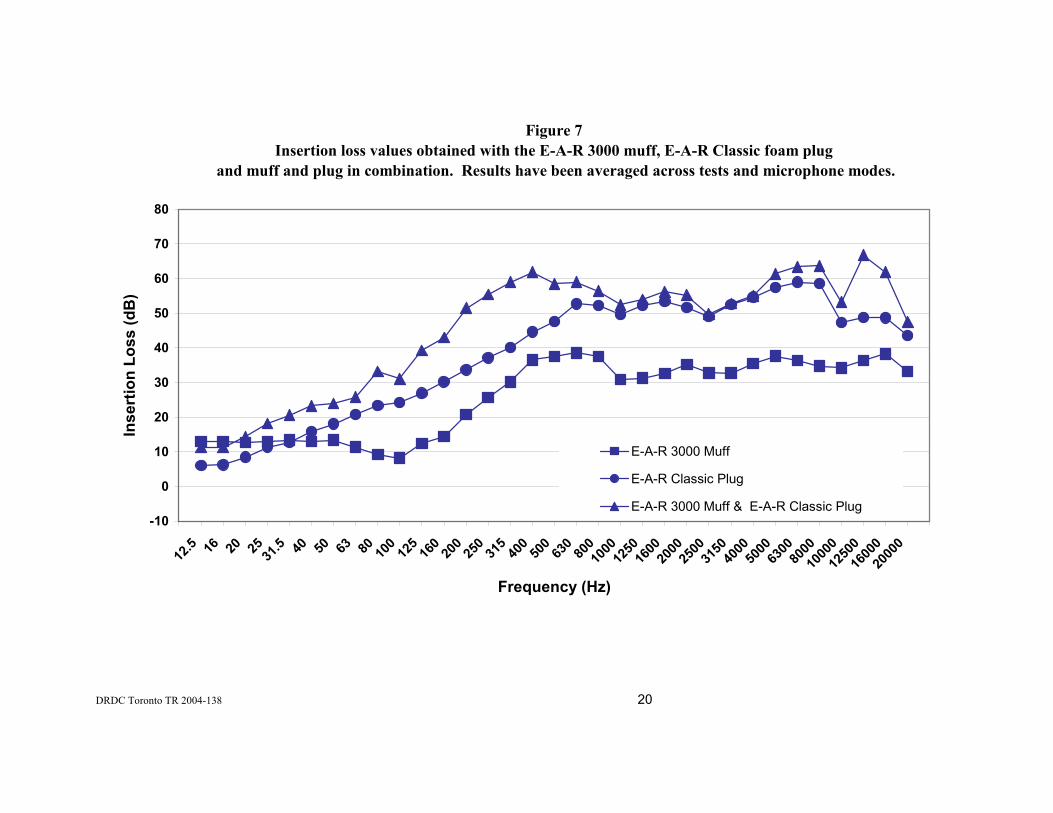
Figure 7. Insertion loss values obtained with the E-A-R 3000 muff, E-A-R Classic foam plug and muff and plug in combination. Results have been averaged across tests and microphone modes ............................................................................................................ 20
Figure 8. A comparison of mean insertion loss values obtained with the ATF and REAT data published by the manufacturer and an independent research laboratory. Results are presented for the E-A-R 3000 muff and E-A-R Classic plug............................................ 21
DRDC Toronto TR 2004-138
xi
List of tables
Table 1. Sound level measurements (dB SPL) obtained using the ATF (right ear), unoccluded and fitted with the E-A-R 3000 muff, E-A-R Classic foam plug and muff and plug in combination, and Etymotic ER-11 microphone in the diffuse-field equalization mode. Test 1 ...................................................................................................................... 24
Table 2. Sound level measurements (dB SPL) obtained using the ATF (right ear), unoccluded and fitted with the E-A-R 3000 muff, E-A-R Classic foam plug and muff and plug in combination, and Etymotic ER-11 microphone in the flat frequency response mode. Test 1 ...................................................................................................................... 25
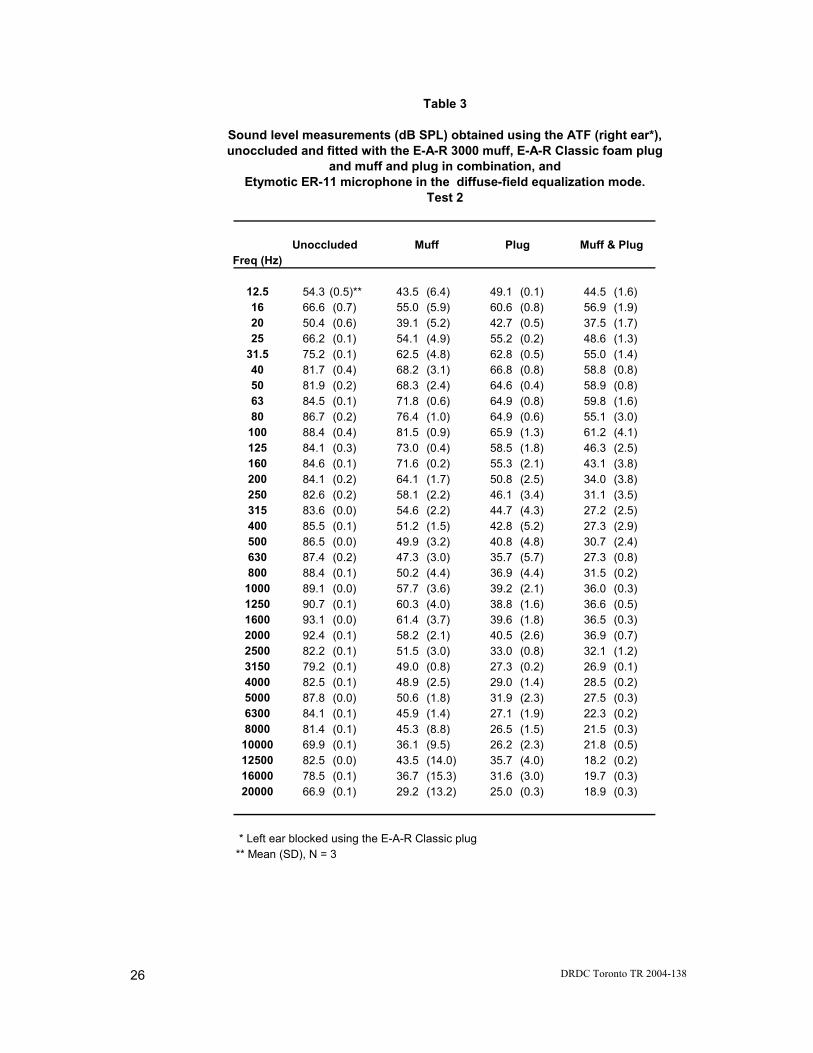
Table 3. Sound level measurements (dB SPL) obtained using the ATF (right ear), unoccluded and fitted with the E-A-R 3000 muff, E-A-R Classic foam plug and muff and plug in combination, and Etymotic ER-11 microphone in the diffuse-field equalization mode. Test 2 ...................................................................................................................... 26
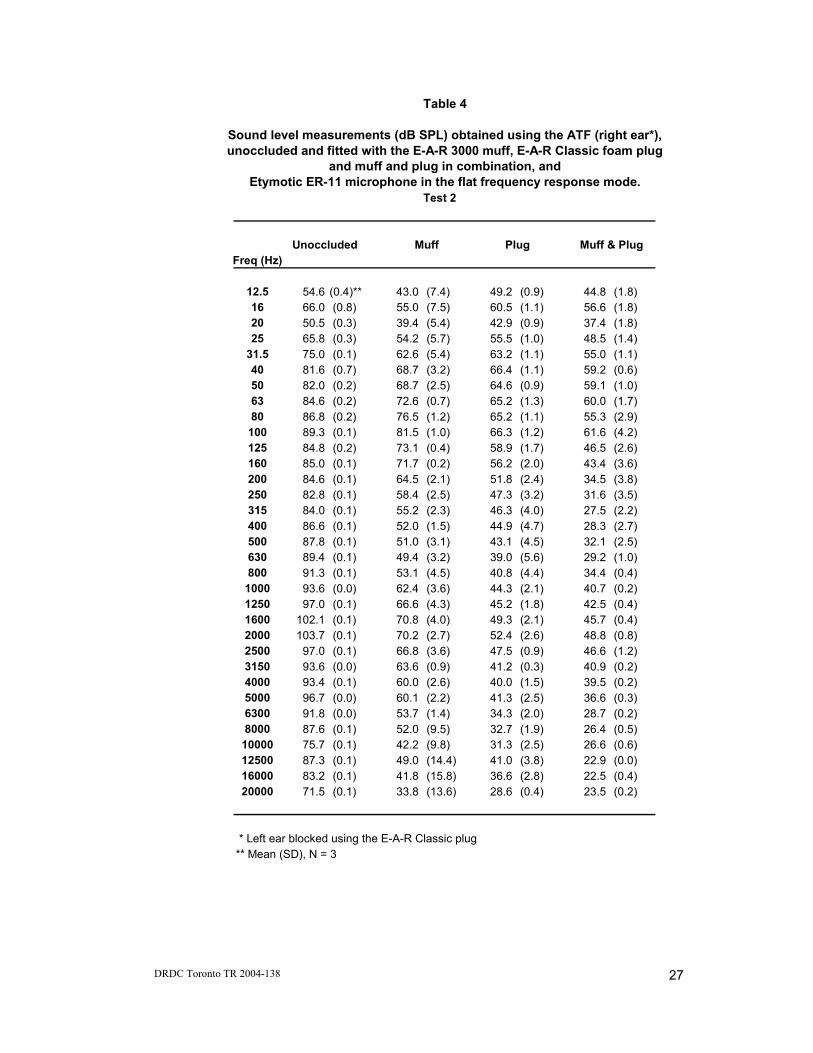
Table 4. Sound level measurements (dB SPL) obtained using the ATF (right ear), unoccluded and fitted with the E-A-R 3000 muff, E-A-R Classic foam plug and muff and plug in combination, and Etymotic ER-11 microphone in the flat frequency response mode. Test 2 ...................................................................................................................... 27
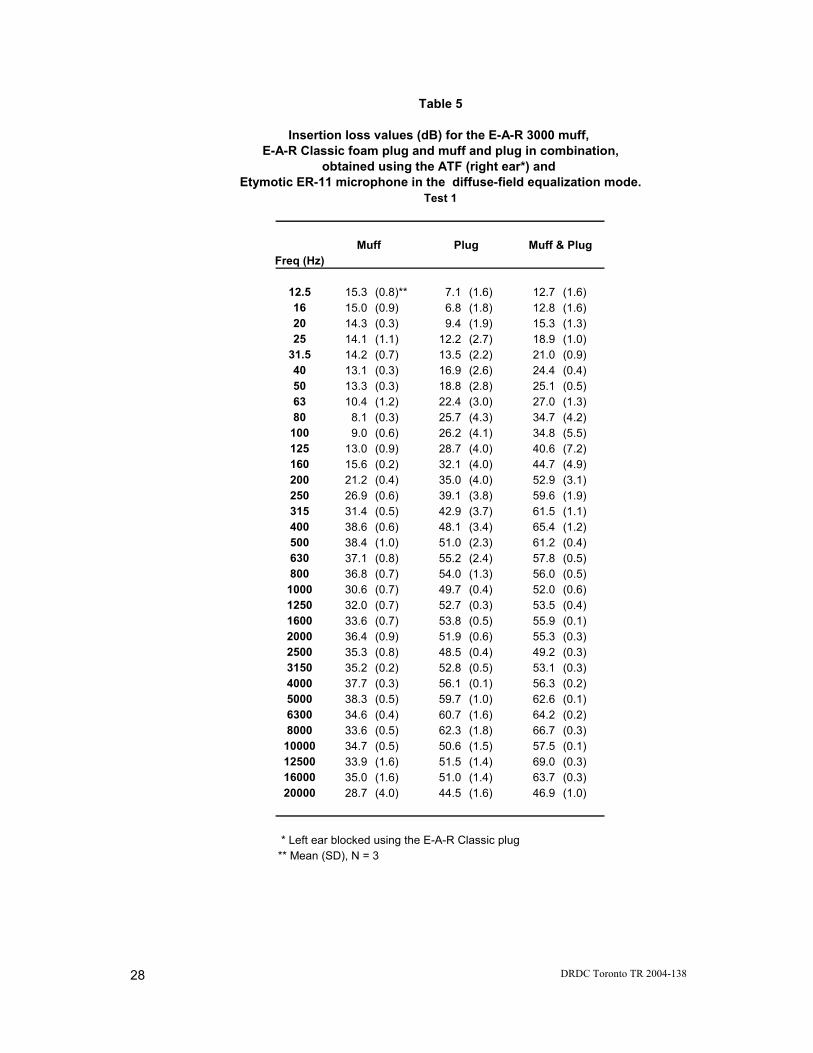
Table 5. Insertion loss values (dB) for the E-A-R 3000 muff, E-A-R Classic foam plug and muff and plug in combination, obtained using the ATF (right ear) and Etymotic ER-11 microphone in the diffuse-field equalization mode. Test 1 .............................................. 28
Table 6. Insertion loss values (dB) for the E-A-R 3000 muff, E-A-R Classic foam plug and muff and plug in combination, obtained using the ATF (right ear) and Etymotic ER-11 microphone in the flat frequency response mode. Test 1................................................. 29
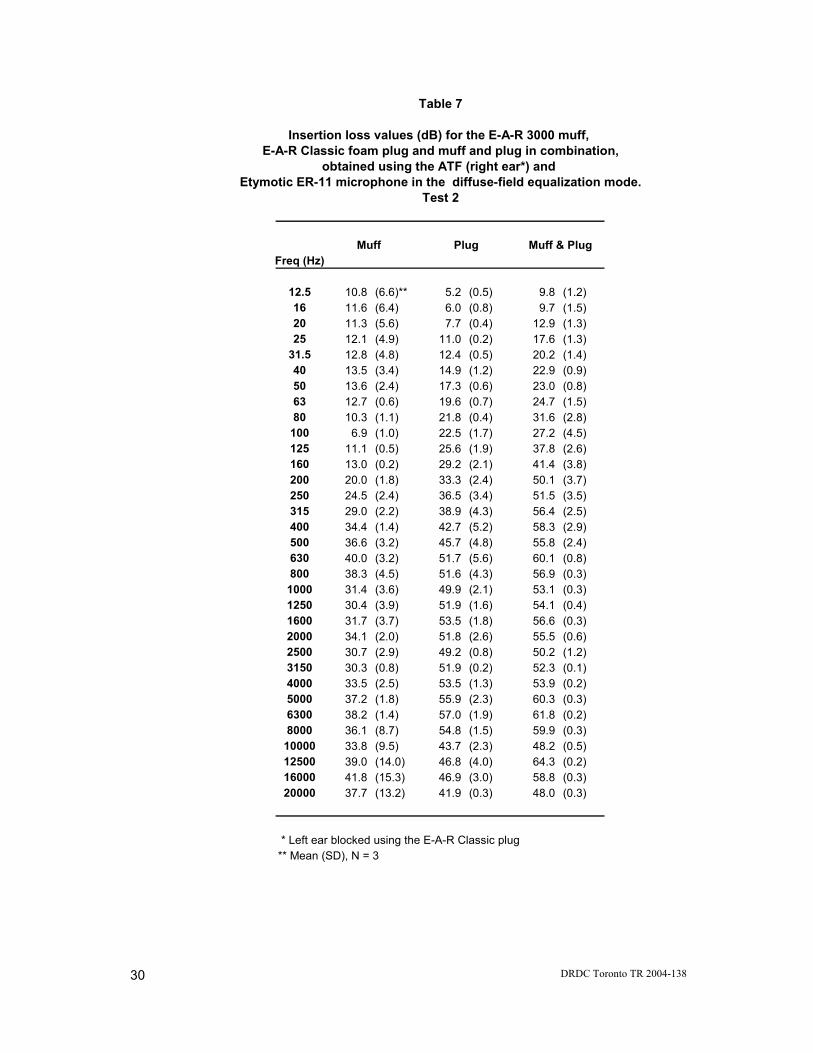
Table 7. Insertion loss values (dB) for the E-A-R 3000 muff, E-A-R Classic foam plug and muff and plug in combination, obtained using the ATF (right ear) and Etymotic ER-11 microphone in the diffuse-field equalization mode. Test 2 .............................................. 30
Table 8. Insertion loss values (dB) for the E-A-R 3000 muff, E-A-R Classic foam plug and muff and plug in combination, obtained using the ATF (right ear) and Etymotic ER-11 microphone in the flat frequency response mode. Test 2................................................. 31
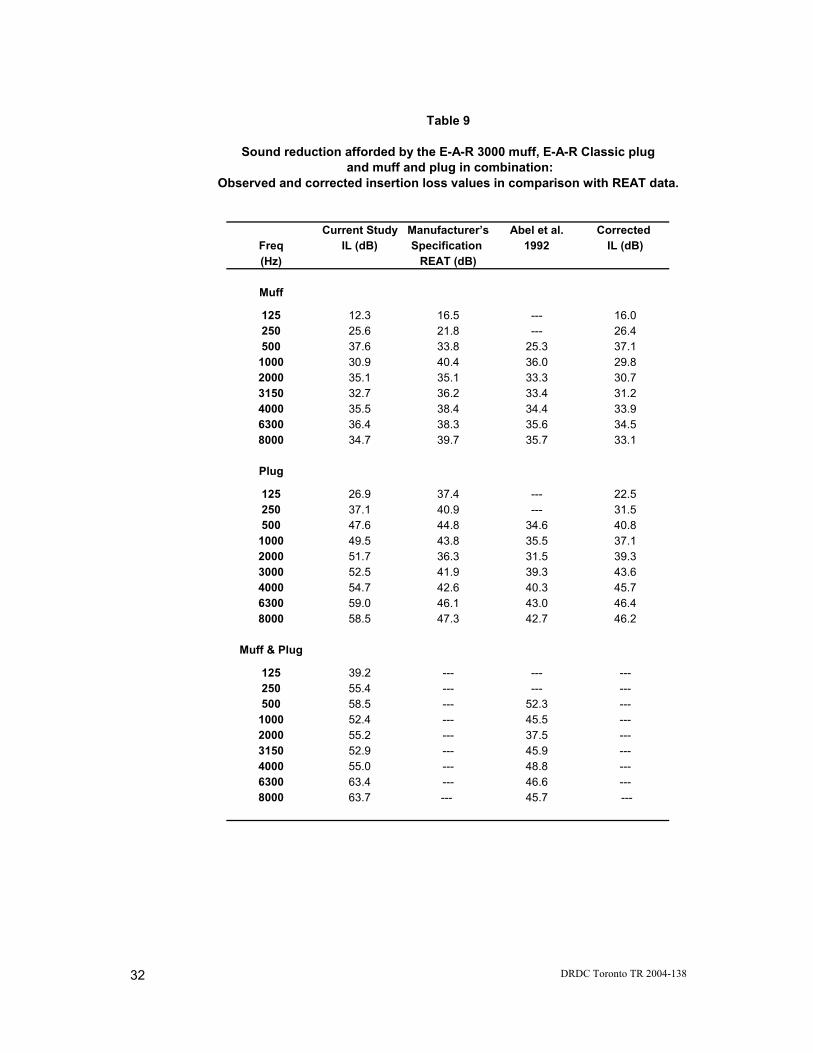
Table 9. Sound reduction afforded by the E-A-R 3000 muff, E-A-R Classic plug and muff and plug in combination: Observed and corrected insertion loss values in comparison with REAT data................................................................................................................. 32

DRDC Toronto TR 2004-138
xii
Acknowledgements This research was supported by funding from the Military Operational Medicine Thrust, Defence R&D Canada. The authors are indebted to Mr. R. Brian Crabtree, formerly Group Leader, Communications Group, DRDC Toronto and Dr. Christian Giguère, Associate Professor, Audiology and Speech-Language Pathology Program, University of Ottawa for their constructive comments on an earlier draft.
DRDC Toronto TR 2004-138
1
Introduction
The main method of assessing the efficacy of hearing protective earplugs and earmuffs is the measurement of real-ear attenuation at threshold in human observers or REAT (Berger, 2000). Using this method sound attenuation is calculated by taking the difference in hearing threshold with and without the protectors fitted, at a wide range of frequencies (CSA, 2002). The greater the difference (relative elevation in hearing threshold), the greater the sound attenuation achieved with the device. It has been shown that REAT measurements may be affected by the fit of the device (Riko and Alberti, 1982). In the case of earplugs, the attenuation achieved may be less than the manufacturers’ specifications if the plug has not been properly inserted into the ear canal, if the size of the plug is too small or too large for the individual user, if the plug becomes unseated during prolonged use or if the device is not maintained properly. In the case of muffs, the attenuation achieved may be compromised by poor sealing of the muffs with the sides of the head in the region of the ears. A poor seal may result from insufficient headband tension, deterioration of the ear cushions or the use of other safety gear in combination such as eyeglasses or respirators (Abel et al., 2002). Generally, the attenuation achieved will be greater when hearing protection devices are fitted by trained professionals or with instructions from trained professionals than by the user. Various formulae have been promulgated to de-rate manufacturers’ specifications to provide a closer approximation to real-world values (Berger, 2000).
The potential for measurement error due to subject variables may be avoided by using an acoustic test fixture (ATF) that models the human head and ear. Potential drawbacks are (1) the ATF may provide a poor model of one or more of the human peripheral auditory pathways (Berger, 2000), and (2) the ATF does not provide a way to assess the effect of variability in the size of the human head and ears on the sound attenuation afforded by the hearing protector (Abel et al., 1990; Abel et al, 2002). Important advantages of using an ATF are that (1) it allows for the measurement of sound reduction at supra threshold levels that are realistic of the real world, (2) it can be used in situations where the type and level of the noise (e.g., impulse noise) may be injurious to human hearing (Crabtree, 1992), and (3) sound reduction can be assessed at frequencies that are generally considered to be outside the range of adult human hearing. Typically, REAT measurements are made between 250 Hz and 8 kHz.
The binaural ATF that was used for the present investigation was developed under contract for DRDC Toronto by the Institute of Biomedical Engineering, University of Toronto. Detailed descriptions of the design, construction and validation of the original monaural version and the later binaural version currently in use have been published previously (Giguère, 1986; Kunov et al., 1988; Giguère and Kunov 1989; Kunov and Giguère, 1989; Crabtree, 1992). The binaural ATF comprises a modified Knowles Electronics Manikin for Acoustic Research (KEMAR). The head, proportioned to model the average Caucasian male head, is cast from aluminum-filled epoxy, covered with artificial skin and incorporates a mechanical reproduction of human aural tissues (Kunov et al., 1988; Kunov and Giguère, 1989). It is supported by a compliant neck which is attached to a standard KEMAR torso mounted on an adjustable stand. The compliant neck models the natural decoupling between the human neck and torso. Isolation from external vibration is a by-product of this model. The head simulator is separable into two symmetrical halves along the mid sagittal plane. The
DRDC Toronto TR 2004-138
2
inside is hollow in order to accommodate microphones and preamplifier cables (see Figures 1 and 2). Cavities milled out on either side allow for the insertion of the ear modules. The ear canal is terminated by a Zwislocki (model DB 100) coupler (Burkhard and Sachs, 1975), which is threaded to accommodate an Etymotic ½ inch microphone (ER-11) or Brüel and Kjaer measurement microphone (model 4134). The assembly models the acoustical impedance of the human ear. Previous validation studies have examined the effects of various parameters of the ATF including the use of artificial circumaural and intraaural skin and change in head configuration (Giguère and Kunov, 1989). These resulted in recommendations for improvements in the design which are incorporated in the version under current review.
The intent of the present investigation was to carry out further validation studies of the DRDC Toronto ATF. An experiment was designed to assess the effect on insertion loss (IL) from a conventional hearing protective earplug and earmuff of (1) two possible settings of the Etymotic microphone used to measure sound level, namely flat frequency response and diffuse-field equalization, and (2) repeated measurements conducted within the same session and four months apart. Insertion loss (IL) values were obtained at a wide range of frequencies for a standard earmuff and earplug. IL and REAT measurements may be compared. With REAT measurements in human subjects, the difference in sound level needed for threshold perception with and without a protector in place is assessed. The better the protector, the greater the shift towards higher thresholds. When using an ATF, sound level measurements are made at the termination of the artificial ear canal. The better the protector, the lower the level reaching the measurement microphone.
DRDC Toronto TR 2004-138
3
Methods and materials
Experimental design
The experiment was conducted in the Noise Simulation Laboratory located at DRDC Toronto. This facility is a semi-reverberant chamber, 10.55 metres (L) by 6.10 metres (W) by 3.05 metres (H). An array of speakers comprising eight Equity Sound Investment subwoofers (Model G218s), four Electrovoice Servodrive low range speakers (model Bass Tech 7) and four Electrovoice Delta Max speakers (model DMC 1152A) occupies the width of the shorter rear wall (see Figure 1). The choice of speakers allows the acoustic simulation of a wide range of Canadian Forces operational noise environments, in terms of both level and energy spectrum and in its current configuration has the capability of producing noise levels in excess of 130 dB SPL.
The ATF faced the speaker array at a distance of 4.35 metres. In selecting the position in the room, consideration was given to minimizing high-frequency fluctuations and major standing waves. The stand supporting the KEMAR torso was adjusted such that the height of the ears from the floor was 1.4 m. Cable holes in the bottom of the torso of the manikin were blocked with rubber stoppers and a 30-cm square of foam was placed inside the torso to minimize the contributions of possible indirect sound paths to the measurements.
Two hearing protectors were selected for testing, the E-A-R Classic foam earplug and E-A-R 3000 earmuff. These devices were readily available and relevant to the Canadian Forces. Pilot testing confirmed that good fits could be obtained with the ear simulator. It was recognized that the difference in temperature between the human and ATF ear canals could result in a difference in the expansion and seating of the plug. To minimize this difference, the plug was warmed under a light bulb prior to each insertion in the ear simulator.
The right ear of the ATF was tested under the following conditions: (1) unoccluded, (2) fitted with the plug, (3) fitted with the muff, and (4) fitted with the muff and plug in combination. Measurements were made at the right ear. The left ear simulator was fitted with an E-A-R plug throughout the experiment to minimize its possible contribution to the measurement. Pinnas for both ears were in place for all conditions. The muffs covered both the right and left ears. There were three replications of each condition within a single session lasting about three hours. The experiment was repeated after four months to test the stability of the measurements.
The stimulus was continuous pink noise (equal energy per octave) presented at a level of 86 dB SPL at the entrance to the ear. The noise was generated by a Brüel & Kjaer noise generator (model 1049). A series of sound level measurements were made at the ‘ear drum’ of the ATF at thirty-three third octave centre frequencies ranging from 12.5 Hz to 20 kHz under each of the four ear conditions with an Etymotic ½-inch microphone (model ER-11). Two settings of the microphone were investigated, flat frequency response and equalized flat frequency response (see Annex A). The latter mode is designed by the manufacturer for use with the DB100 Zwislocki coupler in KEMAR in situations where one wishes to reproduce the diffuse-field response of the ATF through earphones. That is, recordings made with
DRDC Toronto TR 2004-138
4
diffuse-field equalization heard on high fidelity earphones would be spectrally correct. Switching between microphone modes was accomplished through an electronic filter box located between the microphone and a Brüel and Kjaer spectrum analyzer (Model 2133). Comparison of sound level measurements made with the microphone operating in the two modes allowed a confirmation of the manufacturer’s specification.
Procedure The four ear conditions were tested in the following order in both test sessions: 1) E-A-R 3000 muff, 2) E-A-R Classic foam earplug, 3) E-A-R 3000 muff and E-A-R Classic earplug in combination, and 4) unoccluded. Each condition was replicated three times before going on to the next. Devices were refit prior to each replication with the following exception. Conditions 2 and 3 were tested as a pair. First the plug was fit and tested. The muff was then fit without removing the plug, and the two devices were tested in combination. All fits were made by the same experimenter (P.O.). Within each ear by replication condition, the set of thirty-three third-octave measurements were made in parallel using broadband noise, first with microphone in the flat frequency response mode followed by the diffuse-field equalization mode. These measurements were recorded using the Brüel and Kjaer spectrum analyzer and stored on disk.

DRDC Toronto TR 2004-138
5
Results The mean sound level measurements, in dB SPL, are shown in Tables 1-4 for the thirty-three third octave bands tested, averaged over the three replications for each of the four ear conditions. Data are presented separately for the two settings of the measurement microphone (diffuse-field equalization and flat frequency response) and the two tests (Test 1 and Test 2) that were conducted four months apart. As indicated by the standard deviations (for the most part less than 2 dB), there was virtually no change in the measurements conducted during each test. Figures 3 and 4 show the sound level measurements, dB SPL, plotted as a function of frequency for each of the four ear conditions, for the two microphone settings, respectively. The data have been averaged across the two tests, as well as the three replications within test. A repeated measures analysis of variance (ANOVA, Daniel, 1983) applied to these data indicated that there were significant main effects of ear condition, microphone setting, and stimulus frequency (p<0.0001), as well as a number of significant interactions including frequency by test, ear condition by microphone setting, ear condition by frequency, microphone setting by frequency, ear condition by frequency by test, ear by microphone setting by frequency and ear by microphone setting by frequency by test (p<0.01 or better). Averaged across frequencies and microphone settings, sound levels were highest in the unoccluded condition (82.9 dB SPL), followed by the muff (56.9 dB SPL), plug (45.3 dB SPL) and muff and plug in combination (37.7 dB SPL). The difference in the sound level measurements due to the test date was generally no greater than 6 dB for any of the eight combinations of ear condition and microphone setting. Exceptions in the order of 7-10 dB were noted at 12.5 Hz for the muff, plug, and muff and plug conditions, at 100 Hz for the muff and plug condition, and at 8 kHz, 12.5 kHz, 16 kHz and 20 kHz for the muff condition. Averaged across tests and frequencies, sound level measurements were 4 dB less with the diffuse-field equalization compared with the flat frequency response setting of the microphone for each of the four ear conditions. Averaged across tests and ear conditions, the difference was no greater than 1 dB below 500 Hz. It increased monotonically from 2-15 dB from 500 Hz to 2.5 kHz and then decreased monotonically from 11-4 dB from 4 kHz-20 kHz. The results for the two microphone settings are compared for each ear condition in Figure 5. It can be seen that the configurations of the functions relating sound pressure level and frequency were highly similar. Ambient noise levels for one-third octave bands from 12.5 Hz to 20 kHz measured with microphone in each of the two modes are given for reference in Annex B. Except for five frequency bands in the range of 31.5 Hz to 80 Hz, these were less than 20 dB SPL for both the unoccluded and protected conditions. At all but 63 Hz, ambient levels were at least 15 dB below the sound pressure level measurements made for the stimulus. Mean insertion loss measurements are shown in Tables 5-8 for the thirty-three third octave bands tested, averaged over the three replications, for each of the four ear conditions. Insertion loss values were obtained by taking the difference between unoccluded and protected sound levels. As in the case of the sound level measurements, data are presented separately for the two settings of the measurement microphone (diffuse-field equalization and flat frequency response) and the two tests (Test 1 and Test 2). A repeated measures ANOVA

DRDC Toronto TR 2004-138
6
applied to these data showed statistically significant main effects of test (p<0.05), ear condition (p<0.0001), and frequency (p<0.0001) and a number of significant interactions including frequency by test, ear condition by microphone setting, ear condition by frequency, microphone setting by frequency, ear condition by frequency by test, ear condition by microphone setting by frequency, and ear condition by microphone setting by frequency by test (p<0.02 or better). Averaged across ear conditions, microphone settings and frequencies, the difference due to test was 2 dB. For the ninety-nine combinations of ear condition and frequency, differences in insertion loss measured during the two tests were no greater than 5 dB, exception in nine instances (two in the muff condition, two in the plug condition, and five in the muff and plug condition), in which they ranged from 6-9 dB. These outliers were observed in the frequency regions below 500 Hz and above 6.3 kHz. Figure 6 shows a comparison of insertion loss values as a function of frequency, for the two microphone settings, separately for each of the three protector conditions. The data have been averaged across tests. As can be seen, there was virtually no difference due to the microphone setting. A comparison of the insertion loss observed for the muff, plug, and muff and plug in combination, averaged across microphone settings, is presented in Figure 7. For the muff, insertion loss was fairly constant at 12 dB from 12.5 Hz to 125 Hz, increased from 14.4 dB at 160 Hz to 38.5 dB at 630 Hz, and then remained fairly constant at 35 dB from 800 Hz to 20 kHz. In contrast, for the plug insertion loss increased monotonically from 6.1 dB at 12.5 Hz to 52.7 dB at 630 Hz, remained constant at 51.5 dB up to 2.5 kHz, increased to 58.5 dB at 8 kHz, and then decreased to 43.5 dB at 20 kHz. With the muff and plug in combination, insertion loss increased monotonically from 11.28 dB at 12.5 Hz to 61.83 dB SPL at 400 Hz and then remained at approximately 57.17 dB up to 20 kHz. For all intents and purposes, it appears that, regardless of the protector condition, there was little change in insertion loss beyond 630 Hz. Below this frequency, the muff and plug in combination provided as much as 20 dB more sound reduction than the muff alone and as much as 15 dB more sound reduction than the plug alone. At higher frequencies, the outcomes for the muff and plug in combination were highly similar to those observed for the plug alone. For either of these conditions, sound reduction was about 20 dB greater than that observed for the muff.
DRDC Toronto TR 2004-138
7
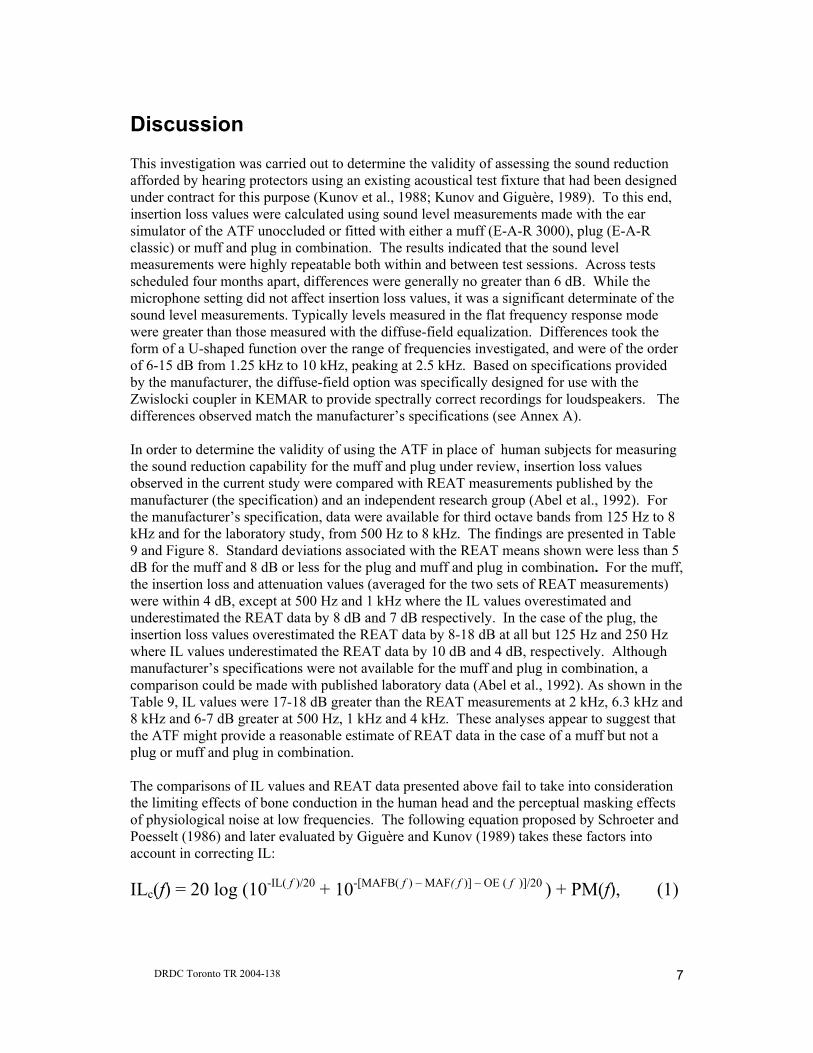
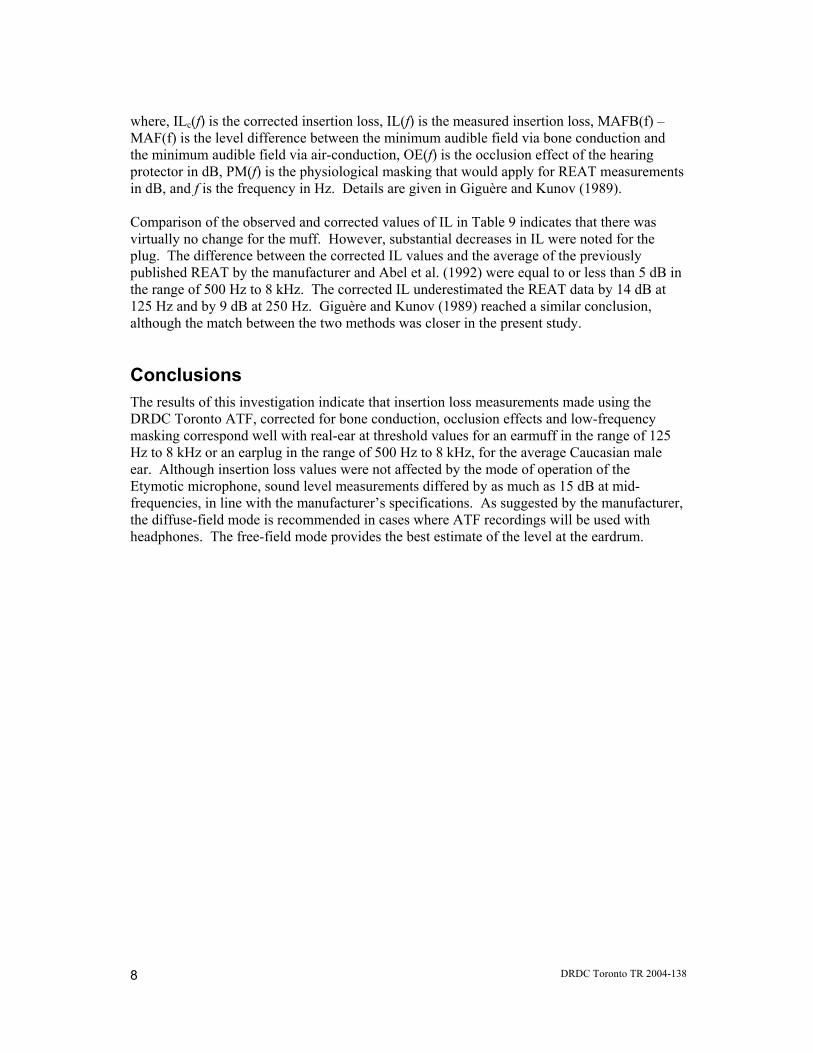
Discussion This investigation was carried out to determine the validity of assessing the sound reduction afforded by hearing protectors using an existing acoustical test fixture that had been designed under contract for this purpose (Kunov et al., 1988; Kunov and Giguère, 1989). To this end, insertion loss values were calculated using sound level measurements made with the ear simulator of the ATF unoccluded or fitted with either a muff (E-A-R 3000), plug (E-A-R classic) or muff and plug in combination. The results indicated that the sound level measurements were highly repeatable both within and between test sessions. Across tests scheduled four months apart, differences were generally no greater than 6 dB. While the microphone setting did not affect insertion loss values, it was a significant determinate of the sound level measurements. Typically levels measured in the flat frequency response mode were greater than those measured with the diffuse-field equalization. Differences took the form of a U-shaped function over the range of frequencies investigated, and were of the order of 6-15 dB from 1.25 kHz to 10 kHz, peaking at 2.5 kHz. Based on specifications provided by the manufacturer, the diffuse-field option was specifically designed for use with the Zwislocki coupler in KEMAR to provide spectrally correct recordings for loudspeakers. The differences observed match the manufacturer’s specifications (see Annex A). In order to determine the validity of using the ATF in place of human subjects for measuring the sound reduction capability for the muff and plug under review, insertion loss values observed in the current study were compared with REAT measurements published by the manufacturer (the specification) and an independent research group (Abel et al., 1992). For the manufacturer’s specification, data were available for third octave bands from 125 Hz to 8 kHz and for the laboratory study, from 500 Hz to 8 kHz. The findings are presented in Table 9 and Figure 8. Standard deviations associated with the REAT means shown were less than 5 dB for the muff and 8 dB or less for the plug and muff and plug in combination. For the muff, the insertion loss and attenuation values (averaged for the two sets of REAT measurements) were within 4 dB, except at 500 Hz and 1 kHz where the IL values overestimated and underestimated the REAT data by 8 dB and 7 dB respectively. In the case of the plug, the insertion loss values overestimated the REAT data by 8-18 dB at all but 125 Hz and 250 Hz where IL values underestimated the REAT data by 10 dB and 4 dB, respectively. Although manufacturer’s specifications were not available for the muff and plug in combination, a comparison could be made with published laboratory data (Abel et al., 1992). As shown in the Table 9, IL values were 17-18 dB greater than the REAT measurements at 2 kHz, 6.3 kHz and 8 kHz and 6-7 dB greater at 500 Hz, 1 kHz and 4 kHz. These analyses appear to suggest that the ATF might provide a reasonable estimate of REAT data in the case of a muff but not a plug or muff and plug in combination. The comparisons of IL values and REAT data presented above fail to take into consideration the limiting effects of bone conduction in the human head and the perceptual masking effects of physiological noise at low frequencies. The following equation proposed by Schroeter and Poesselt (1986) and later evaluated by Giguère and Kunov (1989) takes these factors into account in correcting IL: ILc(f) = 20 log (10-IL( f )/20 + 10-[MAFB( f ) – MAF( f )] – OE ( f )]/20 ) + PM(f), (1)
DRDC Toronto TR 2004-138
8
where, ILc(f) is the corrected insertion loss, IL(f) is the measured insertion loss, MAFB(f) – MAF(f) is the level difference between the minimum audible field via bone conduction and the minimum audible field via air-conduction, OE(f) is the occlusion effect of the hearing protector in dB, PM(f) is the physiological masking that would apply for REAT measurements in dB, and f is the frequency in Hz. Details are given in Giguère and Kunov (1989). Comparison of the observed and corrected values of IL in Table 9 indicates that there was virtually no change for the muff. However, substantial decreases in IL were noted for the plug. The difference between the corrected IL values and the average of the previously published REAT by the manufacturer and Abel et al. (1992) were equal to or less than 5 dB in the range of 500 Hz to 8 kHz. The corrected IL underestimated the REAT data by 14 dB at 125 Hz and by 9 dB at 250 Hz. Giguère and Kunov (1989) reached a similar conclusion, although the match between the two methods was closer in the present study.
Conclusions The results of this investigation indicate that insertion loss measurements made using the DRDC Toronto ATF, corrected for bone conduction, occlusion effects and low-frequency masking correspond well with real-ear at threshold values for an earmuff in the range of 125 Hz to 8 kHz or an earplug in the range of 500 Hz to 8 kHz, for the average Caucasian male ear. Although insertion loss values were not affected by the mode of operation of the Etymotic microphone, sound level measurements differed by as much as 15 dB at mid-frequencies, in line with the manufacturer’s specifications. As suggested by the manufacturer, the diffuse-field mode is recommended in cases where ATF recordings will be used with headphones. The free-field mode provides the best estimate of the level at the eardrum.

DRDC Toronto TR 2004-138 9
References Abel, S.M. and Armstrong, N.M. (1992). “The combined sound attenuation of earplugs and earmuffs.” Appl. Acoust. 36, 19-30. Abel, S.M., Rockley, T., Goldfarb, D. and Hawke, M. (1990). "External ear canal shape and its relation to the effectiveness of sound attenuating earplugs." J. Otolaryngol. 19(2), 91-95. Abel, S.M., Sass-Kortsak, A. and Kielar, A. (2002). “The effect on earmuff attenuation of other safety gear worn in combination.” Noise & Health 5, 1-13. Berger, E.H. (2000). “Hearing protection devices,” in Royster, L.H., Royster, D.P., Driscall, D.P. and Layne, M., eds. The Noise Manuel, 5th ed., American Industrial Hygiene Assoc., Fairfax, VA., pp. 379-454. Burkhard, M.D. and Sachs, R.M. (1975). “Anthropmetric manikin for acoustic research.” J. Acoust. Soc. Am. 58(1), 214-222. Crabtree, R.B. (1992). “Application of an acoustic manikin to the study of continuous and impulsive noise exposure.” Proceedings of Inter-noise 92, Toronto, ON, July 20-22, 1992. CSA Z94.2-02 (2002). “Hearing protection devices – performance, selection, care, and use.” Canadian Standards Association, Rexdale, ON. Daniel, W.W. (1983). Biostatistics: A Foundation for Analysis in the Health Sciences, 3rd ed. New York, Wiley. Giguère, C. (1986). “An acousto-mechanical model of the hearing system with applications for hearing protection.” Unpublished MA.Sc. thesis, Depts. of Electrical and Biomedical Engineering, University of Toronto. Giguère, C. and Kunov, H. (1989). “An acoustic head simulator for hearing protector evaluation. II. Measurements in steady-state and impulse noise environments.” J. Acoust. Soc. Am. 85(3), 1197-1205. Kunov, H. and Giguère, H. (1989). “An acoustic head simulator for hearing protector evaluation. I. Design and construction.” J. Acoust. Soc. Am. 85(3), 1191-1196. Kunov, H., Racansky, D. and Ing, A. (1988). “Simulated intra-aural skin for an artificial ear.” Contract Report No. W7711-6-9280/01-SE, DCIEM, Toronto, Canada Riko, K. and Alberti, P.W. (1982). “How ear protectors fail: A practical guide,” in Personal Hearing Protection in Industry, edited by P.W. Alberti (Raven, New York), pp. 323-338.

DRDC Toronto TR 2004-138
10
This page intentionally left blank.

DRDC Toronto TR 2004-138 11
Figures
DRDC Toronto TR 2004-138
12
Figure 1 The DRDC Toronto head simulator and speaker array.
DRDC Toronto TR 2004-138
13
Figure 2 The DRDC Toronto head simulator. View of the instrumented interior.

DRDC Toronto TR 2004-138 14
Figure 3Sound level measurements obtained using the ATF (right ear), and
Etymotic ER-11 1/2 inch microphone in the diffuse-field equalization mode. Results are presented for the four ear conditions, averaged across Tests 1 and 2.
0
10
20
30
40
50
60
70
80
90
100
110
120
12.5 16 20 25 31.5 40 50 63 80 100
125
160
200
250
315
400
500
630
800
1000
1250
1600
2000
2500
3150
4000
5000
6300
8000
1000
012
500
1600
020
000
Frequency (Hz)
Soun
d Pr
essu
re L
evel
(dB
SPL
)
Unoccluded
E-A-R 3000 Muff
E-A-R Classic Plug
E-A-R 3000 Muff & E-A-R Classic Plug
DRDC Toronto TR 2004-138 15
Figure 4Sound level measurements obtained using the ATF (right ear), and
Etymotic ER-11 1/2 inch microphone in the flat frequency mode. Results are presented for the four ear conditions, averaged across Tests 1 and 2.
0
10
20
30
40
50
60
70
80
90
100
110
120
12.5 16 20 25 31.5 40 50 63 80 100
125
160
200
250
315
400
500
630
800
1000
1250
1600
2000
2500
3150
4000
5000
6300
8000
1000
012
500
1600
020
000
Frequency (Hz)
Soun
d Pr
essu
re L
evel
(dB
SPL
)
Unoccluded
E-A-R 3000 Muff
E-A-R Classic Plug
E-A-R 3000 Muff & E-A-R Classic Plug
DRDC Toronto TR 2004-138 16
Figure 5 A comparison of sound level measurements obtained with the Etymotic
ER-11 microphone in the diffuse-field equalization and flat frequency response modes, averaged across the two tests. Results are presented separately for the four ear conditions.
Soun
d Pr
essu
re L
evel
(dB
SPL
)
Frequency (Hz)
0102030405060708090
100110120
16 25 40 63100 160 250 400 630
10001600
25004000
630010000
16000
Diffuse-Field
Flat Frequency
E-A-R 3000 Muff
0102030405060708090
100110120
16 25 40 63 100
160
250
400
630
1000
1600
2500
4000
6300
1000
016
000
Diffuse-Field
Flat Frequency
Unoccluded
DRDC Toronto TR 2004-138
17
Figure 5 (cont’d)
Soun
d Pr
essu
re L
evel
(dB
SPL
)
Frequency (Hz)
0102030405060708090
100110120
16 25 40 63 100
160
250
400
630
1000
1600
2500
4000
6300
1000
016
000
Diffuse-Field
Flat Frequency
E-A-R Classic Plug
0102030405060708090
100110120
16 25 40 63 100
160
250
400
630
1000
1600
2500
4000
6300
1000
016
000
Diffuse-Field
Flat Frequency
E-A-R 3000 Plug & E-A-R Classic Plug

DRDC Toronto TR 2004-138
18
Figure 6 A comparison of insertion loss values obtained with the Etymotic
ER-11 microphone in the diffuse-field equalization and flat frequency response modes, averaged across the two tests.
Results are presented separately for the three protector conditions.
Inse
rtio
n Lo
ss (d
B)
Frequency (Hz)
0
10
20
30
40
50
60
70
80
16 25 40 63 100
160
250
400
630
1000
1600
2500
4000
6300
1000
016
000
Difuse-Field
Flat Frequency
E-A-R 3000 Muff
0
10
20
30
40
50
60
70
80
16 25 40 63 100
160
250
400
630
1000
1600
2500
4000
6300
1000
016
000
Difuse-Field
Flat Frequency
E-A-R Classic Plug
DRDC Toronto TR 2004-138
19
Figure 6 (cont’d)
Inse
rtio
n Lo
ss (d
B)
Frequency (Hz)
0
10
20
30
40
50
60
70
80
16 25 40 63 100
160
250
400
630
1000
1600
2500
4000
6300
1000
016
000
Difuse-Field
Flat Frequency
E-A-R 3000 Muff & E-A-R Classic
DRDC Toronto TR 2004-138 20
Figure 7Insertion loss values obtained with the E-A-R 3000 muff, E-A-R Classic foam plug
and muff and plug in combination. Results have been averaged across tests and microphone modes.
-10
0
10
20
30
40
50
60
70
80
12.5 16 20 25 31.5 40 50 63 80 100
125
160
200
250
315
400
500
630
800
1000
1250
1600
2000
2500
3150
4000
5000
6300
8000
1000
012
500
1600
020
000
Frequency (Hz)
Inse
rtio
n Lo
ss (d
B)
E-A-R 3000 Muff
E-A-R Classic Plug
E-A-R 3000 Muff & E-A-R Classic Plug

DRDC Toronto TR 2004-138 21
Figure 8 A comparison of mean insertion loss values obtained with the ATF and REAT data published by the manufacturer and an independent research laboratory.
Results are presented for the E-A-R 3000 muff and E-A-R Classic plug.
Inse
rtio
n Lo
ss (d
B)
Frequency (Hz)
0
10
20
30
40
50
60
70
125
250
500
1000
2000
3150
4000
6300
8000
Current Study
Manufacturer's Spec
Abel et al 1992
E-A-R 3000 Muff
0
10
20
30
40
50
60
70
125
250
500
1000
2000
3150
4000
6300
8000
E-A-R Classic Foam Plug

DRDC Toronto TR 2004-138
22
This page intentionally left blank.

DRDC Toronto TR 2004-138
23
Tables

DRDC Toronto TR 2004-138 24
Table 1
Sound level measurements (dB SPL) obtained using the ATF (right ear*),unoccluded and fitted with the E-A-R 3000 muff, E-A-R Classic foam plug
and muff and plug in combination, andEtymotic ER-11 microphone in the diffuse-field equalization mode.
Test 1
Unoccluded Muff Plug Muff & PlugFreq (Hz)
12.5 48.9 (0.4)** 33.7 (0.7) 41.8 (1.5) 36.2 (2.0)16 64.3 (0.3) 49.3 (1.0) 57.5 (1.7) 51.5 (1.8)20 49.8 (0.3) 35.4 (0.6) 40.3 (1.8) 34.4 (1.5)25 68.5 (0.8) 54.4 (0.5) 56.3 (2.1) 49.5 (1.1)
31.5 75.4 (0.4) 61.2 (0.8) 62.0 (2.1) 54.4 (1.2)40 82.2 (0.2) 69.0 (0.3) 65.2 (2.6) 57.8 (0.5)50 80.4 (0.1) 67.1 (0.4) 61.6 (2.8) 55.3 (0.5)63 83.1 (0.5) 72.7 (0.7) 60.6 (3.2) 56.1 (1.3)80 85.3 (0.2) 77.2 (0.2) 59.5 (4.4) 50.6 (4.3)
100 88.9 (0.3) 79.9 (0.4) 62.7 (4.1) 54.1 (5.6)125 83.8 (0.0) 70.8 (0.9) 55.1 (4.0) 43.2 (7.2)160 85.5 (0.1) 69.8 (0.2) 53.4 (4.0) 40.7 (5.0)200 84.8 (0.1) 63.6 (0.3) 49.8 (4.1) 31.9 (3.2)250 84.9 (0.2) 58.0 (0.4) 45.8 (3.8) 25.3 (1.8)315 85.2 (0.1) 53.8 (0.5) 42.4 (3.6) 23.7 (1.1)400 88.2 (0.1) 49.7 (0.5) 40.1 (3.4) 22.8 (1.3)500 87.4 (0.1) 49.0 (0.9) 36.4 (2.2) 26.2 (0.5)630 88.3 (0.2) 51.2 (0.8) 33.1 (2.3) 30.5 (0.6)800 87.8 (0.1) 51.0 (0.7) 33.8 (1.4) 31.8 (0.4)
1000 88.1 (0.1) 57.5 (0.6) 38.4 (0.4) 36.1 (0.6)1250 90.4 (0.1) 58.4 (0.7) 37.7 (0.4) 36.8 (0.4)1600 93.1 (0.1) 59.5 (0.6) 39.3 (0.5) 37.3 (0.1)2000 92.6 (0.1) 56.2 (0.9) 40.8 (0.5) 37.4 (0.2)2500 82.7 (0.1) 47.5 (0.8) 34.2 (0.4) 33.5 (0.3)3150 80.5 (0.1) 45.4 (0.2) 27.7 (0.5) 27.4 (0.2)4000 84.9 (0.0) 47.2 (0.3) 28.8 (0.1) 28.6 (0.2)5000 90.2 (0.1) 51.8 (0.5) 30.5 (1.0) 27.6 (0.1)6300 86.1 (0.0) 51.5 (0.4) 25.4 (1.6) 21.9 (0.2)8000 86.5 (0.1) 52.9 (0.5) 24.1 (1.8) 19.8 (0.3)
10000 73.7 (0.1) 39.0 (0.5) 23.1 (1.5) 16.2 (0.1)12500 85.1 (0.1) 51.2 (1.7) 33.7 (1.3) 16.2 (0.2)16000 79.5 (0.1) 44.6 (1.6) 28.5 (1.4) 15.8 (0.3)20000 66.5 (0.1) 37.8 (4.0) 22.0 (1.7) 19.6 (1.0)
* Left ear blocked using the E-A-R Classic plug** Mean (SD), N = 3

DRDC Toronto TR 2004-138
25
Table 2
Sound level measurements (dB SPL) obtained using the ATF (right ear*),unoccluded and fitted with the E-A-R 3000 muff, E-A-R Classic foam plug
and muff and plug in combination, andEtymotic ER-11 microphone in the flat frequency response mode.
Test 1
Unoccluded Muff Plug Muff & PlugFreq (Hz)
12.5 48.7 (0.7)** 34.1 (0.8) 42.0 (0.9) 35.9 (1.6)16 63.7 (0.8) 49.3 (0.3) 57.2 (1.8) 50.5 (1.6)20 49.8 (0.2) 35.9 (0.4) 40.7 (1.2) 34.1 (1.7)25 68.7 (0.2) 54.9 (0.5) 56.7 (1.5) 49.7 (1.4)
31.5 75.7 (0.2) 61.7 (0.6) 62.2 (1.7) 54.5 (1.1)40 81.9 (0.1) 69.4 (0.8) 65.8 (2.0) 58.5 (0.6)50 80.6 (0.3) 67.4 (0.3) 62.1 (2.4) 55.9 (0.7)63 83.3 (0.2) 72.8 (0.6) 61.6 (2.9) 56.4 (0.9)80 85.3 (0.1) 77.4 (0.2) 61.1 (3.5) 50.7 (4.5)
100 89.2 (0.2) 80.2 (0.2) 64.2 (3.2) 54.6 (6.0)125 84.0 (0.1) 70.4 (1.0) 56.5 (3.3) 43.7 (7.3)160 85.5 (0.1) 69.8 (0.2) 54.9 (3.5) 41.1 (4.9)200 85.1 (0.1) 63.6 (0.2) 51.6 (3.3) 32.4 (3.1)250 85.2 (0.0) 58.4 (0.2) 47.9 (3.2) 26.0 (2.1)315 85.8 (0.0) 54.3 (0.5) 44.9 (3.3) 24.2 (0.9)400 89.0 (0.1) 50.4 (0.4) 43.3 (3.1) 23.7 (1.4)500 88.6 (0.1) 50.2 (1.0) 39.9 (2.6) 27.5 (0.4)630 90.4 (0.1) 53.3 (0.8) 36.9 (2.8) 32.5 (0.6)800 90.5 (0.1) 53.9 (0.8) 37.7 (1.9) 34.8 (0.4)
1000 92.6 (0.1) 62.2 (0.6) 43.3 (0.4) 40.8 (0.4)1250 96.7 (0.1) 64.3 (0.6) 44.0 (0.6) 42.8 (0.3)1600 102.3 (0.0) 68.7 (0.6) 48.9 (0.4) 46.6 (0.2)2000 104.3 (0.1) 67.7 (0.9) 52.6 (0.3) 49.2 (0.3)2500 97.6 (0.0) 62.4 (0.8) 48.8 (0.4) 48.2 (0.4)3150 94.9 (0.1) 59.5 (0.2) 41.9 (0.4) 41.7 (0.2)4000 95.8 (0.0) 58.3 (0.3) 40.0 (0.2) 39.8 (0.2)5000 99.1 (0.0) 60.8 (0.3) 40.3 (1.1) 36.7 (0.2)6300 93.8 (0.1) 58.9 (0.4) 33.2 (1.9) 29.2 (0.2)8000 92.8 (0.0) 59.1 (0.4) 30.7 (2.0) 25.8 (0.3)
10000 79.5 (0.1) 44.6 (0.6) 29.0 (1.9) 21.3 (0.1)12500 90.1 (0.1) 55.9 (1.7) 39.4 (1.5) 20.7 (0.2)16000 84.3 (0.0) 49.3 (1.5) 34.1 (1.6) 20.0 (0.3)20000 71.0 (0.1) 42.4 (3.4) 26.2 (1.8) 23.8 (1.1)
* Left ear blocked using the E-A-R Classic plug** Mean (SD), N = 3
DRDC Toronto TR 2004-138
26
Table 3
Sound level measurements (dB SPL) obtained using the ATF (right ear*),unoccluded and fitted with the E-A-R 3000 muff, E-A-R Classic foam plug
and muff and plug in combination, andEtymotic ER-11 microphone in the diffuse-field equalization mode.
Test 2
Unoccluded Muff Plug Muff & PlugFreq (Hz)
12.5 54.3 (0.5)** 43.5 (6.4) 49.1 (0.1) 44.5 (1.6)16 66.6 (0.7) 55.0 (5.9) 60.6 (0.8) 56.9 (1.9)20 50.4 (0.6) 39.1 (5.2) 42.7 (0.5) 37.5 (1.7)25 66.2 (0.1) 54.1 (4.9) 55.2 (0.2) 48.6 (1.3)
31.5 75.2 (0.1) 62.5 (4.8) 62.8 (0.5) 55.0 (1.4)40 81.7 (0.4) 68.2 (3.1) 66.8 (0.8) 58.8 (0.8)50 81.9 (0.2) 68.3 (2.4) 64.6 (0.4) 58.9 (0.8)63 84.5 (0.1) 71.8 (0.6) 64.9 (0.8) 59.8 (1.6)80 86.7 (0.2) 76.4 (1.0) 64.9 (0.6) 55.1 (3.0)
100 88.4 (0.4) 81.5 (0.9) 65.9 (1.3) 61.2 (4.1)125 84.1 (0.3) 73.0 (0.4) 58.5 (1.8) 46.3 (2.5)160 84.6 (0.1) 71.6 (0.2) 55.3 (2.1) 43.1 (3.8)200 84.1 (0.2) 64.1 (1.7) 50.8 (2.5) 34.0 (3.8)250 82.6 (0.2) 58.1 (2.2) 46.1 (3.4) 31.1 (3.5)315 83.6 (0.0) 54.6 (2.2) 44.7 (4.3) 27.2 (2.5)400 85.5 (0.1) 51.2 (1.5) 42.8 (5.2) 27.3 (2.9)500 86.5 (0.0) 49.9 (3.2) 40.8 (4.8) 30.7 (2.4)630 87.4 (0.2) 47.3 (3.0) 35.7 (5.7) 27.3 (0.8)800 88.4 (0.1) 50.2 (4.4) 36.9 (4.4) 31.5 (0.2)
1000 89.1 (0.0) 57.7 (3.6) 39.2 (2.1) 36.0 (0.3)1250 90.7 (0.1) 60.3 (4.0) 38.8 (1.6) 36.6 (0.5)1600 93.1 (0.0) 61.4 (3.7) 39.6 (1.8) 36.5 (0.3)2000 92.4 (0.1) 58.2 (2.1) 40.5 (2.6) 36.9 (0.7)2500 82.2 (0.1) 51.5 (3.0) 33.0 (0.8) 32.1 (1.2)3150 79.2 (0.1) 49.0 (0.8) 27.3 (0.2) 26.9 (0.1)4000 82.5 (0.1) 48.9 (2.5) 29.0 (1.4) 28.5 (0.2)5000 87.8 (0.0) 50.6 (1.8) 31.9 (2.3) 27.5 (0.3)6300 84.1 (0.1) 45.9 (1.4) 27.1 (1.9) 22.3 (0.2)8000 81.4 (0.1) 45.3 (8.8) 26.5 (1.5) 21.5 (0.3)
10000 69.9 (0.1) 36.1 (9.5) 26.2 (2.3) 21.8 (0.5)12500 82.5 (0.0) 43.5 (14.0) 35.7 (4.0) 18.2 (0.2)16000 78.5 (0.1) 36.7 (15.3) 31.6 (3.0) 19.7 (0.3)20000 66.9 (0.1) 29.2 (13.2) 25.0 (0.3) 18.9 (0.3)
* Left ear blocked using the E-A-R Classic plug** Mean (SD), N = 3
DRDC Toronto TR 2004-138
27
Table 4
Sound level measurements (dB SPL) obtained using the ATF (right ear*),unoccluded and fitted with the E-A-R 3000 muff, E-A-R Classic foam plug
and muff and plug in combination, andEtymotic ER-11 microphone in the flat frequency response mode.
Test 2
Unoccluded Muff Plug Muff & PlugFreq (Hz)
12.5 54.6 (0.4)** 43.0 (7.4) 49.2 (0.9) 44.8 (1.8)16 66.0 (0.8) 55.0 (7.5) 60.5 (1.1) 56.6 (1.8)20 50.5 (0.3) 39.4 (5.4) 42.9 (0.9) 37.4 (1.8)25 65.8 (0.3) 54.2 (5.7) 55.5 (1.0) 48.5 (1.4)
31.5 75.0 (0.1) 62.6 (5.4) 63.2 (1.1) 55.0 (1.1)40 81.6 (0.7) 68.7 (3.2) 66.4 (1.1) 59.2 (0.6)50 82.0 (0.2) 68.7 (2.5) 64.6 (0.9) 59.1 (1.0)63 84.6 (0.2) 72.6 (0.7) 65.2 (1.3) 60.0 (1.7)80 86.8 (0.2) 76.5 (1.2) 65.2 (1.1) 55.3 (2.9)
100 89.3 (0.1) 81.5 (1.0) 66.3 (1.2) 61.6 (4.2)125 84.8 (0.2) 73.1 (0.4) 58.9 (1.7) 46.5 (2.6)160 85.0 (0.1) 71.7 (0.2) 56.2 (2.0) 43.4 (3.6)200 84.6 (0.1) 64.5 (2.1) 51.8 (2.4) 34.5 (3.8)250 82.8 (0.1) 58.4 (2.5) 47.3 (3.2) 31.6 (3.5)315 84.0 (0.1) 55.2 (2.3) 46.3 (4.0) 27.5 (2.2)400 86.6 (0.1) 52.0 (1.5) 44.9 (4.7) 28.3 (2.7)500 87.8 (0.1) 51.0 (3.1) 43.1 (4.5) 32.1 (2.5)630 89.4 (0.1) 49.4 (3.2) 39.0 (5.6) 29.2 (1.0)800 91.3 (0.1) 53.1 (4.5) 40.8 (4.4) 34.4 (0.4)
1000 93.6 (0.0) 62.4 (3.6) 44.3 (2.1) 40.7 (0.2)1250 97.0 (0.1) 66.6 (4.3) 45.2 (1.8) 42.5 (0.4)1600 102.1 (0.1) 70.8 (4.0) 49.3 (2.1) 45.7 (0.4)2000 103.7 (0.1) 70.2 (2.7) 52.4 (2.6) 48.8 (0.8)2500 97.0 (0.1) 66.8 (3.6) 47.5 (0.9) 46.6 (1.2)3150 93.6 (0.0) 63.6 (0.9) 41.2 (0.3) 40.9 (0.2)4000 93.4 (0.1) 60.0 (2.6) 40.0 (1.5) 39.5 (0.2)5000 96.7 (0.0) 60.1 (2.2) 41.3 (2.5) 36.6 (0.3)6300 91.8 (0.0) 53.7 (1.4) 34.3 (2.0) 28.7 (0.2)8000 87.6 (0.1) 52.0 (9.5) 32.7 (1.9) 26.4 (0.5)
10000 75.7 (0.1) 42.2 (9.8) 31.3 (2.5) 26.6 (0.6)12500 87.3 (0.1) 49.0 (14.4) 41.0 (3.8) 22.9 (0.0)16000 83.2 (0.1) 41.8 (15.8) 36.6 (2.8) 22.5 (0.4)20000 71.5 (0.1) 33.8 (13.6) 28.6 (0.4) 23.5 (0.2)
* Left ear blocked using the E-A-R Classic plug** Mean (SD), N = 3
DRDC Toronto TR 2004-138
28
Table 5
Insertion loss values (dB) for the E-A-R 3000 muff, E-A-R Classic foam plug and muff and plug in combination,
obtained using the ATF (right ear*) and Etymotic ER-11 microphone in the diffuse-field equalization mode.
Test 1
Muff Plug Muff & PlugFreq (Hz)
12.5 15.3 (0.8)** 7.1 (1.6) 12.7 (1.6)16 15.0 (0.9) 6.8 (1.8) 12.8 (1.6)20 14.3 (0.3) 9.4 (1.9) 15.3 (1.3)25 14.1 (1.1) 12.2 (2.7) 18.9 (1.0)
31.5 14.2 (0.7) 13.5 (2.2) 21.0 (0.9)40 13.1 (0.3) 16.9 (2.6) 24.4 (0.4)50 13.3 (0.3) 18.8 (2.8) 25.1 (0.5)63 10.4 (1.2) 22.4 (3.0) 27.0 (1.3)80 8.1 (0.3) 25.7 (4.3) 34.7 (4.2)
100 9.0 (0.6) 26.2 (4.1) 34.8 (5.5)125 13.0 (0.9) 28.7 (4.0) 40.6 (7.2)160 15.6 (0.2) 32.1 (4.0) 44.7 (4.9)200 21.2 (0.4) 35.0 (4.0) 52.9 (3.1)250 26.9 (0.6) 39.1 (3.8) 59.6 (1.9)315 31.4 (0.5) 42.9 (3.7) 61.5 (1.1)400 38.6 (0.6) 48.1 (3.4) 65.4 (1.2)500 38.4 (1.0) 51.0 (2.3) 61.2 (0.4)630 37.1 (0.8) 55.2 (2.4) 57.8 (0.5)800 36.8 (0.7) 54.0 (1.3) 56.0 (0.5)
1000 30.6 (0.7) 49.7 (0.4) 52.0 (0.6)1250 32.0 (0.7) 52.7 (0.3) 53.5 (0.4)1600 33.6 (0.7) 53.8 (0.5) 55.9 (0.1)2000 36.4 (0.9) 51.9 (0.6) 55.3 (0.3)2500 35.3 (0.8) 48.5 (0.4) 49.2 (0.3)3150 35.2 (0.2) 52.8 (0.5) 53.1 (0.3)4000 37.7 (0.3) 56.1 (0.1) 56.3 (0.2)5000 38.3 (0.5) 59.7 (1.0) 62.6 (0.1)6300 34.6 (0.4) 60.7 (1.6) 64.2 (0.2)8000 33.6 (0.5) 62.3 (1.8) 66.7 (0.3)
10000 34.7 (0.5) 50.6 (1.5) 57.5 (0.1)12500 33.9 (1.6) 51.5 (1.4) 69.0 (0.3)16000 35.0 (1.6) 51.0 (1.4) 63.7 (0.3)20000 28.7 (4.0) 44.5 (1.6) 46.9 (1.0)
* Left ear blocked using the E-A-R Classic plug** Mean (SD), N = 3

DRDC Toronto TR 2004-138
29
Table 6
Insertion loss values (dB) for the E-A-R 3000 muff, E-A-R Classic foam plug and muff and plug in combination,
obtained using the ATF (right ear*) and Etymotic ER-11 microphone in the flat frequency response mode.
Test 1
Muff Plug Muff & PlugFreq (Hz)
12.5 14.5 (1.4)** 6.6 (1.4) 12.8 (2.1)16 14.4 (1.1) 6.5 (2.4) 13.2 (2.2)20 13.9 (0.5) 9.1 (1.1) 15.7 (1.8)25 13.7 (0.7) 12.0 (1.7) 19.0 (1.4)
31.5 14.1 (0.7) 13.6 (1.8) 21.3 (1.2)40 12.6 (0.7) 16.1 (1.9) 23.4 (0.6)50 13.3 (0.2) 18.6 (2.4) 24.7 (0.7)63 10.5 (0.3) 21.7 (3.2) 26.9 (1.1)80 7.9 (0.3) 24.2 (3.6) 34.6 (4.6)
100 9.0 (0.4) 25.0 (3.3) 34.6 (5.9)125 13.6 (1.0) 27.5 (3.4) 40.3 (7.3)160 15.7 (0.3) 30.7 (3.5) 44.5 (4.9)200 21.5 (0.2) 33.5 (3.3) 52.7 (3.1)250 26.8 (0.2) 37.3 (3.2) 59.2 (2.1)315 31.5 (0.5) 40.9 (3.3) 61.6 (0.9)400 38.6 (0.4) 45.8 (3.1) 65.4 (1.4)500 38.4 (1.1) 48.7 (2.7) 61.1 (0.3)630 37.1 (0.8) 53.5 (2.7) 57.9 (0.7)800 36.6 (0.8) 52.8 (1.9) 55.8 (0.5)
1000 30.4 (0.7) 49.2 (0.4) 51.7 (0.4)1250 32.4 (0.7) 52.7 (0.6) 53.9 (0.4)1600 33.6 (0.6) 53.4 (0.4) 55.7 (0.2)2000 36.5 (0.9) 51.7 (0.3) 55.1 (0.3)2500 35.2 (0.8) 48.8 (0.4) 49.4 (0.4)3150 35.4 (0.2) 53.0 (0.5) 53.3 (0.3)4000 37.5 (0.3) 55.8 (0.2) 56.0 (0.2)5000 38.3 (0.3) 58.8 (1.1) 62.4 (0.2)6300 34.9 (0.4) 60.6 (1.8) 64.6 (0.2)8000 33.7 (0.4) 62.1 (2.0) 67.0 (0.3)
10000 34.9 (0.6) 50.5 (1.9) 58.2 (0.0)12500 34.2 (1.7) 50.7 (1.5) 69.4 (0.3)16000 35.0 (1.5) 50.2 (1.6) 64.3 (0.3)20000 28.5 (3.5) 44.8 (1.7) 47.1 (1.1)
* Left ear blocked using the E-A-R Classic plug** Mean (SD), N = 3
DRDC Toronto TR 2004-138
30
Table 7
Insertion loss values (dB) for the E-A-R 3000 muff, E-A-R Classic foam plug and muff and plug in combination,
obtained using the ATF (right ear*) and Etymotic ER-11 microphone in the diffuse-field equalization mode.
Test 2
Muff Plug Muff & PlugFreq (Hz)
12.5 10.8 (6.6)** 5.2 (0.5) 9.8 (1.2)16 11.6 (6.4) 6.0 (0.8) 9.7 (1.5)20 11.3 (5.6) 7.7 (0.4) 12.9 (1.3)25 12.1 (4.9) 11.0 (0.2) 17.6 (1.3)
31.5 12.8 (4.8) 12.4 (0.5) 20.2 (1.4)40 13.5 (3.4) 14.9 (1.2) 22.9 (0.9)50 13.6 (2.4) 17.3 (0.6) 23.0 (0.8)63 12.7 (0.6) 19.6 (0.7) 24.7 (1.5)80 10.3 (1.1) 21.8 (0.4) 31.6 (2.8)
100 6.9 (1.0) 22.5 (1.7) 27.2 (4.5)125 11.1 (0.5) 25.6 (1.9) 37.8 (2.6)160 13.0 (0.2) 29.2 (2.1) 41.4 (3.8)200 20.0 (1.8) 33.3 (2.4) 50.1 (3.7)250 24.5 (2.4) 36.5 (3.4) 51.5 (3.5)315 29.0 (2.2) 38.9 (4.3) 56.4 (2.5)400 34.4 (1.4) 42.7 (5.2) 58.3 (2.9)500 36.6 (3.2) 45.7 (4.8) 55.8 (2.4)630 40.0 (3.2) 51.7 (5.6) 60.1 (0.8)800 38.3 (4.5) 51.6 (4.3) 56.9 (0.3)
1000 31.4 (3.6) 49.9 (2.1) 53.1 (0.3)1250 30.4 (3.9) 51.9 (1.6) 54.1 (0.4)1600 31.7 (3.7) 53.5 (1.8) 56.6 (0.3)2000 34.1 (2.0) 51.8 (2.6) 55.5 (0.6)2500 30.7 (2.9) 49.2 (0.8) 50.2 (1.2)3150 30.3 (0.8) 51.9 (0.2) 52.3 (0.1)4000 33.5 (2.5) 53.5 (1.3) 53.9 (0.2)5000 37.2 (1.8) 55.9 (2.3) 60.3 (0.3)6300 38.2 (1.4) 57.0 (1.9) 61.8 (0.2)8000 36.1 (8.7) 54.8 (1.5) 59.9 (0.3)
10000 33.8 (9.5) 43.7 (2.3) 48.2 (0.5)12500 39.0 (14.0) 46.8 (4.0) 64.3 (0.2)16000 41.8 (15.3) 46.9 (3.0) 58.8 (0.3)20000 37.7 (13.2) 41.9 (0.3) 48.0 (0.3)
* Left ear blocked using the E-A-R Classic plug** Mean (SD), N = 3

DRDC Toronto TR 2004-138
31
Table 8
Insertion loss values (dB) for the E-A-R 3000 muff, E-A-R Classic foam plug and muff and plug in combination,
obtained using the ATF (right ear*) and Etymotic ER-11 microphone in the flat frequency response mode.
Test 2
Muff Plug Muff & PlugFreq (Hz)
12.5 11.6 (7.7)** 5.4 (1.4) 9.8 (2.1)16 11.0 (7.3) 5.5 (1.9) 9.5 (2.7)20 11.1 (5.5) 7.6 (1.1) 13.1 (2.0)25 11.6 (5.6) 10.3 (1.1) 17.3 (1.7)
31.5 12.4 (5.3) 11.8 (1.2) 19.9 (1.1)40 12.9 (3.9) 15.2 (1.8) 22.4 (1.1)50 13.2 (2.7) 17.4 (0.9) 22.8 (0.8)63 12.0 (0.6) 19.3 (1.4) 24.5 (1.6)80 10.3 (1.3) 21.6 (1.0) 31.6 (3.0)
100 7.7 (1.0) 23.0 (1.2) 27.7 (4.3)125 11.6 (0.6) 25.9 (1.7) 38.2 (2.4)160 13.3 (0.2) 28.8 (2.0) 41.6 (3.6)200 20.1 (2.2) 32.8 (2.3) 50.1 (3.7)250 24.4 (2.5) 35.6 (3.3) 51.2 (3.5)315 28.8 (2.3) 37.7 (4.0) 56.5 (2.2)400 34.6 (1.5) 41.7 (4.7) 58.3 (2.6)500 36.8 (3.1) 44.8 (4.5) 55.8 (2.5)630 39.9 (3.2) 50.4 (5.6) 60.1 (1.1)800 38.2 (4.4) 50.5 (4.5) 56.8 (0.4)
1000 31.2 (3.6) 49.3 (2.1) 52.9 (0.2)1250 30.3 (4.3) 51.8 (1.8) 54.5 (0.4)1600 31.3 (4.0) 52.9 (2.2) 56.4 (0.4)2000 33.5 (2.8) 51.3 (2.5) 55.0 (0.8)2500 30.1 (3.6) 49.4 (0.9) 50.4 (1.2)3150 30.0 (0.9) 52.4 (0.3) 52.7 (0.2)4000 33.3 (2.5) 53.4 (1.5) 53.9 (0.3)5000 36.6 (2.2) 55.4 (2.5) 60.1 (0.3)6300 38.1 (1.4) 57.5 (2.0) 63.1 (0.2)8000 35.6 (9.5) 54.9 (1.9) 61.2 (0.6)
10000 33.5 (9.8) 44.4 (2.5) 49.1 (0.7)12500 38.4 (14.4) 46.3 (3.8) 64.4 (0.1)16000 41.4 (15.7) 46.6 (2.8) 60.6 (0.4)20000 37.8 (13.7) 42.9 (0.4) 48.1 (0.2)
* Left ear blocked using the E-A-R Classic plug** Mean (SD), N = 3
DRDC Toronto TR 2004-138
32
Table 9
Sound reduction afforded by the E-A-R 3000 muff, E-A-R Classic plugand muff and plug in combination:
Observed and corrected insertion loss values in comparison with REAT data.
Current Study Manufacturer’s Abel et al. Corrected Freq IL (dB) Specification 1992 IL (dB)(Hz) REAT (dB)
Muff
125 12.3 16.5 --- 16.0250 25.6 21.8 --- 26.4500 37.6 33.8 25.3 37.1
1000 30.9 40.4 36.0 29.82000 35.1 35.1 33.3 30.73150 32.7 36.2 33.4 31.24000 35.5 38.4 34.4 33.96300 36.4 38.3 35.6 34.58000 34.7 39.7 35.7 33.1
Plug
125 26.9 37.4 --- 22.5250 37.1 40.9 --- 31.5500 47.6 44.8 34.6 40.8
1000 49.5 43.8 35.5 37.12000 51.7 36.3 31.5 39.33000 52.5 41.9 39.3 43.64000 54.7 42.6 40.3 45.76300 59.0 46.1 43.0 46.48000 58.5 47.3 42.7 46.2
Muff & Plug
125 39.2 --- --- ---250 55.4 --- --- ---500 58.5 --- 52.3 ---
1000 52.4 --- 45.5 ---2000 55.2 --- 37.5 ---3150 52.9 --- 45.9 ---4000 55.0 --- 48.8 ---6300 63.4 --- 46.6 ---8000 63.7 --- 45.7 ---

DRDC Toronto TR 2004-138
33
Annex A
Output of the Etymotic ER-11 microphone with diffuse-field equalization and flat frequency response settings. Published specifications
DRDC Toronto TR 2004-138 34

DRDC Toronto TR 2004-138 35
Annex B
Ambient levels
DRDC Toronto TR 2004-138 36
Table B-1
Ambient measurements (dB SPL) obtained using the ATF (right ear*),unoccluded and fitted with the E-A-R 3000 muff, E-A-R Classic foam plug
and muff and plug in combination, andEtymotic ER-11 microphone in the diffuse-field equalization mode.
Unoccluded Muff Plug Muff & PlugFreq (Hz)
12.5 9.1 8.6 8.3 8.416 11.6 10.0 10.1 9.420 12.9 11.1 10.6 10.625 15.0 13.2 11.2 11.3
31.5 22.3 15.2 12.8 11.940 15.1 14.3 11.7 11.550 39.3 39.4 39.2 39.363 54.0 54.0 54.0 54.080 27.0 28.4 26.9 26.9
100 14.0 17.8 13.3 13.2125 18.1 16.5 16.1 16.4160 10.1 9.3 9.1 9.3200 10.0 10.0 9.8 10.1250 10.0 10.6 10.4 10.4315 17.8 18.1 18.0 17.9400 10.5 11.2 10.7 10.9500 14.1 14.0 14.3 14.2630 6.8 6.7 6.7 6.5800 8.6 8.1 9.4 8.9
1000 9.5 9.9 9.6 9.71250 6.7 6.9 7.0 6.91600 6.3 6.4 6.2 6.12000 4.3 4.3 4.3 4.22500 3.2 4.7 3.7 3.83150 2.4 1.8 2.2 2.24000 -1.2 -1.4 -1.1 -1.45000 -0.8 -0.8 -0.9 -1.06300 0.3 0.3 0.1 0.28000 1.4 1.4 1.3 1.410000 2.6 2.6 2.6 2.612500 3.7 3.8 3.8 3.816000 4.9 5.0 5.0 5.020000 5.6 5.6 5.5 5.6
* Left ear blocked using the E-A-R Classic plug
DRDC Toronto TR 2004-138
37
Table B-2
Ambient measurements (dB SPL) obtained using the ATF (right ear*),unoccluded and fitted with the E-A-R 3000 muff, E-A-R Classic foam plug
and muff and plug in combination, andEtymotic ER-11 microphone in the flat frequency mode.
Unoccluded Muff Plug Muff & PlugFreq (Hz)
12.5 8.3 9.0 8.2 8.316 10.8 10.0 9.6 9.420 12.1 11.5 10.9 10.225 14.4 13.2 11.0 11.3
31.5 22.1 15.2 12.8 11.340 14.4 18.8 11.7 11.650 39.3 39.5 39.3 39.363 54.0 54.0 54.0 54.080 26.9 28.4 26.9 26.9
100 14.1 18.1 13.2 13.3125 18.3 16.1 16.2 16.2160 10.0 9.6 9.0 9.3200 9.9 10.4 9.6 10.2250 10.1 10.6 10.4 10.7315 17.9 18.0 17.6 18.3400 10.9 11.7 11.0 10.6500 14.1 14.2 14.3 14.3630 7.3 7.1 7.2 7.4800 8.4 8.9 9.0 9.0
1000 9.9 10.3 10.1 10.01250 7.6 7.9 7.5 7.61600 7.0 7.5 6.9 7.32000 5.5 5.9 6.0 5.82500 5.5 6.0 5.3 4.83150 4.9 5.0 4.5 4.74000 3.8 3.8 3.7 3.85000 4.3 4.4 4.2 4.26300 5.1 5.1 4.9 4.98000 5.6 5.6 5.6 5.610000 6.3 6.3 6.3 6.312500 7.2 7.2 7.2 7.316000 8.2 8.2 8.2 8.320000 8.5 8.5 8.5 8.5
* Left ear blocked using the E-A-R Classic plug

DOCUMENT CONTROL DATA SHEET
1a. PERFORMING AGENCYDRDC Toronto
2. SECURITY CLASSIFICATION
UNCLASSIFIED−
1b. PUBLISHING AGENCYDRDC Toronto
3. TITLE
Validation of an acoustic head simulator for the evaluation of personal hearing protection devices
4. AUTHORS
Sharon M. Abel, Patricia Odell, Garry Dunn
5. DATE OF PUBLICATION
November 30 , 2004
6. NO. OF PAGES
34
7. DESCRIPTIVE NOTES
8. SPONSORING/MONITORING/CONTRACTING/TASKING AGENCYSponsoring Agency: DRDC Toronto
Monitoring Agency: DRDC Toronto
Contracting Agency :
Tasking Agency:
9. ORIGINATORSDOCUMENT NO.
Technical Report TR2004−138
10. CONTRACT GRANTAND/OR PROJECT NO.
16CB19
11. OTHER DOCUMENT NOS.
12. DOCUMENT RELEASABILITY
Unlimited distribution
13. DOCUMENT ANNOUNCEMENT
Unlimited announcement
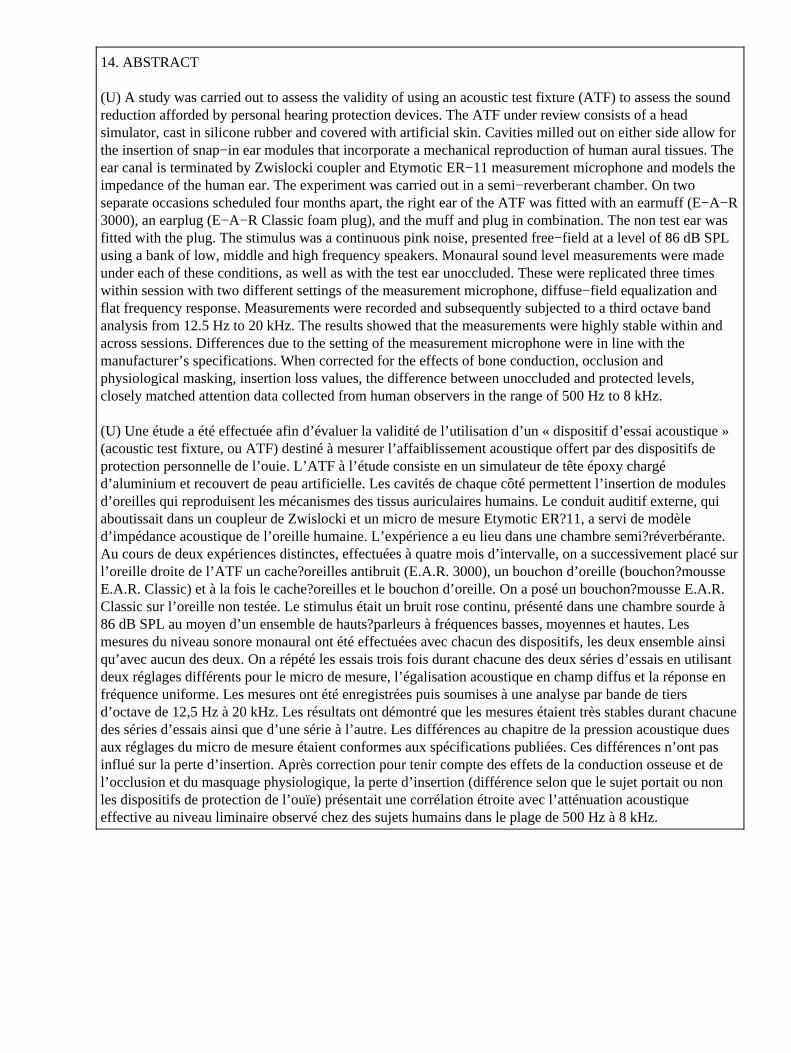
14. ABSTRACT
(U) A study was carried out to assess the validity of using an acoustic test fixture (ATF) to assess the soundreduction afforded by personal hearing protection devices. The ATF under review consists of a headsimulator, cast in silicone rubber and covered with artificial skin. Cavities milled out on either side allow forthe insertion of snap−in ear modules that incorporate a mechanical reproduction of human aural tissues. Theear canal is terminated by Zwislocki coupler and Etymotic ER−11 measurement microphone and models theimpedance of the human ear. The experiment was carried out in a semi−reverberant chamber. On twoseparate occasions scheduled four months apart, the right ear of the ATF was fitted with an earmuff (E−A−R3000), an earplug (E−A−R Classic foam plug), and the muff and plug in combination. The non test ear wasfitted with the plug. The stimulus was a continuous pink noise, presented free−field at a level of 86 dB SPLusing a bank of low, middle and high frequency speakers. Monaural sound level measurements were madeunder each of these conditions, as well as with the test ear unoccluded. These were replicated three timeswithin session with two different settings of the measurement microphone, diffuse−field equalization andflat frequency response. Measurements were recorded and subsequently subjected to a third octave bandanalysis from 12.5 Hz to 20 kHz. The results showed that the measurements were highly stable within andacross sessions. Differences due to the setting of the measurement microphone were in line with themanufacturer’s specifications. When corrected for the effects of bone conduction, occlusion andphysiological masking, insertion loss values, the difference between unoccluded and protected levels,closely matched attention data collected from human observers in the range of 500 Hz to 8 kHz.
(U) Une étude a été effectuée afin d’évaluer la validité de l’utilisation d’un « dispositif d’essai acoustique »(acoustic test fixture, ou ATF) destiné à mesurer l’affaiblissement acoustique offert par des dispositifs deprotection personnelle de l’ouie. L’ATF à l’étude consiste en un simulateur de tête époxy chargéd’aluminium et recouvert de peau artificielle. Les cavités de chaque côté permettent l’insertion de modulesd’oreilles qui reproduisent les mécanismes des tissus auriculaires humains. Le conduit auditif externe, quiaboutissait dans un coupleur de Zwislocki et un micro de mesure Etymotic ER?11, a servi de modèled’impédance acoustique de l’oreille humaine. L’expérience a eu lieu dans une chambre semi?réverbérante.Au cours de deux expériences distinctes, effectuées à quatre mois d’intervalle, on a successivement placé surl’oreille droite de l’ATF un cache?oreilles antibruit (E.A.R. 3000), un bouchon d’oreille (bouchon?mousseE.A.R. Classic) et à la fois le cache?oreilles et le bouchon d’oreille. On a posé un bouchon?mousse E.A.R.Classic sur l’oreille non testée. Le stimulus était un bruit rose continu, présenté dans une chambre sourde à86 dB SPL au moyen d’un ensemble de hauts?parleurs à fréquences basses, moyennes et hautes. Lesmesures du niveau sonore monaural ont été effectuées avec chacun des dispositifs, les deux ensemble ainsiqu’avec aucun des deux. On a répété les essais trois fois durant chacune des deux séries d’essais en utilisantdeux réglages différents pour le micro de mesure, l’égalisation acoustique en champ diffus et la réponse enfréquence uniforme. Les mesures ont été enregistrées puis soumises à une analyse par bande de tiersd’octave de 12,5 Hz à 20 kHz. Les résultats ont démontré que les mesures étaient très stables durant chacunedes séries d’essais ainsi que d’une série à l’autre. Les différences au chapitre de la pression acoustique duesaux réglages du micro de mesure étaient conformes aux spécifications publiées. Ces différences n’ont pasinflué sur la perte d’insertion. Après correction pour tenir compte des effets de la conduction osseuse et del’occlusion et du masquage physiologique, la perte d’insertion (différence selon que le sujet portait ou nonles dispositifs de protection de l’ouïe) présentait une corrélation étroite avec l’atténuation acoustiqueeffective au niveau liminaire observé chez des sujets humains dans le plage de 500 Hz à 8 kHz.

15. KEYWORDS, DESCRIPTORS or IDENTIFIERS
(U) r the contractor"Tasking/Contracting/Sponsor