Underwater Acoustic Communications: Optimizing Data · PDF fileWith Respect to Throughput...
8
Underwater Acoustic Communications: Optimizing Data Packet Size With Respect to Throughput Efficiency, BER, and Energy Efficiency Low Tang Jung 1+ and Azween Abdullah 2 1,2 Computer and Information Sciences Department, Universiti Teknologi PETRONAS, Malaysia Abstract. The authors of this paper embarked on a research to investigate the relationships between the data packet size and the three important performance metrics namely, bit error rate (BER), throughput efficiency, and energy efficiency in underwater acoustic (UWA) communications. The investigations were conducted via simulations on the ns2 simulator with its MIRACLE (Multi-InteRfAce Cross-Layer Extension library) package. Based on the results of the simulation the authors have proposed an algorithm/framework to determine the optimal packet size for UWA data transmission. Each of the three metrics are dealt with separately in the context of packet size to produce a data set or a look-up graph that can be indexed/consulted by the algorithm to compute an optimal packet size. Keywords: throughput efficiency, bit error rate, energy efficiency, optimal packet size, UWA data transmission. 1. Introduction Research in underwater acoustic (UWA) communications has always been a challenge to many researchers. Various papers on the recent advances and challenges in UWA communications and networking can be found in [1]-[6]. This paper presents the findings of the relationships between data packet size and these metrics: bit error rate (BER), throughput efficiency, and energy efficiency with other related qualifiers such as the distance between a source-sink pair, the bit rate, and the packet header length. The findings are aimed for communications between a source-sink pair only i.e. a one hop data transmission. This work was accomplished by simulation via the underwater channel model in the network simulator ns2 version 2.34, with its MIRACLE (Multi-InteRfAce Cross-Layer Extension) library package [7] due to the package modularity, code portability, re-usability, and extensibility[8]. The CSMA MAC protocol was used in our simulation works with stop-and-wait automatic request (ARQ) handshaking protocol at PHY layer implemented between any source-sink pair of nodes. The ns2 runs on Ubuntu platform. The remainder of the paper is organized as follow. Section 2 describes the simulation setup. Section 3 is the discussions on the results. Section 4 highlights the outcomes of our findings and Section 5 concludes the paper. 2. Simulation Setup 2.1. General scenario The general scenario of the underwater environment set up is shown in Fig 1. A cluster of 100 nodes is placed somewhere in the middle of a body (cuboid) of water with dimension of 2km x 2km x 200m. By placing the cluster in the middle of the cuboid is to avoid the complications of acoustic wave reflection near the water surface and the reflection near the bottom surface. A maximum depth of 200m was chosen as a + Corresponding author: Low Tang Jung. Tel.: +6053687421; Fax: +6053656180 E-mail address: [email protected] 2011 International Conference on Telecommunication Technology and Applications Proc .of CSIT vol.5 (2011) © (2011) IACSIT Press, Singapore 7
Transcript of Underwater Acoustic Communications: Optimizing Data · PDF fileWith Respect to Throughput...
Underwater Acoustic Communications: Optimizing Data Packet Size With Respect to Throughput Efficiency, BER, and Energy Efficiency
Low Tang Jung 1+ and Azween Abdullah 2 1,2 Computer and Information Sciences Department, Universiti Teknologi PETRONAS, Malaysia
Abstract. The authors of this paper embarked on a research to investigate the relationships between the data packet size and the three important performance metrics namely, bit error rate (BER), throughput efficiency, and energy efficiency in underwater acoustic (UWA) communications. The investigations were conducted via simulations on the ns2 simulator with its MIRACLE (Multi-InteRfAce Cross-Layer Extension library) package. Based on the results of the simulation the authors have proposed an algorithm/framework to determine the optimal packet size for UWA data transmission. Each of the three metrics are dealt with separately in the context of packet size to produce a data set or a look-up graph that can be indexed/consulted by the algorithm to compute an optimal packet size.
Keywords: throughput efficiency, bit error rate, energy efficiency, optimal packet size, UWA data transmission.
1. Introduction Research in underwater acoustic (UWA) communications has always been a challenge to many
researchers. Various papers on the recent advances and challenges in UWA communications and networking can be found in [1]-[6]. This paper presents the findings of the relationships between data packet size and these metrics: bit error rate (BER), throughput efficiency, and energy efficiency with other related qualifiers such as the distance between a source-sink pair, the bit rate, and the packet header length. The findings are aimed for communications between a source-sink pair only i.e. a one hop data transmission. This work was accomplished by simulation via the underwater channel model in the network simulator ns2 version 2.34, with its MIRACLE (Multi-InteRfAce Cross-Layer Extension) library package [7] due to the package modularity, code portability, re-usability, and extensibility[8]. The CSMA MAC protocol was used in our simulation works with stop-and-wait automatic request (ARQ) handshaking protocol at PHY layer implemented between any source-sink pair of nodes. The ns2 runs on Ubuntu platform.
The remainder of the paper is organized as follow. Section 2 describes the simulation setup. Section 3 is the discussions on the results. Section 4 highlights the outcomes of our findings and Section 5 concludes the paper.
2. Simulation Setup
2.1. General scenario The general scenario of the underwater environment set up is shown in Fig 1. A cluster of 100 nodes is
placed somewhere in the middle of a body (cuboid) of water with dimension of 2km x 2km x 200m. By placing the cluster in the middle of the cuboid is to avoid the complications of acoustic wave reflection near the water surface and the reflection near the bottom surface. A maximum depth of 200m was chosen as a
+ Corresponding author: Low Tang Jung. Tel.: +6053687421; Fax: +6053656180 E-mail address: [email protected]
2011 International Conference on Telecommunication Technology and Applications Proc .of CSIT vol.5 (2011) © (2011) IACSIT Press, Singapore
7

commonly packets fromThe maximare deemedvaried from
2.2. The The ess
The link is CBR packepacket flow
The tranprotocol is physical laycharacterist
For ourwhere a pacsink node vtransmittingof 100kbpsexplicitly st
3. ResulThree s
aim to verithroughput to constructimplementinsizes to BEqualified byand range-rBERs with integral part
acceptable sm other sour
mum distance d sufficient.
m a minimum
F
simulationsential commcreated for a
et flow is staw under the ns
nsmitter CBRdeployed in
yer (MPHYics.
r simulationscket size of varied from g node is set with a Drotated in the d
lts and Disets of simulify directly efficiency, at four sets ong the propo
ERs with diffy various BErate productsimplicit relat of the data
hallow waterce nodes. It i
between theThe distance
m of 10m to a
Fig. 1: The ge
n setup munication lina one hop daarted from a s2 MIRACL
Fig
R module, an the MMAC) to send th
, for the mosmore than 110m to 100to a frequenc
opTail queuedescription of
iscussionslation were cor indirectly
and the energf graph. Howosed algorithfferent headeERs. Third se. The final se
ation to energpacket size o
MPH
er depth. Somis assumed he sink and a e between thmaximum o
eneral underw
nk setup in oata packets re
source nodeLE layered fra
g. 2: The ns2 M
as an agent, gC layer for mhe data pack
st part the pa1000 bits wa00m with vacy of 8.2KHe. The basicf the various
s conducted. Ay the feasibgy efficiencywever only thm for findiner length. Seet relates pacet is on energy per usefuloptimization
CBR
MMAC
HY/BPSK/Underwa
U
mewhere at there that all ssource node
he sink and of 1km in the
ater scenario u
our simulatioelay with coe to the sinkamework is s
MIRACLE lay
generates datmedia acceskets. The un
acket size ranas necessaryarious increm
Hz with the si throughput simulations
All the simulbility to findy metrics. Ththree sets wong the optimcond set rel
cket sizes to rgy efficiencyl bit metric.
n process.
ater
Underwater Channel
MPH
the middle osource nodese is set to 1km
the various e course of th
used in the sim
on comprisednstant bit rat
k node. The shown in Fig
yered framew
ta packet of ss. BPSK monderwater ch
nged from 1. The distanc
ment steps dgnal bandwidefinition f
.
lation resultsd optimal dahe outcomes ould be used
mal packet sizates optimalthroughput ey with respecAll these set
l
CBR
MMAC
HY/BPSK/Underwa
of the clusters know the exm. Thus dimsource node
he simulation
mulation work
d of two nodete (CBR) molayers invol
g. 2.
ork.
the requiredodulation is hannel is co
0 bits to 100ce between epending onidth of 6KHzfrom [9] wa
s discuss in ata packet sof the simulad as look-upze. First set l packet sizeefficiency quct to packet ts of graphs
ater
r is a sink toxistence of th
mensions of 2es in the cluns.
k.
es i.e. a sourodule per laylved in both
d size. The Cused in the
onfigured wi
00. There wethe source n
n situations nz. The link has adopted ex
this section size based oations were c
p graphs (or of graphs re
es to range-rualified by vasize qualifie(or data sets
collect datahe sink node2km by 2kmuster will be
rce-sink pair.yer. A single
nodes for a
CSMA MACe MIRACLEith Shannon
ere situationsnode and theneeded. Theas a capacityxcept where
are with theon the BER,consolidateddata sets) in
elates packetrate productsarious BERsd by various) formed the
a e.
m e
. e a
C E n
s e e y e
e ,
d n t s s s e
8
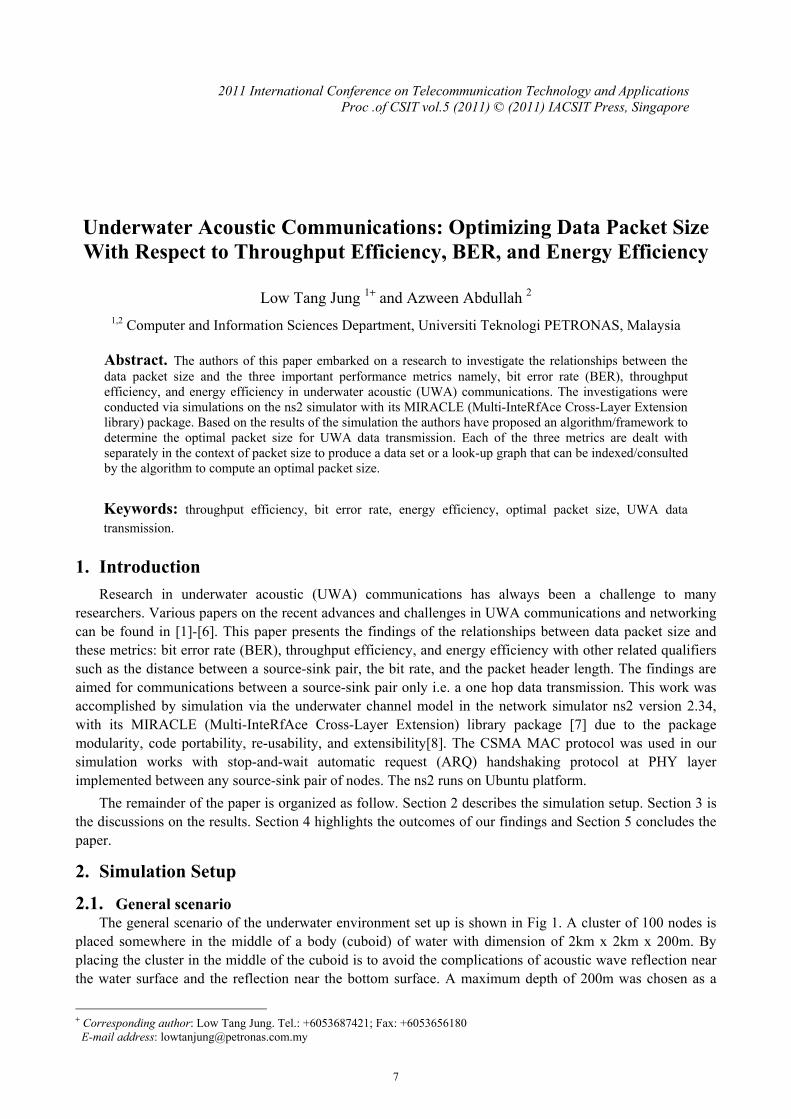
3.1. Data packet size and BER When ARQ protocol is used in the relatively high BER links the communication performance is sensitive
to the packet size. This implied that there is a need in choosing a suitable packet size based on BER. In our simulation we used the kopt equation (1) below, which was adopted from [10,11]. (1)
This equation shows that the optimal packet size kopt is the function of BER, ρ and packet header length, h. Some of the crucial parameters used in this simulation include:
Packet Size : 10 – 14,000 bits Header length : 10, 40, 160 bits Distance : 10m – 1000m
Fig. 3 shows a set of graphs relating packet size to different BERs with different header length, h. This is one of the set of graphs to be used in the proposed optimization algorithm. Do take note that a header length of 160 bits is the standard length used in the RTS data packet for stop-and-wait ARQ protocol. In the proposed algorithm this RTS packet will double its function as a test data packet for the source node to compute the quality of the link thus obtaining the BER of the link. All these graphs would be used by the proposed algorithm in finding the optimal data packet size. These graphs may be used for comparative study purpose too.
A simplified data set can be obtained from Fig. 3 or from equation (1). For example, with a header length of 40 bits, the simplified data set is obtained as in TABLE I. This simplified data set stores BERs in an incremental step of a decade. These increment steps make BER computation practically faster. For practical implementation the packet size to be composed in actual transmission can be the truncated value or a round-up value if truncation is not preferred.
Table I: Sample of a simplified data set. BER kopt Truncate 10-2 39.86605 39 10-3 178.9482 178 10-4 612.1234 612 10-5 1979.8950 1979 10-6 6304.5221 6304
Fig. 3: Data packet size plotted against different BERs.
3.2. Data packet size and throughput efficiency
14000
12000
10000
8000
6000
4000
2000
010-6 10-5 10-4 10-3 10-2 10-1
BER
Pack
et S
ize
(bits
)
h = 160 h = 40
h = 10
9
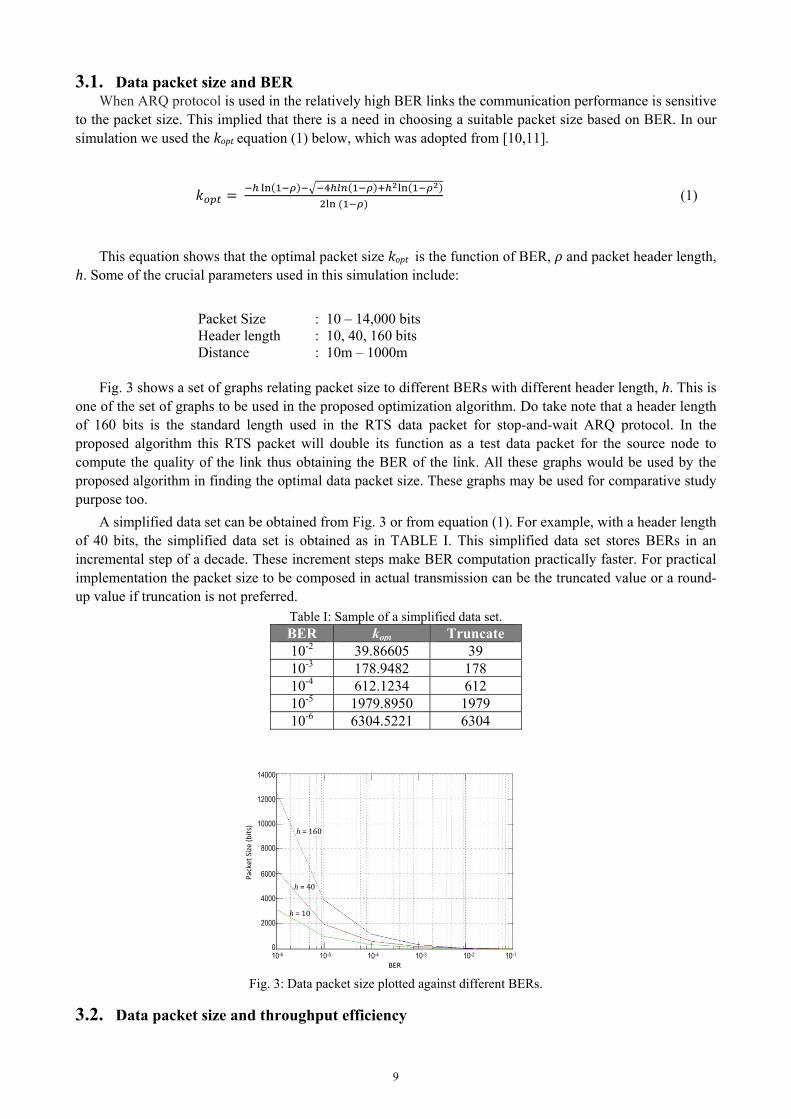
In stop-and-wait ARQ protocol, its throughput efficiency is defined as the ratio of time for a useful packet and the total time spent on the average for a successful packet transmission. The average time is taken over the number of retransmissions. With a probability of packet error given as ρ the average time needed to transmit 1 packet successfully is given by [12] as,
1 (2)
With this, the efficiency for transmitting a group of g successful packets can be expressed as, 1 (3)
where Nl is the payload length, and T is the bit duration. So, with a given a set of physical layer parameters (ρ, R, d) where ρ is the probability of packet error, R is the bit rate, and d is the distance between transmitter and the receiver, the throughput efficiency can be written in the form of, 1 (4)
where, (5)
and TW is the total waiting time in the stop-and-wait protocol, c is the nominal underwater acoustic sound speed of 1500 m/s, and h is the header length.
The optimal packet size can now be evaluated by differentiating η with respect to Nl and equate it to zero. From which the optimal packet size, kopt is given by,
1 1 (6)
From (4), the optimal throughput efficiency can be written as, 1 (7)
Take note that μ is related to dR (range × rate) product where d denotes the distance in meter between a source-sink pair and R is the data transmission rate in bps. It is explicit that kopt is a function of dR and the BER (ρ) of the communication link. Some of the crucial parameters used in our simulation include:
Link delay : 0.01s BER (ρ) : 10-3 , 10-4 Distance (d) : 10m to 5km Rate (R) : 100 bps to 1000 bps Header (h) : 160 bits No. of group (g) : 1
The simulation of this kopt resulted in a set of graphs shown in Fig. 4. These plots depict the relationship between optimal packet size and dR products qualified by different ρ. It can be seen here that
10
low quality link does not permit large packet size. By keeping the distance d between the source-sink pair constant e.g. static nodes deployment, and for a certain BER, the packet size seems to be increasing fairly linearly with an increasing R. However the packet size increases at a faster rate if the link ρ is low.
Fig. 4: Data packet size against dR (range×rate) products with different BERs.
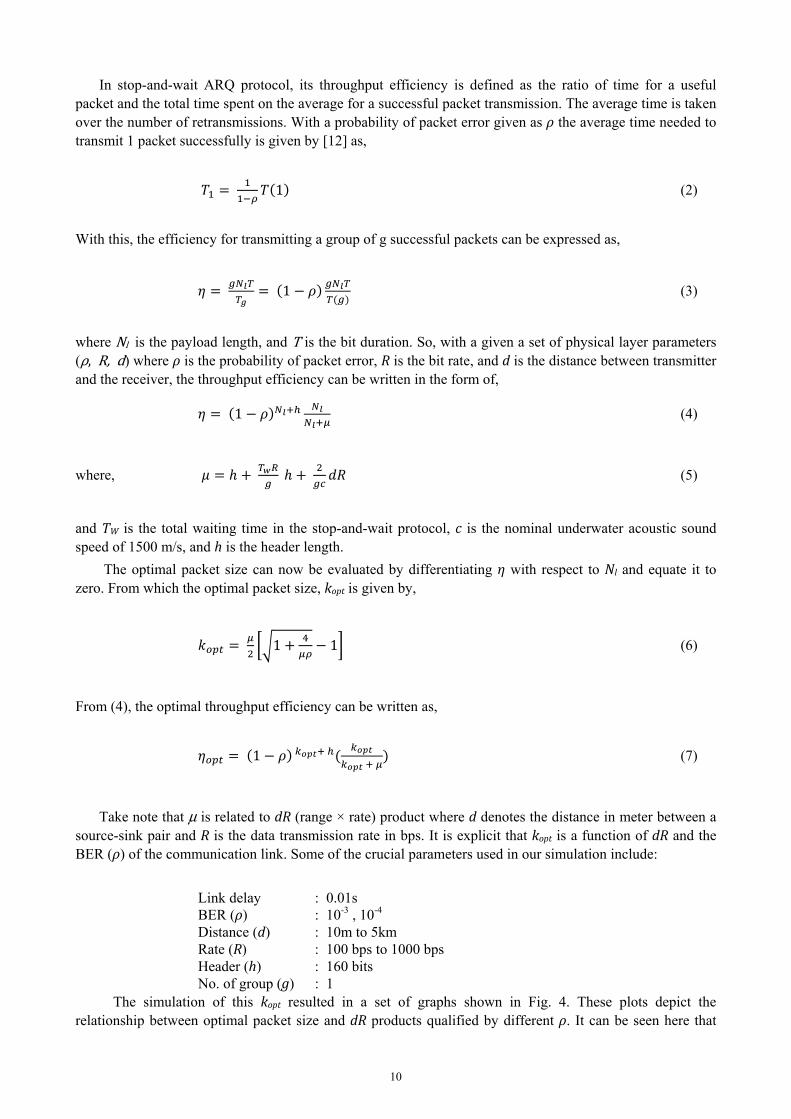
By substituting the kopt variable in (7) with values from Fig. 4 a set of throughput efficiency graphs are thus obtained as in Fig. 5.
Fig. 5: Throughput efficiency against kopt under different ρ and dR
As expected, link with high BER will have lower peak throughput efficiency than link with low BER. This is mainly due to the smaller optimal packet size that is allowed in low quality link. For instance, with constant dR product of 5x10² but different ρ of 10-4 (line 1) and 10-3 (line 2), the peak throughput efficiency for ρ of 10-4 is approximately 1.5 times better than ρ of 10-3. Moreover at this peak efficiency the optimal packet size for ρ of 10-4 is doubled that for ρ of 10-3. The reason for this phenomena is that the high BER is certainly to produce more packets lost in the course of transmission thus pulling down the throughput efficiency peak performance.
Another interesting observation in Fig.5 is that with a constant BER, the peak throughput efficiency will drop when the dR product increases. For example, comparing lines with ρ of 10-4 but with different dR of 5x10², 5x10³, and 5x10⁴ respectively the peak efficiency drops from 0.8 to 0.6 and down to 0.2! This issue can be explained by the fact that as the distance d increases and/or the transmission rate R is getting higher the chances for data packets being dropped will also increase thus bring along a poorer peak throughput
2500
2000
1500
1000
500
0 0 0.5 1 1.5 2 2.5 3 3.5 4 4.5 5 dR (m-bps) x10 5
Opt
imal
pac
ket S
ize
(bits
)
ρ = 10-4
ρ = 10-3
1
2
0 500 1000 1500 2000 2500 Packet Size (bits)
ρ = 10-4 ; dR = 5x10²
ρ = 10-3 ; dR = 5x10²
1
0.9
0.8
0.7
0.6
0.5
0.4
0.3
0.2
0.1
0
Thro
ughp
ut E
ffic
ienc
y
ρ = 10-4 ; dR = 5x10³
ρ = 10-4 ; dR = 5x10⁴ρ = 10-3 ; dR = 5x10³ρ = 10-3 ; dR = 5x10⁴
11

efficiency. Also noticed in Fig. 5 that for a good quality link, e.g. lines for ρ of 10-4, the high throughput efficiency seems to be sustained way passed the peak value. In other words the throughput efficiency is maintained almost at its peak even though the optimal packet size is increasing. This may induce a fact that data packets with large size can be transmitted in a high quality link to attain a high throughput efficiency.
3.3. Data packet size and energy efficiency Energy efficiency is defined as the ratio of the amount of data transmitted and the energy consumed for
that operation. The underwater wireless channel, being time-varying and noisy in nature, dictates the possibility of data corruption causing packet losses (discarded) at the sink which demands retransmissions of the packets resulting in a waste of valuable energy. A well known primary cause of energy wastage is in the retransmissions of data packets.
It is a known fact in wireless data communications, that the rate of packet errors is sensitive to the packet size. In other words, if the data packet size (thus the amount of data bits) can be adjusted or optimized according to the communication link quality (the error rate) there exist a possibility of reducing retransmissions thus improving the energy efficiency. In a nut shell, the packet size is reduced when the link is noisy to reduce the chances of packet errors therefore reducing retransmissions i.e. energy conservation.
Our investigation focused on the physical layer (PHY) and it is assumed that nodes is able to discover each other and self-organize into a communication network with peer-to-peer communication between any pair of neighbouring nodes. In this context, the energy efficiency equation by [13] is adopted as below (8) and would be the main reference for the simulation works on finding the relationship between energy efficiency and packet sizes. This equation is a function of packet length l and the link BER ρ. c1 and c2 are transmitter/receiver equipment constant with h denotes the header length. Implicitly it involves the energy per useful bit (EPUB) element.
1 (8)
In our simulation it is assumed that the source and the sink are of homogeneous type therefore they have the same equipment constants i.e. c1 = c2. So the energy efficiency term in the ηe equation i.e. the term:
can be approximated to l/(l + h) for (l + h) >> 1. This is acceptable since in most of the practical applications packet length is more than hundreds of bits. This is also in line with the basic definition of energy efficiency. In this energy efficiency simulation, some of the essential parameters used were:
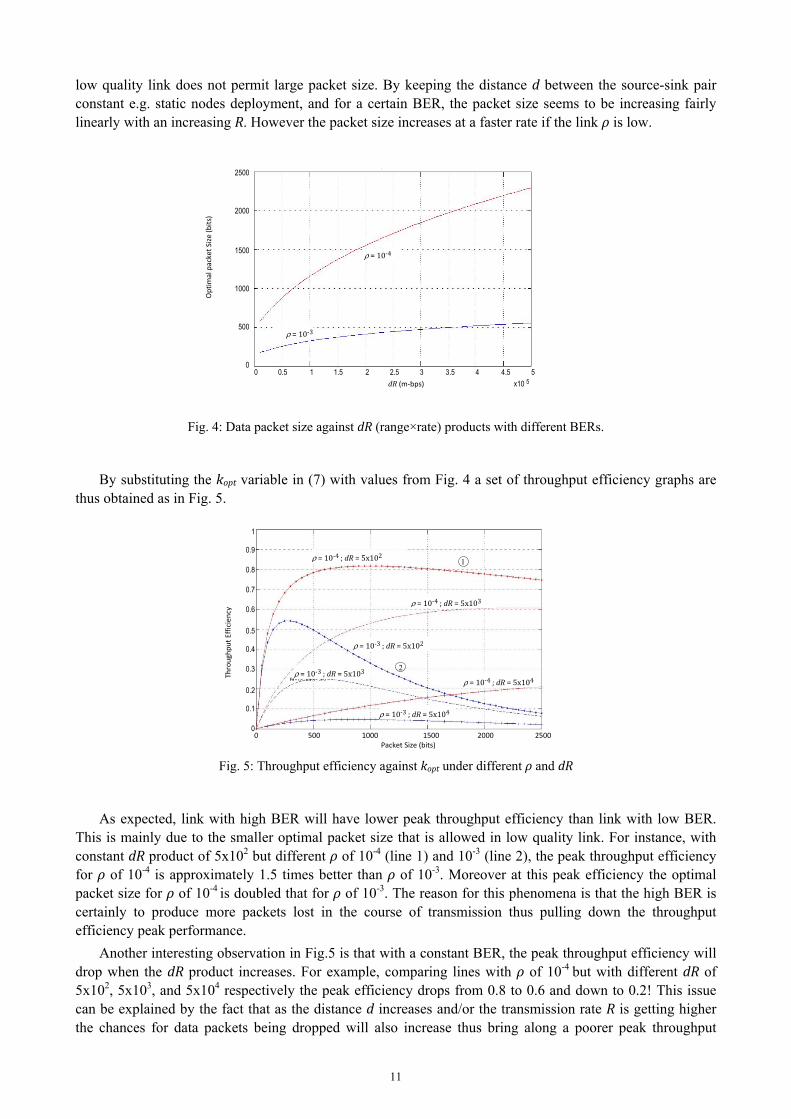
Link delay : 0.01s BER( ) : 10-2 , 10-3 , 10-4 Header (α) : 160 bits Length (l) : 0 – 1000 bits
The simulation output is shown in Fig. 6. The graph strongly depicts high energy efficiency for low BER. The energy efficiency for link with BER of 10-4 is almost two folds than those with BER of 10-2. The efficiency drops very sharply for high BER when the packet length is increased beyond the peak energy efficiency. This is practically true because the probability of packets being corrupted is high and therefore the demand for retransmission increases and more energy is thus wasted. Therefore it is not surprise to observe that the energy efficiency tapered off more gently beyond the peak performance for links with low BERs. The consequence is large packet length/size in good quality link is able to attain higher energy efficiency than links with poor quality.
12

Fig. 6: Energy efficiency against packet size under different BERs.
4. The Outcomes The main outcome of the simulations described in the preceding sections lead the authors into finding a
possible solution to determine the optimal packet size qualified collectively by the three metrics of: throughput efficiency, BER, and energy efficiency. We proposed an algorithm framework as follow.
4.1. Prerequisities A database consists of three data sets belonging to the three look-up graphs similar to Fig. 3, Fig. 4, and
Fig.6 is constructed. The data sets could be constructed by simulation means or by performing actual measurements at the body of water where the sensor nodes are to be deployed. The database constructed shall be loaded into the memory of the underwater nodes as the “knowledge acquired” from the communication link measurements. It is worth mentioning here that for UW nodes with memory constraint perhaps only a simplified data sets shall be loaded into it but, of course, on the expense of lesser communication effectiveness.
4.2. The algorithm
/*three data sets are denoted as F3, F4, and F6 to represent Fig.3, Fig.4, and Fig.6 respectively */ /* Source node and sink node are of homogeneous type */ /*test packet is essentially the RTS packet format with header length (h) of 160 bits */ {Source node: send(test_packet) to the sink with predefined bit rate (R); Sink: ack_and_return(test_packet); Source: with returned packet computes:
{ BER (ρ); distance (d); with ρ indexed into F3 to acquire Nopt1; with dR product indexed into F4 to acquire Nopt2; Nopt := average(Nopt1 , Nopt2 ); with Nopt indexed into F6 to acquire the energy efficiency (η); check: difference between η and ηopt from F6; if (difference) < (5%) then
packetsize := Nopt else {
with ρ indexed into F6 to obtain packet size (N) corresponds to max η ; packetsize := average(N, Nopt);
} end_if }
Source: assemble data_packet with packetsize ;
ρ = 0.0001
ρ = 0.001
ρ = 0.01
0 100 200 300 400 500 600 700 800 900 1000Packet Size (bits)
1
0.9
0.8
0.7
0.6
0.5
0.4
0.3
0.2
0.1
0
Ener
gy E
ffic
ienc
y
13

Source: send(data_packet); }
5. Conclusions The authors presented in this paper their simulation works in finding the relationship between optimal
data packet size and three important UWA communications performance metrics of BER, throughput efficiency, and the energy efficiency. In fact this is the extension to the previous work by the same authors found in [14]. The outcomes of the simulation has lead the authors to propose an algorithm that may be implemented in underwater sensor nodes to determine the optimal packets size qualified by the three performance metrics for an effective and efficient data transmission. The proposed algorithm shall be verified and tested in more depth in the authors’ next course of research.
6. References [1] M. Stojanovic. Recent Advances in High-Speed Underwater Acoustic Communications. IEEE Journal of Oceanic
Engineering, vol.121, No.2, April 1996, pp.125-136.
[2] I.F. Akyildiz, D. Pompili, T. Melodia. Underwater Acoustic Sensor Networks: Research Challenges. Elsevier’s Journal of Ad Hoc Networks 3, May 2005, pp 257-279.
[3] J. Heidemann, W. Ye, J. Willis, A.A. Syed, Y. Li. Research Challenges and Applications for Underwater Sensor Networking. Proc. of IEEE Wireless Communications and Networking Conference, Apr. 2006, pp 229-235.
[4] M. Chitre, S. Shahabodeen, M. Stojanovic. Underwater Acoustic Communications and Networking: Recent Advances and Future Challenges. Marine Technology Society Journal, vol.42, No.1, Spring 2008, pp.103-116.
[5] M. Chitre, M. Stojanovic, S.Shahabudeen, L. Freitag. Recent Advances in Underwater Acoustic Communications & Networking. Invited paper, Proc. IEEE Oceans'08 Conference, September 2008.
[6] M. Stojanovic. Underwater Wireless Communications: Current Achievements and Research Challenges. IEEE Oceanic Engineering Society Newsletter, Spring 2006.
[7] Regents of the SIGNET lab, University of Padova, 2007.
[8] N. Baldo, F. Maguolo, M. Miozzo, M. Rossi, M. Zorzi. ns2-MIRACLE: A Modular Framework for Multi-technology and Cross-layer Support in Network Simulator 2. 2nd international conference on Performance evaluation methodologies and tools, 2007.
[9] M.C. Vuran, I.F. Akyildiz. Cross-layer Packet Size Optimization for Wireless Terrestrial, Undewater, and Underground Sensor Networks. Proc. IEEE INFOCOM ’08, April 2008.
[10] E. Modiano. Data Link Protocols for LDR MILSTAR Communications. Lincoln Laboratory, Communications Division Internal Memorandum, October 1994.
[11] M. Schwartz. Telecommunication Networks: Protocols; Modeling and Analysis. Addison-Wesley, New York , pp. 125-156, 1987.
[12] M. Schwartz. Telecommunication Networks. Adison Wesley, 1988.
[13] Y. Sankarasubramaniam, I.F. Akyildiz, S.W. McLaughlin. Energy Efficiency Based Packet Size Optimization in Wireless Sensor Networks. Proc. 1st IEEE Int. Workshop on Sensor Network Protocols and Applications (SNPA'03), May 2003.
[14] T.J. Low, A. Azween. Underwater Acoustic Communications: Relationship Between Data Packet Size, Throughput, BER, and Distance. Proc. 4th Global conference on Power Control and Optimization (PCO 2010), Dec 2010.
14