
UvA-DARE (Digital Academic Repository) How to deal with ... · How to deal with fluctuations in...
213
UvA-DARE is a service provided by the library of the University of Amsterdam (http://dare.uva.nl) UvA-DARE (Digital Academic Repository) How to deal with fluctuations in hospital processes to improve accessibility? Joustra, P.E. Link to publication Citation for published version (APA): Joustra, P. E. (2011). How to deal with fluctuations in hospital processes to improve accessibility? General rights It is not permitted to download or to forward/distribute the text or part of it without the consent of the author(s) and/or copyright holder(s), other than for strictly personal, individual use, unless the work is under an open content license (like Creative Commons). Disclaimer/Complaints regulations If you believe that digital publication of certain material infringes any of your rights or (privacy) interests, please let the Library know, stating your reasons. In case of a legitimate complaint, the Library will make the material inaccessible and/or remove it from the website. Please Ask the Library: http://uba.uva.nl/en/contact, or a letter to: Library of the University of Amsterdam, Secretariat, Singel 425, 1012 WP Amsterdam, The Netherlands. You will be contacted as soon as possible. Download date: 14 Jun 2018
Transcript of UvA-DARE (Digital Academic Repository) How to deal with ... · How to deal with fluctuations in...
UvA-DARE is a service provided by the library of the University of Amsterdam (http://dare.uva.nl)
UvA-DARE (Digital Academic Repository)
How to deal with fluctuations in hospital processes to improve accessibility?
Joustra, P.E.
Link to publication
Citation for published version (APA):Joustra, P. E. (2011). How to deal with fluctuations in hospital processes to improve accessibility?
General rightsIt is not permitted to download or to forward/distribute the text or part of it without the consent of the author(s) and/or copyright holder(s),other than for strictly personal, individual use, unless the work is under an open content license (like Creative Commons).
Disclaimer/Complaints regulationsIf you believe that digital publication of certain material infringes any of your rights or (privacy) interests, please let the Library know, statingyour reasons. In case of a legitimate complaint, the Library will make the material inaccessible and/or remove it from the website. Please Askthe Library: http://uba.uva.nl/en/contact, or a letter to: Library of the University of Amsterdam, Secretariat, Singel 425, 1012 WP Amsterdam,The Netherlands. You will be contacted as soon as possible.
Download date: 14 Jun 2018

How to deal with fluctuations in hospital processes to improve accessibility?
Paul JoustraAcademic Medical Center & University of Amsterdam
How
to deal with fluctuations in hospital processes to im
prove accessibility? Paul Joustra
I would like to thank the following personsfor their contribution to this thesis
ISBN 978 90 6464 489 4© 2011, P.E. Joustra
omslag.indd 1 5-8-2011 13:50:01
How to deal with fluctuations in hospital processes to improve accessibility?

How to deal with fluctuations in hospital processes to improve accessibility?PhD thesis, Academic Medical Center & University of Amsterdam
The studies described in this PhD thesis were carried out at the Academic Medical Center (AMC) in Amsterdam, The Netherlands.
Copyright © 2011 P.E. Joustra, Amsterdam, The NetherlandsAll rights reserved. No part of this publication may be reproduced or transmitted in any form or by any means without permission of the author.
Editing advice: Colleen HiggensLay-out: Chris Bor, Department of Medical Photography, AMC, AmsterdamPrinted by: GVO drukkers & vormgevers B.V. | Ponsen & Looijen
ISBN 978 90 6464 489 4

How to deal with fluctuations in hospital processes to improve accessibility?
ACADEMISCH PROEFSCHRIFT
ter verkrijging van de graad van doctoraan de Universiteit van Amsterdamop gezag van de Rector Magnificus
prof. dr. D.C. van den Boomten overstaan van een door het college voor promoties ingestelde commissie,
in het openbaar te verdedigen in de Agnietenkapelop woensdag 21 september 2011, te 14.00 uur
door Paul Erik Joustra
geboren te Amsterdam

Promotiecommissie
Promotor: Prof. Dr. N.M. Van Dijk
Promotor: Prof. Dr. P.J.M. Bakker
Overige leden: Prof. Dr. J.S. Laméris
Prof. Dr. C.C.E. Koning
Prof. Dr. R.J. Boucherie
Prof. Dr. Ir. J. Vissers
Prof. Dr. G.G. van Merode
Prof. Dr. E. Demeulemeester
Faculteit der Geneeskunde
Table of Contents
1 General Introduction 7
2 Reduce fluctuations in capacity to improve the accessibility of radiotherapy treatment cost-effectively
23
3 To pool or not to pool in hospitals: A theoretical and practical comparison for a radiotherapy outpatient department
43
4 Reducing access times for an endoscopy department by an iterative combination of computer simulation and Linear Programming
63
5 Reducing MRI access times by tackling the appointment-scheduling strategy
83
6 How to reduce waiting times at the MRI of a university radiology department
95
7 Can statisticians beat surgeons at the planning of operations? 109
8 How to juggle with priorities? An interactive tool to provide quantitative support for strategic patient-mix decisions
137
9 General Discussion 165
Summary 185
Samenvatting 199

The medical faculty is a collaborative effort of the Academic Medical Center and the University of Amsterdam
“Even small healthcare institutions are complex, barely manageable places.large healthcare institutions may be the most complex organisations in human history.”
Peter Drucker

1CHAPTER
General Introduction


9
GENERAL INTRODUCTION
1.1 The relevance of cost-effective ways for improving the accessibility of hospital care
Currently, hospitals have to deal with several external factors that require the efficient use of resources. Budget restrictions are forcing hospitals to work – and use their capacity – more efficiently, and at the same time, they are expected to deliver more care because of the aging of the population. In addition, the aging population will cause a structural shortage of health care professionals in the long term (see Figure 1.1). This situation requires hospitals to optimize their processes as much as possible and use their resources as efficiently as possible.
Moreover, hospitals are encountering more competition from new initiatives: private clinics that focus on specific patient groups (e.g., patients with cataract), and diagnostic centers (e.g., a specialized MRI center). Improved accessibility is known to be an important aspect of competition with other hospitals or specialized clinics. In addition to the distance involved and the recent experiences of either patients or their acquaintances with a hospital, low access times are important to general practitioners when deciding where to send their patients, and to patients when choosing a hospital [1]. This information is publicly available on the internet to make it easy for patients to compare the access times of various hospitals.
In addition, the Euro Health Consumer Index 2009 [2] reported that the Netherlands has the best health care system with the exception of accessibility, which, when compared to other European countries, could be improved.
From the patient’s perspective, low access times are preferable so that the period of uncertainty and inconvenience during their illness is kept as short as possible. More importantly, a patient’s condition may deteriorate while spending time on a waiting
Figure 1.1: Future shortage of health care professionals in the Netherlands

10
CHAPTER 1
list. For example, O’Rourke [3] concluded that lung cancer patients may become more seriously ill while waiting for radiotherapy treatment, therefore potentially requiring more complex treatment and/or decreasing the chance of full recovery. Furthermore, Huang et al. [4] concluded that for both breast cancer and head and neck cancer, the local recurrence rate was significantly higher for patients who had to wait longer for radiotherapy treatment.
Prentice and Pizer reported that the mortality rate within a 6-month follow-up period was significantly higher for patients who had to wait more than 31 days for an appointment at a geriatric outpatient clinic [5].
With respect to cardiac surgery, Plomp et al. [6] concluded that the causes and circumstances of death are waiting list-related for approximately 100 patients per year in the Netherlands. Moreover, Rexius et al. [7] concluded that long waiting lists for coronary artery bypass grafting are associated with considerable mortality, and the risk of death increases significantly with waiting time.
1.2 Why is it advisable to use quantitative decision support?
There are often multiple solutions available for improving the accessibility of hospitals. At the same time, the impact of a solution in a specific hospital setting cannot be known beforehand. To reduce the risk of implementing a solution that will not have the preferred impact on accessibility, it would thus be highly advisable to have quantitative decision support. With this quantitative support, the impact of each potential solution (or combination of solutions) could be predicted accurately before actually implementing the solution in practice. Moreover, it would provide an objective way of comparing alternative solutions before selecting the most cost-effective solution for meeting the performance target.
1.3 Why do waiting times occur?
There are different kinds of waiting times in hospitals: access times, throughput times, and in the waiting room. Waiting times are generally perceived as occurring due to a mismatch between demand and capacity. This is true to a certain extent. If demand structurally exceeds capacity, it is logical there will be waiting times. However, the mismatch between demand and capacity in hospitals is often only temporary and is caused by fluctuations – from day to day and week to week – in both demand as well as capacity. Although in most hospital departments the average capacity is sufficient for meeting the average demand, these temporary mismatches
11
GENERAL INTRODUCTION
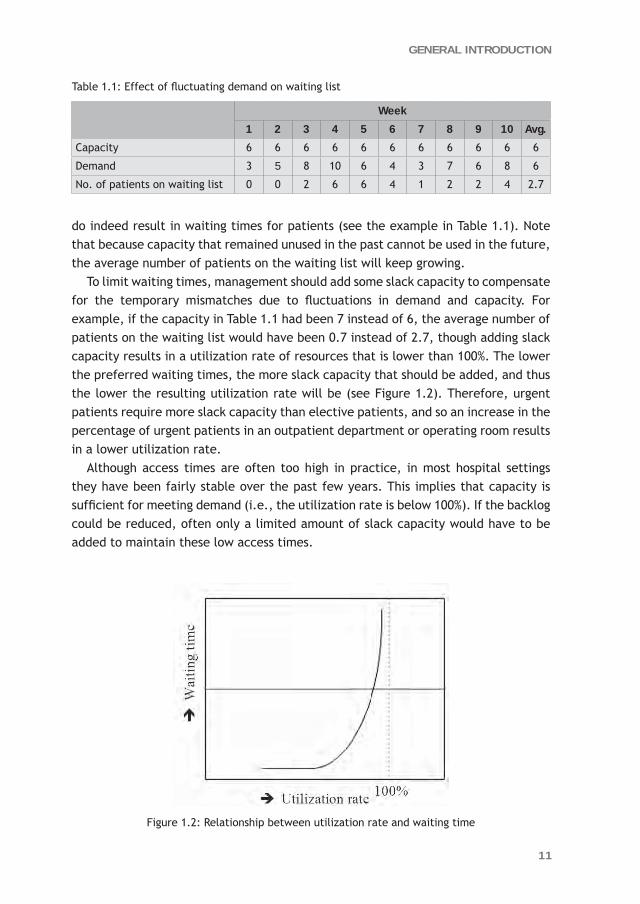
do indeed result in waiting times for patients (see the example in Table 1.1). Note that because capacity that remained unused in the past cannot be used in the future, the average number of patients on the waiting list will keep growing.
To limit waiting times, management should add some slack capacity to compensate for the temporary mismatches due to fluctuations in demand and capacity. For example, if the capacity in Table 1.1 had been 7 instead of 6, the average number of patients on the waiting list would have been 0.7 instead of 2.7, though adding slack capacity results in a utilization rate of resources that is lower than 100%. The lower the preferred waiting times, the more slack capacity that should be added, and thus the lower the resulting utilization rate will be (see Figure 1.2). Therefore, urgent patients require more slack capacity than elective patients, and so an increase in the percentage of urgent patients in an outpatient department or operating room results in a lower utilization rate.
Although access times are often too high in practice, in most hospital settings they have been fairly stable over the past few years. This implies that capacity is sufficient for meeting demand (i.e., the utilization rate is below 100%). If the backlog could be reduced, often only a limited amount of slack capacity would have to be added to maintain these low access times.
Figure 1.2: Relationship between utilization rate and waiting time
Table 1.1: Effect of fluctuating demand on waiting list
Week
1 2 3 4 5 6 7 8 9 10 Avg.
Capacity 6 6 6 6 6 6 6 6 6 6 6
Demand 3 5 8 10 6 4 3 7 6 8 6
No. of patients on waiting list 0 0 2 6 6 4 1 2 2 4 2.7

12
CHAPTER 1
To illustrate this, we used an outpatient department with an average of six new patients a day. Next, we used a standard formula from the literature on queuing theory [8] to determine the maximum utilization rate for various threshold values of the access time target (see Table 1.2). The results show that 1% (= 99.4% - 98.4%) slack should be added to maintain an average access time of two weeks compared to an average access time of six weeks (which is about one additional consultation in three weeks). Note that a structural reduction in access times from two weeks to only one week requires significantly more slack capacity than a reduction from six weeks to two weeks.
Table 1.2: Average access time versus utilization rate
Average access time Utilization rate
6 weeks 99.4%
5 weeks 99.3%
4 weeks 99.1%
3 weeks 98.9%
2 weeks 98.4%
1 week 96.8%
Table 1.2 also demonstrates that simply striving for a higher utilization rate will result in higher waiting times. Therefore, management should not aim to maximize the utilization rate exclusively, but should first decide upon the preferred waiting times in the waiting room and access times and then maximize the utilization rate according to these quality restrictions. Although adding slack capacity does indeed result in lower waiting times, there might be more efficient ways of reducing waiting times. In the remainder of this section, we will illustrate two ways for improving accessibility efficiently.
One way to efficiently reduce waiting times is to minimize the root cause of the waiting times, namely the fluctuations in demand and capacity. To illustrate this principal, we used the Pollaczek-Khintchine formula [9] to experiment with the degree of fluctuations in process times. The Pollaczek-Khintchine formula expresses that the average waiting time of a system with fluctuations in the process times (WM|G|1) is a function of the variation coefficient of the process times (cs
is the standard deviation divided by the mean process time) and the average waiting time with fixed process times (WM|D|1). Formula (1) is scientifically correct for a single capacity unit.
(1) WM|G|1 = (1 + 2sc ) * WM|D|1 with 2
sc the variation coefficient of the process time distribution.
13
GENERAL INTRODUCTION
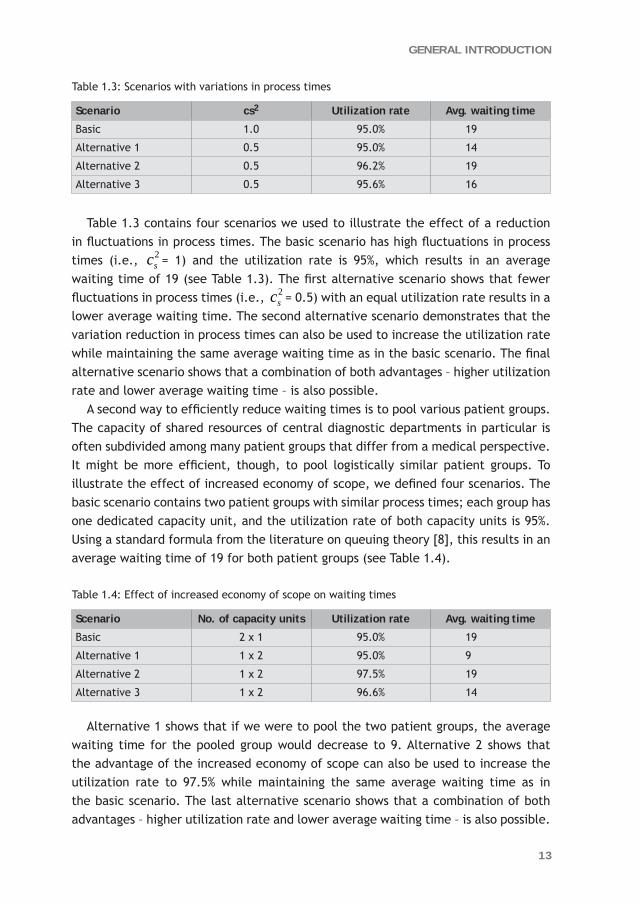
Table 1.3: Scenarios with variations in process times
Scenario cs2 Utilization rate Avg. waiting time
Basic 1.0 95.0% 19
Alternative 1 0.5 95.0% 14
Alternative 2 0.5 96.2% 19
Alternative 3 0.5 95.6% 16
Table 1.3 contains four scenarios we used to illustrate the effect of a reduction in fluctuations in process times. The basic scenario has high fluctuations in process times (i.e., 2
sc = 1) and the utilization rate is 95%, which results in an average waiting time of 19 (see Table 1.3). The first alternative scenario shows that fewer fluctuations in process times (i.e., 2
sc = 0.5) with an equal utilization rate results in a lower average waiting time. The second alternative scenario demonstrates that the variation reduction in process times can also be used to increase the utilization rate while maintaining the same average waiting time as in the basic scenario. The final alternative scenario shows that a combination of both advantages – higher utilization rate and lower average waiting time – is also possible.
A second way to efficiently reduce waiting times is to pool various patient groups. The capacity of shared resources of central diagnostic departments in particular is often subdivided among many patient groups that differ from a medical perspective. It might be more efficient, though, to pool logistically similar patient groups. To illustrate the effect of increased economy of scope, we defined four scenarios. The basic scenario contains two patient groups with similar process times; each group has one dedicated capacity unit, and the utilization rate of both capacity units is 95%. Using a standard formula from the literature on queuing theory [8], this results in an average waiting time of 19 for both patient groups (see Table 1.4).
Table 1.4: Effect of increased economy of scope on waiting times
Scenario No. of capacity units Utilization rate Avg. waiting time
Basic 2 x 1 95.0% 19
Alternative 1 1 x 2 95.0% 9
Alternative 2 1 x 2 97.5% 19
Alternative 3 1 x 2 96.6% 14
Alternative 1 shows that if we were to pool the two patient groups, the average waiting time for the pooled group would decrease to 9. Alternative 2 shows that the advantage of the increased economy of scope can also be used to increase the utilization rate to 97.5% while maintaining the same average waiting time as in the basic scenario. The last alternative scenario shows that a combination of both advantages – higher utilization rate and lower average waiting time – is also possible.

14
CHAPTER 1
1.4 Settings
The research contained in this thesis was performed at the Academic Medical Center (AMC) in Amsterdam, the Netherlands. The AMC is an academic hospital with 1,002 beds, and 356,000 outpatient hospital visits and 55,000 surgical procedures in 2009. Nearly all departments use McKesson’s X/Care hospital appointment system to schedule the outpatient visits, and most surgical procedures are scheduled using the OKplus operating room information system. Elective patients are allowed to walk in without an appointment for only a small number of consultations and examinations.
To improve accessibility by reducing fluctuations in demand and capacity, we first need to know what types of fluctuations frequently occur in hospitals. An overview of these types is given in this section. We start by identifying the fluctuations that occur in all hospitals followed by the additional fluctuations in teaching hospitals and academic hospitals.
As is common in all hospitals, the number of patients referred to the various outpatient departments by general practitioners and other physicians fluctuate from day to day and week to week. Some outpatient departments may even have a seasonal pattern in the number of referrals. Also, the number of follow-up consultations may differ per patient, and the average number of follow-up consultations often differs significantly per subspecialty and/or per individual physician. As well as elective patients, physicians also have to see urgent patients. All these fluctuations in demand generally lead to access times for a first, a follow-up, or an urgent (or semi-urgent) consultation, even with a stable capacity. However, the capacity in terms of the number of available consultations also fluctuates heavily from day to day and week to week. In addition, all outpatient departments within the AMC experience a seasonal pattern in capacity due to holiday periods. On the operational level, a physician’s starting time and the arrival time of a patient with an appointment vary, which results in waiting time in the waiting room. At specific outpatient departments, patients need some preparation before a consultation (e.g., at an ophthalmology department), which causes even more fluctuations in the arrival time of patients in the consultation/examination room. Moreover, the actual duration of a consultation may differ per patient, and the average duration might differ per subspecialty and/or per individual physician.
There are more fluctuations in teaching hospitals than in non-teaching hospitals. For example, the average number of follow-up consultations done by a resident physician is likely to be higher than those done by an attending physician, and also the average number of follow-up consultations among the resident physicians probably differs more than those among the attending physicians. There are more fluctuations in teaching hospitals on an operational level as well. For example, due to a lack of experience, the duration of consultations performed by a resident physician

15
GENERAL INTRODUCTION
is likely to fluctuate more than those performed by an attending physician. Moreover, if an attending physician is also seeing patients during the supervision period – which is often the case in the AMC – this supervision of a resident physician will cause interruptions in both their schedules and therefore more fluctuations in the duration of consultations.
Physicians in academic hospitals are likely to be absent more frequently due to other reasons (such as attending conferences and teaching medical students), which causes more fluctuations in the weekly number of available consultations. Also, academic hospitals have a more diverse and complex patient-mix compared to general hospitals. This often results in a higher degree of subspecialization and thus smaller groups of physicians per subspecialty, which reduces robustness and therefore often results in higher access times due to less flexibility in allocating the available capacity. On the operational level, the more diverse and complex diseases probably cause more fluctuations in the duration of consultations. In addition, research may require that specific patients are examined more extensively, which leads to more fluctuations in the duration of consultations.
Table 1.5 summarizes the types of fluctuations that occur in an outpatient department. The degree of fluctuations depends on the type of hospital; in general, academic hospitals show a higher degree of fluctuation than teaching hospitals, which in turn show more fluctuations than general hospitals.
The same types of fluctuations that occur in outpatient departments also occur in emergency departments, central diagnostic or therapeutic departments, and operating rooms.
Table 1.5: Types of fluctuations on tactical and operational levels
Types of fluctuations in an outpatient department
On a tactical level
Number of patients per day, per week, per month
Number of follow-up consultations per patient, per subspecialty, per individual physician
Various urgency levels
Weekly number of available consultations
Subspecialty required by patient
On an operational level
Physician’s starting time
Patient’s arrival time
Preparation time for a patient
Actual duration of a consultation per patient, per subspecialty, per individual physician
Attending physicians versus resident physicians
Supervision of a resident physician by an attending physician

16
CHAPTER 1
1.5 Research question
The overall research objective of this thesis is to show the added value of quantitative methods such as queuing theory, discrete event simulation, and regression analysis for generally applied process improvement methods, in a complex hospital setting, in particular for decision support on a strategic level.
In addition to the overall research objective, this thesis aims to answer the following specific research questions: 1. How can waiting times, access times, and throughput times be reduced cost-
effectively a. by decreasing the various fluctuations in health care processes and/or b. by pooling or separating various patient groups?
2. How can hospital processes be made more predictable so that management is able to anticipate future developments proactively, and structurally improve the hospital’s key performance indicators?
1.6 Methodology
Based on the different types of fluctuations that frequently occur in hospitals, we explored different methods for decreasing these fluctuations or minimizing the negative effect of these fluctuations on waiting and access times.
Generally applied process improvement methods such as Business Process Redesign [10], Total Quality Management [11], Theory of Constraints [12], Lean Management [13], and Six Sigma [14] give insights into which process steps to focus on to reduce waiting and access times or throughput times. Unfortunately, none of these methods quantitatively supports the expected impact of a potential solution on the waiting and access times before implementation in practice, nor do these methods quantitatively support the selection of alternative solutions.
Each of our research studies required quantitative decision support. Therefore, we have searched for quantitative methods that could be applied in situations where various fluctuations significantly influence a system’s performance, as is the case in hospitals. Queuing theory is an appropriate method for analyzing waiting times, and was frequently applied in health care settings [15, 16]. Discrete event simulation was often used for more complex hospital problems [17-19].
Though both of these methods were used to solve problems on an operational or tactical level, we did not find any articles where queuing theory or discrete event simulation were used for decision support on a strategic level.

17
GENERAL INTRODUCTION
1.7 Outline of this thesis
Chapters 2 through 8 are based on articles. Because this thesis should be seen as applied research, the order in which they are presented here is based primarily on the application area. Therefore, we have chosen to arrange the chapters according to hospital departments rather than the methodology. Subsequently, we arranged the articles so that sets of articles used to answer the same specific research question were combined wherever possible.
This reasoning led to the following order:Chapter 2 Capacity Variability Reduction: A case study for a multi-step radiotherapy
process.Chapter 3 To pool or not to pool in hospitals: A theoretical and practical comparison
for a radiotherapy outpatient department.Chapter 4 Reduce access times for an endoscopy department by an iterative
combination of computer simulation and Linear Programming. Chapter 5 Reducing MRI access times by tackling the appointment-scheduling
strategy.Chapter 6 How to reduce waiting times at the MRI of a University Radiology
Department. Chapter 7 Can statisticians beat surgeons at the planning of operations? Chapter 8 How to juggle with priorities? An interactive tool to provide quantitative
support for strategic patient-mix decisions.
Chapters 2 and 3 illustrate two alternative solutions for efficiently reducing access times in the AMC radiotherapy outpatient department to be able to meet the throughput time targets for radiotherapy treatment. The next three chapters all describe case studies of a central diagnostic department, namely the endoscopy department (Chapter 4) and the MRI department (Chapters 5 and 6). Chapters 4 and 5 demonstrate how to reduce access times for an endoscopic procedure and an MRI scan respectively. In Chapter 6, we evaluate various alternative scenarios to reduce waiting time in the waiting room of an MRI department. Finally, the last two chapters of this thesis focus mainly on the performance of the operating room. Chapter 7 explores how to improve the accuracy of the predicted duration of surgical procedures in order to limit the risk of overtime and the number of cancellations due to overruns of previous surgeries. Chapter 8 describes an interactive tool for supporting medical management with strategic patient-mix decisions, and takes the key performance indicators into account. In our case study of the AMC ophthalmology department we focused on the bottleneck, namely the operating room.

18
CHAPTER 1
Chapters 2, 4, and 6 were used to answer research question 1a. These studies demonstrate how decreasing the various fluctuations in health care processes result in lower throughput times, access times, and waiting times in the waiting room respectively. Chapter 2 explores the effect of a reduction in the fluctuations of capacity in the multi-step radiotherapy process in order to decrease the total throughput times. Chapter 4 also shows how a reduction in fluctuations in capacity could improve the accessibility of (in this case) an endoscopy department. Chapter 6 demonstrates two examples of variability reduction of MRI durations, namely reducing the supervision by radiologists, and scheduling patients at high risk of unexpected issues (e.g., patients with claustrophobia) for the open MRI scanner or at the end of the schedule for the regular MRI scanners. Chapters 3, 4, and 5 deal with the question of whether to pool or separate patient groups (research question 1b) for two different reasons and three different departments. More specifically, Chapter 3 explores the situations in which semi-urgent and elective patient groups should be pooled or separated. Furthermore, Chapters 4 and 5 both investigate whether pooling different groups of elective patients would reduce the access times for an endoscopic procedure and an MRI scan respectively.
To answer research question 2, we conducted the research described in Chapters 6, 7, and 8. In Chapter 6, we used variability reduction as well as improved predictability to reduce waiting times in the waiting room of an MRI department. Finally, Chapters 7 and 8 aim to improve the predictability of hospital processes so that management is able to anticipate future developments proactively instead of reactively.
With respect to methodology, in Chapters 2 and 3 we used a combination of queuing theory and computer simulation; in Chapters 4 through 6 we used only computer simulation. Finally, to improve predictability we applied regression analysis; in Chapter 8 we combined this with computer simulation.
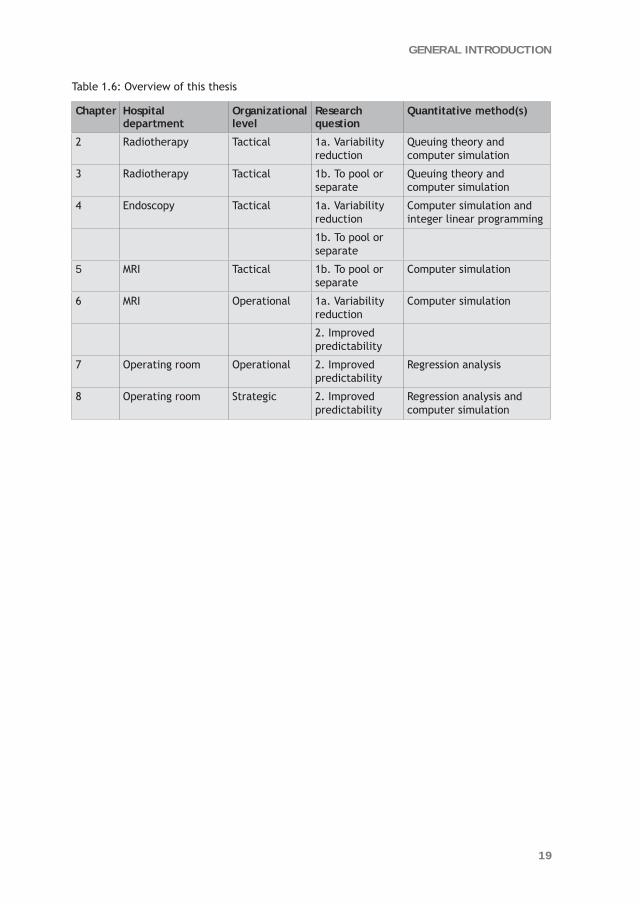
Table 1.6 provides an overview of this thesis including the research question, hospital department, organizational level, research question and quantitative method(s) per chapter.
19
GENERAL INTRODUCTION
Table 1.6: Overview of this thesis
Chapter Hospital department
Organizational level
Research question
Quantitative method(s)
2 Radiotherapy Tactical 1a. Variability reduction
Queuing theory and computer simulation
3 Radiotherapy Tactical 1b. To pool or separate
Queuing theory and computer simulation
4 Endoscopy Tactical 1a. Variability reduction
Computer simulation and integer linear programming
1b. To pool or separate
5 MRI Tactical 1b. To pool or separate
Computer simulation
6 MRI Operational 1a. Variability reduction
Computer simulation
2. Improved predictability
7 Operating room Operational 2. Improved predictability
Regression analysis
8 Operating room Strategic 2. Improved predictability
Regression analysis and computer simulation

20
CHAPTER 1
References 1. Faber M, Bosch M, Wollersheim H, Leatherman S, Grol R (2009) Public reporting in health
care: how do consumers use quality-of-care information? A systematic review. Med Care 47:1-8.
2. Euro Health Consumer Index 2009 by Health Consumer Powerhouse (January 10th, 2009).
3. O’Rourke N, Edwards R (2000) Lung cancer treatment waiting times and tumour growth. Clin Oncol 12:141-144.
4. Huang J, Barbera L, Brouwers M, Browman G, Mackillop WJ (2003) Does delay in starting treatment affect the outcomes of radiotherapy? A systematic review. J Clin Oncol 21:555-563.
5. Prentice JC, Pizer SD (2007) Delayed access to health care and mortality. Health Serv Res. 42(2):644-662.
6. Plomp J, Redekop WK, Dekker FW, Geldorp van TR, Haalebos M, Jambroes G, Kingma J, Zijlstra F, Tijssen J (1999) Death on the waiting list for cardiac surgery in the Netherlands in 1994 and 1995. Heart 81(6):593-597.
7. Rexius H, Brandrup-Wognsen G, Odén A, Jeppsson A (2004) Mortality on the waiting list for coronary artery bypass grafting: incidence and risk factors. Ann Thorac Surg 77:769-774.
8. Cooper RB (1984) Introduction to queueing theory. Elsevier Science Publishing, New York, 2nd edn.
9. Pollaczek F (1957) Problèmes stochastiques posés par le phénomène de formation d’une queue d’attente à un guichet et par des phenomenes apparentés. Gauthier Villars, Paris.
10. Hammer M (1990) ‘Reengineering work: don’t automate, obliterate’. Harvard Business Review, 68, 4, July-August, 104-112.
11. Hammet P (2000). The Philosophy of TQM.
12. Goldratt EM (1990) What is this thing called Theory of Constraints. North River Press, New York
13. Womack JP, Jones DT (1996) Lean Thinking: Banish Waste and Create Wealth in Your Corporation.
14. Pyzdek T and Keller PA (2009). The Six Sigma Handbook, 3rd edn. McGraw-Hill, New York.
15. Worthington DJ (1987) Queueing models for hospital waiting lists. The J of Oper Res Soc 38(5):413-422.
16. Fomundam S and Herrmann JW (2007) A survey of queuing theory applications in healthcare. Technical report, University of Maryland.
17. Brailsford SC, Harper PR, Patel B, Pitt M (2009) An analysis of the academic literature on simulation and modelling in health care. J of Simul 3:130–140.
18. Jacobson H, Hall S, Swisher J (2006) Discreet-Event Simulation of Health Care Systems. In Hall, R. (Ed.), Patient Flow: Reducing Delay in Healthcare Delivery (pp. 210-252). Springer, NY.
19. Fone D, Hollinghurst S, Temple M, Round A, Lester N, Weightman A, Roberts K, Coyle E, Bevan G, Palmer S (2003) Systematic review of the use and value of computer simulation modelling in population health and health care delivery. J of Public Health Med 25:325-335.


The irrigation system ensures that the crops will have a continuous supply of water throughout the year
“The best way to predict the future is to create it.” Peter Drucker

2CHAPTER
Reduce fluctuations in capacity to improve the accessibility of radiotherapy treatment
cost-effectively
P.E. JoustraR. Kolfin
N.M. van DijkC.C.E. KoningP.J.M. Bakker
Conditionally accepted by Flexible Services and Manufacturing Journal

24
CHAPTER 2
Abstract
This paper is motivated by a case study to reduce the throughput times for radiotherapy treatment. The goal is to find a cost-effective way to meet the throughput time targets in the next future.
A combination of queuing theory and computer simulation was used. First, computer simulation to detect the bottleneck(s) in a multi-step radiotherapy process. Despite, the investment in an additional linear accelerator, the main bottleneck turned out to be the outpatient department.
Next, based on queuing theory, waiting times were improved by reducing the fluctuations in the outpatient department capacity. Computer simulation was used again to quantify the effect on the total throughput time of a radiotherapy patient.
The results showed a reduction in both access times as well as waiting times prior to the consecutive steps: the preparation phase and actual treatment.
The paper concludes with practical suggestions on how to reduce the fluctuations in capacity, and seems of interest for other radiotherapy departments or other multi-step situations in a hospital.

25
REDUCE FLUCTUATIONS IN CAPACITY TO IMPROVE THE ACCESSIBILITY
2.1 Introduction
2.1.1 Motivation In the last few years, hospitals in the Netherlands have been moving towards more demand-driven than supply-driven institutions. For radiotherapy departments, this led to nationally accepted throughput time targets: for example, 80% of subacute patients have to start treatment within 7 calendar days of referral.
Throughput time is defined as the time between the initial referral and the actual start of radiotherapy treatment. This throughput time consists of several interdependent phases, such as waiting time for the first consultation, preparation for radiotherapy, and the actual start of the treatment.
To ensure that throughput time targets will be met in the future, cost-effective optimization strategies are preferable to costly investment in additional resources. Therefore, the challenge is to improve the efficiency of current resources.
Previous attempts to reduce throughput times for the radiotherapy department of the Academic Medical Center (AMC) in Amsterdam have not succeeded in reaching the national throughput time targets. These attempts have focused primarily on managing capacity at the presumed bottleneck: namely, the linear accelerators. However, extending the operational time of the linear accelerators did not lead to significant improvements in throughput time.
2.1.2 Radiotherapy LiteratureUntil now, the literature concerning radiotherapy waiting lists and efficiency improvements has focused mainly on one single step in the entire radiotherapy process. Thomas et al. [1] described a method for calculating the spare capacity needed in the outpatient department (OPD) in order to manage access times. Munro and Potter [2] analyzed the waiting time between the first consultation and the first fraction of radiation. Several studies have focused on the final step of the radiotherapy process: the actual treatment. Thomas [3] analyzed the waiting time before a patient started radiotherapy after completing the preparation phase. An estimate for measuring the future workload of linear accelerators has been given by Delaney et al. [4], and Williams et al. [5] performed a strategic capacity analysis to quantify the effect of recommended access rates and optimal dose fractionation for radiotherapy activity.
Only one article described and assessed the entire process: Dickof [6] analyzed all steps of the radiotherapy process (the first consultation at the OPD, the preparation, and treatment on the linear accelerators) separately using three different models to forecast waiting times before each individual step and not the total throughput time.
26
CHAPTER 2
In order to decide whether a specific patient has met the throughput time target, however, it is necessary to analyze all steps simultaneously. For example, a high access time can be compensated in the subsequent steps of the process, so that the patient can still meet the performance target.
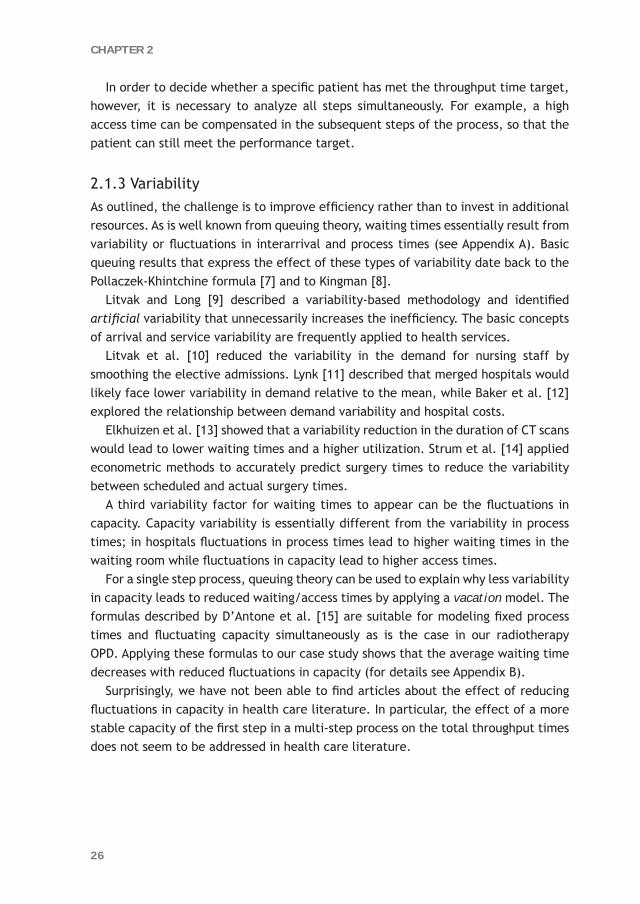
2.1.3 Variability As outlined, the challenge is to improve efficiency rather than to invest in additional resources. As is well known from queuing theory, waiting times essentially result from variability or fluctuations in interarrival and process times (see Appendix A). Basic queuing results that express the effect of these types of variability date back to the Pollaczek-Khintchine formula [7] and to Kingman [8].
Litvak and Long [9] described a variability-based methodology and identified artificial variability that unnecessarily increases the inefficiency. The basic concepts of arrival and service variability are frequently applied to health services.
Litvak et al. [10] reduced the variability in the demand for nursing staff by smoothing the elective admissions. Lynk [11] described that merged hospitals would likely face lower variability in demand relative to the mean, while Baker et al. [12] explored the relationship between demand variability and hospital costs.
Elkhuizen et al. [13] showed that a variability reduction in the duration of CT scans would lead to lower waiting times and a higher utilization. Strum et al. [14] applied econometric methods to accurately predict surgery times to reduce the variability between scheduled and actual surgery times.
A third variability factor for waiting times to appear can be the fluctuations in capacity. Capacity variability is essentially different from the variability in process times; in hospitals fluctuations in process times lead to higher waiting times in the waiting room while fluctuations in capacity lead to higher access times.
For a single step process, queuing theory can be used to explain why less variability in capacity leads to reduced waiting/access times by applying a vacation model. The formulas described by D’Antone et al. [15] are suitable for modeling fixed process times and fluctuating capacity simultaneously as is the case in our radiotherapy OPD. Applying these formulas to our case study shows that the average waiting time decreases with reduced fluctuations in capacity (for details see Appendix B).
Surprisingly, we have not been able to find articles about the effect of reducing fluctuations in capacity in health care literature. In particular, the effect of a more stable capacity of the first step in a multi-step process on the total throughput times does not seem to be addressed in health care literature.

27
REDUCE FLUCTUATIONS IN CAPACITY TO IMPROVE THE ACCESSIBILITY
2.1.4 ObjectivesThe main objectives of the present study therefore were:a. To determine which aspects of the process are primarily responsible for preventing
the AMC radiotherapy department from meeting the throughput time targets;b. To search for cost-effective solutions to reduce the throughput times and to
provide quantitative support to compare alternative solutions;c. To show that capacity variability reduction in the multi-step process can be highly
effective.
2.2 Problem description
2.2.1 The AMC Radiotherapy DepartmentAt the start of this study in May 2006, the AMC radiotherapy department was staffed by 9 radiation oncologists, 5 clinical physicians, and 30 technicians. The department had one simulator and one CT simulator for the preparation and three linear accelerators for the actual treatment. A fourth accelerator was scheduled for 2007. In 2006, 2350 new patients had a first consultation and 7200 patients were seen in follow-up. During the entire year, a total of around 32,500 radiation fractions were administered.
Table 2.1: Performance targets for different types of patients
Patient group % patients within throughput time target
Throughput time target
Maximum waiting time
Acute 100% 1 day -
Subacute 80% 7 days 10 days
Other indications 80% 21 days 28 days
Table 2.1 contains the performance targets for the different patient groups set by the Dutch Society of Radiotherapy and Oncology. We did not include acute patients in our study, but focused primarily on subacute patients and those with other indications. In the first quarter of 2006, only 50% of the subacute patients started treatment within 7 calendar days of referral. The performance for patients with other indications was even worse: 36% of the patients started treatment within 21 calendar days of referral.
2.2.2 The Multi-Step Radiotherapy ProcessThe study began with the process mapping of the entire radiotherapy treatment process. We observed the different steps in the process, held interviews with experts from the department, and developed a flowchart, which was validated by the experts.
28
CHAPTER 2
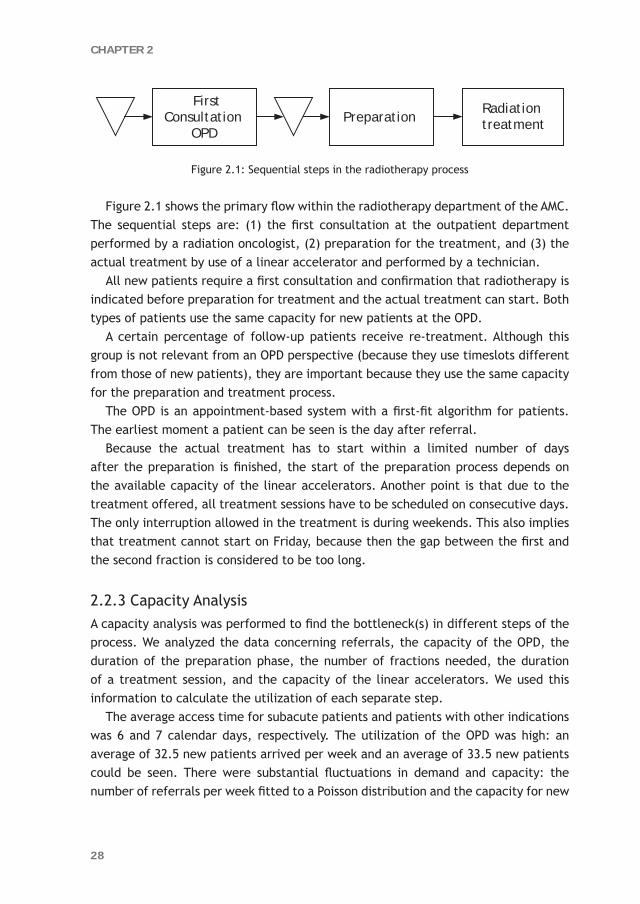
Figure 2.1: Sequential steps in the radiotherapy process
Figure 2.1 shows the primary flow within the radiotherapy department of the AMC. The sequential steps are: (1) the first consultation at the outpatient department performed by a radiation oncologist, (2) preparation for the treatment, and (3) the actual treatment by use of a linear accelerator and performed by a technician.
All new patients require a first consultation and confirmation that radiotherapy is indicated before preparation for treatment and the actual treatment can start. Both types of patients use the same capacity for new patients at the OPD.
A certain percentage of follow-up patients receive re-treatment. Although this group is not relevant from an OPD perspective (because they use timeslots different from those of new patients), they are important because they use the same capacity for the preparation and treatment process.
The OPD is an appointment-based system with a first-fit algorithm for patients. The earliest moment a patient can be seen is the day after referral.
Because the actual treatment has to start within a limited number of days after the preparation is finished, the start of the preparation process depends on the available capacity of the linear accelerators. Another point is that due to the treatment offered, all treatment sessions have to be scheduled on consecutive days. The only interruption allowed in the treatment is during weekends. This also implies that treatment cannot start on Friday, because then the gap between the first and the second fraction is considered to be too long.
2.2.3 Capacity AnalysisA capacity analysis was performed to find the bottleneck(s) in different steps of the process. We analyzed the data concerning referrals, the capacity of the OPD, the duration of the preparation phase, the number of fractions needed, the duration of a treatment session, and the capacity of the linear accelerators. We used this information to calculate the utilization of each separate step.
The average access time for subacute patients and patients with other indications was 6 and 7 calendar days, respectively. The utilization of the OPD was high: an average of 32.5 new patients arrived per week and an average of 33.5 new patients could be seen. There were substantial fluctuations in demand and capacity: the number of referrals per week fitted to a Poisson distribution and the capacity for new
First Consultation
OPD
Radiation treatmentPreparation
29
REDUCE FLUCTUATIONS IN CAPACITY TO IMPROVE THE ACCESSIBILITY
patients in the OPD varied from 25 to 42 consultations per week. With a utilization of 97% and fluctuations in both demand and capacity, high access times were likely.
To verify that the preparation phase was not a bottleneck in the treatment process, we checked whether the capacity of the simulator and CT simulator were exceeded during the simulation. Other preparation phase activities – for example, determining the exact area to be treated and the correct dose fractionation – are performed by radiation oncologists and/or technicians and were not considered to be a bottleneck.
The total duration of the preparation of patients with other indications fitted a lognormal distribution (with a mean of 10 calendar days and 3 days standard deviation). For subacute patients, preparation was always finished within 2 days. The reason the preparation phase was short for subacute patients is that all these patients receive palliative treatment (for example, patients with bone metastasis, who are in severe pain) requiring only one or two radiation fractions, and the treatment planning is relatively simple. Also, the tumor is often superficial, so determining the exact area to be treated is less time consuming.
The three linear accelerators were available as scheduled (on average, 7140 minutes per week). The data showed that breakdowns rarely occur and regular maintenance of the machines (which are interchangeable) did not influence availability, so we assumed that both aspects have only a negligible effect on waiting time.
To determine the utilization for the linear accelerators, we divided the total demand by the scheduled availability of the linear accelerators. Including the follow-up patients who needed re-treatment, the average number of patients requiring starting treatment is 29.5 per week. Depending on the protocol, a patient needs 1 to 35 fractions of 10, 20 or 30 minutes per session; on average, a patient needs 224 minutes of radiotherapy treatment. This results in a total weekly demand of approximately 6,600 minutes, which leads to a utilization of 92.5%. The measured average waiting time between the preparation phase and the actual treatment was 3 days for subacute patients and almost 12 days for patients with other indications.
2.3 Modeling
As will be outlined in more detail below, a combination of methods was used:l Queuing theory to obtain insights into the underlying reasons for waiting times to
arise; l Computer simulation to (1) study these insights, (2) detect potential bottlenecks,
and (3) quantify the effect of adjustments.

30
CHAPTER 2
2.3.1 Queuing TheoryQueuing theory is an established mathematical discipline to explain and compute waiting times in service processes, (for example, within health care see Green et al. [16]), as based upon mathematical expressions (for example, appendices A and B). These expressions generally rely upon underlying assumptions: most notably, the number of capacity units is presumed to be fixed. Nevertheless, essential relations, such as the interrelationship of capacity and waiting times are more generally valid. For the strongly simplified situation of one capacity unit, this will briefly be clarified in the appendices. Nevertheless, for the complicated multi-step radiotherapy process, the same insights are still applicable. However, as exact formulas for a multi-step situation are no longer available, this has to be investigated by computer simulation.
2.3.2 Computer SimulationAccording to Shannon [17], computer simulation is the process of designing a model of a real system and conducting experiments with this model on a computer to gain insight into the system or to evaluate different strategies by means of numeric results and animation. Multiple types of computer simulation are used to analyze health care systems [18]. More specifically, to reduce waiting times for radiotherapy several articles have described the use of Monte Carlo simulation [1-3].
In discrete event simulation, the operation of a system is represented as a chronological sequence of events. Each event occurs at a particular moment and marks a change of state in the system. This means that time evolution is incorporated in a natural way. In contrast to discrete event simulation, the passage of time does not play a substantive role with Monte Carlo simulation. Therefore, Monte Carlo simulation is better suited to a waiting time analysis of the individual steps in the radiotherapy process than to analyzing the entire multi-step radiotherapy process. Monte Carlo has its limitations if quantitative analysis of the whole process is necessary. This is illustrated by Dickof et al. [6], who used three separate models to perform a quantitative analysis for all steps individually; however, all conclusions drawn for the entire process are of a qualitative nature. In order to analyze the total throughput time for a patient, we had to incorporate the complete process into a single model. Therefore, discrete event simulation is best suited to model this throughput time problem.
The simulation model was developed using MedModel simulation software and had to be validated to ensure that the simulation model would deliver accurate waiting time predictions for future scenarios. Validation is the process of determining whether a model is an accurate representation of the system for the particular objectives of the study [19]. The simulation model was validated successfully for both types of patients by comparing the results of the model with the actual data from current
31
REDUCE FLUCTUATIONS IN CAPACITY TO IMPROVE THE ACCESSIBILITY
practice. The differences with respect to the average and the 80th percentile of the waiting times were less than 10%.
After the input of the simulation model has been determined, the output gives an average percentage and confidence interval of patients with a waiting time less than or equal to the critical number of days (e.g., 7 days for subacute patients). To decide whether the throughput time target has been met, the lower bound of the 95% confidence interval must exceed the required percentage (in our case, 80% for both types).
2.4 Results
The simulation model was developed to obtain quantitative support and to compare different scenarios.
As shown in Figure 2.1, the radiotherapy process has three sequential steps: (1) the first consultation at the outpatient department, (2) the preparation, and (3) the actual treatment by use of a linear accelerator. For the different scenarios, OPD capacity and the number of linear accelerators could be altered.
2.4.1 Extra Linear AcceleratorThe radiotherapy department had already planned an extra linear accelerator to remove the presumed bottleneck in the process and to make sure performance targets would be met in the future. Therefore, we started the experimentation by adding a fourth linear accelerator without making any other adjustments to the validated model of the current situation. With four linear accelerators, fewer than 60% of the subacute patients started actual treatment within 7 days (see Table 2.2). Although performance for patients with other indications was better (73% start treatment within 21 days), the targets were not being met.
With the additional linear accelerator, the capacity in the last process step seemed to be sufficient so we did not try to optimize the planning of the linear accelerators. Instead, we focused on the first and second step in the radiotherapy process.
For patients with other indications the preparation time was relatively long (10 days on average) compared with the throughput time target of 21 days. However, because the preparation of subacute patients took less than 2 days, a reduction in preparation time was only feasible for patients with other indications. Nevertheless, a possible reduction for these patients will not lead to less pressure on OPD capacity, because the subacute patients are leading with regard to OPD capacity to reach its more stringent performance target. Only when both types of patients no longer share the same capacity in the OPD will reducing preparation time for patients with

32
CHAPTER 2
other indications lead to less pressure on OPD capacity. Therefore, we focused our attention on the outpatient department first.
2.4.2 Extra OPD CapacityA possible alternative solution to meet the performance targets was to increase OPD
capacity. In the original situation with three linear accelerators, 36 consultations per week were required to meet the throughput time target for the subacute patients. Unfortunately, the performance for patients with other indications was still not sufficient. Therefore, either the preparation time for patients with other indications should be reduced or the number of linear accelerators should be increased to four. Although a significant reduction of the preparation time for patients with other indications might be possible, we only explored the expansion of the number of linear accelerators because the department had already planned an extra linear accelerator.
Therefore, the scenarios following were simulated with four linear accelerators. A weekly capacity of 34 consultations was not sufficient to meet the performance targets. The throughput time targets for both types of patients were met with 35 consultations per week.
2.4.3 Variability Reduction in OPD CapacityIncreasing OPD capacity in combination with the four linear accelerators will ensure the performance targets are met in the future. Unfortunately, this is not a cost-effective solution. An alternative is to apply the variability reduction principle to OPD capacity. Because in practice there were substantial fluctuations in OPD capacity (between 25 and 42 consultations per week), which can be regarded as artificial variability [9], we also experimented with a more stable capacity so that
Table 2.2: Results of the various scenarios
Scenario Average weekly number of
consultations
Number of linear
accelerators
Variability in OPD capacity
% subacute patients within 7 days
% patients with other indications within 21 days
1 Current situation 33.5 3 Current 44% 39%
2 Extra linear accelerator 33.5 4 Current 58% 73%
3 Extra OPD capacity 36 3 Current 84% 61%
4 Extra OPD capacity 34 4 Current 79% 78%
5 Extra OPD capacity 35 4 Current 85% 92%
6 Variability reduction in OPD capacity
34 4 Half of current range 86% 90%
7 Variability reduction in OPD capacity
33.5 4 50% chance of 33 or 34 80% 90%

33
REDUCE FLUCTUATIONS IN CAPACITY TO IMPROVE THE ACCESSIBILITY
demand before preparation and actual treatment would be more evenly distributed (see Figure 2.2).
Simulation showed that by reducing the variance of OPD capacity for new patients to half of the current range (between 29 and 38 consultations per week, uniformly distributed), the throughput time targets will be met with only 34 consultations per week. Thus, the spare capacity needed to reach the throughput time targets with a relatively stable number of first consultations per week is 40% less (1.5 consultations in stead of 2.5 consultations per week) than with the current, highly fluctuating capacity in the OPD.
If the capacity was even more stable, an average weekly capacity of 33.5 consultations would be sufficient to meet the throughput time targets. In this situation, each week would have an equal chance of 33 or 34 consultations.
Table 2.2: Results of the various scenarios
Scenario Average weekly number of
consultations
Number of linear
accelerators
Variability in OPD capacity
% subacute patients within 7 days
% patients with other indications within 21 days
1 Current situation 33.5 3 Current 44% 39%
2 Extra linear accelerator 33.5 4 Current 58% 73%
3 Extra OPD capacity 36 3 Current 84% 61%
4 Extra OPD capacity 34 4 Current 79% 78%
5 Extra OPD capacity 35 4 Current 85% 92%
6 Variability reduction in OPD capacity
34 4 Half of current range 86% 90%
7 Variability reduction in OPD capacity
33.5 4 50% chance of 33 or 34 80% 90%
Figure 2.2: Level of fluctuations in the number of patients per week

34
CHAPTER 2
With the current fluctuations in capacity, the variance in the number of patients per week was even greater after the OPD than before. Figure 2.3 shows that large fluctuations in the weekly number of consultations could add as much as 2 days to the average waiting time before preparation.
Remark
We applied the variability reduction principle to OPD capacity and did not discuss the application of the principle to the demand and duration of a first consultation. The weekly number of new patients was considered to be an external factor that could not be influenced. Additionally, fluctuations in the actual duration of a consultation were small and no sub-activities were found that could be reallocated.
2.5 Discussion
The first objective of our study was to analyze which aspects of the process were responsible for preventing the department from meeting the throughput time targets. With the scheduled extra linear accelerator, the radiotherapy department expected that the throughput time targets would be met in the future, but this was not the case. The simulation model indicated that OPD capacity was an important additional reason that the targets were not met.
In the original situation with three linear accelerators, 36 consultations per week were required to meet the throughput time target for the subacute patients.
Figure 2.3: Effect of fluctuations in OPD capacity on the waiting time before preparation

35
REDUCE FLUCTUATIONS IN CAPACITY TO IMPROVE THE ACCESSIBILITY
Unfortunately, the performance for patients with other indications was not sufficient. Therefore, either the preparation time for patients with other indications should be reduced or the number of linear accelerators should be increased to four. Although a significant reduction of the preparation time for patients with other indications might be possible, we only explored the expansion of the number of linear accelerators because the department had already planned an extra linear accelerator. With four linear accelerators and 35 consultations per week, the throughput time targets were met for both types of patients.
A cost-effective alternative for increasing OPD capacity is to reduce the substantial fluctuations in this capacity, for example reducing the fluctuations in capacity by 50% will save one consultation per week. Our results demonstrate that a reduction of this artificial variability [9] will lead to lower throughput times, because in addition to lower access times, the waiting times before the subsequent steps in the process, namely the preparation and actual treatment, will decrease as well. An explanation for this phenomenon is that if the utilization rate of the OPD is high, a more stable OPD capacity will decrease the fluctuations in the weekly number of patients arriving before the preparation and actual treatment. As by Kingman [8] this will lead to lower waiting times before the preparation and actual treatment (see Appendix A for the formulas).
2.5.1 How to Reduce Variability in OPD Capacity in Practice?The reason for such substantial fluctuations in OPD capacity was the department’s reactive strategy. In practice, the number of first consultations for new patients in the OPD was only increased when the waiting time was far above the target level for a considerable period. To reduce the increased access times, capacity was raised substantially for a short period. This resulted in a high variability in OPD capacity.
To be able to act proactively instead of reactively, an overview of the total number of consultations for new patients per week for the coming quarter has been introduced. All national holidays, physicians’ vacations, and otherwise cancelled consultations are incorporated into the overview so that management can see in advance when OPD capacity will be too low. Because this information is available a few months before the week in question, management has enough time to compensate for the anticipated temporary insufficient capacity.
Some suggestions are: a national holiday should be compensated directly during the other days of that specific week. To spread the workload better, the follow-up patients can be scheduled in the week before and after a week with a national holiday, so that doctors have more time to see new patients. Management can also ensure doctors spread their own holidays more evenly to prevent sharp declines in capacity. By introducing a backup consultation per doctor, the capacity can be

36
CHAPTER 2
increased easily if the available, future capacity was expected to drop below a certain threshold value.
2.5.2 ConclusionA combination of queuing theory and computer simulation was used. Computer simulation to find the bottlenecks in the multi-step radiotherapy process and to quantitatively compare the alternative solutions to reduce the throughput times efficiently. Queuing theory to provide the insight of variability and some supportive formula.
Despite, the investment in an additional linear accelerator to remove the presumed bottleneck, the throughput time targets were still not met. The simulation model indicated that the capacity of the outpatient department had to be increased. A combination of increased OPD capacity and a reduction of the preparation time for patients with other indications, would probably be sufficient to meet the performance targets for both types of patients. Although this suggests that the additional linear accelerator might not have been necessary after all, we continued our experimentation with an fourth linear accelerators as it was already purchased.
Furthermore, to include the dynamic interaction between the different steps of the process, all three steps in the radiotherapy process were incorporated into one discrete event simulation model. This enabled to quantify the effect of the substantial fluctuations in OPD capacity on both access times in the OPD and waiting times before preparation and actual treatment. Our radiotherapy case study has shown that a lower variability in the weekly number of consultations in the OPD did result in a considerable reduction in throughput times. Variability reduction in OPD capacity thus appeared more cost-effective than just adding more capacity to ensure the performance targets would be met in the future.
This new insight seems to be of interest for other radiotherapy departments as well as to other situations with dynamic interaction between the consecutive steps.
Acknowledgements
The authors are grateful to Mr B. Marijt, Mr M. Van der Ouderaa, and Dr M. Hulshof of the radiotherapy department at the AMC for their collaboration during the project. The authors would also like to thank Ms D. Constant of the Team Innovation and Process Management at the AMC for her contribution to the study.

37
REDUCE FLUCTUATIONS IN CAPACITY TO IMPROVE THE ACCESSIBILITY
Appendix A: Queuing formula on variability in demand and process times
In this appendix the queuing formula to explain the relationship between waiting times and variability in demand (and process times) is described.
Step 1: Variability in service times The Pollaczek-Khintchine formula [7] expresses that the average waiting time of
a system with fluctuations in the service times (general distribution) is a function of the variation coefficient of the service times (the standard deviation divided by the mean) and the average waiting time with fixed service times. This formula is scientifically correct for a single capacity unit.
(1) WM|G|1 = (1 + cs 2) * WM|D|1 with cs the variation coefficient of the service time
distribution.
This formula proves that a lower variance in the service time distribution leads to a reduction in the average waiting time. The average waiting time of a system with exponential service times (cs
= 1) is twice the average waiting time with fixed service times (cs
= 0).
Step 2: Variability in arrivalsKingman [8] expanded the Pollaczek-Khintchine formula as an approximation
of the average waiting time for a system with generally distributed service times and generally distributed interarrival times. He assumes that the randomness of the interarrival process has the same effect on the mean waiting time as does the randomness in the service times.
(2) WG|G|1 ≈ (ca 2 + cs
2) * WM|D|1 with ca the variation coefficient of the interarrival time.
Again, a reduction in the fluctuations of the number of arrivals and/or the service times will lead to a decrease in waiting times.
Note that with exponentially distributed interarrival times, Kingman’s formula decreases to the Pollaczek-Khintchine (ca = 1).

38
CHAPTER 2
Appendix B: Queuing formula on variability in capacity
In this appendix we use queuing theory to quantitatively explain why the access times decrease if the fluctuations in OPD capacity are reduced.
Preferably, we would experiment with the distribution of the capacity directly to show the effect of more variability in capacity. Unfortunately, because no queuing formula is available to support this type of experimentation, we have to use an indirect way to generate variability in capacity by a priority queuing example.
Priority queuing is a specific category of queuing models (e.g. [20, 21]). A priority queuing system has multiple queues that contain jobs of a certain priority and all types of jobs are served by the same capacity units. Jobs with higher priority are served first, which makes priority queuing suitable for modeling resource vacations and breakdowns. The priority model used by D’Antone [15] is suitable for modeling fixed process times and fluctuating capacity simultaneously, as is the case in our radiotherapy OPD. The vacations, breakdowns, or cancellations are modeled as jobs with high priority and the patients as jobs with low priority. Both types of jobs are handled by the same single server.
In the practical situation, the maximum weekly capacity was 42 consultations. Simulation shows that on average 35 consultations are necessary to meet the throughput time targets. This indicates that on average 7 consultations are cancelled each week, which can also be seen as vacations or breakdowns. The average waiting time for patients (W2) can be calculated by formulas:
(3)
(4)
In these equations, N is the number of priority classes, λi represents the arrival rates of jobs with priority i, si represents the mean service time 1/μi of jobs with priority i, and ∑ =
=i
k ki 1ρσ is the utilization of the server by customers of priority 1-i.
We will apply these formulas to evaluate three scenarios with an equal effective utilization for patients but with varying level of fluctuations in OPD capacity. A higher number of cancelled consultations (λ1) results in more fluctuations in the effective number of consultations for patients. Note that ρ2 is not the effective utilization for patients, because the effective capacity for patients is 35 consultation in all scenarios (and thus the utilization is 32.5/35 = 0.93 in all three scenarios).
)1)(1( 1
0
−−−=
iii
WW
σσ with
∑ ==
N
i iisW1
20 2/1 λ

39
REDUCE FLUCTUATIONS IN CAPACITY TO IMPROVE THE ACCESSIBILITY
a. The original situation with 7 cancelled consultation per week results in an average waiting time of 0.23 weeks for patients (see Table 2.3).
b. If the weekly number of cancelled consultations is halved, the average waiting time for patients is almost 9% lower than in the original situation.
c. For the situation without any cancellations, D’Antone’s formula can be applied with λ1 = 0, but the standard queuing formula for an M|D|1 system is also suitable. Compared to the original situation, the reduction in average waiting time is 18%.
These queuing results show that reducing fluctuations in OPD capacity also reduces the access times.
Table 2.3: Average waiting time for patients with varying level of fluctuations in OPD capacity
Scenario N λ1 λ2 ρ1 ρ2 s1 = s2 W2
A 2 7 32.5 jul-42 32.5/42 jan-42 0.23
B 2 3.5 32.5 3.5/38.5 32.5/38.5 1/38.5 0.21
C 2 0 32.5 0 32.5/35 jan-35 0.19

40
CHAPTER 2
References 1. Thomas SJ, Williams MV, Burnet NG, Baker CR (2001) How much surplus capacity is
required to maintain low waiting times? Clin Oncol 13:23–28.
2. Munro AJ, Potter S (1994) Waiting times for radiotherapy treatment: not all that mysterious and certainly preventable. Clin Oncol 6:314–318.
3. Thomas SJ (2003) Capacity and demand models for radiotherapy treatment machines. Clin Oncol 15:353–358.
4. Delaney GP, Gebski V, Lunn AD, Lunn M, Rus M, Manderson C, Longlands AO (1997) Basis treatment equivalent (BTE): a new measure of linear accelerator workload. Clin Oncol 9:234–239.
5. Williams MV, Summers ET, Drinkwater K, Barrett A (2007) Radiotherapy dose fractionation, access and waiting times in the countries of the UK in 2005. Clin Oncol 19:273–286.
6. Dickof P, Firth A, Foord C, Lusk V (2001) Managing radiation therapy queues. Curr Oncol 8:125–149.
7. Pollaczek F (1957) Problèmes stochastiques posés par le phénomène de formation d’une queue d’attente à un guichet et par des phenomenes apparentés. Gauthier Villars, Paris.
8. Kingman JFC (1962) Some inequalities for the queue GI|G|1. Biometricka 49:315–324.
9. Litvak E, Long MC (2000) Cost and quality under managed care: Irreconcilable differences? Am J of Manag Care 6(3):305–312.
10. Litvak E, Buerhaus PI, Davidoff F, Long MC, McManus ML, Berwick DM (2005) Managing unnecessary variability in patient demand to reduce nursing stress and improve patient safety. Jt Comm J on Qual and Patient Saf 31:330–338.
11. Lynk WJ (1995) The creation of economic efficiencies in hospital mergers. J of Health Econ 14:507–530.
12. Baker LC, Phibbs CS, Guarino C, Supina D, Reynolds JL (2004) Within-year variation in hospital utilization and its implications for hospital costs. J of Health Econ 23:191–211.
13. Elkhuizen SG, Van Sambeek JRC, Hans EW, Krabbendam JJ, Bakker PJM (2007) Applying the variety reduction principle to management of ancillary services. Health Care Manag Rev 32(1):37–45.
14. Strum DP, May JH, Sampson AR, Vargas LG, Spangler WE (2003) Estimating times of surgeries with two component procedures: Comparison of the lognormal and normal models. Anesthesiol 98:232–240.
15. D’Antone I (2000) Pipeline length optimization in a digital asynchronous trigger controller. Nucl Instrum and Method in Physics Res Sect A 451:439–448.
16. Green LV, Soares J, Giglio JF, Green RA (2006) Using Queuing Theory to Increase the Effectiveness of Physician Staffing in the Emergency Department. Acad of Emerg Med 13 (1):61–68.
17. Shannon RE (1975) Systems Simulation: The Art and Science. Prentice-Hall, Englewood Cliffs, NJ.
18. Brailsford SC, Harper PR, Patel B, Pitt M (2009) An analysis of the academic literature on simulation and modelling in health care. J of Simul 3: 130–140.
19. Fishman GS, Kiviat PJ (1968) The statistics of discrete-event simulation. Simul 10:185–195.

20. Jaiswal N (1968) Priority Queues. Academic Press. New York and London.
21. Doshi BT (1986) Queueing system with vacation – A survey. QUESTA 1:29-66.

Passengers waiting in front of the economy class desk while the business class desk is idle
“Everything should be made as simple as possible, but not simpler.” Albert Einstein

3CHAPTER
To pool or not to pool in hospitals: A theoretical and practical comparison for
a radiotherapy outpatient department
P.E. JoustraE. van der Sluis
N.M. van Dijk
Annals of Operations Research 2010;178:77-89

CHAPTER 3
44
Abstract
This paper examines whether urgent and regular patients waiting for a consultation at a radiotherapy outpatient department should be pooled or not. Both queuing theory and discrete event simulation were applied to a realistic case study. The theoretical approach shows that pooling is not always beneficial with regard to the waiting times of urgent patients. Furthermore, the practical approach indicates that the separation of queues may require less capacity to meet the waiting time performance target for urgent as well as regular patients. The results seem to be of general interest for hospitals.

TO POOL OR NOT TO POOL IN HOSPITALS
45
3.1 Introduction
In service practices, the general perception appears to exist that it would be better to merge two (or multiple) queues into a single one, in order to use capacities more efficiently. Indeed, when only one type of service is involved this would be likely. In such an instance, in a single line system, none of the servers can ever be idle when tasks (e.g., patients) to be handled are still waiting. This observation is also supported by the standard M/M/s queuing formula for mean delays; see for instance Tijms [1] and Cooper [2]. In other words, for systems with one type of service, pooling capacities is clearly a superior strategy in terms of waiting time performance and/or the total capacity required.
However, if two or more different service types are involved, the question of whether capacities (or rather queues) should be pooled – assuming that the servers can handle the different service types – is less obvious and remains to be questioned for either of two reasons:1. Different service characteristics (mix ratio);2. Different service targets (workload ratio)
3.1.1 Mix ratioFor the first situation (reason), by pooling servers, variability is introduced due to the mix ratio of different means. As essentially based upon Pollaczek-Khintchine’s formula, this can have a negative effect. The situation involving two single servers has already been addressed along with counterintuitive examples and analytic results in Whitt [3] and Wolff [4]. A more extensive analytic and numerical treatment of this counter-intuitive phenomenon can be found in Whitt [5]. And more recently, in Van Dijk and Van der Sluis [6], it was numerically shown and supported by approximate queuing formula that even for substantially larger numbers of servers it could still be advantageous (say in terms of mean waiting time) to keep capacities and queues separate.
3.1.2 Workload ratioThe present paper, in contrast, focuses purely on the second situation (reason) involving different service targets. There are two types of service requests with the same duration but with different waiting time performance targets.
3.1.3 Practical motivation (Radiotherapy)In practical terms, this second situation concerns hospital patients who require a consultation at a radiotherapy outpatient department. The consultations are

CHAPTER 3
46
stochastically identical for all patients. However, two types of patients are to be distinguished:
Type 1: (a small percentage of) urgent (or subacute) patients with a high performance target;
Type 2: (a large percentage of) regular patients with a substantially lower target.
The performance target is in terms of waiting time percentiles: namely a certain percentage within a given time. In hospitals, the different performance targets may follow from different recovery and quality criteria as well as financial agreements with insurance companies or rules set by the Ministry of Health. Due to these different performance targets, a separation of capacities might still be preferable, otherwise one group (typically the large group of regular patients) might be forced to pay a price to meet a higher target for the other group. A trade-off may thus have to be made.
Thus far, this second rationale for separate rather than pooled capacities seems to have remained uninvestigated within the queuing literature and has also not been covered in Van Dijk and Van der Sluis [6]. In health care literature, as will be specified in more detail later, it has been partially addressed in recent papers (see [7-9]). This paper, therefore, has a threefold objective.
3.1.4 Objectives1. To investigate whether this second trade-off question of pooling is relevant
from at least a queuing theoretical point of view for performance (waiting time) improvement;
2. If so, whether the performance (waiting time) improvement can also be obtained at the practical level such as in radiotherapy departments within hospitals, as based upon computer simulation for a case study;
3. If so, to what extent can the observation be applied to reduce capacities within radiotherapy departments.
3.1.5 Outline and resultsFirst, in Section 2, a purely queuing theoretic approach is taken by means of a simple but instructive exponential parallel server system to obtain essential insights. By standard queuing formula, it is shown that trade-off points exist to keep the servers separated, depending on workload ratios. Even for this simple case, in the queuing literature no such result seems to have been reported as being of interest in itself.
Next, in Section 3, it is investigated to what extent such trade-off points can also be found in a realistic hospital environment. A case study is therefore included for

TO POOL OR NOT TO POOL IN HOSPITALS
47
the radiotherapy outpatient department of the Academic Medical Center (AMC) in Amsterdam, The Netherlands. As queuing formulas are no longer available in the more complex situation of the case study, discrete event simulation is used. Furthermore, for their practical interest in this case study a capacity viewpoint was adopted. It is shown that, also in the practical setting of the case study, it can be advantageous to keep capacities for different patient groups separate, as it may lead to an effective reduction of spare capacity. In section 4, additional different scenarios were studied for their practical interest. A discussion completes this paper, which includes a brief evaluation, a review of the health care literature, and conclusions.
3.2 Queuing insights
Pooling two separate queues is generally perceived to be efficient. Indeed, when two separate queues for one type of service and two separate servers are pooled into a single queue for both servers, neither of the two servers can ever be idle while a customer is still waiting. Pooling thus seems to be the ultimate in efficiency.
More precisely, with WP and WA the mean waiting time (excluding service time) for the pooled and separate case, τ = 1/μ, and ρ = λ/μ the traffic load per server, by straightforward calculations from standard M/M/1 and M/M/2 expressions, pooling two parallel exponential servers would lead to a reduction factor of at least 50% (since ρ < 1) for the mean waiting time as by
(1)
This reasoning, however, relies upon the implicit assumption that two identical servers, or rather identical service characteristics, have identical loads.
In Van Dijk and Van der Sluis [6] it was shown by an approximate formula that similar reduction factors of at least 50% can also be found for larger groups of servers to be pooled provided: l the service characteristics (mean durations) are the same; l the workloads are equal.
3.2.1 Different performance targetsThis paper considers another possible reason to keep queues separate: different performance targets in terms of waiting times. When pooling two patient groups, say for urgent and regular patients, all patients have to meet the high performance target for urgent patients. With separate queues, one can distinguish the urgent patient so that the regular patients do not have to meet the high performance target. This may save capacity, although the combined effect cannot be predicted.
2 2/(1 ).
/(1 ) 1τ ρ ρ ρτ ρ ρ ρ
−= =
− +WW
P
A

CHAPTER 3
48
It is conceivable that a combination of performance targets for urgent and regular patients exists where separate queues would still be beneficial. First, this trade-off question was studied by a standard queuing formula for three reasons: 1. to illustrate the problem, 2. to theoretically prove that separate queues can be beneficial and 3. as it seems to have remained uninvestigated within the queuing literature, even with a standard queuing formula. This is not obvious, as the efficiency benefit of pooling capacity as seen in may not exceed the efficiency loss, as a higher target is then
Figuur 3.1: Representation of situations
also required for elective patients. To make a fair comparison, it is assumed that the service durations are identical (as is also the case in the practical AMC radiotherapy case study).
In our situation, a strict performance target for type 1 customers must be met, while type 2 customers are required to meet a substantially lower target. To this end, consider the situation involving two customer arrival streams with the same exponential service times with parameter μ, but different arrival rates λ1 and λ2, with λ1 < λ2, hence ρ1 (= λ1 / μ) < ρ2 (= λ2 / μ). Two situations are compared. In situation 1 (separated case), each customer stream has its own single server. In situation 2 (pooled case), the two streams are merged into a single stream with a double server (see Figure 3.1).
3.2.2 Waiting timesLet:
Wi (Wi) : the (expected) waiting time of customer type i (i = 1, 2) for the
separated case;
WP (WP) : the (expected) waiting time for the pooled case.
Bold letters are used for expectations (as already used in the previous section). Clearly, by the implicit assumption that λ1 < λ2:
λ1 μ
λ2 μ
Situation 1(λ1< λ 2)
λ1+ λ2
μ
μ
Situation 2(M/M /2)

TO POOL OR NOT TO POOL IN HOSPITALS
49
W1 < W2
With pooling, type 2 customers will experience shorter waiting times. The average waiting time for all customers can also be expected to decrease, as the workload is balanced over two servers and because of the pooling factor ρ/(1+ ρ) as in. The effect of pooling for the type 1 customers is less clear. On the one hand, having two servers available may lead to shorter waiting times; on the other hand, the overall workload becomes larger than for just the type 1 server.
Type 1 customers will not benefit from pooling when the expected waiting time WP for the pooled system with average workload ρ exceeds the expected waiting time W1 for the type 1 customers with workload ρ1 in situation 1. In formula, by standard M/M/1 and M/M/2 expressions with ρ = (ρ1+ ρ2)/2:
(2)
Here it is noted that (1) does not apply, as ρ1 ¹ ρ2 ¹ ρ. It is easy to see that inequality (2) holds for:
(3)
From this inequality, trade-off values for ρ1 and ρ2 can be computed which lead to equality in (2) and (3), as illustrated in Figure 3.2. Pooling two single servers is thus not always beneficial for all customers. For ρ2 sufficiently large and ρ1 sufficiently small, it is thus recommended not to pool.
1
21
211 (1 )
ρ ρτ τρ ρ
≤
≤− −
W WP
1 2 1 12ρ ρ ρ ρ ρ≥ ⇒ ≥ −
Figure 3.2: Trade-off lines
0.0
0.2
0.4
0.6
0.8
1.0
0.0 0.2 0.4 0.6 0.8 1.0
Wp = Wa Pwait>0 Pwait>tau
`
WP = W1
P {WP > 0} = P{W1 > 0} P {WP > τ } = P{W1 > τ }
→ ρ1
ρ2
↑
Pool
Separate

CHAPTER 3
50
3.2.3 Excess waiting time probabilities In practice (particularly in health care), excess or tail probabilities are often used as a performance measure instead of average waiting times. With W1 the waiting time of type 1 customers in the separated case and WP the waiting time in the pooled case, for given value t the waiting time tail probabilities become:
(4)
For t = 0 the comparison leads to comparing the probability for having to wait P(W > 0). For type 1 customers, the waiting probability will increase by pooling if:
(5)
Hence, after some manipulations, pooling is no longer useful for type 1 customers if:
(6)
Similar relations exist for tail probabilities P{W > t} for other values t. For example, taking t = τ (with τ the mean service time) and using the performance measure P{W > τ}, pooling is not beneficial for customers of type 1, when:
(7)
Unfortunately, this does not lead directly to an analytical expression for ρ or ρ2. However, values for which equality in (7) holds are easily found by using a search or goal-seek procedure.
In Figure 3.2, the trade-off lines are sketched where the inequalities (3), (5), and (7) hold with equality. A trade-off line indicates a combination of ρ1 and ρ2 where the pooled and separate situations perform equally for type 1 patients. For any combination of ρ1 and ρ2 in the area above these lines, separation of queues is beneficial for urgent patients.
The upper-left area, hence with a high ρ2/ρ1 -workload ratio, for which it is preferable to keep capacities separate, typically seems to be applicable for practical situation as described by the practical motivation.
2
1
2(1 )ρ ρρ
≥+
≥ + + ⇒ ≥ + −( )2 21 1 1 2 1 1 1ρ ρ ρ ρ ρ ρ ρ ρ8 / 4 ½ 8 ½
1
2(1 )2(1 )
12
(1 )ρρρ ρ
ρ− −− − ≥
+e e
1(1 )1 1
22 (1 )
{ }
2{ } .
(1 )
µ ρ
µ ρ
ρ
ρρ
− −
− −
> =
> =+
P
P
t
tP
W t e
W t e

TO POOL OR NOT TO POOL IN HOSPITALS
51
3.3 A practical case study for radiotherapy
The research for this paper was motivated by the radiotherapy department at the Academic Medical Center (AMC) in Amsterdam, The Netherlands. In this section, therefore, it will be investigated to what extent the theoretical findings of the previous section are applicable to a practical situation and to decide whether the management of the AMC radiotherapy department should keep the capacity pooled.
3.3.1 Case dataThe radiotherapy treatment process consists of three consecutive steps: 1. a first consultation, 2. a preparation phase, and 3. an actual treatment. This study exclusively concerns the first step, the outpatient department. Currently, a small
Table 3.1: Performance targets
Type % Referrals Performance target
1 10% 80% < 5 days
2 90% 80% < 9 days
group of urgent patients and a large group of elective patient use the same first consultations. Hence, the capacity is pooled.
The real data of the demand and the available capacity for first consultations of new patients at the AMC radiotherapy department was obtained from the AMC planning system. The arrival pattern of referrals – based upon data from January to May 2006 – fits a Poisson distribution with on average 32.5 patients per week. In the specified period, on average 10% of the referrals are urgent patients and the remaining 90% are elective/regular patients (see Table 3.1). The performance target indicates that 80% of the urgent patients need to have their first consultation within five calendar days after the date of referral. For regular patients the critical value is nine calendar days. These performance targets for the outpatient department are based upon the targets set by the Dutch Society of Radiotherapy and Oncology.
The capacity is not stable but fluctuates heavily between 25 and 42 appointments a week (such as due to national holidays, attendance at conferences, part-time work, and illness of physicians). The daily number of consultations fits a Poisson distribution (6.635 consultations on average). Both the number of referrals and the number of consultations fit a Poisson distribution. Although the fit is correct, the use of the Poisson distribution implies that both the number of referrals as well as the number of consultations is independent for subsequent days. For the referrals, this independency seems to be a justifiable assumption, but for the consultations it is not. The absolute effect is hard to predict, but as the Poisson distribution was used for the pooled situation as well as the separate queues situation, we assumed this

CHAPTER 3
52
does not influence the outcome of our trade-off question. Furthermore, the effect of the fluctuating capacity on the waiting times is too large to be neglected, so this aspect in the trade-off question had to be incorporated.
Regardless of the type of patient, the scheduled length of time for the first consultation is one hour. Currently both types use the same timeslots at the outpatient department, so in practice both queues are pooled.
Capacity
In practice, the management of the AMC radiotherapy department is only willing to split capacities if it will result in a capacity reduction. Therefore, next to waiting times the minimal required capacities will also be compared.
The available capacity was specified on a daily basis. For the pooled situation, the minimum expected number of daily consultations (the Poisson parameter) is determined up to a decimal fraction (e.g., 6.9 or 7.3) in order to meet the urgent performance target for all patients. For the separated case, the total number of consultations was sampled from a Poisson distribution in the same way as the pooled case. In the simulation, this randomly selected daily capacity was divided among the urgent and regular patients by first subtracting the urgent capacity. The remaining number of consultations was dedicated to regular patients. The decimal fraction of the urgent capacity was sampled from a Bernoulli distribution (e.g., with capacity 2.3, two consultations are always available and with a 30% chance a third consultation will be added). This is necessary because the randomly selected number of consultations for urgent patient has to be an integer. The minimum daily number of consultations for urgent patients, in contrast, is determined up to a decimal fraction.
3.3.2 Simulation To determine whether the management of the AMC radiotherapy department should keep the capacity pooled, discrete event simulation was used to include the combination of:l fluctuating capacities (number of consultations) and l waiting time percentiles.
Due to the combination of both aspects (essential for our practical case study), queuing formulas are no longer available. Nevertheless, as well as for the qualitative behavior, the results from Section 2 were most useful to ascertain the existence of trade-off points and when to expect them.
Our system can be classified as a non-terminating simulation (see [10]). Although the system restarts every day – which is typical for a terminating simulation – on the scheduling level the queue of patients waiting for the first consultation connects the individual days. Additionally, our aim was to investigate the long-term behavior of

TO POOL OR NOT TO POOL IN HOSPITALS
53
the system in terms of waiting time performance (in calendar days), which is typical for a non-terminating system.
For a non-terminating system, several methods of design of experiments are available. The replication/deletion approach [10] was selected. To solve the problem of the initial transient, a warm-up period was included. Output statistics are only gathered after the warm-up period is over.
To determine the warm-up period (ten weeks of seven days with eight hours each), the method developed by Welch [11] was used. The run length (including the warm-up period) was set to 50 weeks and the number of replications, based upon a desired half-width of 5% for the 95% confidence interval, was set to 200. To evaluate the performance of a scenario, a confidence interval had to be set up for the percentage of patients that meets the critical value. For the simulation, the performance target is supposed to be met when the lower bound of the confidence interval exceeds the target level of 80%.
After the design of experiments was completed, the simulation model was validated to check whether our model represents practice sufficiently accurate for the purpose at hand [12]. For the actual validation, the basic inspection approach [10] was selected to compare the average waiting time of the simulation model with the real average waiting time of the AMC radiotherapy outpatient department. The average waiting time of the simulation model (7.3 calendar days) was almost equal to the actual average waiting time (7.2 calendar days) based upon data of the AMC planning system for the period January to May 2006. Therefore, our simulation model was considered to be valid and useful to evaluate the trade-off question in different scenar
3.3.3 Current scenarioAs a first scenario, the current situation was executed. In the pooled situation, 35.5 consultations a week are necessary to meet the performance target for all patients. Note that all patients have to meet the high performance target for urgent patients (80% of the patients need to have their first consultation within five calendar days after the date of referral).
The situation of two separate queues also required a weekly capacity of 35.5 visits in order to meet the performance targets from Table 3.1. This may seem surprising but in Section 2 the existence of trade-off points (in terms of waiting times) were already proven with queuing theory. Coincidentally, the current practical situation is a trade-off point in terms of required capacity. However, in line with the theoretical results in Section 2, with equal capacities of 35.5 consultations a week, the separate and pooled situation yield
W1 = 3.2 < WP = 3.8 (8)

CHAPTER 3
54
In other words, for the realistic AMC case and from the point of view of inequality (2), the capacities should be separated. And indeed, this conclusion corresponds to inequality (3), as ρ1 = 65.0% and ρ2 = 96.3%.
Furthermore, in the pooled situation on average 82% of the patients will have a first consultation within five calendar days. In the situation with separate queues, 91% of the urgent patients will have a first consultation within five calendar days and 84% of the regular patients will have a first consultation within nine calendar days. Hence, for the service levels (SL):
SL1 = P{W1 < 5 days} = 91% > P{WP < 5 days} = 82% = SLP (9)
SL2 = P{W2 < 9 days} = 84% > P{WP < 5 days} = 82% = SLP
For the current scenario with unchanged capacities, separate queues will thus lead to higher percentages of patients who meet their critical value of the performance targets. Also in this respect, keeping the capacities separate can thus be regarded as superior, in accordance with Section 2.
3.4 Other scenarios
3.4.1 Performance target The current critical values of the performance targets (five days for urgent patients and nine days for regular patient) lead to equal capacity requirements for both situations. This combination of critical values can be regarded as a trade-off point in terms of capacity. In line with Section 2, it should be possible to determine a trade-off line for the AMC radiotherapy department similar to the trade-off lines based upon queuing theory (see Figure 3.3). To determine the trade-off point in terms of utilization rates ρ1 and ρ2, the utilization rates for urgent and regular patients were calculated in the separate queues situation. The utilization rate is the average weekly number of referrals of the corresponding patient type divided by the weekly minimum number of consultations required to meet the corresponding performance target (e.g., ρ1 = 3.255/5 and ρ2 = 29.295/30.5 for the current scenario).
Different combinations of critical values in terms of days of the performance target for urgent and regular patients were simulated to find other trade-off points in terms of equal capacity requirements for the pooled and separate queues situation (see Table 3.2).
Note that the three-day performance target is the most stringent, as referrals on Friday are not scheduled before the following Monday. The graph displayed in Figure 3.3 shows the trend-line through the trade-off points displayed in Table 3.2.

TO POOL OR NOT TO POOL IN HOSPITALS
55
Again, for any combination of ρ1 and ρ2 in the area above the trade-off line, the separation of queues is beneficial. This implies that, starting from a trade-off point, a smaller ρ1 (and thus a higher performance target/lower critical value for the performance level of urgent patients) or a larger ρ2 (and thus a lower performance target/higher critical value for the performance level of elective patients) is a plea for separate queues. Figures 3.2 and 3.3 clearly show that the theoretical and practical trade-off lines have a similar shape. Without Figure 3.2 for the theoretical case, Figure 3.3 would not have been found.
As a special application, to make the trade-off for the AMC radiotherapy department more explicit, different critical values (days) for urgent patients were evaluated, while the critical value for regular patients was kept to 9 days.
The results in Table 3.3 are the total number of consultations required for the pooled and separated situation in order to meet the performance targets. These results indicate that pooling capacity is no longer beneficial for an urgent performance target of 80% within five days or less. For a three-day performance target for urgent patients, a separation of the patients will reduce the required spare capacity from (39 – 32.5 =) 6.5 to (36 – 32.5 =) 3.5, which is a reduction of nearly 50%. Such a reduction of spare capacity is significant in health care organizations. Hospital departments
Table 3.2: Trade-off point AMC radiotherapy department
Critical value (days) for urgent patients
Critical value (days) for regular patients
Urgent capacity
Regular capacity
Total capacity
9 12 4 30 34
6 12 4.5 30 34.5
5 9 5 30.5 35.5
4 7 5.5 31 36.5
3 4 6 33 39
0
0.2
0.4
0.6
0.8
1
0 0.2 0.4 0.6 0.8 1Utilization rate of urgent consultations → ρ1
ρ2
↑
Uti
lizat
ion
rate
of
regu
lar
co
nsul
tati
ons
Pool
Separate
Figure 3.3: Trade-off line for AMC radiotherapy department

CHAPTER 3
56
Table 3.4: Patient-mix scenario
Percentage of urgent patients 5% 10% 15% 20%
Regular capacity 32 30.5 29 27
Urgent capacity 3.5 5 6.5 8.5
Total capacity 35.5 35.5 35.5 35.5
are generally efficiency driven and, accordingly, strive for a minimization of scarce capacity, e.g. physicians.
3.4.2 Patient-mix One might expect that the smaller the fraction of the urgent group, the more separation of capacity might become advantageous. However, as it turns out for the case study, regardless of the percentage of urgent patients, in total 35.5 consultations are needed to meet the performance targets for both groups (see Table 3.4). Remarkably, changes in urgent capacity are matched exactly by changes in regular capacity. In this case study, the simulation model clearly shows that the trade-off question does not depend on the percentage of urgent patients. This observation is likely to be explained by the high workload for the majority of patients (the group of regular patients).
Table 3.3: Performance target scenario
Critical value for urgent patients
9 days 8 days 7 days 6 days 5 days 4 days 3 days
Pooled situation 34 34 34 34.5 35.5 36.5 39
Separate queues 35 35 35 35 35.5 35.5 36
3.4.3 Economy of scale The radiotherapy department has a relatively small outpatient department compared with other departments. To analyze the effect of economy of scale, a larger OPD with four times more referrals was simulated.
With the current performance targets, a separation of the groups saves half a consultation per week (see Table 3.5). For the more stringent targets, the benefit of two separate queues is identical, as in the situation of a small outpatient department. The economy of scale does not seem to play an important role in the trade-off question. Again, as in Section 4.2, this observation seems related to the high workload involved in the present case study.

TO POOL OR NOT TO POOL IN HOSPITALS
57
Table 3.5: Economy of scale scenario
Critical value urgent patients 5 days 4 days 3 days
Pooled situation 133 133.5 137
Separate queues 132.5 133 134.5
Table 3.6: Jockeying scenario
Strategy Required capacity
Pooled queue 35.5
Separate queues 35.5
Separate queues with jockeying 33.5
3.4.4 Soft blocks or jockeying Soft blocks indicate that every group has a dedicated capacity but that in special cases a patient of one group can be scheduled in the other block. In our case, a regular patient may use an urgent timeslot when it is not occupied by an urgent patient one day before. In queuing theory, this strategy is also known as one-way-jockeying. Because the utilization rate of the urgent timeslots will be relatively low, this will probably lead to a decrease in the regular capacity required without affecting the urgent patients significantly.
Indeed, the results in Table 3.6 clearly show that jockeying reduces the required capacity to 33.5 consultations per week. With the current performance targets, this strategy potentially saves two consultations per week. This means that the required spare capacity drops by 67% compared to the pooled situation.
Jockeying, however, implies that a regular patient has to be scheduled or rescheduled on the morning of the specific day, which may not always be possible in practice. Nevertheless, even with a success rate of only 50% for rescheduling, the necessary spare capacity still drops by over 30%.
3.4.5 Conclusions for the AMC radiotherapy departmentThe AMC radiotherapy case leads to the following conclusions: 1. In the current case, the performance is improved by separating the capacities
for urgent and regular patients; 2. The more stringent the performance target for urgent patients, the more
advantageous separation of queues becomes; 3. With jockeying from the regular to the urgent queue, the required capacity can
reduce further. In addition, separation of queues will already be preferable in terms of required capacity in the current situation;

CHAPTER 3
58
4. Different small fractions of urgent patients do not influence the trade-off question;
5. The economy of scale has only a minor effect on the trade-off question.
3.5 Discussion
In service industries, dividing capacity among several customers can be beneficial due to a relatively large difference in process times. In this paper, another potentially effective reason to divide capacity is investigated: different performance targets due to a different level of urgency, such as arise in hospitals.
3.5.1 Our study comparedWithin health care, a subdivision of capacity at the outpatient department can be preferable for several underlying reasons: 1. Subspecialization: new patient referrals are divided into several groups with a
different medical subspecialization and dedicated capacity for each group; 2. Fast-tracking: reserve dedicated capacity for urgent patients to reduce their
waiting times; 3. Follow-up: new patients and follow-up patients use other timeslots at the
outpatient department; 4. Geographical: consultations take place at several locations to reduce the travel
times for patients.
In Thomas et al. [7] both subspecialization and fast-tracking are claimed to lead to increased capacity requirements. We agree with the statement regarding subspecialization. However, this paper clearly proves that the subdivision of capacity for different levels of urgency does not necessarily lead to a higher demand for capacity.
In Murray [8] it is argued that a subdivision of capacity has several disadvantages: 1. the necessary triage to determine whether the patient is indeed urgent has to be effective and accurate and 2. the demand will be less predictable, which implies that additional spare capacity is needed to reach the performance targets. This paper shows that the disadvantage for the small urgent group can be compensated by the large regular group, which could lead to a reduced overall capacity requirement.
In Murray and Berwick [9] a plea is made for advanced access, which implies one queue with waiting times for urgent patients. Undoubtedly, this is the best strategy for all patients. However, working down the backlog is not an ongoing feature of advanced access, as claimed by Murray and Berwick [9]. Queuing theory shows this is not entirely true. To maintain low waiting times after working down the backlog, the

TO POOL OR NOT TO POOL IN HOSPITALS
59
utilization rate must be reduced to deal with the increased variation in demand. In situations with high access times, the demand for care is more stable because there is always a patient waiting to be seen. Unfortunately, the high capacity requirements associated with this strategy often cannot be met in practice where the available capacity/budget is limited. In this paper, it is demonstrated that subdivision for urgency reasons potentially saves capacity in situations where it is too limited to provide advanced access.
3.5.2 Conclusionsl Queuing theory turned out to be useful to provide basic insights and results to
“look for”. Using computer simulation, the extent of these results can then also be checked and evaluated in the more complex realistic situation of the case study. In addition, by computer simulation various what-if questions can be investigated, such as on different performance targets, patient-mix, economies of scale, and jockeying.
l In the current situation, pooling or separating capacity at the AMC radiotherapy outpatient department requires the same number of consultations. With these equal capacities, however, a separation even slightly improves the performance (mean waiting times service levels).
l A combination of queuing theory and computer simulation led to practical insights and results, and seem highly fruitful.
Acknowledgements
The authors wish to acknowledge the radiotherapy department of the AMC in Amsterdam for its cooperation and Geert Jan Kamphuis and Rachid Kolfin for their assistance in building the simulation model. Comments by the anonymous referees were of considerable benefit to the presentation and were highly appreciated.

CHAPTER 3
60
References 1. Tijms HC (1994). Stochastic Models: An Algorithmic Approach. Chichester: Wiley.
2. Cooper RB (1981). Introduction to Queueing Theory. North-Holland, Amsterdam.
3. Whitt W (1992) Understanding the Efficiency of Multi-server Service Systems. Management Science(38), 708-723.
4. Wolff RW (1989) Stochastic Modelling and the Theory of Queues. Englewood Cliffs, NJ: Prentice-Hall.
5. Whitt W (1999) Partitioning Customers into Service Groups. Management Science (45), 579-1592.
6. Van Dijk NM, Van der Sluis E (2008). To Pool or not to Pool in Call Centers. Production and Operations Management (17), 1-10.
7. Thomas SJ, Williams MV, Burnet NG, Baker CR (2001). How much surplus capacity is required to maintain low waiting times? Clinical Oncology (13), 23-28.
8. Murray M (2000). Patient care: access. British Medical Journal (320), 1594-1596.
9. Murray M, Berwick DM (2003). Advanced access: reducing waiting and delays in primary care. Journal of the American Medical Association 289(8), 1035-1040
10. Law AM, Kelton WD (2002). Simulation Modeling and Analysis (3rd ed.) Singapore: McGraw-Hill.
11. Welch PD (1981). On the Problem of the Initial Transient in Steady-State Simulation. IBM Watson Research Center, Yorktown Heights, NY.
12. Carson JS (1986). Convincing users of model’s validity is challenging aspect of modeler’s job. Industrial Engineering (18), 74-85.


Various traffic flows from multiple directions have to use the same capacity: the intersection
“We can’t solve problems by using the same kind of thinking we used when we created them.” Albert Einstein
4CHAPTER
Reducing access times for an endoscopy department by an iterative combination
of computer simulation and Linear Programming
P.E. JoustraJ. de Wit
V.M.D StrubenB.J.H. Overbeek
P. FockensS.G. Elkhuizen
Health Care Management Science 2010;13(1):17-26

64
CHAPTER 4
Abstract
To reduce the access times of an endoscopy department, we developed an iterative combination of Discrete Event simulation and Integer Linear Programming. We developed the method in the Endoscopy Department of the Academic Medical Center in Amsterdam and compared different scenarios to reduce the access times for the department. The results show that by a more effective allocation of the current capacity, all procedure types will meet their corresponding performance targets in contrast to the current situation. This improvement can be accomplished without requiring additional equipment and staff. Currently, our recommendations are implemented.
65
REDUCING ACCESS TIMES FOR AN ENDOSCOPY DEPARTMENT
4.1 Introduction
4.1.1 BackgroundLong access times1 are a major problem in hospitals around the world. Not only patients requiring urgent attention want to be seen as soon as possible, also patients with an appointment expect to be seen at a short notice. If we can develop cost-effective solutions to reduce access times, budgets do not have to be increased. Such solutions would increase efficiency in the use of available resources rather than requiring investment in additional equipment and staff.
Our problem concerned the long access times in the endoscopy department of the Academic Medical Center (AMC) in Amsterdam. In the endoscopy department, various procedure types had to be performed with different durations and different urgency levels with corresponding access time targets. Therefore, we needed a method to evaluate the performance of a weekly master schedule in terms of access times for each procedure type. To schedule additional hours for poor performing procedure types, we had to take the complex scheduling environment of the endoscopy department into account. The various procedure types had to be performed in a suitably equipped procedure room by an available, specialized physician.
4.1.2 Literature reviewBoth Marcus [1] as well as Zamir and Rex [2] described qualitative methods to improve the efficiency of an endoscopy department. Shoaib et al. [3] and Baron et al. [4] tackle the access time problem from the demand side and both conclude that a quarter of the number of colonoscopies performed are unnecessary when compared to the guidelines. Implementing the guidelines would reduce the access times for diagnostic colonoscopy. Our study presents a quantitative approach to reduce access times.
Various quantitative methods are available to improve the efficiency of available resources. Denton and Gupta [5] described the difficulties in appointment scheduling in health care. More specific, the literature describing methods to reduce waiting/access times or improving resource utilization at outpatient departments (see for example [6-9]) or diagnostic departments (see for example [10-12]) is extensive. However, these methods are not sufficient to solve our complete problem of the endoscopy department, because the complex scheduling problem was not addressed in these papers.
Apart from literature about reducing waiting/access times or improving resource utilization at outpatient departments or diagnostic departments, we also searched for comparable problems and mathematical methods in other hospital departments
1 The access time of a patient is the number of days between referral and the actual appointment.

66
CHAPTER 4
and found two related topics: the nurse scheduling problem and operating room scheduling. Several articles deal with the scheduling of nurses – Cheang et al. provide an overview of nurse scheduling articles [13]. Sherali et al. describe how to schedule residents [14, 15] and Day et al. describe the scheduling of trainees [16]. However, in these articles the future demand is assumed to be known, which is different from our research. Centeno et al. [17] first predict the future demand for nursing staff of an emergency department with simulation and use that as input for an ILP to optimize the shifts. Although Centeno et al. use a combination of simulation and ILP, a few important differences with our study need to be mentioned. Firstly, in an emergency department the aim is to minimize waiting times in minutes in stead of access times in days, so the demand can not be scheduled and patients have to be treated in order of urgency and arrival. The second difference is that Centeno et al. do not distinguish different skills for the nursing staff which will be necessary for scheduling the specialized physicians of an endoscopy department in most teaching hospitals. The third difference is that the rooms in the emergency department are not scheduled explicitly while we have to deal with different procedure rooms as a constraint in the scheduling problem. Lastly, simulation and ILP are not used iteratively, which was necessary in our situation (see the methods section).
A topic which also has similarities with our research is operating room scheduling. A lot of articles are about maximizing the number of operations planned given e.g. a maximum risk on overtime [18-20]. A second subtopic is the operating room scheduling with restrictions on intensive care beds [21-23]. Unfortunately, none of these studies incorporated Discrete Event simulation to deal with the stochastic behavior of the system. These methods were not applicable to our situation, as Discrete Event simulation was necessary to solve our problem (see the Modeling section).
Summarizing, we found no articles in which both access time targets as well as various procedure types, specialized physicians and different procedure rooms are modeled simultaneously.
4.1.3 Research questionThe purpose of our study was to answer the question: Is it possible to develop a mathematical method to reduce the access times for an endoscopy department in a teaching hospital?
We developed an iterative combination of Discrete Event simulation and Integer Linear Programming and validated this method in the endoscopy department of the Academic Medical Centre (AMC) in Amsterdam, The Netherlands. The result was a weekly master schedule that minimized the number of hours while meeting access time targets as well as taking into account equipment and physician-related constraints for each procedure type.
67
REDUCING ACCESS TIMES FOR AN ENDOSCOPY DEPARTMENT
4.2 Problem analyses
4.2.1 Introduction of the AMC endoscopy department To develop our mathematical method, we studied the endoscopy department of the AMC, particularly the procedures performed by the gastroenterologists. A gastroenterological (GE) endoscopy is a procedure to examine the upper or lower gastrointestinal tract. When combined with radiology, it also allows examination of the bile ducts. Furthermore, many different types of procedures (gastroscopy, colonoscopy and sigmoidoscopy to name some) assist diagnosis and treatment.
At the start of our study in August 2007, the access times for several procedure types were on average 12 weeks. In December 2007, these access times increased to on average 15 weeks. In this period, the endoscopy-GE department was staffed by 10 gastroenterologists and 6 resident-physicians. In 2006, these physicians performed over 9,000 endoscopic procedures in six different procedure rooms including trials of novel therapy and research.
The procedures were performed on outpatients (77%) and inpatients (23%). In addition to the inpatients from the AMC also patients from neighboring, general hospitals transported by an ambulance to the AMC were regarded as inpatients.
4.2.2 Endoscopic proceduresEndoscopic procedures differ with respect to (1) required equipment – e.g. a specific type of scope, X-ray machine or not, ultrasound equipment or not –, (2) duration and (3) urgency level. Patients were usually rated as semi-urgent or elective, but specific patients could also be urgent. Table 4.1 lists the access time targets set by the endoscopy department for these different urgency levels.
Table 4.1: Urgency levels with access time target
Urgency level Access time target
Urgent 100% within 24 hours
Semi-urgent 95% within one week
Elective 95% within three weeks
In general, the department considered the Endoscopic Retrograde Cholangio Pancreatography (ERCP), the Endoscopic UltraSound (EUS) and the dilatation of the esophagus (Oesdil) procedures to be semi-urgent. Additionally, Colonoscopy and general GE-procedures were considered to be elective procedures. These general GE-procedures were further subdivided based on scheduled duration times of 15 and 30 minutes. The average and standard deviation of the weekly demand of procedures in 2006, the duration, the default urgency level and the percentage of urgent procedures are listed in Table 4.2.

68
CHAPTER 4
4.2.3 Available resourcesEach procedure required one gastroenterologist and preferably two nurses. The nurses were trained to assist every endoscopic procedure. Not all gastroenterologists performed all endoscopic procedures, for example ERCP and EUS procedures required a specialized physician.
A pre-assessment room was available for preparation of patients for several procedures. The six different procedure rooms did not have the same equipment, so a procedure could not be scheduled in an arbitrary procedure room. For example, one room was equipped with X-ray technology required for ERCP and one room was equipped with ultrasound equipment for EUS. Besides the scheduled closures of the procedure rooms including nine public holidays and seven training days, occasional closures – due to illness, holidays and conference attendance of physicians – occurred frequently. Due to these occasional closures 9% of the yearly capacity could not be used. The public holidays were known in advance, the training days are spread evenly over the year and the occasional closures were randomly distributed over the year. Another relevant room of the endoscopy-GE unit was a recovery room with a maximum capacity of 10 patients. Here, patients recovered from anesthesia.
4.2.4 Patient SchedulingThe scheduled operational time of the procedure rooms was six hours per day, divided into timeslots. The department uses a weekly master schedule with a fixed number of dedicated timeslots for each procedure type. Research and urgent procedures did not use dedicated timeslots but instead dedicated time periods were scheduled to allocate these procedures. In the weekly master schedule, the timeslots of each procedure type were scheduled in a procedure room with the required equipment and a dedicated physician specialized in the corresponding procedure type.
Table 4.2: Weekly demand of procedures, duration, default urgency level and urgent percentage
Procedure type Average weekly number of procedures
in 2006 (st. dev.)
Scheduled duration (minutes)
Default urgency level
Percentage of urgent
procedures
ERCP 18.4 (4.2) 60 Semi-urgent 21%
EUS 14.7 (4.3) 45 Semi-urgent 4%
Oesdil 10.1 (3.4) 30 Semi-urgent 8%
Colonoscopy 35.6 (6.0) 60 Elective 9%
GE15 55.7 (8.7) 15 Elective 24%
GE30 8.9 (2.6) 30 Elective 32%
Feeding tube 13.0 (3.9) 30 n.a. 100%
Research 21.3 (5.0) 15-60 Varying 0%

69
REDUCING ACCESS TIMES FOR AN ENDOSCOPY DEPARTMENT
The timeslots were differentiated in length depending on the corresponding procedure type. Particularly, one GE-timeslot could either be used by one 30-minutes-procedure or two 15-minutes-procedures. Both elective and semi-urgent patients were scheduled in an available, suitable timeslot. A timeslot was suitable if it was dedicated to the corresponding procedure type and a timeslot may be suitable for more than one procedure type. If a timeslot for an elective patient was not occupied a week before, the timeslot was also available for other procedures – so called soft blocks. Eight percent of the scheduled patients called to reschedule their appointment.
On Monday, Wednesday and Friday one procedure room was completely dedicated to urgent procedures and additionally on Tuesday and Thursday afternoon. If an urgent patient could not be planned within regular urgent time the same day, the patient was double-booked. These double-bookings often resulted in both overtime for physicians and nurses as well as extra waiting time for patients. The maximum percentage of double-bookings was set by the management of the endoscopy unit to limit the unscheduled overtime by physicians and nurses. Although double-bookings were only one of the many factors that effect overtime, on the tactical level it was the most significant factor. To ensure the total overtime limit would not be exceeded, the maximum percentage of double-bookings was fixed on 3%. Thus, the other factors – mainly on operational level – were taken into account implicitly.
4.3 Modeling
4.3.1 The appropriate mathematical method(s)To evaluate whether or not the access time targets will be met and the percentage of double-bookings will not exceed 3% of the total number of procedures, a time-dependent and dynamic mathematical method is needed. Additionally, the fluctuating number of referrals and occasional closures of procedure rooms required the mathematical method to be stochastic.
If the access time targets are not met, additional hours have to be scheduled. Due to the limited availability and usability of the procedure rooms and the specialized physicians, this scheduling problem is too complex to solve manually. Therefore, we need a method to determine a new feasible weekly master schedule taken all constraints into account.
4.3.2 Dynamic, stochastic problemBoth queuing theory as well as computer simulation is an applicable mathematical method to solve dynamic, stochastic problems. In the following part of this section, we explain why queuing theory is not applicable to solve our specific problem.
70
CHAPTER 4
At the start of our study, each endoscopic procedure had dedicated timeslots so we could analyze the access times for each type separately. The ERCP is best suitable to evaluate the applicability of a queuing model, because the daily number of timeslots available for ERCP was fixed: namely, five timeslots. Except on Wednesday, when the specific procedure room was scheduled to be closed. We needed to model these scheduled closures because patients do arrive on Wednesday. Next to the scheduled closures, the ERCP procedure room was occasionally closed approximately 10 days per year.
Most queuing models assume the number of referrals to fit a Poison distribution. Because this was the case in the endoscopy department of AMC, we selected the formulas used by D’Antone [24] to handle the scheduled and occasional closures of procedure rooms. These formulas are suitable to calculate the waiting times for priority models with deterministic service times. Unfortunately, we were not able to model the closures of the ERCP room correctly with these formulas, because when applying priority queuing, the number of closures is Poison distributed, so both the number and the specific day within a year are random. Therefore, the fixed closures on Wednesday could not be modeled according to practice. Unfortunately, the randomly distributed closures have a large effect on the average access time so priority queuing did not lead to a valid model.
Therefore, we used computer simulation to evaluate the performance of the weekly master schedule in terms of access times and double-bookings. We found Discrete Event simulation best suitable to model our complex situation. Several other types of computer simulation are applied to patient logistics within hospitals to deal with the stochastic behavior [25, 26]: (1) Monte Carlo simulation, (2) System Dynamics and (3) Agent Based simulation. We will explain why these types of simulation are not applicable to our situation. Monte Carlo simulation is static so not applicable to our problem due to the time-dependent rescheduling of appointments. With System Dynamics, no detailed modeling of the scheduling rules is possible. This type of simulation is best applicable for macroscopic, strategic modeling [27]. Agent based simulation is used to model dynamic interaction between floating entities (e.g. patients). In our case, time-dependent interaction between patients is relevant, but dynamic interaction is not.
We build the Discrete Event simulation model using MedModel Professional Version 7. We applied Welch method [28] to decide upon the warm-up period of three months. The run length (excluding warm-up period) was set on one year and we determined the required number of replications to obtain a 3% half-width for the 95% confidence interval of the target percentage of the access time target. Therefore, we ran the model for 30 replications per scenario. The access time targets are met if the average value exceeds the target percentage of the access time target for each procedure.
71
REDUCING ACCESS TIMES FOR AN ENDOSCOPY DEPARTMENT
To validate our simulation model, we studied the endoscopy-GE unit of the AMC. We compared the average access time of our model to the historical output data of the actual system. The first time we validated with 2006 data, the validation was not successful. We identified the main cause for this was that the assumption an elective patient would be scheduled in the first available timeslot was not justified. This appeared not to be the case in practice for three different reasons: (1) Patients can have preferences about their appointment, (2) medical or procedural reasons can require delays and (3) some patients need to be seen by a specific physician. This is all modeled together by a varying minimal delay in the appointment for semi-urgent and elective patients. We calibrated this delay in appointment with 2005 data and successfully validated the simulation model using 2006 data. The difference between the average access times of the model and the actual system, was within 15%.
4.3.3 Scheduling problemIf the access time targets are not met, a new feasible weekly schedule is needed including the required additional hours indicated by the simulation model. Linear programming is capable to solve this type of scheduling problem. As the decision variables must be integer values, Integer Linear Programming (ILP) is required to solve our specific scheduling problem.
The basic ILP-model for a teaching hospital is described in Appendix A. We did not incorporate the nursing staff in our ILP-model because the availability of nurses was very flexible and if the number of nurses was insufficient, a single nurse was scheduled in a procedure room.
We implemented the ILP-models in AIMMS and solved them using CPLEX 11.
4.3.4 Iterative combination of Discrete Event simulation and ILP If one or more of the access time targets are not met, the number of hours used in the simulation model cannot be increased without applying the ILP-model to make sure the physician and procedure room constraints will be met. Therefore, an iterative combination of Discrete Event simulation and ILP was necessary.
The iterative process (see Figure 4.1) started with evaluating the performance in terms of access times and double-bookings of the current weekly schedule. For the well performing procedure types, the minimum number of weekly hours was reduced and for the poor performing procedure types, the minimum number of weekly hours was increased. The new required hours were scheduled by the ILP model to determine a feasible weekly master schedule. Subsequently, we evaluated the performance of the new master schedule with the simulation model. This iterative procedure continued until the minimum weekly number of hours required to meet the access time target for each procedure type was determined.

72
CHAPTER 4
We used the same iterative procedure to determine the minimum number of hours for urgent patients to make sure the percentage of double-booking would not exceed 3%. Note that the percentage of double-bookings mainly depends on the number of urgent hours but indirectly also on the number of elective hours due to the soft blocks.
The result of this iterative process is a feasible, weekly master schedule taking all relevant constraints into account, including the access time targets and the double-booking limitation.
Figure 4.1: Iterative combination of Discrete Event simulation and ILP
Access time targets easily
met?
Simulation:Access times and double bookings
Initial master schedule
OptimalMaster Schedule
No
Decrease nr of hours for over performing
procedure typesYes
Perc.double bookings
> 3% ?
Integer Linear Programming: New feasible master schedule
Increase number of urgent hours No
All access time targets
met?
Increase nr of hours for poor performing
procedure typesNo
Perc.double bookings
very low?
Decrease number of urgent hours
Yes
Yes
No
Yes

73
REDUCING ACCESS TIMES FOR AN ENDOSCOPY DEPARTMENT
If no feasible master schedule is possible, one can increase the availability of the procedure rooms and/or the physicians. The availability can be increased by extending the opening/working hours and/or increasing the usability of procedure rooms and physicians. To decide how to increase the availability and/or usability, the most logical way is to select the most cost-effective way to obtain a feasible master schedule.
4.4 Results
We used our iterative method to evaluate the performance of various scenarios for the endoscopy-GE unit of the AMC. We started with the current situation and determined both the minimum weekly number of hours required to meet the access time target for each procedure type as well as the minimum number of hours for urgent patients so the percentage of double-bookings would not exceed 3% of the total number of procedures. We called this first alternative scenario the “performance target” scenario.
Table 4.3 shows the service level – the percentage of patients seen within the corresponding number of days – for each procedure. For research patients, no
Table 4.3: Service level per procedure type
Procedure type Current situation (standard deviation)
Performance target scenario (standard deviation)
ERCP 99% (2%) 99% (5%)
EUS 94% (2%) 95% (1%)
Oesdil 81% (5%) 96% (1%)
Colonoscopy 19% (3%) 95% (4%)
GE15 84% (21%) 97% (7%)
GE30 77% (27%) 95% (11%)
performance target was specified. The current situation required 144.5 hours per week and the target scenario 143.5 hours.
Surprisingly, the “performance target” scenario required one hour less than the current situation. The reason for this is that the required number of hours for urgent patients can be reduced by almost 50% without significantly increasing the number of double-bookings. These hours can be used for Oesdil, Colonoscopy and general GE procedures to help these procedure types meet their performance targets.
We also experimented with various configurations to not only make sure that all procedures meet their corresponding performance targets but also minimize the total number of hours required (see Table 4.4).

74
CHAPTER 4
All additional alternative scenarios took the access times target, double-bookings and procedure room and physician constraints into account. Therefore, we compared these scenarios with respect to the minimum weekly number of hours required in the first alternative scenario, the target scenario.
The additional alternative scenarios were the following:1. We incorporated a backup system for physicians in the ILP-model to reduce the
number of occasional closures. The backup system will make sure that if the dedicated physician is absent, a backup physician will take over the shift. At the start of our study, the occasional closures were 9% of the yearly capacity. With a backup system we expect this percentage to drop drastically. To evaluate the effect of the occasional closures, we experimented with 2% occasional closures. The backup system does not require additional investments but may be hard to implement. Therefore, it is important to quantify the expected reduction in required hours before implementation. If the reduction is small, the implementation may not be worth the trouble but a large reduction will be.
2. For the elective procedure types (general GE procedures and Colonoscopy), an extra urgency level – semi-urgent – was introduced to reduce the number of urgent procedures. Note that all urgent procedures have to be performed within 24 hours. To deal with the fluctuating daily number of urgent procedures, a lot of spare capacity has to be dedicated to urgent procedures. Semi-urgent procedures can be equally scheduled during the week and therefore require less spare capacity. We scheduled the semi-urgent procedures in dedicated timeslots, which will be available for urgent patients if these timeslots are still empty. The physicians predicted that approximately 20% of the urgent procedures were in fact semi-urgent. Implementing this idea is relatively straightforward requiring no additional equipment and staff.
3. Pooling the timeslots of different procedures may reduce the minimum weekly number of hours required to meet the access time target for each procedure [29]. Especially, for the semi-urgent procedures a relatively large reduction in required hours was to be expected. Unfortunately, these procedures (ERCP, EUS and Oesdil)
Table 4.4: Minimum required weekly number of hours per alternative scenario
Alternative scenario Required hours per week
0. Performance target 143.5
1. Backup system for physicians 129.0
2. Semi-urgent general GE and Colonoscopy 142.5
3. Pooling general GE and Colonoscopy 143.0
4. Additional X-ray machine 142.0
5. Combination scenario 128.5
75
REDUCING ACCESS TIMES FOR AN ENDOSCOPY DEPARTMENT
require different equipment and/or specialized physicians. Therefore, we could only experiment with pooling general GE and Colonoscopy procedures. Indeed, these procedures have the same access time target, require the same equipment and the same physicians are specialized in both types. Pooling the two procedure types is easy to accomplish and makes the scheduling of patients easier.
4. Another potential improvement is to increase the flexibility of the available resources – in our case, procedure rooms and physicians. Increasing the usability of the procedure rooms – by adding equipment – may reduce the minimum required weekly number of hours, because more procedures are allowed to be scheduled in the corresponding rooms. This could also result in extra pooling possibilities as described in the previous scenario. Another way to increase the usability of the available resources is to increase the number of procedures a physician is specialized in. These non-recurrent investments may be more cost-effective than a structural extension of the opening/working hours of procedure rooms and physicians. We expected that an additional X-ray machine would be the most cost-effective investment. This alteration allows semi-urgent GE and Colonoscopy procedures and Oesdil procedures to be pooled. Because the investment in an additional X-ray is considerable, the reduction of required hours has to substantial.
5. The final scenario was a combination of the promising alternative configurations. This combination scenario included a backup system for physicians, semi-urgent general GE and Colonoscopy procedures, pooled timeslots for general GE and Colonoscopy procedures. We did not include an additional X-ray machine because this only saves half an hour compared with the first additional scenario (see Table 4.4) and therefore, will not be a cost-effective solution.
4.5 Discussion
4.5.1 Answer to our research questionWe successfully validated our iterative combination of Discrete Event simulation and Integer Linear Programming with the AMC endoscopy department. The results show that by a more effective division of the current number of hours, all procedure types will meet their corresponding performance targets. Specifically, almost 50% of the urgent hours can be assigned to Oesdil, Colonoscopy and general GE procedures without significantly increasing the number of double-bookings. This reduction of the access times can be achieved by improving efficiency in the use of available resources rather than investing in additional equipment and staff.
The introduction of the semi-urgency level for urgent general GE and Colonoscopy procedures may lead to more efficient use of the urgent hours. Unfortunately, the

76
CHAPTER 4
results show that it will not lead to a large reduction in the minimum required weekly number of hours for the AMC endoscopy department. If the percentage of urgent patients actually being semi-urgent would increase to more than 20%, this scenario will be more beneficial.
A backup system for physicians will reduce the number of occasional closures. The results show that the weekly required number of hours will decrease by 10% if the occasional closures drop from 9% to 2%. Although physicians have to take over shifts and, therefore, work more hours, the backup system will still save capacity – on average six hours per week. Additionally, the weekly capacity will be more stable, which on itself will reduce the access times.
Pooling general GE and Colonoscopy procedures does not lead to a large reduction of the required number of hours. Unfortunately, with the current physician and procedure room constraints, only two elective procedure types could be pooled. The utilization rate for both procedures types was already high because the elective performance target is not stringent. Therefore, pooling does not lead to a significantly higher utilization rate and consequently, does not save much capacity.
Pooling the semi-urgent general GE and Colonoscopy procedures and Oesdil procedures saves only half-an-hour per week compared to the scenario with semi-urgency for general GE and Colonoscopy procedures. This reduction does not justify the investment in a new X-ray machine. The reason for the small reduction is that semi-urgent general GE and Colonoscopy procedures are often scheduled in empty timeslots due to rescheduled appointments. Additionally, both types of procedures have a limited number of semi-urgent patients (only 5-6% of the total number of general GE and Colonoscopy procedures). Therefore, the absolute reduction is small.
4.5.2 Limitations and further researchSome patients need to be seen by a specific physician. In the AMC case this is due to research related specialization of physicians within one procedure type. Another reason could be that patients prefer their own physician, but the management of the AMC endoscopy department decided not to take this into account. A minimal delay in appointment was implemented to implicitly model the doctor-patient relationship (also see the methods section).
Currently, our recommendations are being implemented. Especially, the proposed backup system for physicians to reduce the number of occasional closures – due to illness of physicians and nurses, holidays and conference attendance by physicians – may be hard to implement. However, the physicians’ increased awareness of the major effect of this reduction on the access times – shown by our numerical results – will contribute to a successful implementation.
We did not incorporate the daily process in our study. Therefore, we were not able to check if the increased utilization rate would not lead to unacceptable high waiting

77
REDUCING ACCESS TIMES FOR AN ENDOSCOPY DEPARTMENT
time for patients in the waiting room. Additionally, we could not check whether or not the available numbers of scopes and the capacity of the recovery room were sufficient.
Also, the weekly schedule is optimized for the endoscopy department. We did not consider other related departments. Therefore, we could not analyze the effect of combining the endoscopy procedure with other appointments. Vermeulen et al. [30] illustrated the trade-off between the percentage of combination-appointments and the utilization rate of a department’s resources.
4.5.3 ConclusionsOur final recommendations to the AMC endoscopy department were to implement the backup system for physicians, the introduction of semi-urgency for general GE and Colonoscopy procedures and to pool these procedure types. Although, the effect of the latter two interventions is not large, no investments are necessary to accomplish them and a small reduction is still better than no reduction at all.
From the results obtained in our case study, we conclude that the described combination between Discrete Event simulation and ILP – if possible with the specified resources – will lead to a feasible, weekly master schedule that takes all constraints into account. This weekly master schedule does not only ensure that the access time targets and double-booking limitation will be met, but also takes into account the limited availability and usability of both procedure rooms as well as physicians.
The iterative mathematical method is not only applicable to the AMC endoscopy department but also for other teaching hospitals with comparable performance targets and double-booking limitation. In addition, many other hospitals also have to deal with the complex scheduling environment of an endoscopy department due to various equipped procedure rooms and specialized physicians.
In summary we conclude that the described mathematical method is a cost-effective way to reduce the access times of an endoscopy department. This is an addition to the available mathematical methods to reduce the access times of an outpatient department and to optimize operating room schedules.
Acknowledgements
The authors are grateful to C. Ponsioen, E. Ouburg, B. Wagner, M. van Haaster, J. Bergman and M. van den Bergh of the endoscopy-GHE department at the AMC for their collaboration during the project. The authors would also like to thank H. Greuter of the Team Innovation and Process Management at the AMC for his contribution to the study and E. Hans and P. VanBerkel of the University of Twente for the supervision of B. Overbeek and J. de Wit.
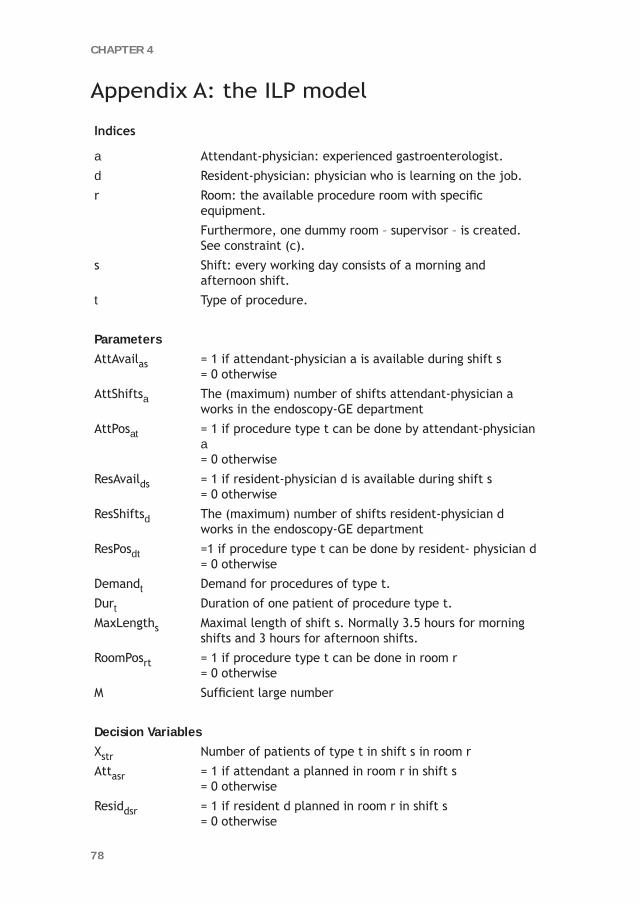
78
CHAPTER 4
Appendix A: the ILP model
Indices
a Attendant-physician: experienced gastroenterologist.
d Resident-physician: physician who is learning on the job.
r Room: the available procedure room with specific equipment.
Furthermore, one dummy room – supervisor – is created. See constraint (c).
s Shift: every working day consists of a morning and afternoon shift.
t Type of procedure.
ParametersAttAvailas = 1 if attendant-physician a is available during shift s
= 0 otherwise
AttShiftsa The (maximum) number of shifts attendant-physician a works in the endoscopy-GE department
AttPosat = 1 if procedure type t can be done by attendant-physician a= 0 otherwise
ResAvailds = 1 if resident-physician d is available during shift s= 0 otherwise
ResShiftsd The (maximum) number of shifts resident-physician d works in the endoscopy-GE department
ResPosdt =1 if procedure type t can be done by resident- physician d= 0 otherwise
Demandt Demand for procedures of type t.
Durt Duration of one patient of procedure type t.
MaxLengths Maximal length of shift s. Normally 3.5 hours for morning shifts and 3 hours for afternoon shifts.
RoomPosrt = 1 if procedure type t can be done in room r= 0 otherwise
M Sufficient large number
Decision VariablesXstr Number of patients of type t in shift s in room r
Attasr = 1 if attendant a planned in room r in shift s= 0 otherwise
Residdsr = 1 if resident d planned in room r in shift s= 0 otherwise

79
REDUCING ACCESS TIMES FOR AN ENDOSCOPY DEPARTMENT
Clarification of constraints:(a) For each procedure type an attendant- or a resident-physician is needed to
perform the procedures. (b) An attendant-physician must be present to supervise. (c) Both attendant- and resident-physicians can only be planned on shifts where
they are available.(d) The time spent by different attendant- and resident-physicians is bound to a
maximum. (e) Demand must be met for each procedure type t.(f) A procedure type can be done in one or more procedure rooms. (g) The length of each shift s may not exceed its maximum duration.
Objective function
min ( ) ( )∑∑ +=dsr
dsrasr
asr ResidAttz
Subject to
(a) ( ) ( ) MResPosResidAttPosAttX dtdsratstr ***da
asr
+≤ ∑∑ rts ,,∀
(b) 1a
as =∑ rAtt sr,∀
(c) asasr AttAvailAtt ≥
dsdsr ResAvailResid ≥
rsa ,,∀
rsd ,,∀
(d)
( )a
srvasr
AttShiftsAtt ≤∑
( )d
sradsr ResShiftsResid ≤∑
a∀ d∀
(e) ∑=rs
srttXDemand t∀
(f) MRoomPosX rt *srt ≤ rts ,,∀
(g) ( )s
ttsrt MaxLengthDurX ≤∑ * sr,∀

80
CHAPTER 4
References 1. Marcus SN (2006) Efficiency in endoscopy centers. Gastrointest Endosc 64(5):765-767.
2. Zamir S, Rex DK (2002) An initial investigation of efficiency in endoscopy delivery. Am J of Gastroenterol 97(8):1968-1972.
3. Shoaib A, Hamade A, Zia A, Basnyat PS, Taffinder N (2006) Why wait for a colonoscopy? An easy cure. Colorectal Dis 8(6):480-3.
4. Baron TH, Kimery BD, Sorbi D, Gorkis LC, Leighton JA, Fleischer DE (2004) Strategies to address increased demand for colonoscopy: Guidelines in an open endoscopy practice. Clin Gastroenterol and Hepatol 2(2):178-82.
5. Denton B, Gupta D (2008) Appointment scheduling in health care: challenges and opportunities. IIE Trans 40(9): 800-819.
6. Cayirli T, Veral E (2003) Outpatient-scheduling in health care: A review of the literature. Prod and Oper Manag 12: 519–549.
7. Murray M, Berwick DM (2003) Advanced access: reducing waiting and delays in primary care. JAMA 289(8): 1035-1040.
8. Thomas SJ, Williams MV, Burnet NG, Baker CR (2001) How much surplus capacity is required to maintain low waiting times? Clin Oncol 13:23-28.
9. Elkhuizen SG, Das SF, Bakker PJM, Hontelez JAM (2007) Using Computer Simulation to Reduce Access Time for Outpatient Departments. Qual and Saf in Health Care 16:382-386.
10. Walter SD (1973) A comparison of appointment schedules in a hospital radiology department. Br J of Prev and Soc Med 27: 160-167.
11. Patrick J, Puterman ML (2007) Improving resource utilization for diagnostic services through flexible inpatient scheduling: A method for improving resource utilization. J of Oper Res Soc 58: 235-245.
12. Kolisch R, Sickinger S (2008) Providing radiology health care services to stochastic demand of different customer classes. OR Spectr 30: 375-395.
13. Cheang B, Li H, Lim A and Rodrigues B (2003) Nurse rostering problems – a bibliographic survey. Eur J of Oper Res 151:447-460.
14. Sherali HD, Rahamahi MH and Saifee QJ (2002) Hospital resident scheduling problem. Prod Plan and Control 13:220-233.
15. Day TE, Napoli JT and Kuo PC (2006) Scheduling the Resident 80-Hour Work Week: An Operations Research Algorithm. Cur Surg 63:136-141.
16. Beliën J and Demeulemeester E (2005) Scheduling trainees at a hospital department using a branch-and-price approach. Eur J of Oper Res 175:258-278.
17. Centeno MKA, Giachetti R, Linn R and Ismail AM (2003). A simulation-ILP based tool for scheduling ER staff. Proc of 2003 Winter Simul Conf 2:1930- 1938.
18. Marcon E, Kharraja S, Simonnet G (2003) The operating theatre planning by the followup of the risk of no realization. Int J Prod Econ 85:83-90.
19. Jebali A, Hadj Alouane AB, Ladet P (2005). Operating room scheduling. Int J Prod Econ 99:52-62.
20. Guinet, A, Chaabane S (2003) Operating theatre planning, Int J Prod Econ 85:69-81.

81
REDUCING ACCESS TIMES FOR AN ENDOSCOPY DEPARTMENT
21. Oostrum, JM van, Houdenhoven M van, Hurink JL, Hans EW, Wullink G, Kazemier G (2008) A master surgical scheduling approach for cyclic scheduling in operating room departments. OR Spectr 30:355-374.
22. Santibáñez P, Begen M, Atkins D (2006) Surgical block scheduling in a system of hospitals: an application to resource and wait list management in a British Columbia health authority. Health Care Manag Sci 10:269-282.
23. Vissers JMH, Adan IJBF and Bekkers JA (2005) Patient mix optimization in tactical cardiothoracic surgery planning: a case study. IMA J of Manag Math 16:281-304.
24. D’Antone, I. (2000). Pipeline length optimization in a digital asynchronous trigger controller. Nucl Instrum and Methods in Phys Res A 451: 439-448.
25. Brailsford SC (2007) Tutorial: Advances and challenges in healthcare simulation modelling. Proc of 2007 Winter Simul Conf 1436-1448.
26. Brennan A, Chick SE, Davies R (2006) A taxonomy of model structures for economic evaluation of health technologies. Health Econ 15:1295-1310.
27. Rauner MS, Schaffhauser-Linzatti M-M (2002) Impact of international in-patient payment strategies on health technology management: a system-dynamics-model for Austria. Socio-Econ Plann Sci 36(3):133-154.
28. Welch PD (1981) On the Problem of the Initial Transient in Steady-State Simulation. IBM Watson Research Center, Yorktown Heights, NY.
29. Joustra PE, van der Sluis E, Van Dijk NM (2009) To Pool or not to Pool in Hospitals: A Theoretical and Practical Comparison for a Radiotherapy Outpatient Department. Ann of Oper Res 2010;178:77-89.
30. Vermeulen IB, Bohte SM, Elkhuizen SG, Bakker PJM, La Poutré H. Decentralized Online Scheduling of Combination-Appointments in Hospitals. Proceedings of ICAPS-2008, the International Conference on Automated Planning and Scheduling, Sydney, Australia, September 14-18, 2008: 372-379, AAAI Press.

Different tollbooths for customers with a pass and customers who want to pay with a credit card or cash
“Trust is earned by many deeds and can be lost with a single deed.” Socrates

5CHAPTER
Reducing MRI access times by tackling the appointment-scheduling strategy
J.R.C. van SambeekP.E. Joustra
S.F. DasP.J.M. Bakker
M. Maas
Accepted by BMJ Quality & Safety

84
CHAPTER 5
Abstract
Background High access times to magnetic resonance imaging (MRI) facilities have a negative impact on quality of care and patient service. Since these resources are both scarce and expensive, utilising the capacity is the most economical way of reducing these access times. As a rule, patient appointments are not scheduled efficiently. Consequently, the most promising way to reduce access times is to optimise the scheduling strategy. The objective of this study was to reduce MRI access times by optimising the scheduling strategy and implement the strategy in practise in an university hospital in the Netherlands.Assessment of problems The scheduling process was analysed in order to define the improvement potentials and to simulate the process. Computer simulation was used to copy the process and experiment with scheduling strategies in theory. Promising scenarios were defined and run in the simulation model. A new scheduling strategy was designed and implemented based on the simulation results.Results of assessment The simulation experiments showed that block reduction leads to a maximum decrease in access time of 93%.Strategies for change Implementing a scheduling strategy with a practically applicable minimum number of blocks resulted in an actual decrease from respectively 36, 22, 28, 9, and 9 to 7, 2, 10, 3, and 1 calendar days, depending on the patient group.Lessons and messages This study proved that modelling the scheduling process can contribute to optimising the scheduling strategy, which can lead to a reduction in access times to imaging facilities such as MRI scanners.

85
REDUCING MRI ACCESS TIMES
5.1. Background
Minimising patients’ throughput times in hospitals is a hot item in health care. Central facilities such as diagnostic imaging departments often have a large impact on patients’ throughput times [1]. One of the major bottlenecks in many hospitals is magnetic resonance imaging (MRI). For this reason, access time to MRI facilities is one of the main performance indicators for radiology departments [2]. Capacity is deliberately limited because these facilities are a very expensive resource, and this results in high access times. In order to reduce undesirable access times, one possibility would be to increase the MRI capacity. Another way that is more economical, would be to better utilise the available capacity.
Since an MRI facility is an appointment-based resource, the applied scheduling strategy greatly affects its utilisation. Inappropriate scheduling is common in hospitals [3], something that is often due to scheduling strategies that have developed over time. Partial adjustments to the strategy are usually based on medical reasons, with too little concern for the systems’ performance indicators such as access times and utilisation rate. More attention should be paid to improving MRI appointment scheduling. Because real-time experimentation can have a significant negative impact on patients and costs, modelling is an appropriate technique for coming up with promising improvements in scheduling. Although others have shown that modelling scheduling strategies can support the optimisation of the scheduling process for radiology departments [4-6], they often did not take the different scheduling times for different protocols into account.
An MRI scanning facility in a university hospital has to deal with many types as well as high degrees of variability in the process. The most frequently used modelling techniques (such as analytical models) do not take this variability into account. By contrast, discrete event simulation is more appropriate, because it is a modelling technique that will give very specific quantitative results in situations where variability is important [3, 7, 8]. Although discrete event simulation has been applied within radiology modalities [9], so far it has not been used for complex appointment systems like MRI facilities. The aim of this study was to reduce MRI access times to less than fourteen days by optimising the scheduling strategy and implement the strategy in practise. The objectives of this study were to:- undertake process analysis of the MRI scan scheduling process;- to apply computer simulation to test strategies to measure the impact on access
times;- to implement the solution in a ‘real world’ context and to measure the impact of
the solution on access times.

86
CHAPTER 5
The study was performed in a university hospital in the Netherlands, the Academic Medical Center (AMC) in Amsterdam. Annually, 12,000 patients visit this hospital’s radiology department for an MRI scan. All MRI outpatients are scheduled for an appointment. Inpatients are excluded from the scope of this study because they are not scheduled but are called when there is an opening. When the study started, MRI access times ranged from 16 days to 36 days, depending on the scanner and the patient category.
5.2 Assessment of problems
The problem was approached by composing a project team containing radiology management, a specialized laboratory worker, the planning staff leader, a radiologist and researchers who are experts in scheduling and patient logistics. The first step was to analyse the scheduling process.
Scheduling takes place manually, by assessing MRI requests on patient category, urgency level, required scanner and scan duration. Appointments are scheduled in the master schedule, in a specific block type, see Figure 5.1. For instance, non-urgent hand scan is scheduled in a light ‘Skeletal’ block. When an appointment cannot be scheduled in the categorical block within urgency request, another block type is allowed.
Six patient groups were differentiated to determine the access time. This was necessary because there was less availability for some groups than for other groups, resulting in different access times. The patient groups were based on whether a radiologist needed to be present during the scan and on the scanner required. Because a radiologist was not present all day long and because some patients had to be scanned on the most advanced scanner, access times were usually different for the various patient groups.
Access time was measured on a weekly basis by a prospective schedule check. To do this, the planning system was searched for potential time slots, and the first day where it was possible to schedule two appointments of a given category was selected. By searching for two successive possibilities, the measurements were not influenced by accidental gaps in the schedule (caused by such things as late cancellations).
The most important bottlenecks that emerged from the process analysis were:The high average access times for all patients resulted in a large number of
semi-urgent requests. If all patients could be scanned within 2 weeks, it would be unnecessary to categorize as semi-urgent those patients who have to be helped within two or three weeks.
It emerged that the complexity of the scheduling strategy was caused mainly by the large number of blocks, 78 per week.

87
REDUCING MRI ACCESS TIMES
Of all appointments, 15% were scheduled outside of their block type, due to the high number of blocks.
The problem analysis led to the assumption that a significant reduction of blocks per week would be the most promising scheduling adjustment to achieve the objective. Since this would be a major change, especially for the influential radiologists, it was desirable to have as much information about the expected change as possible, therefore the project team decided to simulate the process by modelling it.
Due to the complexity of the planning strategy, we selected computer simulation to approach this problem. We used MedModel software. Data was used from the planning system used in the AMC (X/Care, McKesson). This data included all registered appointments from 1 January 2006 to 31 October 2006.
The simulation run was for a period of one year, excluding a four-month start-up period. After building the model, we validated it using actual access times and utilisation rates (extracted from X/Care). The accepted deviation between the actual situation and simulation was 10%.
Figure 5.1: Master schedule before intervention

88
CHAPTER 5
5.3 Results of assessment
After designing the model and validating the present situation, we defined several interventions in order to study their effect on the access times. Since there were so many blocks, reducing the number of blocks seemed to have the biggest impact. The primary goal of the computer simulation was to analyse and demonstrate the impact of block reduction, and four scenarios were simulated to analyse this:1. Present situation: 15 different patient categories, 2 urgency levels (semi-urgent
and non-urgent);2. 6 different patient categories, 2 urgency levels;3. 1 patient category, 2 urgency levels;4. 1 patient category, 1 urgency level (which means that all patients can be
scheduled in any slot during the week).Table 5.1 demonstrates the relative reduction in access times compared to the present situation, which resulted from the simulation model.
Table 5.1: simulation results
Simulation resultsScenario
1 2 3 4
Master schedule 15 categories2 urgency levels
6 categories 2 urgency levels
1 category2 urgency levels
1 categoryequal urgency
Reduction in average access time
0% 43% 66% 93%
The total capacity per week is equal in every scenario. In scenarios 1 to 3 with both semi-urgent and non-urgent blocks, the proportion of semi-urgent to non-urgent is equal. The table clearly illustrates that the number of blocks greatly influences the expected access time for an average patient: the lower the number of blocks, the lower the access time.
5.4 Strategy for change
5.4.1 Description of new scheduling strategyThe simulation results convinced all stakeholders within the department that it was necessary to reduce the number of blocks. The discussions that followed the presentations of the model’s outcomes resulted in choosing a strategy to implement. This strategy aimed at the absolute minimum number of block types, keeping only the most essential types. A new master schedule was proposed and implemented that contained four different patient categories (regular, stereotactic, cardiology, and anaesthesia). Two categories were allowed to remain because a medical team from

89
REDUCING MRI ACCESS TIMES
outside the radiology department had to be present during the scans (cardiology, anaesthesia). One category remained because patients had to be scanned right before brain surgery, so it was essential to have a fixed time during the week (stereotactic). All other patient categories were grouped into a new block (“regular”). fewer semi-urgent blocks were required when the access times dropped to less than two weeks. Initially, the urgent and semi-urgent hours per week remained the same as in the old master schedule. Figure 5.2 shows the new master schedule (an empty block represents the new category of “regular”).
The new scheduling strategy was implemented on 1 January 2008. This means that patients that were scheduled for an appointment at January first or later were scheduled within the new roster. For a period of three months, the project team evaluated the new situation both quantitatively and qualitatively weekly. To this end, the access times were measured prospectively on a weekly basis until week 20, and during week 36. This was performed at the same way as explained in the process assessment. The qualitative evaluation consisted of weekly meetings were experiences and complaints from the work floor were discussed, and actions to improve were assigned to project members.
Figure 5.2: Master schedule after intervention

90
CHAPTER 5
5.4.2 Evaluation of new scheduling strategyFigure 5.3 presents the weekly access times in 2008 compared to the average 2007 access times for the six patient groups. All access times are measured prospectively and expressed in calendar days.
Figure 5.3: Development of access times after intervention for 6 patient groups
The figure clearly shows better results in 2008 than before the new scheduling strategy was implemented. The access times for the “radiologist” categories dropped from respectively 36, 22, and 28 days in 2007 to 7, 2, and 10 days in September 2008. The access times for less critical patient groups “without radiologist” dropped from 9 and 9 days to 3 and 1 days. During autumn 2008, all access times were well below the two-week performance target.
Right from the start, the increased scheduling flexibility resulted in low access times to MR1 and MR2, and to the early and late time slots of MR3 (“without radiologist”). At the beginning of the new scheduling period the patient group “radiologist MR3” lagged behind the other categories: many scans were only allowed to be scheduled with a radiologist at MR3, which resulted in restricted availability. It turned out that encouraging examination of whether a radiologist was truly necessary had a positive impact on the access time of this category. Within the first 15 weeks, this access time gradually dropped to an acceptable number of days. This can be explained by an increase in the number of scans per week. The scanning production per month increased to some extent, resulting in an increase in scheduled utilisation rate from 70% in 2007 to 80% in 2008.

91
REDUCING MRI ACCESS TIMES
The category “MR1 without radiologist” came into being in week 5, because until then a radiologist had been present for all scans on MR1 (no early or evening blocks). The sudden decrease of access times for most patient groups was caused by a timely change to the master schedule for 2008. Months before the start of 2008, the planning department was already scheduling appointments that no longer fit into 2007 in the new master schedule for 2008.During the evaluation period no significant change in overtime or cancellations was reported.
5.5 Lessons and messages
After implementing the new scheduling strategy, access times for all relevant patient categories dropped to an acceptable level of fewer than 14 days. This study showed that modelling the scheduling process can contribute to optimising the scheduling strategy, which can lead to a reduction in access times to imaging facilities such as the MRI scanner.
Scheduling techniques and modelling have increasingly proved to be valuable in hospital environments. Computer simulation appeared to have various strengths in the context of this study. First, it was possible to consider various interesting scenarios for evaluation. Second, unpredictable variables such as patient cancellations could be taken into account, which provided results with a high confidence level. Third, because it was possible to satisfactorily visualise the consequences of scenarios, stakeholders relied on the results. The most important added value of the simulation model within this study appeared to be the persuasive power of computer simulation. Although the radiologists in particular were very sceptical about block integration, they were convinced by the numbers that resulted from the simulation.
Differences occur when comparing the simulation results and the actual results after implementation. This is caused by the difference between the experimental master schedules within the simulation model and the actual master schedule after implementation. It was only after seeing the results and becoming convinced that the radiologists started discussing and developing a realistic master schedule with a minimum number of blocks. Many factors were taken into account, such as the number, dispersal, and appropriate time intervals of urgent blocks, non-regular blocks, and spaces that meet the requirements.
When the department learned to work in the new way and the improved performance became apparent, all stakeholders accepted and supported the new scheduling strategy. Over time, minor changes in the roster have been established over time, because of external factors such as changing availability of cardiologists. Fortunately, this has not lead to more blocks.The study confirmed that history-based scheduling can be far from optimal, especially within highly political environments

92
CHAPTER 5
such as hospitals. Using scheduling methods from operations management and simulation modelling contribute greatly to radiology performance.
GlossaryAccess time The time between the MRI referral and the appointment (in
calendar days)Patient category A classification for group appointments based on the
type of scan.Urgency level The extent to which an appointment must be scheduled quickly
for medical reasons. There are two urgency levels relevant to scheduling: semi-urgent and non-urgent.
Block type A classification of time intervals within the weekly master schedule reserved for a specific patient category or a specific urgency level.
Block A specific time interval on a given day and MRI scanner within the weekly master schedule reserved for the patients defined in its block type.
Patient group A classification for determining access times based on whether a radiologist needed to be present during the scan and the type of MRI scanner required.

93
REDUCING MRI ACCESS TIMES
References 1 Teichgraber UK, Gillessen C, Neumann F. Methods of process management in radiology.
Rofo 2003;175(12):1627-1633.
2 Ondategui-Parra S, Bhagwat JG, Zou KH, et al. Practice management performance indicators in academic radiology departments. Radiology 2004;233(3):716-722.
3 Haronson-Daniel L, Paul RJ, Hedley AJ. Management of queues in outpatient departments: the use of computer simulation. J Manag Med. 1996;10(6):50-83.
4 Reinus WR, Totty WG. Computer-assisted scheduling of radiologists. AJR Am.J Roentgenol. 1986;147(1):203-204.
5 Reinus WR, Enyan A, Flanagan P, et al. A proposed scheduling model to improve use of computed tomography facilities. J Med.Syst. 2000;24(2):61-76.
6 Walter SD. A comparison of appointment schedules in a hospital radiology department. Br.J Prev.Soc Med. 1973;27(3):160-167.
7 Dexter F, Macario A, O’Neill L. Scheduling surgical cases into overflow block time - computer simulation of the effects of scheduling strategies on operating room labor costs. Anesth.Analg. 2000;90(4):980-988.
8 Elkhuizen SG, Das SF, Bakker PJ, et al. Using computer simulation to reduce access time for outpatient departments. Qual.Saf Health Care 2007;16(5):382-386.
9 Coelli FC, Ferreira RB, Almeida RM, et al. Computer simulation and discrete-event models in the analysis of a mammography clinic patient flow. Comput.Methods Programs Biomed. 2007;87(3):201-207
10 Hopp WJ and Spearman ML, Factory Physics, Foundations of Manufacturing Management Second Edition ed.: Irwin McGraw-Hill, 2001: 1-89.

A dynamic speed limit is used to reduce fluctuations in speed in order to prevent traffic jams
“Simple is the hardest” Johan Cruijff

6CHAPTER
How to reduce waiting timesat an MRI department of a university
radiology department
S.F. Das
P.E. JoustraJ.R.C. van Sambeek
P.J.M. Bakker
M. Maas
Submitted

96
CHAPTER 6
Abstract
Objectives To identify the causes for long waiting times at the MRI unit and the best scenarios for reducing these waiting times.Methods A process analysis was performed to gain insight into the processes of the MRI unit and into the reasons for long waiting times. A simulation model was developed to imitate the current situation and to quantify the effect of different scenarios on the waiting times. These results were then used as input for the 2k factorial design method. Results There are two main causes for waiting times in the waiting room: actual durations of scans exceeding the scheduled durations, and last-minute daily adjustments that disrupt the schedule. Reducing supervision by radiologists, more accurate attunement of scheduled and actual durations, and eliminating patients with unexpected issues from the regular MRIs reduces waiting times the most, namely 25%, 8.5%, and 5% respectively (these three form the first group of causes). Conclusions In order to reduce the waiting times at MRI facilities, reducing the supervision by radiologists is advised. Furthermore, the scheduled durations should be better attuned to actual durations, and patients with unexpected issues should be eliminated from the regular MRIs or placed at the end of the regular program.

97
HOW TO REDUCE WAITING TIMES AT THE MRI
6.1 Introduction
Reducing waiting times is a hot topic in health care management. There are two types of waiting times: the time between the referral for a consultation or diagnostic examination [1], and the time the patient actually spends waiting on the day of the appointment. Our study deals with the latter situation: the waiting time prior to an MR (magnetic resonance) examination on the day of the appointment.
Long waiting times are associated with low overall patient satisfaction (see [2-5]) particularly when perceived times exceed expectations, according to the disconfirmation paradigm [6, 7]. Furthermore, in a more competitive health market, increased waiting times decreases patients’ willingness to return [8]. Therefore, several hospitals have started programs to improve their service. Hosts and hostesses are hired to help patients find their way around the hospital, and reading tables and televisions are provided to make waiting more comfortable. Although this leads to higher patient satisfaction (being entertained during the wait is also a significant predictor of patient satisfaction [2]), this does not really tackle the cause of the problem, but just deals with its consequences.
Several studies have been published on waiting time management in outpatient departments [9] and emergency departments [10, 11]. Computer simulation has been used to optimize these processes [12]. However, very few studies have been performed on reducing waiting time in diagnostic departments. The studies that have been done in diagnostic departments are mainly concerned with X-rays and CT (computed tomography) scans and are based on a walk-in structure, in which patients have a different arrival pattern than in departments with appointment-based scheduling. Rosenquist [11] showed how queuing theory could be used for the X-ray department to balance cost of service against utilization of equipment, and to evaluate the waiting times involved. A related operations research method was shown by Jeans et al. [14], who generated a simulation model to predict the effects of changes in workload and resources on the waiting times for the X-rays. Reinus et al. [15] showed how an analytical model based on queuing theory can be used to evaluate expected steady-state wait periods for the CT scanner. By breaking as many activities as possible out of the scanner, waiting times for regular as well as urgent patients could be reduced considerably.
The main objective of our study was to test how an operations research method could be used to reduce waiting times for a more complex facility within a diagnostic department, namely the MRI (magnetic resonance imaging) unit. The MRI unit of the radiology department in the Academic Medical Center (AMC) in Amsterdam, the Netherlands was used as a case study, since the problem of long waiting times was felt to be an important logistical problem by the referring clinicians, the patients, and the department management.

98
CHAPTER 6
Our two research questions were: 1. What are the main reasons for long waiting times for the MRI?2. Which scenarios are best for reducing waiting times?
6.2 Material and Methods
A process analysis was performed to gain a better understanding of the MRI unit. This analysis was based on structured interviews with radiologists and radiological technicians (RTs), observations of the process for the MRI, and data. After this process analysis, a simulation model was developed to quantify the effect of different causes, following the 2k factorial design method that was used to determine which causes contribute most to long waiting times.
6.2.1 Process analysisThe capacity of the radiology department’s MRI unit increased from one 1.5 Tesla MRI and one 3 Tesla MRI in 2006 to two 1.5 Tesla MRIs, one 3 Tesla MRI, and one open MRI in 2007. The production of 2007 was 12,000 MRI scans. Most patients come from the outpatient and clinical departments.
There are two main patient flows at the MRI. The largest group is made up the regular patients, for whom an appointment-based, computer-based (X-care by McKesson) scheduling system is used. For the more urgent patients (i.e., when an MRI is needed from within 24 hrs to 2 weeks), manual planning is a regular procedure. This paper focuses on the first group of scheduled patients.
When patients arrive at the MRI, they check in at the reception desk, and then go to the waiting room (see Figure 6.1). A few minutes before the actual start of the MRI scan, an RT will call for the patient, bring him or her to an unoccupied dressing room, and prepare the patient for the MRI scan. This ensures optimal use of the MRI unit, and no valuable time is lost. Radiologists supervise the scans, since due to complex pathology, the majority of patients are referred from other hospitals.
Waiting roomContra
indication ? Exit
MRI scan with or without contrast
liquid or anaesthetic
Supervision by Radiologist ?
Patient arriving at reception desk
MRIno
More scans necessary ?
yes
Patient to dressing room
yes
yes no
no
Figure 6.1: Process for the MRI of a radiology department
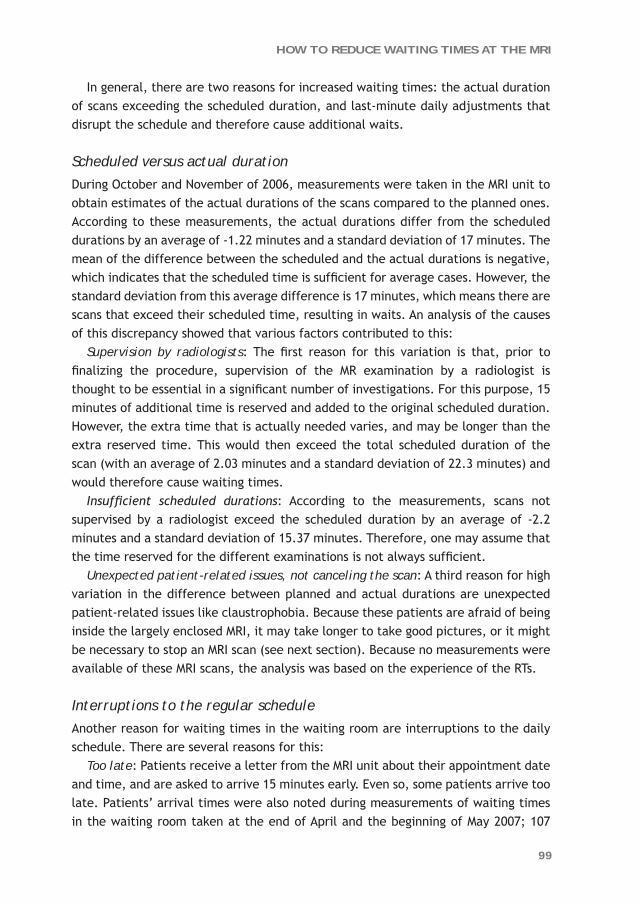
99
HOW TO REDUCE WAITING TIMES AT THE MRI
In general, there are two reasons for increased waiting times: the actual duration of scans exceeding the scheduled duration, and last-minute daily adjustments that disrupt the schedule and therefore cause additional waits.
Scheduled versus actual duration
During October and November of 2006, measurements were taken in the MRI unit to obtain estimates of the actual durations of the scans compared to the planned ones. According to these measurements, the actual durations differ from the scheduled durations by an average of -1.22 minutes and a standard deviation of 17 minutes. The mean of the difference between the scheduled and the actual durations is negative, which indicates that the scheduled time is sufficient for average cases. However, the standard deviation from this average difference is 17 minutes, which means there are scans that exceed their scheduled time, resulting in waits. An analysis of the causes of this discrepancy showed that various factors contributed to this:
Supervision by radiologists: The first reason for this variation is that, prior to finalizing the procedure, supervision of the MR examination by a radiologist is thought to be essential in a significant number of investigations. For this purpose, 15 minutes of additional time is reserved and added to the original scheduled duration. However, the extra time that is actually needed varies, and may be longer than the extra reserved time. This would then exceed the total scheduled duration of the scan (with an average of 2.03 minutes and a standard deviation of 22.3 minutes) and would therefore cause waiting times.
Insufficient scheduled durations: According to the measurements, scans not supervised by a radiologist exceed the scheduled duration by an average of -2.2 minutes and a standard deviation of 15.37 minutes. Therefore, one may assume that the time reserved for the different examinations is not always sufficient.
Unexpected patient-related issues, not canceling the scan: A third reason for high variation in the difference between planned and actual durations are unexpected patient-related issues like claustrophobia. Because these patients are afraid of being inside the largely enclosed MRI, it may take longer to take good pictures, or it might be necessary to stop an MRI scan (see next section). Because no measurements were available of these MRI scans, the analysis was based on the experience of the RTs.
Interruptions to the regular schedule
Another reason for waiting times in the waiting room are interruptions to the daily schedule. There are several reasons for this:
Too late: Patients receive a letter from the MRI unit about their appointment date and time, and are asked to arrive 15 minutes early. Even so, some patients arrive too late. Patients’ arrival times were also noted during measurements of waiting times in the waiting room taken at the end of April and the beginning of May 2007; 107

100
CHAPTER 6
patients participated in these measurements and their arrival time varied from 90 minutes early to 20 minutes late.
No-shows: Sometimes a patient does not show up at all. The RT decides if this gap is going to be filled. Although gaps can be filled by clinical patients, there is quite a difference between the moment the RT finds out there is a no-show and the moment the urgent patient actually arrives at the MRI unit. Therefore, the RT will check to see if the next scheduled patient is present. This patient can then be scanned first, followed by the urgent patient, who in this way has had enough time to be transported to the MRI. If the next scheduled patient is not present, the RT works with a certain margin of time when deciding if there is enough time left to examine an urgent patient. The margin used depends on the RT; sometimes this works out well, but other times it does not, causing waiting times.
Unexpected patient-related issues, canceling the scan: When a patient arrives at the MRI, the RT will check to see if the patient has a contraindication for an MRI, [14] for example, a pacemaker or metal parts in the patient’s body. If this is the case, the patient cannot have an MRI scan. When this happens, the RT has to make the same decisions as with a no-show. Is the gap going to be filled by an urgent patient, with the consequence of overrunning the schedule? The same holds for situations where scans of patients with claustrophobia are canceled at the start of or halfway through the scan.
6.2.2 Simulation modelA discrete event simulation model was developed to quantify the effects of different last-minute daily adjustments on the waiting times in the waiting room. A simulation model was chosen rather than an analytical model because of the high variability in the arrival times of patients and the actual durations of the scans. Discrete event simulation is concerned with modeling a system as it evolves over time by a representation in which the state variables change instantaneously at separate points in time [15]. These points in time are the ones at which an event occurs. In the case of our study, the events are a patient’s arrival at the reception desk in the MRI unit, the actual start of an MRI scan, the end of an MRI scan, and finally, the patient’s departure from the MRI suite.
Input parameters: The input parameters of our model were deterministic as well as stochastic. The deterministic input parameter is the MRI schedule, which contains the day and starting time of an MRI scan of a regular or semi-urgent patient, the scheduled duration of the scan, and the specific MRI used to make the scan. The stochastic input parameters are empiric distributions used to determine the number of urgent patients arriving on a given day, the urgency of these patients, the scheduled duration of the MRI scans, and the MRI used to make the scan. Distributions are also
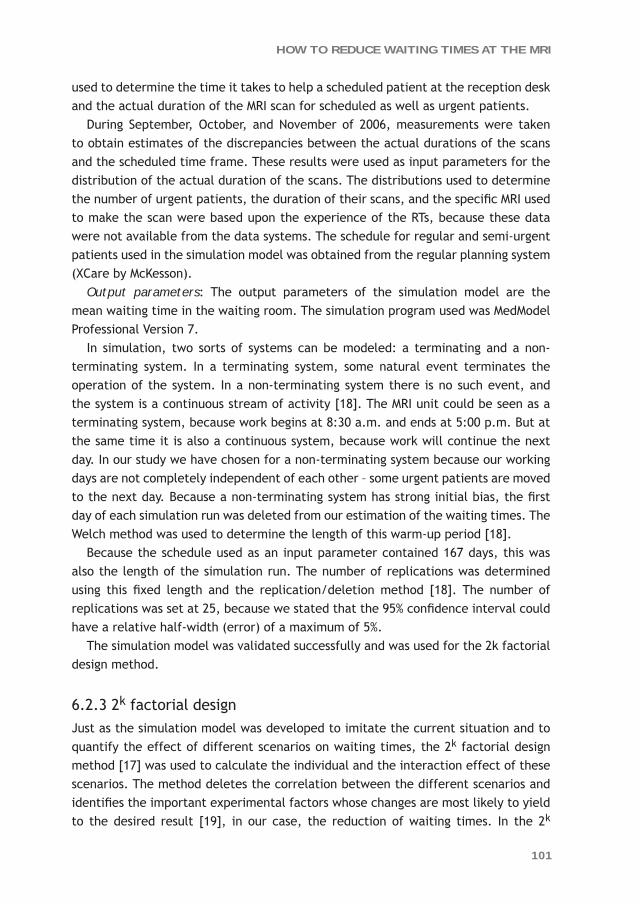
101
HOW TO REDUCE WAITING TIMES AT THE MRI
used to determine the time it takes to help a scheduled patient at the reception desk and the actual duration of the MRI scan for scheduled as well as urgent patients.
During September, October, and November of 2006, measurements were taken to obtain estimates of the discrepancies between the actual durations of the scans and the scheduled time frame. These results were used as input parameters for the distribution of the actual duration of the scans. The distributions used to determine the number of urgent patients, the duration of their scans, and the specific MRI used to make the scan were based upon the experience of the RTs, because these data were not available from the data systems. The schedule for regular and semi-urgent patients used in the simulation model was obtained from the regular planning system (XCare by McKesson).
Output parameters: The output parameters of the simulation model are the mean waiting time in the waiting room. The simulation program used was MedModel Professional Version 7.
In simulation, two sorts of systems can be modeled: a terminating and a non-terminating system. In a terminating system, some natural event terminates the operation of the system. In a non-terminating system there is no such event, and the system is a continuous stream of activity [18]. The MRI unit could be seen as a terminating system, because work begins at 8:30 a.m. and ends at 5:00 p.m. But at the same time it is also a continuous system, because work will continue the next day. In our study we have chosen for a non-terminating system because our working days are not completely independent of each other – some urgent patients are moved to the next day. Because a non-terminating system has strong initial bias, the first day of each simulation run was deleted from our estimation of the waiting times. The Welch method was used to determine the length of this warm-up period [18].
Because the schedule used as an input parameter contained 167 days, this was also the length of the simulation run. The number of replications was determined using this fixed length and the replication/deletion method [18]. The number of replications was set at 25, because we stated that the 95% confidence interval could have a relative half-width (error) of a maximum of 5%.
The simulation model was validated successfully and was used for the 2k factorial design method.
6.2.3 2k factorial designJust as the simulation model was developed to imitate the current situation and to quantify the effect of different scenarios on waiting times, the 2k factorial design method [17] was used to calculate the individual and the interaction effect of these scenarios. The method deletes the correlation between the different scenarios and identifies the important experimental factors whose changes are most likely to yield to the desired result [19], in our case, the reduction of waiting times. In the 2k

102
CHAPTER 6
factorial design, “k” is the number of experimental factors. When there are three factors, the experimental design looks like the one in Table 6.1. An experimental factor can have two levels, denoted by a – and + sign; changing a sign from its – to its + level means changing the factor from its current situation (causing waiting times) to a new situation. In the experimental design in Table 6.1, there are 23 = 8 scenarios. Two effects can be measured using the 2k factorial design: the main effect per factor, and the interaction effects. The main effect is the mean average effect on the response of changing a factor from its – to its + level. The interaction effect results from the change of more than one factor at a time. This effect can be very useful, for instance, when the effect of changing two factors is the same as changing only one of these factors. This prevents two interventions being implemented when one would have been sufficient.
Three factors were chosen for the 2k factorial design: 1) supervision by radiologists, 2) accuracy of the scheduled durations, and 3) unexpected patient-related issues (not canceling the scan). Other factors like no-shows and arrival times of the patients were not included because, in practice, these factors are difficult to influence and therefore improve.
The - level of all three factors is the current situation. The + level of the first factor is stated as the situation in which radiologists no longer check the scans made by the RTs. As mentioned earlier, measurements were carried out in the fall of 2006. During these measurements it was also noted when a radiologist wanted to check the scans. Using these results, a distribution could be determined for the actual duration of scans for the - level as well as the + level.
The + level of the second factor was accomplished by halving the variance in the difference between the scheduled durations and the actual durations of the scans, thereby leaving the mean of this difference undisturbed. Reducing the variance by half was chosen because reducing the variance to zero is very difficult to do in practice.
Table 6.1: 2k factorial design with three experimental factors
Scenario Factor 1 Factor 2 Factor 3 Response
1 - (current) - (current) - (current) R1
2 + (new) - - R2
3 - + (new) - R3
4 + + - R4
5 - - + (new) R5
6 + - + R6
7 - + + R7
8 + + + R8

103
HOW TO REDUCE WAITING TIMES AT THE MRI
The distributions used for the difference between the scheduled and the actual durations are beta and gamma. For example, the mean of the beta distribution is given by
E(X) =
where α and β are shape parameters, determined using the results of the measurements. The formula for the variance is
Var(X) =
E(X) and Var(X) were calculated for the current situation. Because the mean is kept unchanged, the E(X) formula can be rewritten as
and can be substituted in the formula for the halved variance:
Because E(X) and 21 Var(X) are both scalars (the current mean and the halved
variance respectively), the only unknown variable α can be determined and subsequently β. These α and β are used in the distributions of the + level of factor 2.
The + level of factor 3 is the situation in which there are no unexpected patient-related issues during a given day, which could be accomplished by pre-screening.
6.3 Results
The eight different scenarios were simulated and the results are shown in Table 6.2. Using the results from this table, the main effects of the different factors can be calculated:
βαα+
)1()( 2 +++ βαβααβ
αβ)(
)(1XE
XE−=
21 Var(X) =
)1)(
)(1())(
)(1(
)()(1
2
2
+−+−+
−
αααα
α
XEXE
XEXE
XEXE
Main effect (1) = 4
)12()34()56()78( RRRRRRRR −+−+−+− = -4.79
Main effect (2) = 4
)13()24()57()68( RRRRRRRR −+−+−+− = -1.67
Main effect (3) = 4
)15()26()37()48( RRRRRRRR −+−+−+− = -0.99

104
CHAPTER 6
When a factor has a negative main effect, the mean average effect on the response of changing the factor from its - to its + level is a decrease in waiting time. Factor 1 provides a reduction of 24%, factor 2 a reduction of 8.5%, and factor 3 a reduction of 5%.
The interaction effects are as follows:
Interaction effect (1,2) = 4
)87654321( RRRRRRRR +−−++−− = 0.11
Interaction effect (1,3) = 4
)87654321( RRRRRRRR +−+−−+− = -0.29
Interaction effect (2,3) = 4
)87654321( RRRRRRRR ++−−−−+ = -0.11
The interaction effects are calculated by adding up the scenarios in which the two factors have the same level, and subtracting all the scenarios in which the two levels are different. When an interaction effect is positive, it means that the waiting time is higher when the two factors have the same level; therefore, the levels should be opposite. Inversely, when the effect is negative, the two levels should be kept equal to each other.
Table 6.2: 2k factorial design applied to the MRI study
Scenario Factor 1: Supervision by
radiologists
Factor 2:Planned
durations
Factor 3:Unexpected
patient- related issues
Response:Mean waiting time
(in minutes)
1 - (current) - (current) - (current) 19.62
2 + (eliminated) - - 14.85
3 - + (better fit with actual durations)
- 18.47
4 + + - 14.24
5 - - + (no unexpected patient-related
issues)
18.18
6 + - + 13.16
7 - + + 17.14
8 + + + 12.02

105
HOW TO REDUCE WAITING TIMES AT THE MRI
6.4 Discussion
According to our analysis, there are several causes for long waiting times in the waiting room, namely the supervision by radiologists, the difference between scheduled durations and actual durations, unexpected patient-related issues, patients arriving too late, patients not arriving at all, and patients with a contraindication. Computer simulation was used to determine which causes are worth tackling. The results of the simulation model show that several parts of the process can be adjusted to reduce waiting times in the waiting room. According to the 2k factorial design, the greatest reduction would be accomplished by reducing the supervision by radiologists. If radiologists no longer check to see if the scans are satisfactory, the waiting time would be reduced by 25%. This could be accomplished by standardizing the MRI-protocols better so the quality of the scans will be satisfactory for all radiologists. In the current situation, only one radiologist decides upon the standard protocol and the other radiologists often want to check the scan and ask for additional series.
Besides a reduction in the variance of the duration of the scans and therefore in the waiting times, abolishing the supervision would also lead to the elimination of the extra 15 minutes reserved in the schedule. This means that more patients could be scheduled within the same amount of time.
Another reduction in waiting times could be achieved if the scheduled durations are more accurately attuned to the actual durations. This could lead to a reduction of 8.5%.
According to the 2k factorial design eliminating patients with unexpected issues from the regular MRI would only result in a 5% reduction in waiting times. Therefore, the mean effect of eliminating these patients is not a substantial reduction in waiting times. However, shortly after this study was finished, an open MRI was installed especially for children. This open MRI could also be used for a patient with a contraindication or a patient who is afraid of being in a common MRI.
The 2k factorial design was also used to calculate the interaction effect. Because in our case the outcomes were close to zero, the interaction effects are negligible.
In our study, we used a simulation model – which is very labor-intensive – rather than an analytical model. An analytical model is very helpful in the cases where patients walk in and the capacity has to be adapted, as shown by Reinus et al. [15]. But we did not find an applicable analytical model that determines waiting times in the waiting room for an appointment-based system. In addition, the process for an MRI is more complicated than the process for a CT scan. For comparison, Reinus et al. [15] mentioned that the scheduled durations of all scans is half an hour, whereas the MRI at the AMC has 80 different scans with 6 different durations. Furthermore, we were interested in specific steps in the process and found that the animation of

106
CHAPTER 6
the simulation model would be helpful for the communication with the radiology department.
As mentioned in the introduction section, many studies have been performed on outpatient departments and emergency departments. However, we did not found a study which simultaneously incorporated supervision, more accurate planning of scheduled durations and preemptive consultations due to unexpected patient-related issues to reduce the waiting times in the waiting room.
Our research enables us to provide clear advice to the management of radiology departments that need to reduce waiting times:
Reduce the supervision by radiologists as much as possibleMeasure the actual durations of the scans and examine which scheduled durations
need to be updated.Use pre-screening to prevent unexpected patient-related issues. Eliminate these
patients from the regular MRIs, or place them in a separate time frame where this cannot disrupt the regular program (for example, at the end of the daily program). The effect on the waiting time in the waiting room is not very substantial, but it also has a positive effect on the access time.
Even though the process on the MRI unit is complex, computer simulation is an appropriate method to evaluate different scenarios in order to reduce the waiting time. With our paper we showed that this method is not only suitable for reducing access time, but also for reducing waiting time in the waiting room at the MRI unit.
In our study we combined computer simulation with the 2k factorial design method, which we have not seen in other studies before. Although the interaction effect of the 2k factorial design was not significant in our case study, it can still be a powerful tool in other cases to evaluate the effect of multiple scenarios simultaneously.

107
HOW TO REDUCE WAITING TIMES AT THE MRI
References 1. Kreindler SA (2008) Watching your wait: Evidence-informed strategies for reducing health
care wait times. Qual Manag Health Care 17(2): 128-135.
2. Dansky KH, Miles J (1997) Patient satisfaction with ambulatory healthcare services: waiting time and filling time. Hosp Health Serv Adm 42(2): 165-77.
3. Huang XM (1994) Patient attitude towards waiting in an outpatient clinic and its applications. Health Serv Manag Res 7(1): 2-8.
4. Bar-dayan Y, Leiba A, Weiss Y, Carroll JS, Benedek P (2002) Waiting time is a major predictor of patient satisfaction in a primary military clinic. Mil Med 167(10): 842-5.
5. Slowiak JM, Huitema BE, Dickinson AM (2008) Reducing waiting time in a hospital pharmacy to promote customer service. Qual Manag Health Care 17(2): 112-127.
6. Thompson DA, Yarnold PR (1995) Relating patient satisfaction to waiting time perceptions and expectations: the disconfirmation paradigm. Acad Emerg Med 2: 1057-1062.
7. Cassidy-Smith TN, Baumann BM, Boudreaux ED (2007) The disconfirmation paradigm: throughput times and emergency department patient satisfaction. J Emerg Med 32(1): 7-13.
8. Camacho F, Anderson R, Safrit A, Jones AS, Hoffmann P (2006) The relationship between patient’s perceived waiting time and office-based practice satisfaction. North Carolina Med J 67(6): 409-422.
9. Edwards RH, Clague JE, Barlow J, Clarke M, Reed PG, Rada R (1994) Operations research survey and computer simulation of waiting times in two medical outpatient clinic structures. Health Care Anal 2:164-9.
10. Travers JP, Lee FC (2006) Avoiding prolonged waiting time during busy periods in the emergency department: Is there a role for the senior emergency physician in triage? Eur J Emerg Med 13(6):342-8.
11. King DL, Ben-Tovim DI, Bassham J (2006) Redesigning emergency department patient flows: application of Lean Thinking to health care. Emerg Med Australas18(4):391-7.
12. Fone D, Hollinghurst S, Temple M, Round A, Lester N, Weigthman A, Roberts K, Coyle E, Bevan G, Palmer S (2003) Systematic review of the use and value of computer simulation modeling in population health and health care delivery. J Pub Health Med 25(4): 325-335.
13. Rosenquist CJ (1987) Queuing Analysis: a useful planning and management technique for Radiology. J Med Syst 11(6): 413-419.
14. Jeans WD, Berger SR, Gill R (1972) Computer simulation model of an X-ray department. Br med J 1: 675-679.
15. Reinus WR, Enyan A, Flanagan P, Pim B, Sallee DS, Segrist J (2000) A proposed scheduling model to improve use of computed tomography facilities. J Med Syst 24(2): 61-76.
16. Shellock FG, Spinazzi A (2008) MRI safety update 2008: part 2, screening patients for MRI. Am J Roentgenology 191(4): 1140-9.
17. Law AM, Kelton WD (2002) Simulation Modeling and Analysis. 3rd edn. Singapore: McGraw-Hill.
18. Pidd M (2004) Computer simulation in management science. 5th edn. England: John Wiley & Sons Ltd.
19. Robinson S (2004) Simulation. The practice of model development and use. 1st edn. England: John Wiley & Sons Ltd.

An accurate weather forecast prevents people from getting soaked
“The best prophet of the future is the past.” Lord George Byron

7CHAPTER
Can statisticians beat surgeons at the planning of operations?
P.E. JoustraR. Meester
H. van Ophem
Conditionally accepted by Empirical Economics

110
CHAPTER 7
Abstract
The planning of operations in the Academic Medical Center is primarily based on the assessments of the length of the operation by the surgeons. We investigate whether duration models employing the information available at the moment the planning is made, offer a better alternative. Our empirical results indicate that statistical methods often do better than surgeons. This does not imply that the surgeons’ predictions do not contain valuable information. This information is a key explanatory variable in our statistical models. What our conclusion does entail is that a correction of the predictions of surgeons is possible because they are often under- or overestimating the actual length of operations.
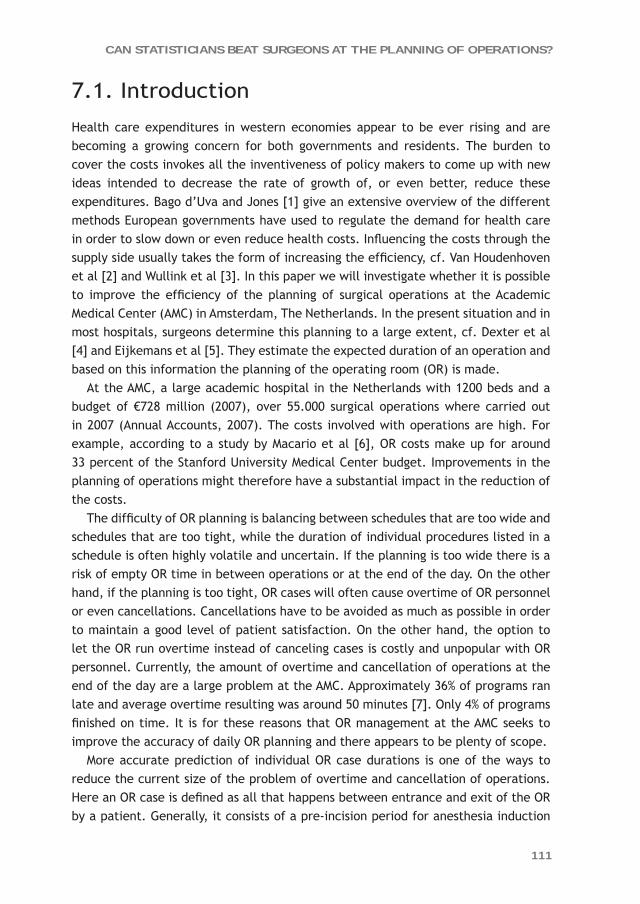
111
CAN STATISTICIANS BEAT SURGEONS AT THE PLANNING OF OPERATIONS?
7.1. Introduction
Health care expenditures in western economies appear to be ever rising and are becoming a growing concern for both governments and residents. The burden to cover the costs invokes all the inventiveness of policy makers to come up with new ideas intended to decrease the rate of growth of, or even better, reduce these expenditures. Bago d’Uva and Jones [1] give an extensive overview of the different methods European governments have used to regulate the demand for health care in order to slow down or even reduce health costs. Influencing the costs through the supply side usually takes the form of increasing the efficiency, cf. Van Houdenhoven et al [2] and Wullink et al [3]. In this paper we will investigate whether it is possible to improve the efficiency of the planning of surgical operations at the Academic Medical Center (AMC) in Amsterdam, The Netherlands. In the present situation and in most hospitals, surgeons determine this planning to a large extent, cf. Dexter et al [4] and Eijkemans et al [5]. They estimate the expected duration of an operation and based on this information the planning of the operating room (OR) is made.
At the AMC, a large academic hospital in the Netherlands with 1200 beds and a budget of €728 million (2007), over 55.000 surgical operations where carried out in 2007 (Annual Accounts, 2007). The costs involved with operations are high. For example, according to a study by Macario et al [6], OR costs make up for around 33 percent of the Stanford University Medical Center budget. Improvements in the planning of operations might therefore have a substantial impact in the reduction of the costs.
The difficulty of OR planning is balancing between schedules that are too wide and schedules that are too tight, while the duration of individual procedures listed in a schedule is often highly volatile and uncertain. If the planning is too wide there is a risk of empty OR time in between operations or at the end of the day. On the other hand, if the planning is too tight, OR cases will often cause overtime of OR personnel or even cancellations. Cancellations have to be avoided as much as possible in order to maintain a good level of patient satisfaction. On the other hand, the option to let the OR run overtime instead of canceling cases is costly and unpopular with OR personnel. Currently, the amount of overtime and cancellation of operations at the end of the day are a large problem at the AMC. Approximately 36% of programs ran late and average overtime resulting was around 50 minutes [7]. Only 4% of programs finished on time. It is for these reasons that OR management at the AMC seeks to improve the accuracy of daily OR planning and there appears to be plenty of scope.
More accurate prediction of individual OR case durations is one of the ways to reduce the current size of the problem of overtime and cancellation of operations. Here an OR case is defined as all that happens between entrance and exit of the OR by a patient. Generally, it consists of a pre-incision period for anesthesia induction

112
CHAPTER 7
and surgical preparations, the surgical procedure (possibly multiple) itself and the postsurgical period for anesthesia ‘deduction’. At most departments of the AMC, surgeons currently predict the duration of an operation at the intake of a patient based on their experience.
Unfortunately the surgeon’s estimates of the case duration are not very accurate. For example, 18% of the ophthalmologic cases carried out in the AMC between 2003 and 2008 finished more than 15 minutes early and 34% finished more than 15 minutes later than planned. For other clinical specialties with longer procedures, these numbers are even larger. Since 2008, pilots have been running at the Neurosurgery and Gynecology departments to use also the historical averages per procedure per surgeon instead of personal predictions of surgeons alone. Previous investigation by Dexter et al [4] indicates however that the historical average is unlikely to predict the variation in duration better than current predictions.
In our investigation we will predict the duration of operations on the basis of a number of different hazard models and we will compare the results with the predictions provided by surgeons. The predictions will be made on the basis of the ex ante information available, including the estimate of the duration by the surgeon. As such, using more complex statistical techniques is not a new idea, but thus far only the lognormal regression model appears to have been employed [5, 8, 9]. Here we will use the Weibull model, the loglogistic model, the Burr or Weibull-Gamma mixture model, the generalized Gamma model and the piecewise-constant hazard model as well.
We have data available of all ophthalmologic, neurosurgeric and gynecologic operations performed in the last twenty years in the AMC. Because the registration of case characteristics became more complete in 2003 only data from 2003 onwards are used. The remaining period is divided into a ‘historical‘ or ‘estimation’ period (2003 – 2007), which is used for the estimation of econometric model, and a ‘prediction’ period (January – November 2008). The performance of the different prediction methods is compared within this out-of-sample prediction period.
In the next section, the general problem of efficient OR planning and the relation with prediction of OR case duration is explained in more detail. Also, some relevant literature on prediction of individual case duration is reviewed. In section 3, we briefly discuss the statistical estimation methods and we will also discuss how the performance of the different methods will be evaluated. Section 4 contains a description of the available data and section 5 presents the empirical results. The conclusions are listed in section 6.

113
CAN STATISTICIANS BEAT SURGEONS AT THE PLANNING OF OPERATIONS?
7.2. The planning of operations
A daily OR program consists of elective cases and ambulatory cases. In this paper we define elective cases as all those cases that can be planned up to 10.30 am the day before, when the final planning has to be ready for the next day. Ambulatory cases are all cases coming through after that time. For some specialties of the hospital like general surgery there are separate emergency rooms for ambulatory cases and these cases do not disturb regular planning. For other specialties however, like Ophthalmology, where cases are usually less urgent, there is no separate emergency room. For the last category of specialties, planning of elective cases is likely to be disturbed and delayed by the ambulatory cases coming through. Usually planners account for the possibility of ambulatory cases by leaving some spare time at the end of a daily program (see Figure 7.1). For this reason we will ignore ambulatory cases. On top of that, for ambulatory cases no expected duration of the operation is recorded. Even though we do not consider ambulatory cases, a completely accurate planning of the OR capacity is impossible due to randomness or unpredictable variability in case duration. For example unforeseen complications can occur during the surgical procedure. Moreover, the unpredictability of case durations is worse than average for the AMC, due to the academic nature of the hospital which attracts relatively many of the more rare or complex cases.
Because of the impossibility of completely accurate planning, optimal planning of OR capacity is a matter of balancing between several interrelated interests for the AMC. On the one hand, the hospital is reluctant to plan too tight or ‘offensive’, with the consequence that programs are likely to delay. As mentioned in the introduction this means that either cases have to be canceled1 at the end of the program or that the OR runs overtime. The first result conflicts with the wish of the hospital to satisfy patients and the second result is not only costly but also unpopular among personnel. These problems can be avoided by leaving enough empty space at the end of the program, called ‘slack’, or by wide or ‘defensive’ planning (see Figure 7.l), but it is not hard to imagine that planning too defensive is not efficient either. If a case finishes earlier than planned, the next patient has to be prepared in advance in order to continue operating. Assuming that a patient is waiting in the preoperative waiting room no more than half an hour before he or she is scheduled to be operated, it is likely that no patient is ready to be operated after several cases have finished earlier than planned. In this case precious OR time is wasted while personnel waits for the next patient. More important even, if the entire program finishes earlier than planned, then there is almost certainly no patient at hand to fill the space remaining at the end of the day. So on the other side of the coin is the risk to plan too defensive and not fully exploit the OR capacity in between operations or al the end of the day. 1 In the AMC delays lead to cancellation of operations if the last operation(s) planned can not
be started before 4 pm, the deadline to initiate a non-ambulatory case.

114
CHAPTER 7
Most specialties within the AMC currently tend to plan offensively. This explains the numbers presented in the introduction: 36% of programs ran late and the average overtime resulting was around 50 minutes [7].
Figure 7.1: Graphical representation of daily planning
There are several ways to improve OR efficiency. A first way aims at reducing OR case duration by planning ‘straights’ of the same procedures. The idea is that surgeons or their assistants gain skillfulness during the straight resulting in reduced duration per case. This solution would have the positive effect that more procedures can be carried out on daily basis, but it does not directly address the problem of unpredictable variability in program duration [2].
Opposite to the solution of series of identical cases, is the solution of efficient portfolio selection. It is based on the idea that diversification in cases could reduce variability (risk) in the duration of an entire program. The theory originates from Nobel laureate Harry Markowitz, who intended it for asset portfolio construction and asset pricing in finance. In the hospital it could be applied by planning cases of similar variability next to each other. In theory the idiosyncratic risk of individual cases would then be partially offset, resulting in reduced variability in the duration of the entire program. Better diversification would yield better results as long as individual case durations are uncorrelated .
A third method to increase OR efficiency is to allow operating schedules to be more flexible. In the AMC the available OR time of a specific department is subdivided to individual surgeons at the beginning of the year and this subdivision is more or less fixed. For example, a surgeon always operates on Monday and Wednesday morning. More flexible schedules could improve daily and weekly planning because planners would be less constrained in finding the optimal daily portfolio of procedures.
Finally there is the solution of more accurate prediction of individual case duration, which is the central issue of this paper. This solution would first of all reduce the risk of individual cases finishing earlier or later than planned. Additionally, it is likely to reduce the risk or variability in an entire daily program as well however. This second effect would mean that less final slack is required in daily programs and therefore,

115
CAN STATISTICIANS BEAT SURGEONS AT THE PLANNING OF OPERATIONS?
that the OR can be used more efficiently without an increased risk of overtime and cancellations.
Currently there are two different methods to predict OR case durations at the AMC: prediction by surgeons and prediction using historical averages. The first method was used by Ophthalmology, Gynecology and Neurosurgery, and based solely on the experience of surgeons. For Ophthalmology, the surgeon writes an estimate of the duration of surgery at the intake form of a patient, accompanying a code for the most important surgical procedure. This estimate is supplemented by the planners of the department with a fixed amount of time for local or total anesthesia to determine the planned duration of an entire case. In 2008, the ophthalmologic surgeons underpredicted the case duration with less than 3 percent on average. The Ophthalmology department has neither an explicitly defensive nor offensive planning strategy. The ‘imprecision’ of planning measured in average absolute difference between planning and actual duration was nearly 29 percent however. Over all departments, most surgeons seem to underpredict case duration to avoid idle OR time resulting in offensive planning. Apart from an average tendency of underprediction of 17 percent AMC wide, predictions are generally imprecise with an average absolute difference between planned and actual duration of 36 percent [7].
In 2008, the Gynecology and Neurosurgery departments started to plan OR cases using the historical average of the last ten ‘similar’ cases conducted by the same first surgeon as well. Here an historical case is regarded as similar if the main procedure that characterizes the newly accepted case was at least performed within the historical case. Whether additional procedures are carried out (or other specialties operated simultaneously) does not matter for regarding the case as similar. Since multiple procedures within a case occur quite frequently, approximately 25 percent of neurosurgery cases for example, it is evident that this method of estimation is often quite inaccurate. However, the historical average is only meant as a guiding figure. Ultimately surgeons and planners still decide on the actual time to be reserved for a case. Both Gynecology and Neurosurgery seem to have benefited from the new planning method because the inaccuracy of planning was approximately 16% lower in 2008 than in the five years prior to 2008.
The inaccuracy of prediction of OR case duration on the basis of the experience of surgeons or anesthesiologists or historical averages is discussed in Dexter et al [4]. They show that although using historical averages probably reduces underestimation of OR case duration, the larger problem of imprecision remains. In the literature a number of alternative (statistical) methods have been suggested to predict OR case duration more accurately. The statistical distribution of the duration of surgery was investigated as early as 1963, when Rossiter and Reynolds [10] noted that the distribution of the duration of surgery appears to fit a lognormal distribution well. An improvement of this method can be achieved by subdividing the data

116
CHAPTER 7
into more homogeneous subgroups [11]. In Strum et al [8] the emphasis is on the appropriateness of the lognormal model (compared to the normal model) to describe case duration. It is considered category wise for categories with respect to Current Procedural Terminology (CPT) code and anesthesia type (general, local, monitored or total). They use a Friedman test to compare goodness-of-fit of the normal and the lognormal model and find that the lognormal model is preferable in 93 percent of cases. According to the authors, rejection of the lognormal model occurs if the subsample size is large, short procedure times are rounded or in case of outliers. The lesson of Strum et al [8], is not however, that the lognormal model is the most appropriate model overall to describe the distribution of case duration. In fact this topic has received little attention in literature at all and is therefore the most important topic of this paper.
In Strum et al [12] earlier findings were supplemented by comparing the normal and the lognormal model for cases consisting of exactly two procedures, resulting in even higher preference of the lognormal model. Like in Strum et al [12] and Eijkemans et al [5], discussed below, cases with multiple procedures occur in the dataset of our investigation as well.
In Eijkemans et al [5] a comparison is made between prediction of surgical duration by surgeons on the basis of historical averages and prediction on the basis of a lognormal regression model. The authors use five basic groups of regressors: operation characteristics, e.g. type of surgical procedure, session characteristics, e.g. the number of procedures, team characteristics such as experience of the team, patient characteristics such as age and Body Mass Index (BMI) and other characteristics such as the estimate of duration by the surgeon (without knowledge of an historical average). They find all categories except patient characteristics to contribute a considerable amount to the explanatory power of the model. Adding all explanatory variables significant at 30% they find an adjusted R-squared of 0.796. More importantly, the authors report a reduction in over- and underprediction of case duration by 19% and 17% respectively. Whereas Eijkemans et al [5] applies only a lognormal regression model, they have more information on cases and therefore potential explanatory factors. In our investigation we apply several other methods, but less information is available from the information system. Also we have fewer observations available.
In the papers of Dexter and Zhou [11], Strum et al [8] and Strum et al [9] it was identified that procedure, surgeon and anesthesia seem to be statistically significant explanatory factors for the duration of OR cases. Strum et al [9] and Strum et al [12] estimate a lognormal regression model that they call ‘aggregate’ for the entire set of cases, in addition to fitting two-parameter lognormal or ‘individual’ models to subclasses of the data. As additional explanatory variables to CPT code and anesthesia technique they have the age of the patient, a variable indicating physical status

117
CAN STATISTICIANS BEAT SURGEONS AT THE PLANNING OF OPERATIONS?
(ASA), emergency and surgical specialty category as explanatory variables. They do not identify any of the additional factors to be statistically significant determinants of variability in duration, comparing differences in duration after tabulation with respect to the variables.
In Dexter et al [13] a summary of articles is provided on explanatory factors for case duration. In this study first of all they explain differences in components of case duration by different medical conditions, different anatomic procedures used for the same medical condition and different approaches to achieve the same anatomic result. They too find that for prediction on the basis of the scheduled procedure(s), the operating personnel and anesthetic(s) considerable inaccuracy remains. Therefore they have searched for studies that use information from outside OR information systems such as medical records of surgeons, radiology pictures and patient demographics. They find little evidence however of these alternative explanatory factors significantly contributing to increased accuracy in prediction.
7.3. Statistical methods
The variable of interest is the duration of an operation. The natural method of analysis of durations is hazard models. Lancaster [14] and Cameron and Trivedi [15] give an extensive overview of these models. Since our objective is not so much the understanding of the contributing factors to the duration of operations but to get optimal predictions of the duration and since there are no clues to which model to use, we will apply a broad range of hazard models and simply evaluate important sample statistics to see what hazard model is the optimal one and whether we can outperform the predictions of surgeons. As stated before we will estimate the model on part of the available data (about 80% of the data) and make predictions on the remaining part (about 20% of the data). We will consider the following duration models:2
l the Burr or Weibull-gamma mixture hazard model l the Weibull hazard model l the loglogistic hazard modell the generalized gamma hazard model l the lognormal hazard modell the piecewise constant hazard (PCH) model.
The Burr-hazard model is a ‘mixture’ model and nests the Weibull and loglogistic hazard models. Originally the Burr stems from allowing for a gamma distributed unobserved heterogeneity in the Weibull model. The Weibull hazard belongs to the
2 In an earlier version of this paper [16] we also report results on the exponential hazard model and on an alternative specification of the piecewise constant hazard model.

118
CHAPTER 7
class of proportional hazard specifications and this means that the hazard function can be written as:
where t denotes the duration, xi is a vector of explanatory variables and θ = (ψ,β) are unknown parameters. The usual choice on the specification of is exp(β’ xi). Allowing for unobserved heterogeneity means that an error is added to this last specification:
Under the assumption of a gamma-distrubuted εi and using the Weibull hazard, the Burr hazard model results. The cumulative distribution function of the Burr is
where α > 0. σ2 reflects the variance of the unobserved heterogeneity term εi. The Weibull distribution is obtained by letting σ2 → 0 thereby losing the unobserved heterogeneity part.3 The loglogistic distribution is yet another special case that can be obtained by putting σ2 = 1. Unobserved heterogeneity might be an important addition to the model because of e.g. the occurrence of complications during surgery. Apart from the loglogistic and the Burr distribution, the generalized gamma (discussed below) distribution also allows for unobserved heterogeneity. All other distributions used in this analysis do not.
The generalized gamma family of models belongs to a different class of models than the previous models described, namely the class of Accelerated Failure Time (AFT) models. This means the model can be expressed as follows:
where in this case ui = wi/α and exp(wi) is Gamma(m) distributed and λ(β’ xi) is the hazard function [14]. The ui term is a disturbance term that allows for unobserved heterogeneity. The distribution of the disturbance term implies that the generalized gamma family of models is characterized by the following density function:
3 The exponential distribution is a special case of the Weibull distribution and can be obtained by setting α = 1.

119
CAN STATISTICIANS BEAT SURGEONS AT THE PLANNING OF OPERATIONS?
where Г(m) is the gamma function. α (≥ 0), m (> 0), and ϕi (> 0) are the parameters of the model. Regressors are brought in by letting ϕ(xi, β) = exp(β’ xi). The density reduces to the Weibull density if α = 1, to the two-parameter gamma density if m = 1, to the lognormal density if α =0 and to the exponential density if both α = 1 and m = 1.
The lognormal hazard model is already applied by Sturm et al [9] and Eijkemans et al [5]. It assumes that the natural logarithm of duration is normally distributed with mean β’ xi and variance σ2. The model is most intuitively presented as a linear regression model:
where ui is normally distributed with mean 0 and variance σ2. This model can be estimated with OLS and this might explain the popularity of this model in the literature.
The piecewise constant hazard model belongs to the class of proportional hazard characterized by (1). The main characteristic of the piecewise constant hazard model is that it allows the baseline hazard λ0(t) to be a step function so that this hazard is constant in prespecified time intervals. In this sense it is a generalization of the standard exponential model for which the hazard is restricted to be constant across the entire range of t. So, in the piecewise constant hazard model we have
where c0 = 0 and cM = ∞ and the other thresholds are specified, but the αj’s have to be estimated. As before, regressors are brought in by letting ϕ(xi, β) = exp(β’ xi) in (1). Depending on how small the intervals are taken over which the hazard is assumed to be constant, the model can be made as flexible as needed but at the cost of introducing additional parameters that have to be estimated. We will use a time interval of 10 minutes.4
We estimate the predicted duration of an operation by the expected duration calculated from the ML-estimation. The expected durations are given by the following expressions:5
4 We also investigated a 5 minutes time interval. The results did not improve compared to the model with the 10 minutes time interval.
5 Cf. p. 68 of Lancaster (1990). The expected durations of the Weibull, loglogistic and lognormal hazards are special cases of the ones listed here.

120
CHAPTER 7
In order to calculate the expected duration of the piecewise constant hazard model we need to introduce some notation first. Given the duration of the operation ti and the length of the time interval Δt, we can calculate mi as follows:
mi defines the relevant j in eq. (7) for each observation. Using standard results on the relation between the hazard and the distribution function [15] and partial integration, we get:
Prediction performance measuresTo evaluate the predictions for the durations of operations following from the above listed models and stated by the surgeons we will consider the following performance measures:6
l MEAN: the mean of the estimated operation timel AD: the average difference between prediction and actual durationl AAD: the average absolute difference between prediction and actual durationl rMSE: the root mean squared errorl UPx: the proportion underprediction by more than x = 10, 20 and 30 minutesl OPx: the proportion overprediction by more than x = 10, 20 and 30 minutes
Performance is optimal when an unknown ‘loss function’ is minimized. This loss function will depend on factors like the ones listed above. To evaluate the quality of the prediction methods we have to depend upon these factors in combination. This is unlikely to lead to clear cut and completely objective conclusions, but we believe that we are able to at least give a strong indication to what prediction method to prefer.
6

121
CAN STATISTICIANS BEAT SURGEONS AT THE PLANNING OF OPERATIONS?
7.4. Data
The AMC has started registration of case duration and some characteristics as early as 1988. In this investigation we have decided however to use the data from 2003 onwards. The first reason is that so much has changed in the OR and in operation technology since 1988 that the early information is not likely to be relevant for current case duration prediction. What is more, many case characteristics that are available through the OR information system today, were not registered until 2003. We retrieved information on operations performed by three different specialties: Ophthalmology, Neurosurgery and Gynecology. The selection of specialties allows for the investigation of a wide variety of OR cases that is more or less representative for the AMC. Neurosurgical cases are generally very complex and demanding and accordingly have the longest average duration as well as the largest spread in duration. Many unpredictable complications can occur during a case. Ophthalmologic cases are usually shorter and less unpredictable. Gynecology combines the extremes of Ophthalmology and Neurosurgery, consisting of many very short procedures as well as relatively many of the more complicated and especially long-lasting cases. Together these specialties make up for an interesting and widespread collection of cases to investigate statistically.
Sample statistics on the actual and planned duration of the estimation and prediction samples can be found in Table 7.1. For Ophthalmology the data set resulting from the selection of procedures consists of 5299 observations of which 1208 (22.8%) lie in the prediction period of approximately 11 months. The average duration in
Table 7.1: Sample statistics on the actual and planned duration of operations
Ophthalmology Neurosurgery Gynecology
Estimation sample
Prediction sample
Estimation sample
Prediction sample
Estimation sample
Prediction sample
Nr of obs 4092 1208 1863 423 3472 796
Actual duration
Mean 75.6 72.0 245.0 217.4 110.5 109.7
Stand. dev. 41.3 37.0 178.2 183.2 97.2 93.9
Minimum 6 11 20 26 10 7
Maximum 735 397 1544 1115 863 775
Planned duration by the surgeon
Mean 75.3 72.1 188.9 184.7 93.9 103.1
Stand. dev. 30.5 25.8 108.7 148.9 83.0 83.8
Minimum 10 15 15 30 5 15
Maximum 330 300 660 784 507 426
Unit of measurement of all sample statistics: minutes.

122
CHAPTER 7
the estimation period is 75.6 minutes with a minimum of 6 and a maximum of 735 minutes. Around 95% of the cases last no longer than 2 hours. The average planned duration is right on the spot. The standard deviation of the planning is quite a bit lower than that of the actual duration. These figures grossly reflect the character of ophthalmologic procedures: they are of short duration and duration is relatively easy to predict. The nature of the operations of Neurosurgery is very different than those of Ophthalmology. First of all, the dataset consists of only 2286 observations in total of which 423 (18.5%) lie in the prediction period. The 95th percentile is now greater than 500 minutes, whereas average duration is 245 minutes. Especially the right tail of the distribution is spread out much more for Neurosurgery therefore than for Ophthalmology. The planned duration appears to systematically underestimate the actual duration. The difference between planned total duration and actual total duration of all operations in the estimation sample is almost 30%. The planned spread is also substantially smaller than the actual spread. The underprediction of the duration of operations appears to be systematic. Gynecology entails a combination of short procedures and very long procedures, although not as long as the longest neurosurgeric procedures. Because of this combination, the average duration of 111 minutes lies somewhere in between. The 95th percentile is near 300 minutes. The spread also lies somewhere in the middle. Also for Gynecology the planned duration differs considerably from the actual duration and again there appears to be an underprediction. The total number of observations is 4268 and 796 (18.7%) observations lie in the prediction period. Although the sample statistics differ for two periods distinguished, the conclusions drawn before hold also for the prediction sample.
In terms of underprediction, the surgeons of Ophthalmology and Gynecology the surgeons appear to predict the durations of the operations somewhat better in the prediction sample than in the estimation sample. Figure 7.2 reveals that this is also true for Neurosurgery. In this figure we have depicted the averages of the fraction of the predicted and actual durations calculated cumulatively for each integer percentage of the complete sample ordered across time. So for the combined estimation and prediction sample, the average fraction is calculated for the first 1%, the first 2% up to 100% of the sample and depicted in Figure 7.2. If we consider the first 30% of the sample, we find that the mean of the average fraction is more or less constant for each of the three specialties but from that point on the average fraction starts moving towards 1.7 The predicted duration by the surgeons divided by the actual duration varies from about 0.65 (Gynecology) to 0.8 (Ophthalmology). For the full sample we find fractions of about 0.95 (Ophthalmology) and 0.9 (Neurosurgery
7 The 30% sample size corresponds to the period October 2004. Apparently, something changed in the prediction methods of the surgeons for all three disciplines. The exact reason for this is unknown to us, but one way or another surgeons were stimulated to make better predictions.

123
CAN STATISTICIANS BEAT SURGEONS AT THE PLANNING OF OPERATIONS?
Figure 7.2: The average fraction of the predicted and actual durations of operations as a function of sample size of the estimation and prediction period
and Gynecology) This indicates that the quality of the surgeon’s predictions are better in the prediction sample than in the estimation sample.
Since the estimation sample is much larger than the prediction sample, the steady increase of the fraction predicted duration/actual duration, also reflects that in the prediction sample, the surgeon’s predictions are even better than might be concluded from Figure 7.2. To investigate this further, consider Figure 7.3. It represents exactly the same information as used in Figure 7.2, but now only for the prediction period. From about 20% of the sample, the fractions are remarkably stable at about 1.12 (Ophthalmology), 0.95 (Neurosurgery) and 1.02 (Gynecology). Using this measure we even find that for two out of three specialties, the surgeons overpredict the duration of operations.8 Again, the overall conclusion has to be that the surgeon’s predictions have become much better in time. As a result our statistical prediction methods have to compete with the relatively better predictions of the surgeons. The improvement of the surgeon’s predictions is likely to be due to the AMC putting more emphasis on the importance of good estimation of operation duration in latter years.9
Apart from the distributional assumptions underlying any econometric regression model, the dependent variables of the model are the most important factors to explain (or describe) the differences in case duration. Since our efforts are aimed
8 This conclusion appear to contradict the Table 7.1, where we find underprediction for Neurosurgery and Gynecology. However, if we weigh with duration the fractions are almost identical to the ones that can be deduced from Table 7.1. This indicates that larger prediction errors are made for longer durations.
9 E.g., as we have stated before, from the beginning of 2008 the departments of Neurosurgery and Gynecology also use information on the historical average duration per surgeon in the planning of operations.

124
CHAPTER 7
at predicting operation durations as good as possible we will include all information available to us, but only if this information was available before the operation was scheduled. A complete list of the variables used can be found in the appendix. The explanatory variables can be divided into a number of categories. Following Eijkemans et al [5], the explanatory variables are distinguished in five categories: operation characteristics (e.g. type of surgical procedure), session characteristics (e.g. the number of surgical procedures), team characteristics (experience of the team), patient characteristics (health condition indicators) and other case characteristics (the predicted duration of the operation by the surgeon). In the first instance, the predicted duration of the operation by the surgeons appears to be a peculiar explanatory variable to use since it seems to be at odds with the objective of this investigation. However, what we are interested in is to predict the duration of operations as good as we can with the use to statistical techniques and on top of that evaluate whether the use of such methods has the potential to improve the predictions as given by surgeons. As such these expectations are likely to contain very valuable information for the prediction of case duration, although, these expectations appear to be biased (see Table 7.1 and Figures 7.2 and 7.3). Note that the surgeon shares all the information we have, but has even more information because some information on e.g. the urgency of the operation and on the patient’s health is not recorded.
There are a few problems in the data that we need to discuss here. We experience a significant amount of missing values. To solve this problem we replaced the missing values by the average of the variable (in case that an average has a meaning) or
Figure 7.3: The average fraction of the predicted and actual durations of operations as a function of sample size of the prediction period

125
CAN STATISTICIANS BEAT SURGEONS AT THE PLANNING OF OPERATIONS?
by zero values (in the case of e.g. dummies). In each of these cases a separate binary variable is generated that is equal to 1 for the missing information. Especially the group of patient characteristics is registered very irregularly and the discrete variables indicating health are nearly constant at zero (no complications). As a result, these particular variables are expected to have limited explanatory power.
Another complication in the data available is the prevalence of measurement errors both in the dependent variable and in at least one important explanatory variable. The measurement error in case duration is caused by the fact that operating personnel tends to round off operating room durations to a five minute precision level. For example quite distinguished peaks are seen in the spike plot of Ophthalmology every five minutes compared to relative lows in between (Figure 7.4), especially around an hour. Another indication can be found in Table 7.1. The minimum and maximum planned durations are all factors of five minutes. The rounding errors might have an effect on the performance of the continuous prediction methods in this paper. We have experimented with rounding off predictions to a five minute precision level and we concluded that the rounding off does not appear to have a systematic effect.
Figure 7.4: Spike plot of ophthalmologic operation duration
Another variable that is known to be subject to measurement error is the first surgeon. The first surgeon reported a priori is not always the one who is actually performing the surgery. Although the first surgeon is the one responsible for the operation, the second surgeon or an assistant surgeon may be taking all or part of the action. If this is the case it is no longer possible to determine the correct effect of a surgeon on duration. Moreover, other parameter estimates might be biased as

126
CHAPTER 7
well. Unfortunately there is little that can be done about this flaw. Evidently, our predictions as well as current AMC predictions could have benefited to some extent from correct information concerning the surgeon.
A final complication is the fact that part of the cases consists of multiple procedures. For a rough sketch, approximately 29% of ophthalmologic cases, 27% percent of gynecologic cases and 25% of neurosurgeric cases between 2003 and 2008 consisted of 2 to maximally 8 procedures. To make the final insight into the applicability of statistical methods as complete as possible, we deliberately consider these cases as well. For the multiple-procedure cases we have chosen to use only the main procedure and the total number of procedures within the case as explanatory variables, instead of using all information and adding each performed procedure. The latter approach is not expected to deliver better results because the additional time required for extra procedures is usually less than the time required for the procedure if it stands by itself. The most important explanation for this difference is the fact that multiple procedures usually overlap in time. The second approach would introduce a measurement difficulty that would not be solved easily. At least many more explanatory variables would be required. The former approach, also taken by Van Houdenhoven [2], is preferred mainly because the corresponding parsimony is expected to weigh more heavily on prediction performance than the loss of information attached to it.
7.5 Empirical results
We estimate the duration of an operation for the three specialties Ophthalmology, Neurosurgery and Gynecology separately with several hazard specifications and with the use of all information available at the moment operations are scheduled. We do not strive to get a model that is capable of explaining the duration but we are interested in the best prediction possible. As a result we decided to plug in all information available to us. To investigate the quality of a duration model we split up our three samples into two parts: (1) an estimation subsample, on which the model is estimated, containing about 80% of the complete sample and (2) a prediction subsample, on which we predict durations, containing about 20%.10
The estimation results will not be discussed in detail. We will only present some common features across the three specialties. The estimated prediction of the length of the operation tends to be underestimated by the surgeons. This result is stronger within the neurosurgical and gynecological specialties. In all estimations the surgeon’s expectation contributes significantly to the model. Other strongly significant variables are the number of surgical procedures performed during the
10 The subsample sizes are approximate because the actual division of the sample was based on a date.

127
CAN STATISTICIANS BEAT SURGEONS AT THE PLANNING OF OPERATIONS?
Table 7.2: Prediction measures Ophthalmology (1208 operations)
Surg Lnorm Weibull Loglog Burr GenΓ PCH10
MEAN 72.13 71.75 72.96 71.55 71.63 71.80 72.65
AD 0.13 -0.25 0.96 -0.35 -0.38 -0.20 0.65
AAD 18.62 15.47 16.25 15.34 15.35 15.46 16.15
rMSE 25.81 23.05 23.68 22.99 23.00 23.04 23.85
UP10 0.26 0.23 0.22 0.24 0.23 0.23 0.23
UP20 0.17 0.13 0.13 0.14 0.14 0.14 0.14
UP30 0.10 0.07 0.07 0.08 0.08 0.07 0.08
OP10 0.38 0.30 0.33 0.29 0.29 0.30 0.33
OP20 0.17 0.12 0.14 0.12 0.12 0.13 0.14
OP30 0.06 0.05 0.06 0.04 0.04 0.05 0.06
Shaded entries represent the best result. The predicted duration and actual duration are measured in minutes.
operation, characteristics of the first surgeon and the type of operation. Patient characteristics do not appear to have a strong impact.
Shaded entries represent the best result. The predicted duration and actual duration are measured in minutes.
Table 7.2 presents the prediction measures for Ophthalmology.11 The definition of the measures as well as the models applied are discussed in section 3. In the second column information is listed on the prediction of the surgeons (Surg). The other columns present prediction measures with respect to the indicated hazard specifications. The results show first of all that all prediction methods are quire accurate in terms of the average duration predicted, where the surgeons score best. With respect to the other prediction measures, the differences are more pronounced and always in favor of the statistical prediction methods. For the absolute deviations, the prediction error is ranging from about 15.3 minutes (loglogistic hazard) to 18.6 minutes (surgeons), a difference of nearly 18%. In terms of this measure, two models distinguish themselves favorably: the Burr and the nested loglogistic hazard model. The differences with generalized gamma and the lognormal are relatively small. With respect to the under- and overprediction, the hierarchy of the results are very similar, although the results are even closer. The Weibull may perform quite well in terms of underprediction, but this result is offset by the relatively poor performance with respect to overprediction. Note that maximizing a likelihood function does not imply that the best predictions will be found. The results with respect to the Burr hazard are in some instances worse than those of nested models like the Weibull and loglogistic hazard. Overall, the loglogistic model appears to perform best.
11 We will only present estimation results based on the generalized gamma distribution for Ophthalmology. For the other specialties, α was estimated to be negative and as a result E(t) can not be calculated.

128
CHAPTER 7
Table 7.3 presents the same prediction measures for Neurosurgery. The conclusions are more or less in line with Ophthalmology, although neurosurgeons underpredict the duration of their operations seriously. Surgeons underestimate the duration of neurological by more than half an hour on average or with about 15%. A striking result is that the statistical methods appear to overpredict the duration in our estimations, although in a much less serious manner than the underprediction of the surgeons.
Table 7.3: Prediction measures Neurosurgery (423 operations)
Surg Lnorm Weibull Loglog Burr PCH10
MEAN 184.67 233.26 250.21 230.97 231.33 289.32
AD -32.70 15.88 32.83 13.60 13.96 71.94
AAD 68.29 58.46 70.53 56.15 56.23 105.90
MSE 103.14 104.94 135.81 99.19 99.14 454.30
UP10 0.51 0.34 0.30 0.34 0.34 0.30
UP20 0.44 0.26 0.22 0.25 0.25 0.21
UP30 0.40 0.20 0.16 0.21 0.21 0.16
OP10 0.33 0.46 0.51 0.47 0.47 0.52
OP20 0.25 0.35 0.43 0.35 0.35 0.42
Shaded entries represent the best result. The predicted duration and actual duration are measured in minutes.
Part of the explanation might be the large difference between the mean duration of operation in the estimation and prediction sample for Neurosurgery. On top of that, the standard deviations shows a reversed pattern (cf. Table 7.1). The best result obtained is for the loglogistic model yielding an overprediction of the total operation time of on average 14 minutes or with 6.2%. The Weibull and piecewise-constant hazard perform even worse than the surgeons in this respect. The absolute average deviations are closer, but still most statistical methods outperform the surgeons considerably. Here the difference between the most accurate models and the planning of surgeons is approximately 12 minutes or 18%. As for Ophthalmology, the Burr, the loglogistic and the lognormal model appear to outperform the other methods. In terms of under- and overprediction the results are very similar as was encountered before. In the opposite direction, the surgeons appear to score very well at the overprediction percentages, but this is a result of the strong tendency to underpredict of surgeons. Overall, the Burr and the loglogistic models seem to obtain the best scores and their scores are quite similar. The Weibull model might be preferred if underprediction is considered to be a very serious error. As before, the lognormal hazard stays somewhat behind on the Burr and the loglogistic model.
Table 7.4 present the results for Gynecology. As we argued before, the durations of operations in this specialty are somewhere in between the previous specialties

129
CAN STATISTICIANS BEAT SURGEONS AT THE PLANNING OF OPERATIONS?
considered. In this case again the surgeons are clearly outperformed by the statistical methods. Only with respect to the first overprediction class, surgeons perform relatively well. With respect to all other measures, the predictions by the surgeons are outperformed by at least three statistical methods. In terms of AAD, the difference between the most accurate method (loglogistic) and the planning of the surgeons is approximately 3.5 minutes or 13%. Overall, the best predictions are found for the Burr hazard model. The loglogistic hazard performs almost as good as the Burr.
Table 7.4: Prediction measures Gynecology (796 operations)
Surg Lnorm Weibull Loglog Burr PCH10
MEAN 103.06 106.15 94.56 105.73 107.11 98.75
AD -6.62 -3.54 -15.13 -3.95 -2.58 -10.93
AAD 26.02 22.63 29.05 22.50 22.55 29.48
MSE 45.78 42.47 48.29 42.40 42.33 59.19
UP10 0.38 0.29 0.44 0.29 0.28 0.39
UP20 0.25 0.20 0.32 0.20 0.19 0.28
UP30 0.17 0.14 0.24 0.14 0.13 0.21
OP10 0.25 0.31 0.23 0.31 0.32 0.25
OP20 0.14 0.14 0.12 0.12 0.14 0.14
OP30 0.08 0.07 0.06 0.07 0.07 0.08
Shaded entries represent the best result. The predicted duration and actual duration are measured in minutes.
An illustration of the planning of operations.
Looking at individual operations, as we do in Tables 7.2, 7.3 and 7.4, does give information on the quality of the prediction methods but does not show the full and most interesting picture. In most cases more than one operation is scheduled every day and it might be that mispredictions of the duration of individual operations lead to less misprediction or even stronger mis-prediction of the entire day. In order to investigate this, it would be optimal to employ the actual planning algorithm of the AMC. Unfortunately, this is far too complex to be employed in our cases. For example, in the actual planning degree of urgency of operations is taken into account and this information is not entered in the information system and therefore, not available to us. Many other elements of the necessary information to make this planning are not available to us as well. To get an idea about the quality of the prediction methods we decided to adopt a very simple planning method and apply it to Gynecology.12 We use the prediction samples with the operations arranged according to the actual operation date and time, and simply plan the operations according to the predicted
12 Some alternative planning strategies are considered in Joustra et al (2010). The main conclusions do not differ from the ones presented here. Results for the other specialties can be found there as well.

130
CHAPTER 7
duration of the operation. After having created a fictitious operation schedule in that way, we confronted the schedule with the actual durations of the operations and calculated some performance measures. As far as we can see this is a straightforward and fair way of evaluating the different planning methods. If it favors any of the methods it will be the one based on the surgeon’s evaluations since the actual order of the operations is determined on the basis of these expectations.
We will adopt one simple planning strategy: we plan up to six hours per day and overtime is never allowed, except for the first operation that day. We limited planned operations to six hours to allow for some slack at the end of the day.13
The performance methods we use are the number of days necessary to perform all operations according to the prediction method used (denoted by ‘Days’), the number of minutes with idle time of the operation room (denoted by ‘Undertime’) , the number of minutes of with overplanning of the operation room (denoted by ‘Overtime’) and the number of times an operation had to be canceled (denoted by ‘Cancellations’). Operations are canceled if the expected duration of the last scheduled operation minus the time left until the end of the day exceeds 60 minutes and if the expected duration of the last scheduled operation minus time left that day, relative to the time left that day is smaller than 0.5.14
We only report the results for the predicted duration of operations as made by the surgeons, the predicted duration on the basis of the lognormal hazard (since this is the most commonly used hazard function in the literature) and the most promising (according to Tables 7.2, 7.3 and 7.4) statistical methods (i.e. the loglogistic and the Burr hazard).
Table 7.5 presents some characteristics of the complete planning of the operations in the prediction period for Gynecology specialty. An important indicator of the quality of the planning is the number of days necessary to program all operations. The surgeons appear to do a little better than the statistical methods, except for the planning based on the Weibull predictions. However, for a fair comparison, account should be taken of the relative large amount of overtime generated by the surgeon’s predictions. To win 4 days, surgeons increase overtime by about 1800 minutes, or about 5 full 6-hour days. With respect to undertime three out of four statistical methods perform better than the surgeons, although the difference is not large. The number of cancellations is best for the Burr distribution, although the lognormal and loglogistic score more or less the same.
To actually make an assessment about the quality of the prediction methods a straightforward way to proceed is to define a cost function that combines the quality measures in a single cost measure. Apart from Pandit and Carey [17], no attempts
13 We also investigated a planning based on 7 and 8 hours a day. In that case the conclusions are quite similar.
14 Changing the cancellation policy by putting e.g. the relative factor to 1, does not have a consequential impact on the conclusions.
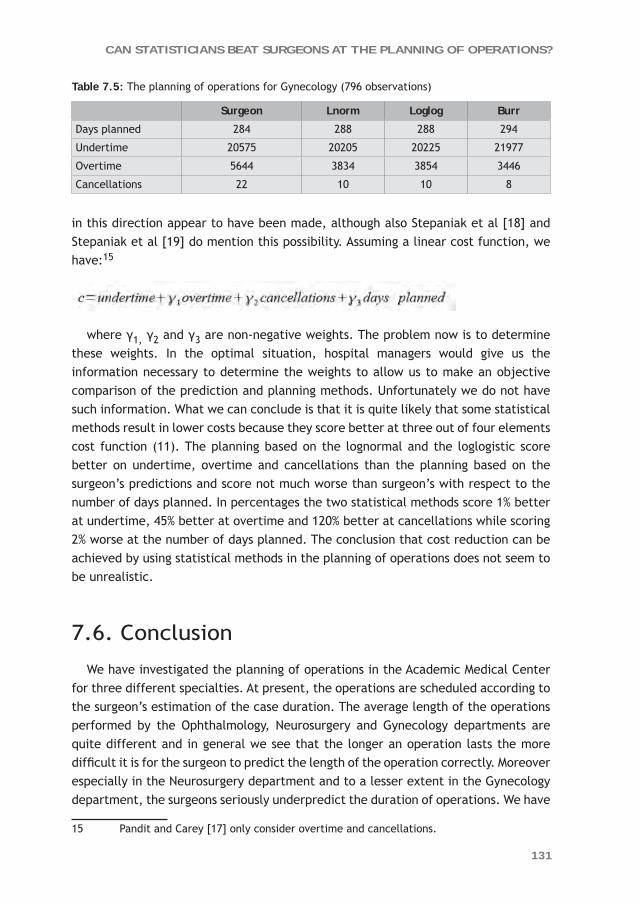
131
CAN STATISTICIANS BEAT SURGEONS AT THE PLANNING OF OPERATIONS?
Table 7.5: The planning of operations for Gynecology (796 observations)
Surgeon Lnorm Loglog Burr
Days planned 284 288 288 294
Undertime 20575 20205 20225 21977
Overtime 5644 3834 3854 3446
Cancellations 22 10 10 8
in this direction appear to have been made, although also Stepaniak et al [18] and Stepaniak et al [19] do mention this possibility. Assuming a linear cost function, we have:15
where γ1, γ2 and γ3 are non-negative weights. The problem now is to determine these weights. In the optimal situation, hospital managers would give us the information necessary to determine the weights to allow us to make an objective comparison of the prediction and planning methods. Unfortunately we do not have such information. What we can conclude is that it is quite likely that some statistical methods result in lower costs because they score better at three out of four elements cost function (11). The planning based on the lognormal and the loglogistic score better on undertime, overtime and cancellations than the planning based on the surgeon’s predictions and score not much worse than surgeon’s with respect to the number of days planned. In percentages the two statistical methods score 1% better at undertime, 45% better at overtime and 120% better at cancellations while scoring 2% worse at the number of days planned. The conclusion that cost reduction can be achieved by using statistical methods in the planning of operations does not seem to be unrealistic.
7.6. Conclusion
We have investigated the planning of operations in the Academic Medical Center for three different specialties. At present, the operations are scheduled according to the surgeon’s estimation of the case duration. The average length of the operations performed by the Ophthalmology, Neurosurgery and Gynecology departments are quite different and in general we see that the longer an operation lasts the more difficult it is for the surgeon to predict the length of the operation correctly. Moreover especially in the Neurosurgery department and to a lesser extent in the Gynecology department, the surgeons seriously underpredict the duration of operations. We have
15 Pandit and Carey [17] only consider overtime and cancellations.
132
CHAPTER 7
investigated the potential of several statistical methods to see whether they do a better job than the surgeons with respect to predicting the duration of operations correctly. In many cases this appears to be the case. Moreover in the future, the prediction period can be extended and the statistical estimations will probably be even more accurate.
In the literature the lognormal model is proposed as an adequate method to represent the duration of operations. From our investigation it follows that this choice, especially for longer durations, is not the optimal prediction method, although the differences are not very large.. The Burr distribution, or its special case the loglogistic distribution, appears to perform slightly better. Both these distributions allow for unobserved heterogeneity.
We did not engage in further fine tuning of the statistical methods. For instance, it might be worthwhile to define subclasses of expected case durations and to optimize per subclass. We could distinguish short/medium/long expected durations, according to frequencies of types of operations or according to the number of procedures in the operation. Dexter and Zhou [11] indicates that this is a useful way to proceed. A brief investigation on our own data has shown us that there indeed is some potential here.
Finally, we want to state that the surgeons’ expectations of the case duration is vital. from worthless. This expectation is an important explanatory variable in our statistical models. Our recommendation, therefore, is not to use statistical methods exclusively, but only in combination with information supplied by the surgeon.

133
CAN STATISTICIANS BEAT SURGEONS AT THE PLANNING OF OPERATIONS?
Appendix: The explanatory variables used in the estimation of the durations.
1. Operation characteristics
- Procedure (x times). This dummy variable is equal to 1 for the procedure it is named after. For each procedure that is investigated there is one variable like this.
- surgeon (x times). This binary variable is equal to 1 if surgeon is the first surgeon of a case. Each operating staff member or senior assistant that was still operating in 2008 has a separate variable. (Co-)Assistants are therefore not included as well as retired or departed staff, for the sake of parsimony. Their inclusion is required in theory to determine the correct effect of the other surgeons on duration. In practise however we have not noticed any positive effect of their inclusion on prediction.
- Anaescode. This categoric variable indicates the type of anaesthetic and is 0 if anaesthesia was monitored or no technique was reported in OKPlus. Furthermore, it is 1 if anaesthetics are inducted locally, 2 if anaesthetics are inducted regionally and 3 if anaesthetics are inducted totally. Obviously duration increases with anaescode.
- Monitor. It is a binary variable equal to 1 if anaesthesia was monitored.
2. Session characteristics
- No_anaes. This is a binary variable equal to 1 if no anaesthesiology is reported (excluding the initial period of January 2003 till October 2004 for which a separate variable is defined). It is generated to exploit potential information about the duration of a case present in the fact that the type of anaesthesia is not reported. First of all no report could simply mean that no anaesthetics were inducted. Perhaps other reasons exist as well however.
- No_anaesreg. It is a binary variable equal to 1 for the initial period of January 2003 until October 2004 in which anaesthesiology was not reported at all.
- Totprocs. This is the total number of surgical procedures within a single case. It is the only variable used together with the previous to describe the surgical part of a case. Second and third procedures are left unidentified thereby, mainly for the sake of parsimony (see the discussion in section 3.3).
3. Team characteristics
- Experience. This variable is defined only for Neurosurgery to separate personnel into four classes of experience, 1 the least experienced until 4 most experienced. It may perhaps serve as a parsimonious replacement of the surgeon dummy-variables. The specialty has divided personnel over these static classes itself, not using strict definitions for each class.

134
CHAPTER 7
- Age_oper. The inclusion of the age of the surgeon is intended to capture the time-effect in experience of an surgeon and the influence thereof on duration. An surgeon is likely to become faster, especially in the beginning of his career [2]. Age_oper is zero if the age of an surgeon is missing.
- No_age. This is a binary variable equal to 1 if age_oper is missing.- D_oper2. This is a binary variable equal to 1 if a second surgeon is present during a
case.
4. Patient characteristics
- Compli_code, Pulmon_code, cardia_code, allerg_code, gencond_code. These are four categoric variables indicating the medical condition of a patient in 3 levels. These characteristics are registered by and of special interest for anaesthesiologists. The variables are set equal to zero if not reported.
- No_compl. This is a binary variable equal to 1 if the above information is missing. Either all four variables are reported or they are not.
- Sober. This binary variable is equal to 1 if a patient is sober. Again, this is information used by anaesthesiologists.
- Asacode. This is a variable indicating the condition (ASA) of the patient from 1 (good) to 5 (lethal).
- No_asa: This binary variable is 1 if asacode is missing.- Age_patient. - Weight. The weight of the patient is set equal to average weight if missing.
5. Other characteristics
- Location. This is a binary variable designed to discriminate between cases on the ‘daily’ and the clinical OR. It is equal to 1 for cases conducted in the clinical OR.
- Dur_pl. This is planned case duration. It is included because it reflects the beliefs of surgeons about the duration (even if surgeons tend to underpredict structurally). It may therefore contain information the surgeon has that is not reported. A drawback of the inclusion of this variable is that it allows surgeons to influence predictions. New models would have to be estimated every now and then to neutralize this effect.
- First. This is a binary variable equal to 1 if a case start between 7.50am and 8.10am, meaning the case is the initial case of the day. Initial cases often delay because part of the OR personnel is late. The variable allows for such an effect.
- Time. This is a count variable counting the days between operating and the 1st of January 2003. This variable is included to capture time-trends in OR case duration induced by technological progress for example.

135
CAN STATISTICIANS BEAT SURGEONS AT THE PLANNING OF OPERATIONS?
References 1. Bago d’Uva T, Jones AM (2009) Health care utilization in Europe: New evidence from the
ECHP. J of Health Econ 28:265-279.
2. Van Houdenhoven M, Van Oostrum JM, Hans EW, Wullink G, Kazemier G (2007) Improving Operating Room Efficiency by Applying Bin-Packing and Portfolio Techniques to Surgical Case Scheduling. Anesth & Analg 105:707-714.
3. Wullink, GM, Van Houdenhoven M, Hans EW, Van Oostrum JM, Van Der Lans M, Kazemier G (2007) Closing Emergency Operating Rooms Improves Efficiency. J of Med Syst 31:543-546.
4. Dexter F, Macario A, Ledolter J (2007) Identification and Systematic Underestimation (bias) of Case Durations During Case Scheduling Would Not Markedly Reduce Over-utilized Operating Room Time. J of Clin Anesth 19:198-203.
5. Eijkemans MJC, Van Houdenhoven M, Nguyen T, Boersma E, Steyerberg EW, Kazemier G (2010) Predicting the Unpredictable: A New Prediction Model for Operating Room Times Using Individual Characteristics and the Surgeon’s Estimate. Anesth 12:41-49.
6. Macario A, Vites TS, Dunn B, McDonald T (1995) Where Are the Costs in Perioperative Care?: Analysis of Hospital Costs and Charges for Inpatient Surgical Care. Anaesth 83:1138-1144.
7. Benchmarking OR (2008) Benchmarking: Een Kwestie van Leren, digital publication on URL: www.benchmarking-ok.nl.
8. Strum, DP, May JH, Vargas LG (2000a) Modeling the Uncertainty of Surgical Procedure Times. Anesth 94:1160-1167.
9. Strum DP, Sampson AR, May JH, Vargas LG (2000b) Surgeon and Type of Anaesthesia Predict Variability in Surgical Procedure Times. Anesth 92:1454-1466.
10. Rossiter CE, Reynolds JA (1963) Automatic Monitoring of the Time Waited in Out-patient Departments. Med Care 1:218-225.
11. Dexter F, Zhou J (1998) Method to Assist in the Scheduling of Add-on Surgical Cases. Anesth 89:1228-1232.
12. Strum DP, May JH, Sampson AR, Vargas LG, Sprangler WE (2003) Estimating Times of Surgeries with Two Component Procedures. Anesth 98:232- 240.
13. Dexter F, Dexter EU, Masursky D, Nussmeier NA (2008) Systematic Review of General Thoraric Surgery Articles to Identify Predictors of Operating Room Case Duration. Anaesth & Analg 106:1232-1241.
14. Lancaster T (1990) The Econometric Analysis of Transition Data. Cambridge University Press.
15. Cameron AC, Trivedi PK (2005) Microeconometrics, Cambridge University Press.
16. Joustra P, Meester R, Van Ophem, H (2010) Can Statisticians Beat Surgeons at the Planning of Operations, Discussion paper 2010/06, UvA-Econometrics, Amsterdam School of Economics, University of Amsterdam.
17. Pandit JJ, Carey A (2006) Estimating the Duration of Common Elective Operations: Implications for Operating List Management. Anesth 1:768-776.
18. Stepaniak PS, Heij C, Mannaerts GH, de Quelerij M, De Vries G (2009) Modeling Procedure and Surgical Times for Current Procedural Terminology-Anesthesia-Surgeon Combinations and Evaluation in Terms of Case-Duration Prediction and Operating Room Efficiency: a Multicenter Study. Anesth & Analg 109:1232-1245.
19. Stepaniak, PS, Heijand C, De Vries G (2010) Modeling and Prediction of Surgical Procedure
Times. Stat Neerl 64:1-18.

The Eastern Schelde storm surge barrier was constructed to prevent floods
“The first step to getting the things you want out of life is this: Decide what you want.” Ben Stein

8CHAPTER
How to juggle priorities? An interactive tool to provide quantitative support for strategic
patient-mix decisions: an ophthalmology case
P.E. JoustraJ. de Wit
V.M.D StrubenB.J.H. Overbeek
P. FockensS.G. Elkhuizen
Health Care Management Science 2010;13(1):17-26
138
CHAPTER 8
Abstract
An interactive tool was developed for the ophthalmology department of the Academic Medical Center to quantitatively support management with strategic patient-mix decisions. The tool enables management to alter the number of patients in various patient groups and to see the consequences in terms of key performance indicators. In our case study, we focused on the bottleneck: the operating room. First, we performed a literature review to identify all factors that influence an operating room’s utilization rate. Next, we decided which factors were relevant to our study. For these relevant factors, two quantitative methods were applied to quantify the impact of an individual factor: regression analysis and computer simulation. Finally, the average duration of an operation, the number of cancellations due to overrun of previous surgeries, and the waiting time target for elective patients all turned out to have significant impact.
Accordingly, for the case study, the interactive tool was shown to offer management quantitative decision support to act proactively to expected alterations in patient-mix. Hence, management can anticipate the future situation, and either alter the expected patient-mix or expand capacity to ensure that the key performance indicators will be met in the future.

139
HOW TO JUGGLE PRIORITIES?
8.1 Introduction
8.1.1 MotivationThe increasing demand for health care and, at the same time, the pressure to restrict budgets, is putting more and more pressure on hospitals to perform. However, it might not be enough to just improve efficiency, especially where demand significantly exceeds supply over the course of multiple successive months or even years. The question often comes down to deciding either way: to reduce demand in general, or to make more specific decisions about certain patient groups. However, to make the right decision, the medical management of a teaching hospital has to juggle different priorities, namely, constraints from the medical perspective (research and education), from the legal perspective (the obligated care region and last resort1), capacity usage, and financial feasibility. This paper will focus on the first three aspects.
8.1.2 Description of the problem In the case presented in this paper, the ophthalmology department at the Academic Medical Center (AMC) in Amsterdam was dealing with a restricted budget and long queues. This department had a waiting list of over one year for elective surgical procedures, a list that was steadily growing because for the past few years, demand had exceeded supply by approximately 30%. Seeing that the access times for a consultation at the outpatient department (OPD) were stable, and the nursing ward had sufficient capacity, the AMC ophthalmology department’s main bottleneck was the operating room capacity. Therefore, we focused primarily on the operating room, rather than on the outpatient department or the nursing ward.
To reduce the waiting lists for elective ophthalmologic surgery, we first optimized the capacity usage. Unfortunately, this optimization was not enough to solve the problem completely. Even with the maximum feasible expansion of capacity, the waiting lists would not be reduced to a satisfactory level. Therefore, we were forced to reduce the workload and thus the number of patients to ensure that the waiting time target for surgical procedures would be met in the future. To decide upon a feasible patient mix, medical management had to make sure all patients in the obligated care region could be treated, and that, as part of their training, the resident physicians could see a sufficient number of secondary level of care patients. The remaining capacity could be used for research purposes. In conclusion, the aim of medical management was to maximize the number of surgeries performed on preferred patients while meeting the key performance indicator (KPI) targets for the operating room.
1 Last resort indicates that patients can not be treated in other hospitals and the AMC is the last option for these patients.

140
CHAPTER 8
Currently, management lacks the proper decision support for determining the consequences of their decisions and therefore for making good choices. Because of this, we wanted to build an interactive tool to quantitatively support management with these difficult strategic patient-mix decisions. By using the tool for various patient groups, management is able to set the targets for the KPIs, and observe the resulting capacity requirements of the OPD, the operating room, and the nursing ward.
8.1.3 Literature review for interactive decision-support tool for strategic patient-mix decisionsIn the majority of operations research studies in health care, decision support was provided by solving a specific problem. Few studies described a decision-support tool that made medical management self-supporting and able to solve similar problems on a regular basis. Kusters and Groot [1] developed a decision-support tool for admission planning for elective patients on a waiting list to optimally utilize the available beds, nursing staff, and operating room in the short term. Multiple studies reported on the use of a “balanced scorecard,” which helps medical management meet financial goals [2-5].
Vissers et al. [6] addressed the patient-mix optimization problem of cardiothoracic surgery at the tactical level. Although Vissers et al. modeled the capacity usage of both the operating room and the nursing ward, waiting times or other performance targets were not explicitly taken into account. Ma et al. [7] described a methodology for determining the optimal case mix for maximizing hospital profits with the given resource capacity. The hospital in our case is a teaching hospital, where research and education play prominent roles and maximizing profit is not the main objective. In addition, we wanted management to decide upon the best patient mix directly, rather than specifying the weights for all patient groups and therefore indirectly optimizing the patient mix. Blake and Carter [8] described a methodology for strategic resource allocation in hospitals. Similar to Vissers et al. and Ma et al., Blake and Carter assumed the available operating room time and total number of bed days available to be independent of the patient mix. Therefore, KPIs such as a waiting time performance target, a maximum risk of overtime, or a maximum percentage of cancellations were not explicitly taken into account.
In summary, we found no articles describing an interactive tool for supporting medical management with patient-mix decisions and linking these strategic decisions explicitly to the preferred KPIs such as waiting times. Previous research on patient-mix decisions has used rules of thumb to predict the effect of alterations in patient mix on KPIs. For example, the maximum utilization rate of an operating room was assumed to be a certain percentage (e.g., 85%), without taking a specific surgical case mix into account (e.g., the distribution of case durations and the percentage of urgent procedures). This assumption is in direct conflict with studies that reported

141
HOW TO JUGGLE PRIORITIES?
the dependency of surgical case mix and an operating room’s utilization rate on the one hand and the resulting performance in terms of waiting times [9] and accepted risk of overtime on the other [10].
8.1.4 ObjectiveThe objective of this study was to develop an interactive tool to quantitatively support the management of the AMC ophthalmology department with their strategic patient-mix decisions while taking the KPIs into account. This interactive tool will enable management to alter the number of patients in various patient groups and to see the consequences in terms of the KPIs of the OPD, the operating room, and the nursing ward. Iteratively, they will be able to decide upon a future patient mix with a balance between supply and demand that will allow the targets for the KPIs to be met.
To be user-friendly, we developed the interactive decision-support tool in MS Excel. To decide upon the appropriate level of detail, we applied two quantitative methods: regression analysis and computer simulation.
8.2 Study setting
To develop our interactive tool, we studied the AMC ophthalmology department. Because the AMC is a teaching hospital, the ophthalmology department offers both secondary and tertiary level medical care. Nearly all the secondary level of care patients are seen by resident physicians as part of their professional training, and they are supervised by attending physicians. In addition, the department has three tertiary groups of surgeons focusing on various subspecialties: the front segment of the eye (cornea and glaucoma patients), back segment of the eye (medical retina, surgical retina, diabetes, and uveitus patients), and the outer segment of the eye (orbital and pediatric ophthalmology patients. During our study each group (called a segment) consisted of five or six physicians specialized in one or two subspecialties each.
In 2008, more than 6,000 new patients and almost 28,000 follow-up patients were seen at the OPD. Furthermore, in the same year, the ophthalmology department performed almost 2,400 surgical procedures. As the majority of the surgical procedures were performed in an outpatient setting, the nursing ward of the AMC ophthalmology department was relatively small.
At the start of our study in August 2008, the access times2 for multiple subspecialties varied between four and eight weeks. Furthermore, the department had a waiting list of over one year for several elective surgical procedures. Although the access times at the OPD were stable for all subspecialties, the waiting list for surgical procedures
2 In this article we use the term access time for the number of days a patient has to wait until the first appointment at the OPD and we use the term waiting time for a surgical procedure.

142
CHAPTER 8
was growing steadily because demand have exceeded supply for the past few years. The AMC ophthalmology department set the access time target at 90% of patients within two weeks, and the waiting time target for surgical procedures at 80% of patients within five weeks.
Because we focused primarily on the operating room, we will describe how the available capacity was used within the AMC. The total operating time was allocated specifically to the AMC ophthalmology department at the start of the year. All elective patients (inpatients as well as outpatients) were scheduled for surgery by a specific surgeon in an operating session dedicated to that particular surgeon. Consequently, each surgeon had his or her own waiting list for elective patients. Given that the AMC is a teaching hospital, resident surgeons usually perform some part of each surgery under supervision of an attending surgeon. Furthermore, shortly before the day of surgery, the semi-urgent and urgent patients were scheduled in reserved urgent time slots that were not surgeon-specific. To limit the number of cancellations due to prioritizing urgent patients, management needed to reserve enough urgent time slots to deal with the fluctuating number of urgent patients.3 At the same time, management also wanted to use the scarce operating time efficiently, and did not want to reserve too many urgent time slots since they may remain idle. Note that operating time that becomes available due to late, unexpected, cancellations could be used for urgent patients as well. To limit overtime, management also had to make sure that a scheduled operating session included enough slack time to deal with unexpected events during the day (e.g., a late start or fluctuations in sedation time or turnover time). It should be noted that the AMC ophthalmology department has a case mix with predominantly short case duration and is thus at greater risk of cancellations due to overruns.
8.3 Study design
The patient population was divided into various patient groups to enable management to alter the numbers of patients per patient group and experiment with different patient mixes. To make it easier to integrate capacity and financial decisions, each patient group consisted of several related “diagnosis-treatment codes” (in Dutch, “diagnose behandel combinaties,” or DBCs, which are similar to diagnosis-related groups, or DRGs). As a result, most of the groups represented a single subspecialty. The secondary level of care patients4 were all gathered into one group, and the remaining DBCs were gathered into another group. We assumed that with this
3 Note that almost all urgent surgeries had to be performed in the operating time specifically allocated to the ophthalmology department.
4 Secondary level of care patients are referred by general practitioners, in contrast to third line-patients, who are referred by other hospitals to an academic hospital.
143
HOW TO JUGGLE PRIORITIES?
partition, the average capacity usage of the OPD, the operating room, and the nursing ward would be independent of a group’s size.
8.3.1 Appropriate level of detailBefore we describe the modeling of the OPD and the operating room, we first have to elucidate the appropriate level of detail for the nursing ward. We assumed that as long as the capacity demand for the nursing ward did not exceed the previous year’s production, the capacity would be sufficient in the future. The capacity demand per patient group was calculated by multiplying the number of patients in a patient group by the capacity usage per patient. The total capacity demand was the sum of all the patient groups.
With regard to the OPD, we added more detail and compared the capacity demand and the previous year’s production per segment. At strategic level, it was sufficient to compare the capacity per segment: because multiple physicians within a single segment were specialized in more than one of that segment’s subspecialties, they were able to treat patients from other subspecialties within that segment.
To accurately predict whether a future patient mix would meet the waiting time target and other operating room KPIs, we had several alternatives for the level of detail. A first alternative was to use a rule of thumb for the maximum allowed utilization rate for the operating room (e.g., 85%), and thus the maximum workload for a specific patient mix. Unfortunately, this was not sufficiently accurate. A second alternative for determining the maximum allowed utilization rate was to use the previous year’s actual utilization rate. This utilization rate already implicitly incorporated all departmental aspects such as patient-mix characteristics, aspects related to personnel and organization, and the previous year’s achieved KPIs. However, if we were to use the previous year’s utilization rate, we would be implicitly assuming that none of the departmental aspects would change in the future. The patient mix in particular will change, because the medical management of the AMC ophthalmology department has to reduce the total capacity usage of the operating room, and so consequently, the number of patients. Furthermore, management was not satisfied with the achieved KPIs.
To calculate the maximum allowed utilization rate, we performed a literature review to identify all the factors that influence an operating room’s utilization rate. Next, we decided which factors were relevant to our study, and thus should be included. Finally, we quantified the effect of the included factors on the maximum allowed utilization rate of the operating room and incorporated these results into the interactive decision-support tool.

144
CHAPTER 8
8.3.2 Definition of the operating room utilization rate Several alternatives were available for determining the operating room utilization rate. In our study, we defined the operating room utilization rate according to the definition commonly used within the AMC: the sum of all surgeries scheduled within an operating session that were not cancelled during the day divided by the total session time.
Note that this definition of the utilization rate includes unforeseen overtime. In contrast, unscheduled urgent patients were not included in this, nor were turnover times. It should be noted that because the AMC has emergency operating rooms, we excluded emergency patients in the analyses of the maximum allowed utilization rate of the operating rooms that are dedicated to elective and semi-urgent and urgent patients.
8.3.3 Literature review to identify factors that influence an operating room’s utilization rateTo identify all factors that might influence an operating room’s utilization rate, we performed a literature review. We divided the factors into several categories, and explored each of these categories:a. Management decisionsb. Patient-mix characteristicsc. Organizational factorsd. Personnel-related factorse. Cancellations due to other reasons
a. Management decisions
Management decisions regarding KPIs influence an operating room’s utilization rate. For instance, a stringent target (e.g., 80% of patients must have surgery within five weeks) requires more operating time to deal with fluctuations to the number of patients [9]. Furthermore, as Van Houdenhoven at al. [10] show, there is a link between accepted risk of overtime and utilization rate: if management accepts a higher risk of overtime, the utilization rate will increase as well. A strongly related management decision is the maximum allowed percentage of cancellations due to overrun of previous surgeries [11]. For an ophthalmology department with a majority of relatively short surgical case durations, a stringent cancellation target will lead to a defensive scheduling strategy, and thus a lower utilization rate. Another management decision concerning cancellations is the maximum allowed percentage of cancellations due to prioritized semi-urgent and urgent patients. Although dedicating more urgent time slots will reduce the number of cancellations, these urgent time slots are at greater risk of remaining idle than regular time slots due to a lack of urgent patients

145
HOW TO JUGGLE PRIORITIES?
on a specific day [12]. Consequently, more urgent time slots will decrease the overall utilization rate of the operating room. The final management decision that influences the utilization rate is the target for the accuracy of a surgery’s starting time [13].
b. Patient-mix characteristics
The second category of factors is patient-mix (or surgical case-mix) characteristics. The distribution of the case durations has a significant impact on the operating room utilization rate. Therefore, we incorporated two specific aspects of the distribution of case durations, namely, (1) the average case duration and (2) the percentage of case durations shorter than one hour. The first is a measure of the average number of turnovers between succeeding surgeries. Please recall that because turnover times were not included in the operating room utilization rate, it is plausible that more surgeries per day result in a lower utilization rate. The second is a measure of the ability to fully schedule the available operating time, due to the bin-packing effect. Therefore, we expected that a higher percentage of short durations results in a higher utilization rate.
Another patient-mix characteristic is economy of scale: a large department may be able to use the available operating time more efficiently than a small one [14].
Finally, the percentage of urgent patients combined with the urgency level may influence the utilization rate as well [15]. A higher percentage of urgent patients requires more urgent time slots to ensure that the percentage of cancellations due to urgent patients will not increase. Please recall that more urgent time slots will decrease the utilization rate. Furthermore, the degree of fluctuations in the daily and weekly numbers of urgent patients will affect the number of urgent time slots, and therefore also the operating room utilization rate, according to the definition used at AMC. The same holds for the fluctuations in the weekly number of regular patients: the more this weekly number fluctuates, the larger the chance a time slot will not be used, and thus lower the utilization rate [16]. The same reasoning holds for seasonal patterns in demand.
c. Organizational factors
The third category included organizational factors. The first organizational factor is the division of operating time among various specialties. In general, a more flexible use of capacity among various specialties results in a higher operating room utilization rate. Consequently, the degree of subspecialty is also relevant to the utilization rate. In general, the more the available capacity is subdivided among subspecialties (or even among individual physicians), the lower the utilization rate [17]. Note that flexible usage among specialties does require fully equipped operating rooms.

146
CHAPTER 8
Also, the scheduling algorithm is an important organizational factor affecting the efficient use of operating room capacity. Various studies [18-21] reported efficiency improvements with alternative scheduling algorithms.
Moreover, fluctuations in the availability of operating time (e.g., due to public holidays and vacation periods) tend to reduce the utilization rate [22].
Another organizational factor is the turnover time. Both the average and the variation in the turnover time are relevant to the operating room utilization rate [23]. If the variation in turnover time is high, more slack time is required to limit the risk of overtime. A related factor is the availability of a separate sedation room to limit the time between two surgical procedures.
The final organizational factor we found in the literature was the availability of surgical materials and surgical trays. Obviously, if availability is well organized, the utilization rate is higher. In contrast, if materials or surgical trays are often unavailable or incomplete, surgery may take longer and the utilization rate may become lower.
d. Personnel-related factors
The next category of factors is related to the operating room personnel. The first personnel-related factor concerns the punctuality of surgeons and anesthesiologists: many studies reported on late starts in the operating room or waiting times during the rest of the day [24]. Also, the accuracy of the predicted case durations impacts the utilization rate [25]. If surgeons are able to predict their case durations accurately, the actual durations will not differ much from the scheduled durations, and the schedule will be full more often without undue risk of overtime and cancellations due to overruns of previous surgeries. A related factor is the number of resident physicians: it is harder to accurately predict case durations if a resident physician performs all or part of the surgery [26, 27]. Using the same reasoning as for the previous factor, a higher number of resident physicians is likely to reduce the operating room utilization rate.
e. Cancellations due to other reasons
Having already discussed management decisions concerning cancellations, namely the percentage of cancellations due to overruns of previous surgeries or prioritized urgent patients, in this section we describe cancellations due to other reasons.
Several reasons for cancellations are patient-related: the patient cancelled the surgery or did not show up (specifically with outpatient surgery), there was a change in the patient’s clinical status, the patient was not ready for surgery, or the preoperative screening was not performed (or was not performed properly).
In addition, some reasons for cancellations are hospital-related: there was no postoperative bed available, there was a lack of medical instruments or equipment,

147
HOW TO JUGGLE PRIORITIES?
Table 8.1. Overview of relevant factors
Description of category and corresponding factors Relevant to our case study?
Management decisions
Waiting time target for elective patients Yes
Accepted risk of overtime Yes
Maximum number of cancellations due to overrun of previous surgeries
Yes
Maximum number of cancellations due to prioritizing urgent patients
Yes
Accuracy of surgery starting time No
Patient-mix characteristics
Average case duration Yes
Percentage of case durations shorter than one hour Yes
Economy of scale No
Percentage of urgent patients Yes
Fluctuations in weekly number of urgent patients No
Fluctuations in demand per week and seasonal pattern No
Organizational factors
Division of operating time among specialties No
Degree of subspecialty No
Flexibility in use of operating rooms No
Scheduling algorithm No
Fluctuations in availability of operating time per week and seasonal pattern
No
Average and variation of turnover times No
Separate sedation room No
Availability of materials and surgical nets No
Personnel-related factors
Specific surgeons No
Number of resident physicians No
Degree of accuracy of scheduled case durations No
Late start in operating room and waiting for surgeon or anesthesiologist during the day
No
Cancellations due to other reasons
Patient-related reasons No
Hospital-related reasons No

148
CHAPTER 8
one or more members of the operating team were unavailable, there was an administrative cause, or a communication failure.
8.3.4 Selection of relevant factors For our study, we had to select the relevant factors from an extensive list of factors that might influence operating room utilization rate (see Table 8.1). In this section, we clarify why we included or excluded specific factors from our study. If an alteration to the number of patients per patient group was not expected to have a significant impact on a specific factor, we excluded it. The reason for including or excluding specific factors is described in the same order as the categories in the previous section.
Because we wanted to enable medical management to experiment with different decisions, we included the waiting time target for elective patients, the accepted risk of overtime, and the maximum percentage of cancellations due to overrun of previous surgeries or due to prioritizing urgent patients. Only the accuracy of a surgery’s starting time was excluded, because this was not considered a KPI in the AMC.
Our goal was that medical management would use the interactive tool to experiment with different numbers of patients per patient group to see the consequences in terms of the operating room KPIs. As this alteration might significantly change the distribution of case durations, we decided to include the average case duration and the percentage of case durations shorter than one hour. In the future the department most likely wants to keep using all available operating time and the department was not allowed to acquire significantly more operating time. For this reason it is not likely that the future capacity will deviate from the current capacity significantly. Therefore, changes in economy of scale will be relatively small and consequently, we excluded this factor. By contrast, we included the percentage of urgent patients. Our definition of urgent patients is “patients who need to have surgery within eight days”, because the elective operating schedule had to be fixed in the remaining period. The reasoning to include this factor is that the percentage of urgent patients differs substantially between the different patient groups and subsequently, an alteration in the number of patients per patient group is likely to change the overall percentage of urgent patients. The final patient-mix factors – namely, the fluctuations in the weekly number of urgent and elective patients and the seasonal pattern – were excluded, because we assumed these fluctuations will not change in the near future.
With regard to organizational factors, we assumed that no major alterations will occur in the near future. Therefore, we excluded all organizational factors from the rest of our study. We used the same reasoning for personnel-related factors and cancellations due to other reasons, and thus excluded all personnel-related factors as well.

149
HOW TO JUGGLE PRIORITIES?
8.4 Quantitative modeling
The second column of Table 8.1 shows whether we included or excluded a specific factor. Next, we wanted to quantify the impact of all included factors on the maximum allowed utilization rate of the operating room, and selected regression analysis for this purpose. With regression analysis, a number of actual utilization rates and actual realizations of the included factors were used to determine the respective coefficients of a regression model that can be used to predict the utilization rate with different values for the included factors. Unfortunately, the waiting times for elective patients achieved in the past could not be retrieved from any of the AMC information systems because the department only started to schedule patients in the operating room information system “OKplus” in June 2008. Before that, the department entered the scheduled patients in OKplus just one week before the surgery date, and because the date the surgery was requested was not included, the actual waiting time could not be determined. Therefore, we interviewed the scheduler of the ophthalmology department and the waiting times for elective patients seemed to be more than six months during the past few years. We expected that a six month waiting time would not have had significant impact on the realized utilization rates. For these two reasons, we used computer simulation to quantify the effect of the waiting time target for elective patients on the maximum allowed utilization rate.
To calculate the final prediction of the maximum allowed utilization rate, we adapted the utilization rate predicted by regression analysis with the results of the computer simulation.
8.4.1 Regression analysis For the analysis, we collected monthly data points: one data point contained the actual utilization rate and the corresponding values of all included factors (see the next section for details).
To perform the regression analysis [28], we used SPSS. We applied the backward stepwise procedure to identify significant factors, and in each step the least significant factor was excluded from the model, but only if the p-value was larger than 0.05.
Subsequently, the regression equation y = a + b1x1 + b2x2 + … + bnxn was used to calculate the maximum allowed utilization rate, where y = the maximum allowed utilization rate, a = the model constant, and b = the regression coefficient (Bi) of factor(xi).
8.4.2 Computer simulation In the interactive tool, we used computer simulation [29] to quantify the effect of a more stringent waiting time target for elective patients on the maximum allowed

150
CHAPTER 8
utilization rate of the operating room. The waiting time target can be set per patient group to enable management to differentiate between the various groups.
We scheduled a patient in the first week with available capacity according to the First Come First Served principle. To limit the level of detail, we determined the waiting time in number of weeks. Then, both demand and capacity were specified in number of surgeries per week. To accurately predict the alteration in utilization rate, we incorporated the fluctuations in weekly demand and in weekly capacity into our simulation model. We assumed that physicians were not available a certain percentage of the weeks, and randomly selected a week with no demand and no capacity. Unfortunately, we did not have enough data to perform a proper data fit for the fluctuating weekly demand. Therefore, we experimented with both a discrete uniform distribution and a Poisson distribution to check the sensitivity of the outcomes for different types of distribution. Finally, we selected the distribution with worst case outcomes. To be able to easily experiment with different weekly capacities (resulting in different utilization rates), we modeled the fluctuating weekly capacity with a Poisson distribution in all scenarios.
Next, instead of simulating each patient group, we simulated several categories with different average weekly numbers of surgeries (e.g., two or four surgeries). Within each category, we experimented with various threshold values for the waiting time (e.g., five weeks, nine weeks, three months, and six months), and we determined the minimum weekly capacity (with a precision of 0.01) to ensure that at least 80% of the patients experienced less waiting time than the threshold value. Subsequently, the maximum allowed utilization rate per category for meeting a specific waiting time target was calculated by dividing the average weekly demand by this minimum weekly capacity. To select the corresponding category of a patient group, we rounded down the actual average weekly number of surgeries of the specific patient group.
We built the simulation model in Enterprise Dynamics Version 8. We constructed a confidence interval for the percentage of patients experiencing less waiting time than the threshold value. To obtain a 5% half-width for the 95% confidence intervals, the run length (excluding warm-up period) was set at ten years and we ran the model for 300 replications per experiment. In addition, the warm-up period was set at one year. If the lower bound of the confidence interval was larger than 80%, the capacity was considered to be sufficient.
8.4.3 Interactive toolFor the interactive tool, we combined the results of the regression analysis and the computer simulation. Therefore, we adapted the utilization rate predicted by regression analysis for the effect of a more stringent waiting time target for elective patients. Formula (1) shows how we adapted the maximum allowed utilization rate predicted by regression analysis to incorporate the impact of a more stringent

151
HOW TO JUGGLE PRIORITIES?
waiting time target. To calculate the department’s overall utilization rate with the preferred waiting times, we determined the weighted average of the utilization rates corresponding to the preferred waiting time and the category of the specific patient group (see formula (2)). In addition, the department’s overall utilization rate with the current waiting times was the weighted average of the corresponding utilization rates of the individual patient groups (see formula (3)).
Let: ρfinal : the maximum allowed utilization rate predicted by regression
analysis and adapted by simulation
ρMVA : the utilization rate predicted by regression analysis
ρpref : the department’s overall utilization rate with the preferred waiting times
ρcur : the department’s overall utilization rate with the current waiting times
μn : the average demand of patient group n, n = 1,…, N
catn : the corresponding category of patient group n with catn =
durn : the average duration of a surgery in patient group n
ρcatn,Wpref : the simulation-based, maximum allowed utilization rate for the category of patient group n to meet the preferred waiting time Wpref
ρcatn,Wcur : the simulation-based, maximum utilization rate for the category of patient group n that corresponds to the average waiting time of the past year Wcur
(1)
(2)
(3)
cur
prefregfinal ρ
ρρρ ×=
( ) ( )∑∑==
×××=N
nnn
N
nWprefcatnnpref durdur
n11
, µρµρ
( ) ( )∑∑==
×××=N
nnn
N
nWcurcatnncur durdur
n11
, µρµρ
{ }nµ,1max
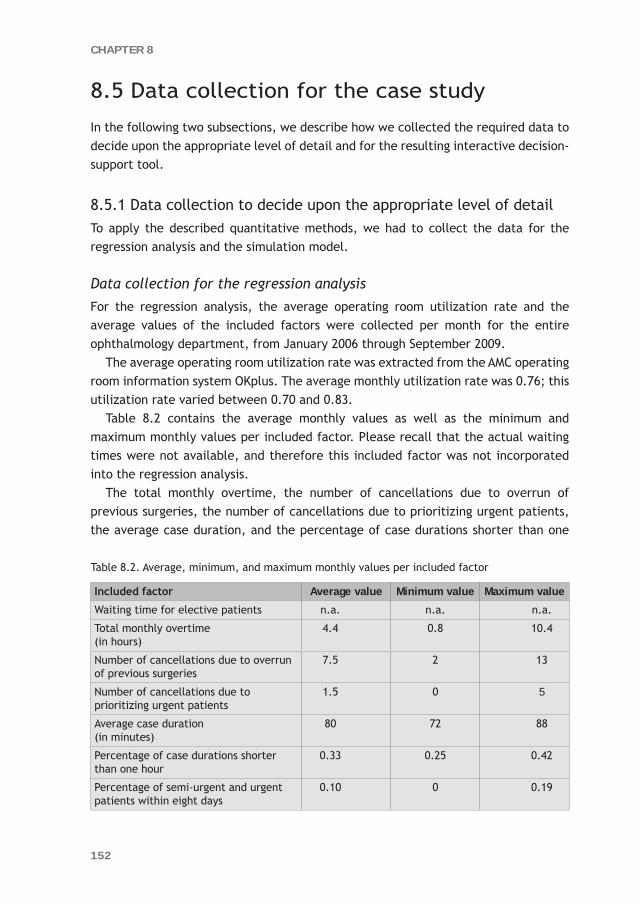
152
CHAPTER 8
8.5 Data collection for the case study
In the following two subsections, we describe how we collected the required data to decide upon the appropriate level of detail and for the resulting interactive decision-support tool.
8.5.1 Data collection to decide upon the appropriate level of detail To apply the described quantitative methods, we had to collect the data for the regression analysis and the simulation model.
Data collection for the regression analysis For the regression analysis, the average operating room utilization rate and the average values of the included factors were collected per month for the entire ophthalmology department, from January 2006 through September 2009.
The average operating room utilization rate was extracted from the AMC operating room information system OKplus. The average monthly utilization rate was 0.76; this utilization rate varied between 0.70 and 0.83.
Table 8.2 contains the average monthly values as well as the minimum and maximum monthly values per included factor. Please recall that the actual waiting times were not available, and therefore this included factor was not incorporated into the regression analysis.
The total monthly overtime, the number of cancellations due to overrun of previous surgeries, the number of cancellations due to prioritizing urgent patients, the average case duration, and the percentage of case durations shorter than one
Table 8.2. Average, minimum, and maximum monthly values per included factor
Included factor Average value Minimum value Maximum value
Waiting time for elective patients n.a. n.a. n.a.
Total monthly overtime (in hours)
4.4 0.8 10.4
Number of cancellations due to overrun of previous surgeries
7.5 2 13
Number of cancellations due to prioritizing urgent patients
1.5 0 5
Average case duration (in minutes)
80 72 88
Percentage of case durations shorter than one hour
0.33 0.25 0.42
Percentage of semi-urgent and urgent patients within eight days
0.10 0 0.19

153
HOW TO JUGGLE PRIORITIES?
hour could be extracted from OKplus. To determine the number of cancellations due to prioritizing urgent patients, we used cancellations within 24 hours.
The data for the final included factor – the percentage of semi-urgent and urgent patients within eight days – could only be extracted from OKplus after June 2008. Please recall that before June 2008, the date the surgery was requested was not entered in OKplus, nor was the urgency level. For this reason, we determined the percentage of semi-urgent and urgent patients per patient group based on the period from June 2008 through February 2009. To determine this percentage for the period before June 2008, we used patients’ DBCs to classify all them into their corresponding patient groups, which were subsets of related DBCs. Subsequently, we used the number of patients per patient group in a specific month to calculate the weighted average of the percentage of semi-urgent and urgent patients in that month. See formula (4) for the described weighted average, with T the number of months and N the number of patient groups.
Let: Xi,t : the number of patients per patient group i in month t
pi : the percentage of semi-urgent and urgent patients per patient group i
Pt : the weighted average of the percentage of semi-urgent and
urgent patients in month t
(4)
Data collection for the computer simulation
Although the waiting times for elective patients achieved in the past could not be retrieved from any of the AMC information systems, we were able to extract the current waiting times for elective patients per patient group.
We decided to distinguish five categories: the first category with an average of one surgery per week, the second category with an average of two surgeries per week, and so on. In addition, we determined by analyzing the number of weeks without either demand or capacity in the OKplus database, that physicians were not available 20% of the time.
8.5.2 Data collection for the interactive decision-support tool To enable management to experiment with different numbers of patients per group, we collected the data for the interactive tool per patient group.
TtforXpXPN
iti
N
iitit ,...,1
1,
1, =×= ∑∑
==
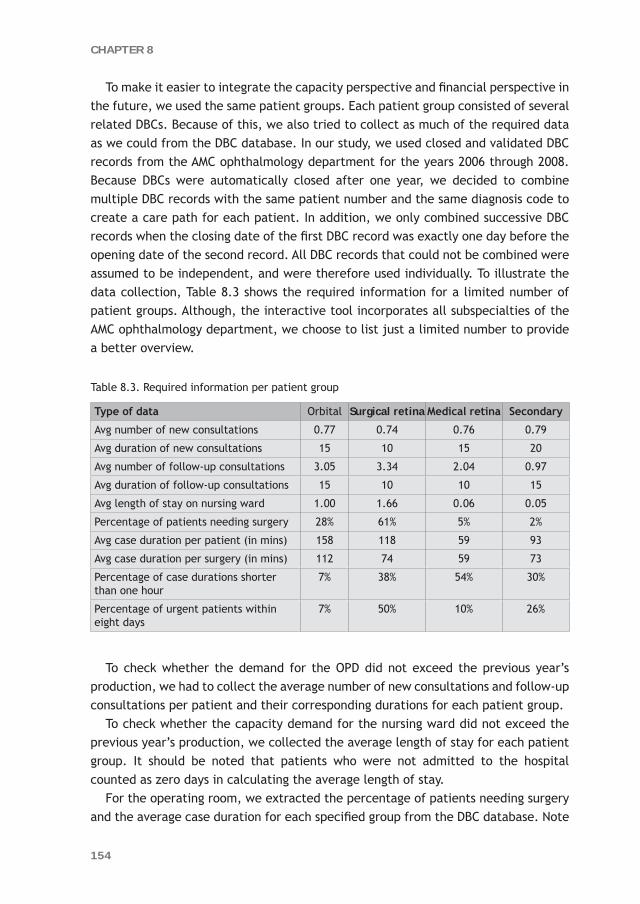
154
CHAPTER 8
To make it easier to integrate the capacity perspective and financial perspective in the future, we used the same patient groups. Each patient group consisted of several related DBCs. Because of this, we also tried to collect as much of the required data as we could from the DBC database. In our study, we used closed and validated DBC records from the AMC ophthalmology department for the years 2006 through 2008. Because DBCs were automatically closed after one year, we decided to combine multiple DBC records with the same patient number and the same diagnosis code to create a care path for each patient. In addition, we only combined successive DBC records when the closing date of the first DBC record was exactly one day before the opening date of the second record. All DBC records that could not be combined were assumed to be independent, and were therefore used individually. To illustrate the data collection, Table 8.3 shows the required information for a limited number of patient groups. Although, the interactive tool incorporates all subspecialties of the AMC ophthalmology department, we choose to list just a limited number to provide a better overview.
Table 8.3. Required information per patient group
Type of data Orbital Surgical retina Medical retina Secondary
Avg number of new consultations 0.77 0.74 0.76 0.79
Avg duration of new consultations 15 10 15 20
Avg number of follow-up consultations 3.05 3.34 2.04 0.97
Avg duration of follow-up consultations 15 10 10 15
Avg length of stay on nursing ward 1.00 1.66 0.06 0.05
Percentage of patients needing surgery 28% 61% 5% 2%
Avg case duration per patient (in mins) 158 118 59 93
Avg case duration per surgery (in mins) 112 74 59 73
Percentage of case durations shorter than one hour
7% 38% 54% 30%
Percentage of urgent patients within eight days
7% 50% 10% 26%
To check whether the demand for the OPD did not exceed the previous year’s production, we had to collect the average number of new consultations and follow-up consultations per patient and their corresponding durations for each patient group.
To check whether the capacity demand for the nursing ward did not exceed the previous year’s production, we collected the average length of stay for each patient group. It should be noted that patients who were not admitted to the hospital counted as zero days in calculating the average length of stay.
For the operating room, we extracted the percentage of patients needing surgery and the average case duration for each specified group from the DBC database. Note
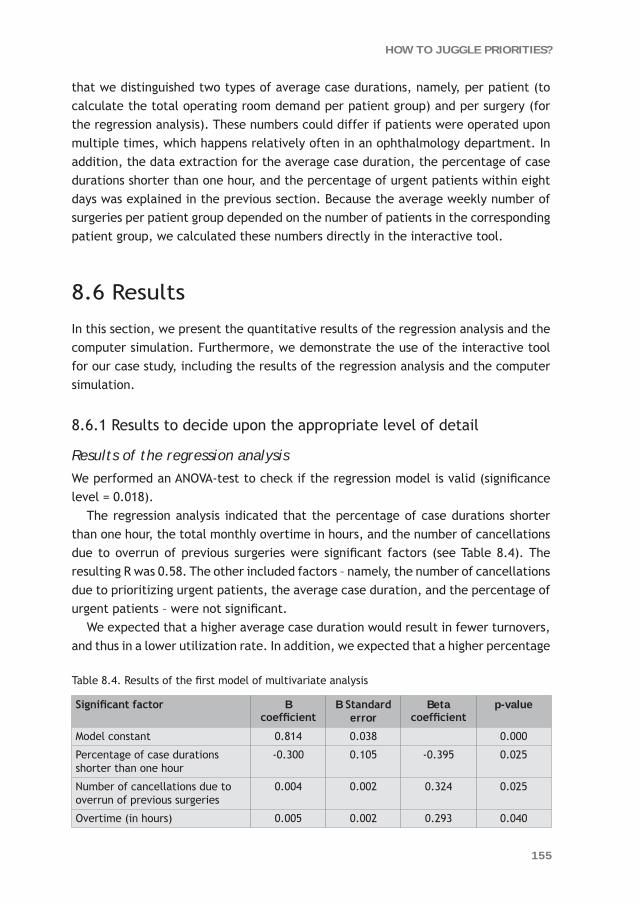
155
HOW TO JUGGLE PRIORITIES?
that we distinguished two types of average case durations, namely, per patient (to calculate the total operating room demand per patient group) and per surgery (for the regression analysis). These numbers could differ if patients were operated upon multiple times, which happens relatively often in an ophthalmology department. In addition, the data extraction for the average case duration, the percentage of case durations shorter than one hour, and the percentage of urgent patients within eight days was explained in the previous section. Because the average weekly number of surgeries per patient group depended on the number of patients in the corresponding patient group, we calculated these numbers directly in the interactive tool.
8.6 Results
In this section, we present the quantitative results of the regression analysis and the computer simulation. Furthermore, we demonstrate the use of the interactive tool for our case study, including the results of the regression analysis and the computer simulation.
8.6.1 Results to decide upon the appropriate level of detail
Results of the regression analysis We performed an ANOVA-test to check if the regression model is valid (significance level = 0.018).
The regression analysis indicated that the percentage of case durations shorter than one hour, the total monthly overtime in hours, and the number of cancellations due to overrun of previous surgeries were significant factors (see Table 8.4). The resulting R was 0.58. The other included factors – namely, the number of cancellations due to prioritizing urgent patients, the average case duration, and the percentage of urgent patients – were not significant.
We expected that a higher average case duration would result in fewer turnovers, and thus in a lower utilization rate. In addition, we expected that a higher percentage
Table 8.4. Results of the first model of multivariate analysis
Significant factor B coefficient
B Standard error
Beta coefficient
p-value
Model constant 0.814 0.038 0.000
Percentage of case durations shorter than one hour
-0.300 0.105 -0.395 0.025
Number of cancellations due to overrun of previous surgeries
0.004 0.002 0.324 0.025
Overtime (in hours) 0.005 0.002 0.293 0.040

156
CHAPTER 8
of case durations shorter than one hour would result in a higher utilization rate, because these short cases could be used to fill the remaining operating time on a specific day. Remarkably, the B coefficient of the percentage of case durations shorter than one hour was negative, so a higher percentage resulted in a lower utilization rate. Apparently, this factor was not a good indicator for the ability to fully schedule the available operating time. In contrast, this factor seemed to be an indicator for the number of turnovers, and so had a negative impact on the operating room utilization rate.
Therefore, we experimented with a regression model without the percentage of case durations shorter than one hour. This model indicated that the average case duration and the number of cancellations due to overrun of previous surgeries were significant factors (see Table 8.5). The resulting R of this model was 0.48, so slightly worse than the first model.
Table 8.5. Results of the second model of multivariate analysis
Significant factor B coefficient B Standard error
Beta coefficient
p-value
Model constant 0.490 0.111 0.000
Average duration of operations (in minutes)
0.003 0.001 0.349 0.029
Number of cancellations due to overrun of previous surgeries
0.005 0.002 0.375 0.020
Results of the computer simulation
To check the sensitivity of the outcomes for the type of distribution, we first used a discrete uniform distribution for the weekly demand, and subsequently we used a Poisson distribution to randomly select the weekly number of requested surgeries. For this comparison, we experimented with an average of two and four surgeries per week with a 20% chance of no demand at all for surgery during a week. Therefore, the discrete uniform distribution was between one and four per week and between one and nine per week respectively. For the Poisson distributed demand, we used an average value of 2.5 and 5.0 per week. Per type of distribution, we experimented with all possible combinations of the average weekly number of surgeries and the different threshold values for the waiting time target, namely, five weeks, nine weeks, three months, and six months.
We concluded that the difference in maximum utilization rate between two threshold values is slightly higher with a Poisson distributed demand than with a uniformly distributed demand. Because we preferred to obtain worst-case outcomes, we continued our experimentation with a Poisson distributed demand.

157
HOW TO JUGGLE PRIORITIES?
Table 8.6 shows the maximum utilization rate with a Poisson distributed demand for an average of one, two, three, four, or five surgeries per week and the different threshold values.
Clearly, a more stringent waiting time target has a significant impact on the maximum utilization rate of the operating room. Moreover, the negative impact is larger for a small number of surgeries per week (i.e., one or two) than for a larger number of surgeries (i.e., four or five). The next conclusion is that with a threshold value of 26 weeks, the maximum utilization rate is almost 100% in all situations except for one surgery per week.
Finally, to adapt the utilization rate predicted by regression analysis, we calculated ρcur and ρpref with the utilization rates of the Poisson distributed demand.
8.6.2 Results of the interactive decision-support tool For the interactive tool, we used regression analysis and computer simulation to quantify the impact of all included factors on the operating room utilization rate. To demonstrate the use of the interactive tool, we give an illustrative example with a limited number of patient groups, namely, orbital, surgical retina, medical retina, and secondary level of care patients. These are the same subspecialties we used to illustrate the data collection in Table 8.3. The actual tool incorporates all subspecialties of the AMC ophthalmology department.
Before discussing the scenarios, we will first describe the current performance and the preferred performance (see Table 8.7). For example, in the current situation, at least 80% of the elective medical retina patients experienced a waiting time of less than nine weeks, while the preferred threshold value for this patient group
Table 8.6. Results of the computer simulation
Avg no of surgeries Threshold values of waiting time target
5 weeks 9 weeks 13 weeks 26 weeks
1 0.735 0.828 0.880 0.969
2 0.814 0.890 0.933 0.996
3 0.858 0.921 0.949 0.997
4 0.867 0.931 0.958 0.998
5 0.887 0.940 0.969 0.998
Table 8.7. Current and preferred performance for the operating room
Performance Threshold values of waiting time targets Max no of cancellations due to overrun prev surgeriesOrbital Surgical
retinaMedical retina
Secondary
Current 26 weeks 5 weeks 9 weeks 9 weeks 7.5
Preferred 5 weeks 5 weeks 5 weeks 9 weeks 4

158
CHAPTER 8
is five weeks, based upon the so-called Treek norm which was set by the Dutch government. Furthermore, the maximum number of cancellations due to overrun of previous surgeries was 7.5 per month on average during the past year, while the preferred performance is a maximum of 4 cancellations per month.
For the first scenario, we determined the maximum allowed utilization rate for the current situation with the current performance and calculated the total demand for the OPD, the nursing ward, and the operating room (see Table 8.8).
Next, we determined the maximum utilization rate and the total operating room demand with the original number of patients and the preferred performance (see Table 8.7). Because the maximum utilization rates drops from 75.6% to 70.0%, and the number of patients per patient group remains equal to the current situation, the total operating room demand increases by more than 5,000 hours.
One solution to compensate for the increased demand is to expand operating room time. If this is not possible, the number of patients has to be reduced.
Scenario 3 (see Table 8.8) contains an overall reduction of 8.9% for all patient groups to ensure that the total future demand of the operating room will not exceed the current demand. In scenarios 4, 5, and 6, there has only been a reduction in a single patient group per scenario: secondary level of care patients (-65.1%), orbital patients (-23.0%), and surgical retina patients (-15.1%) respectively. Note that we did not show a reduction in medical retina patients because the total operating room demand of this group is not enough to compensate for the increased demand. The final scenario contains a reduction in orbital patients and surgical retina patients (-11.4%) and an increase in medical retina patients (+43.0%). These numbers result in an equal demand for the OPD and the operating room compared with the current situation.
In all scenarios, because the capacity demand for the OPD and nursing ward does not exceed the previous year’s production, there will be sufficient capacity in the future.
Table 8.8. Various scenarios of the interactive tool
Scenario Number of patients per patient group per year Total demand OPD (in hours)
Total demand nursing ward (in days)
Max utilization rate operating room
Total demand operating room (in hours)Orbital Surgical retina Medical retina Second-ary
1. Current situation 461 411 346 3,168 2,506 1,322 77.6% 73,331
2. Preferred performance 461 411 346 3,168 2,506 1,322 72.2% 78,774
3. Overall reduction 422 376 317 2,899 2,293 1,21 71.0% 73,301
4. Less secondary 461 411 346 900 1,358 1,209 71.8% 73,324
5. Less orbital 361 411 346 3,168 2,41 1,222 71.6% 73,272
6. Less surgical retina 461 353 346 3,168 2,466 1,226 71.9% 73,282
7. Less orbital, less surgical retina, and more medical retina
410 366 495 3,168 2,505 1,206 70.8% 73,242
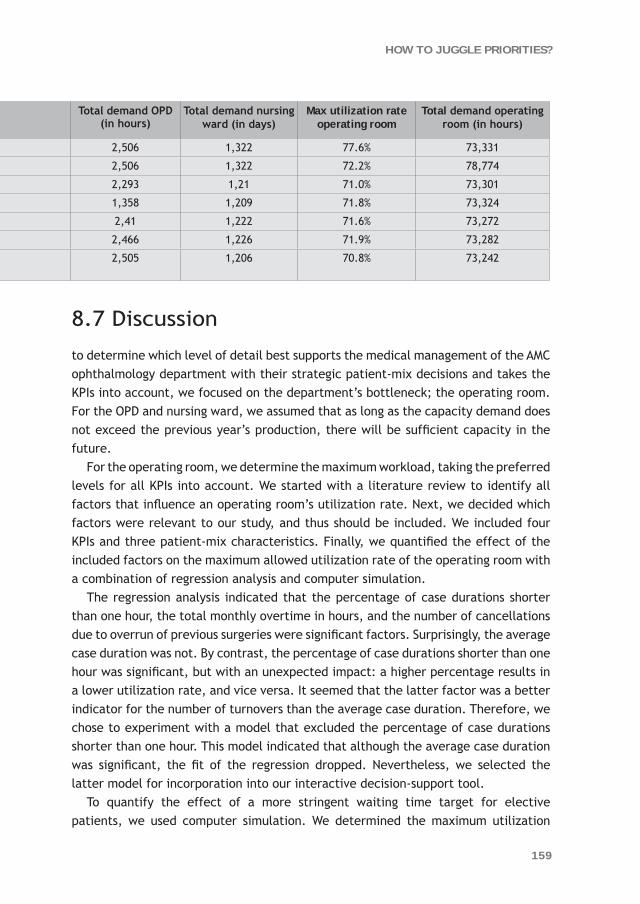
159
HOW TO JUGGLE PRIORITIES?
8.7 Discussion
to determine which level of detail best supports the medical management of the AMC ophthalmology department with their strategic patient-mix decisions and takes the KPIs into account, we focused on the department’s bottleneck; the operating room. For the OPD and nursing ward, we assumed that as long as the capacity demand does not exceed the previous year’s production, there will be sufficient capacity in the future.
For the operating room, we determine the maximum workload, taking the preferred levels for all KPIs into account. We started with a literature review to identify all factors that influence an operating room’s utilization rate. Next, we decided which factors were relevant to our study, and thus should be included. We included four KPIs and three patient-mix characteristics. Finally, we quantified the effect of the included factors on the maximum allowed utilization rate of the operating room with a combination of regression analysis and computer simulation.
The regression analysis indicated that the percentage of case durations shorter than one hour, the total monthly overtime in hours, and the number of cancellations due to overrun of previous surgeries were significant factors. Surprisingly, the average case duration was not. By contrast, the percentage of case durations shorter than one hour was significant, but with an unexpected impact: a higher percentage results in a lower utilization rate, and vice versa. It seemed that the latter factor was a better indicator for the number of turnovers than the average case duration. Therefore, we chose to experiment with a model that excluded the percentage of case durations shorter than one hour. This model indicated that although the average case duration was significant, the fit of the regression dropped. Nevertheless, we selected the latter model for incorporation into our interactive decision-support tool.
To quantify the effect of a more stringent waiting time target for elective patients, we used computer simulation. We determined the maximum utilization
Table 8.8. Various scenarios of the interactive tool
Scenario Number of patients per patient group per year Total demand OPD (in hours)
Total demand nursing ward (in days)
Max utilization rate operating room
Total demand operating room (in hours)Orbital Surgical retina Medical retina Second-ary
1. Current situation 461 411 346 3,168 2,506 1,322 77.6% 73,331
2. Preferred performance 461 411 346 3,168 2,506 1,322 72.2% 78,774
3. Overall reduction 422 376 317 2,899 2,293 1,21 71.0% 73,301
4. Less secondary 461 411 346 900 1,358 1,209 71.8% 73,324
5. Less orbital 361 411 346 3,168 2,41 1,222 71.6% 73,272
6. Less surgical retina 461 353 346 3,168 2,466 1,226 71.9% 73,282
7. Less orbital, less surgical retina, and more medical retina
410 366 495 3,168 2,505 1,206 70.8% 73,242

160
CHAPTER 8
rate for different threshold values: five weeks, nine weeks, three months, and six months. The simulation confirmed that a more stringent waiting time target has a significant impact on the maximum utilization rate of the operating room. Moreover, the negative impact is larger for a small number of surgeries per week than for a larger number of surgeries.
Finally, we adapted the department’s overall utilization rate from the regression analysis with the results from the computer simulation. By incorporating these results into the interactive decision-support tool, we enabled the management of the AMC ophthalmology department to alter the number of patients in various patient groups and to see the consequences in terms of the KPIs.
Final conclusions
Clearly, it is not enough to apply a rule of thumb for the maximum allowed utilization rate of an operating room that does not account for all specific departmental aspects. Also, the previous year’s utilization rate does not account for future alterations in patient mix and the possible gap between preferred and current performances, and so is also not entirely satisfactory. Even at strategic level, it is necessary to incorporate management decisions concerning KPIs and future patient-mix characteristics to determine the maximum workload of the operating room.
The interactive tool offers medical management quantitative decision support to enable them to act proactively instead of reactively to expected alterations in patient mix. When acting proactively, management can anticipate the future situation, and either alter the expected patient mix or arrange for new equipment and retrain physicians in a related subspecialty to ensure that the KPIs will be met in the future.
Acknowledgements
The authors are grateful to Hanna Neys, Jan Koning, and Rachid Kolfin for their contributions at the start of this study. The authors would also like to thank Franck Asselman for his remarks over the course of the entire study, as well as Dirk Ubbink and Hans van Ophem for their contributions to the regression analysis. Finally, the authors are grateful to the anonymous reviewers for their constructive comments which have been beneficial for this version of the paper.

161
HOW TO JUGGLE PRIORITIES?
References 1. Kusters RJ, Groot PMA (1996) Modelling resource availability in general hospitals. Design
and implementation of a decision support model. Eur J Oper Res 88:428–445
2. Naranjo-Gil D (2009) Strategic performance in hospitals: the use of the balanced scorecard by nurse managers. Health Care Manage Rev 34(2):161-170
3. Oliveira J (2001) The balanced scorecard: an integrative approach to performance evaluation. Healthc Financ Manage 55(5):42-46
4. Pineno CJ (2002) The balanced scorecard: an incremental approach model to health care management. J Health Care Finance 28(4):69-80
5. Chow CW, Ganulin D, Teknika O, Haddad K, Williamson J (1998) The balanced scorecard: a potent tool for energizing and focusing healthcare organization management. J Healthc Manag 43(3):263-280
6. Vissers JMH, Adan IJBF, Bekkers JA (2005) Patient mix optimization in tactical cardiothoracic surgery planning: a case study. IMA J Manage Math 16(3):281–304
7. Ma G, Beliën J, Demeulemeester E, Wang L (2009) Solving the strategic case mix problem optimally by using branch-and-price algorithm. Conf. proc. ORAHS 2009
8. Blake JT, Carter MW (2002) A goal programming approach to strategic resource allocation in acute care hospitals. Eur J Oper Res 140:541–561
9. Everett JE (2002) A decision support simulation model for the management of an elective surgery waiting system. Health Care Manag Sci 5(2):89-95
10. van Houdenhoven M, Hans EW, Klein J, Wullink G, Kazemier G (2007) A norm utilisation for scarce hospital resources: evidence from operating rooms in a Dutch university hospital. J Med Syst 31(4):231-236
11. Schofield WN, Rubin GL, Piza M, Lai YY, Sindhusake D, Fearnside MR, Klineberg PL (2005) Cancellation of operations on the day of intended surgery at a major Australian referral hospital. Med J Aust 182(12):612–615
12. Zonderland ME, Boucherie RJ, Litvak N, Vleggeert-Lankamp CLAM (2010) Planning and scheduling of semi-urgent surgeries. Health Care Manag Sci 13(3):256-267. doi: 10.1007/s10729-010-9127-6
13. Tyler DC, Pasquariello CA, Chen CH (2003) Determining optimum operating room utilization. Anesth Analg 96(4):1114-1121
14. Schneider JE, Miller TR, Ohsfeldt RL, Morrisey MA, Zelner BA, Li P (2008) The economics of specialty hospitals. Med Care Res and Rev 65(5):531-553
15. van der Lans M, Hans EW, van Houdenhoven M, Hurink JL, Wullink G (2006) Anticipating urgent surgery in operating room departments. BETA working paper WP-158, ISSN: 1386-9213
16. Pandit JJ, Pandit M, Reynard JM (2010) Understanding waiting lists as the matching of surgical capacity to demand: are we wasting enough surgical time? Anaesthesia 65(6):625-640
17. Dexter F, Traub RD, Macario A, Lubarsky DA (2003) Operating room utilization alone is not an accurate metric for the allocation of operating room block time to individual surgeons with low caseloads. Anesthesiology 98(5):1243-1249

162
CHAPTER 8
18. Sciomachen A, Tanfani E, Testi A (2005) Simulation models for optimal schedules of operating theatres. Int J of Simul 6 (12-13):26-34
19. Denton B, Viapiano J, Vogl A (2007) Optimization of surgery sequencing and scheduling decisions under uncertainty. Health Care Manag Sci 10(1):13-24
20. van Houdenhoven M, Van Oostrum JM, Hans EW, Wullink G, Kazemier G (2007) Improving operating room efficiency by applying bin-packing and portfolio techniques to surgical case scheduling. Anesth Analg 105(3):707-714
21. Cardoen B, Demeulemeester E, Beliën J (2009) Sequencing surgical cases in a day-care environment: An exact branch-and-price approach. Comput and Oper Res 36(9):2660-2669
22. Joustra PE, Kolfin R, Dijk NM van, Koning CCE, Bakker PJM (2011) Reduce fluctuations in capacity to improve the accessibility of radiotherapy treatment cost-effective. Conditionally accepted by Flex Serv and Manuf J
23. Adams R, Warner P, Hubbard B, Goulding T (2004) Decreasing turnaround time between general surgery cases: a six sigma initiative. J Nurs Adm 34(3):140-148
24. Wright JG, Roche A, Khoury AE (2010) Improving on-time surgical starts in an operating room. Can J Surg 53(3):167-170
25. Strum DP, May JH, Vargas LG (2000) Modeling the uncertainty of surgical procedure times: comparison of log-normal and normal models. Anesthesiology 92(4):1160-1167
26. Babineau TJ, Becker J, Gibbons G, Sentovich S, Hess D, Robertson S, Stone M (2004) The “cost” of operative training for surgical residents. Arch Surg 139(4):366-370
27. Barros PP, Machado SR (2010) Money for nothing? The net costs of medical training. Health Care Manag Sci 13(3):234-255. doi: 10.1007/s10729-010-9126-7
28. Mardia KV, Kent JT, Bibby JM (1979) Multivariate Analysis. Academic Press, London
29. Law AM, Kelton WD (2002) Simulation Modeling and Analysis, 3rd edn. McGraw-Hill, Singapore-


An aerial photo of the Academic Medical Center
“It is not the strongest of the species that survives, nor the most intelligent, but the one most responsive to change.”
Charles Darwin

9CHAPTER
General Discussion


167
GENERAL DISCUSSION
This chapter evaluates the research presented in Chapters 2 through 8, which are based upon articles. All chapters are used to elaborate on the overall research objective of this thesis: to show the added value of quantitative methods such as queuing theory, discrete event simulation, and regression analysis for generally applied process improvement methods in a complex hospital setting, in particular for decision support at strategic level.
In addition, the research in Chapters 2 through 8 was used to answer the following specific research questions: 1. How can waiting times, access times, and throughput times be reduced cost-
effectively a. by decreasing the various fluctuations in health care processes and/or b. by pooling or separating various patient groups?2. How can hospital processes be made more predictable so that management is
able to anticipate future developments proactively, and structurally improve the hospital’s key performance indicators?
Multiple chapters are used to answer an individual research question (see Table 1.6). Some of the chapters are used to answer two specific research questions.
The outline of this chapter is as follows: The main findings are presented per research question. We start by describing the added value of quantitative methods to support decision making in a complex hospital setting. Subsequently, we answer each specific research question. After reporting our main findings, we clarify the extent to which the applied methodology and our results are also applicable in other hospitals. Next, we continue with the limitations of our research, followed by our recommendations for further research. We conclude this chapter by listing the practical implications of this thesis.
9.1 Main Findings
9.1.1 The added value of quantitative methodsChapter 2 clearly shows the added value of quantitative methods such as queuing theory and discrete event simulation. This chapter describes a case study of the Academic Medical Center (AMC) radiotherapy department with the goal of reducing the throughput times for a multi-step process: (1) the outpatient department (OPD), (2) the preparation phase, and (3) the actual treatment using three linear accelerators. Before we started this study, management had already decided to invest in an additional linear accelerator to remove the presumed bottleneck. However, our simulation model indicated that while a fourth linear accelerator would indeed decrease throughput times, the decrease would not be enough to meet the
168
CHAPTER 9
throughput time targets. These would only be met when the access times for the OPD were reduced as well. An alternative solution might have been to increase the capacity of the OPD and to reduce the preparation time for elective patients (10 days on average), which was relatively high compared to the throughput time target (21 days). Because the fourth linear accelerator had already been purchased, we did not investigate how large this reduction should have been and whether this was feasible in practice. Nevertheless, this study clearly demonstrates the added value of quantitative decision support.
The endoscopy case study described in Chapter 4 demonstrates that the existing subdivision of capacity among various patient groups was not efficient. By reducing the dedicated capacity for urgent patients by almost 50% and redistributing the released urgent capacity among other patient groups, all groups had sufficient capacity to meet their access time targets. An iterative combination of simulation and integer linear programming was used for quantitative decision support. The simulation model was used to determine the minimum urgent capacity keeping the percentage of double-bookings due to urgent patients under 3%. In addition, integer linear programming was used to redistribute the released urgent capacity among other patient groups, taking into account the limited availability and usability of both procedure rooms and physicians.
Chapter 5 also describes a case study for reducing the access times of the magnetic resonance imaging scanner (MRI). Although the solution of pooling various patient groups looked very promising in terms of logistics, it required more flexibility on the part of the radiologists. In the pooled situation, multiple subspecialties would use the same multipurpose capacity, and thus patients of one subspecialty could be scheduled within a much longer time period. Therefore, the specialized radiologists had to be available over a longer period, also to check the quality of the MRI scans. Hence, we developed a simulation model to determine the order of magnitude of the improvement to convince the radiologists to implement this solution. The reduction in access times predicted with the simulation model was large enough to convince them, and the solution was implemented in practice. In contrast to the endoscopy study, we did not need an integer linear programming model to reschedule the multipurpose MRI capacity. There are two reasons for this, namely, that none of the three subspecialties involved required a specific MRI scanner, and the presence of a specialized radiologist was not a limiting factor. Therefore, rescheduling the multipurpose capacity was straightforward and we did not need linear programming.
In the case studies described above, we could have tested the potential solutions during a pilot period. However, to test a single scenario to reduce access times and throughput times, the pilot period would have had to last a number of months. It might have even taken several years to quantitatively compare – or possibly combine – several alternative solutions. If a potential solution would then have turned out

169
GENERAL DISCUSSION
to have had an adverse effect on access times or throughput times, the interests of patients would have been harmed and the motivation of personnel diminished. Furthermore, the experimental conditions would probably not have been the same during the entire pilot period, as confounding factors make it hard to isolate the effect of the intervention.
In the case study described in Chapter 7, developing and implementing the software to support more accurate scheduling of operations would be costly. Therefore, management wanted to know beforehand how large the positive impact would be so they could quantitatively support a business case. Using a regression model would be an objective way of predicting the duration.
Finally, Chapter 8 describes a study concerning a future situation, which is often the case with decision making at strategic level, because in practice trial and error is just not an option. Furthermore, this study shows that it is necessary to take fluctuations at operational and tactical levels into account for strategic-level decision making.
For these reasons, generally applied process improvement methods (such as Business Process Redesign, Total Quality Management, Theory of Constraints, Lean Management, and Six Sigma) need queuing theory and discrete event simulation to quantify the expected impact of a potential solution on waiting times, access times, or throughput times before implementing the solution in practice. Chapter 8 clearly demonstrates that this quantitative decision support is not only beneficial at operational and tactical levels, but also has an effect on strategic decision making as well.
Our conclusion that Lean Management could benefit from quantitative methods such as queuing theory and discrete event simulation might not be surprising. In contrast, our claim that this statement is also valid for Six Sigma may come as more of a surprise. Although Six Sigma is known as a data-driven, quantitative process improvement method, these quantitative methods are used mainly in the “Measure” and “Analyze” phases. Despite the fact that these methods can also be used in the “Improve” phase to analyze the expected impact of a potential solution on waiting, access, or throughput times, a pilot period is often required. For the reasons mentioned above, testing a potential solution during a pilot period is often not desirable or even feasible in a hospital setting.
9.1.2 How can the various fluctuations in health care processes be decreased?To answer this specific research question, we investigated the effects of various types of variability on the accessibility of hospital care:1. Demand variability,2. Variability in process times, and3. Capacity variability.

170
CHAPTER 9
Three studies in this thesis – Chapters 2, 4, and 6 – demonstrate the effect of variability reduction. First, Chapter 2 shows how a decrease in the fluctuations of capacity in an OPD leads to a reduction in both access times as well as waiting times prior to the consecutive steps of the radiotherapy process: the preparation phase and the actual treatment. Note that the reduction in waiting times prior to the preparation phase and the actual treatment results from lower demand variability prior to these steps. Because the average OPD capacity remains the same, this is a cost-effective solution for reducing throughput times.
Second, one of the solutions for reducing access times in the AMC endoscopy department (Chapter 4) was to introduce a backup system for physicians to decrease the number of occasional closures. Although physicians have to take on more shifts and therefore work more hours, the backup system will still save capacity because the weekly capacity will be more stable, which in itself will reduce access times.
Third, to reduce waiting times in the waiting room of the MRI department, we recommended reducing the supervision by radiologists through increased standardization of the MRI protocols. Since the variability of durations with supervision exceeded the variability of durations without supervision, this intervention would lead to an overall reduction in the variability of the process times. Subsequently, this reduction would lead to lower waiting times in the waiting room without investing in additional resources.
9.1.3 When should various patient groups be pooled or separated?To explore the situations in which patient groups should by pooled or separated to improve accessibility, we investigated two different reasons for this:1. Pooling or separating based on urgency level, and2. Pooling or separating capacity dedicated to specific patient groups that seem to be similar from a logistical point of view.
In Chapter 3, the minimum required capacity for meeting the performance target was determined in the current situation (in which all patients use the same capacity) and in an alternative situation (in which urgent and elective patients both have dedicated capacity). This analysis clearly shows that the difference in urgency level determines whether pooling or separating urgent and elective radiotherapy patients will be beneficial. In the current situation, although the minimum required capacity is equal in both situations, the performance level in the separated case is higher. In addition, if elective patients are allowed to utilize free urgent timeslots (one day in advance), the capacity required to meet the access time targets would drop even further.
In Chapter 4, we also conclude that separating patients based upon urgency level improves efficiency. In contrast to the radiotherapy study, we do not separate urgent

171
GENERAL DISCUSSION
and elective patients, but subdivide the urgent patients into semi-urgent and urgent patients. The endoscopy study demonstrates that separating the urgent general gastroenterological and colonoscopy patients into semi-urgent and urgent would use the total capacity more efficiently. Because the semi-urgent capacity can be used more efficiently than the urgent capacity, a smaller number of urgent patients will lead to a higher overall utilization. This effect offsets the negative effect of separating the capacity into semi-urgent and urgent timeslots.
In addition, the simulation model of the AMC endoscopy department shows that pooling various patient groups with the same urgency level (in this case, the elective general gastroenterological and colonoscopy procedures) can also lead to improved utilization. Unfortunately, because the semi-urgent procedures of other types of procedures required different equipment and/or specialized physicians, pooling was not an option. However, a larger reduction in required capacity was to be expected when pooling semi-urgent procedures than when pooling elective procedures.
Moreover, Chapter 5 illustrates a similar advantage of pooling various patient groups with the same urgency level. In this case, we pooled elective patients from three patient groups and substantially reduced the access times for MRI scans. Unfortunately, the cardiac MRI scans and MRI scans under sedation could not be pooled, because personnel outside the radiology department needed to be present (a cardiologist and an anesthesia team respectively). Nevertheless, because there was a large reduction in access times, the number of semi-urgent timeslots was reduced significantly, and only one specific capacity claim remained (concerning brain surgery). The other capacity claims of various clinical paths became redundant with an access time of less than two weeks. Obviously, this increased the flexibility of the MRI capacity even more.
9.1.4 How can hospital processes be made more predictable?Chapter 6, 7, and 8 are used to answer this research question. In Chapter 6, the goal is to reduce the waiting times in the waiting room of the MRI department. One of the solutions for achieving this goal was to better estimate the scan duration. In contrast to Chapter 7, we did not use an econometric model to estimate the scan duration more accurately. Because the variance of the scan durations per scan type was limited, we knew that the scan type was an important explanatory variable for the average scan duration. Therefore, we compared only the scheduled duration and the actual duration per scan type. This comparison showed that for some types of scans the scheduled duration was overestimated, while for other types it was underestimated. By estimating the scan duration more accurately, waiting times could be reduced without decreasing the utilization rate of the MRI.
In Chapter 6, we showed only the effect of more accurate estimates of the duration on the relevant key performance indicators (KPIs). In Chapter 7, we actually explain

172
CHAPTER 9
how to estimate the duration more accurately (in this case, of a surgical operation) by applying various econometric models. In Chapter 7, the goal was to reduce the risk of overtime in the operating room and to reduce the percentage of cancellations due to overrun of previous surgeries. In contrast to the MRI department, waiting times before an operation are not considered relevant in the AMC. We concluded that applying econometric models can significantly improve the estimates of durations. Applying an objective method for estimating the duration can prevent this. This does not mean the surgeon’s estimate is of no value, because it turned out to be an important explanatory variable for the econometric models. More specifically, the surgeon’s estimate was significant for all departments and all econometric models (p < 0.01).
Chapter 8 demonstrates how quantitative decision support at strategic level can contribute to improving the performance of the complete chain of the OPD, nursing ward, and operating room in the long term. If efficiency improvements are not sufficient to meet the performance targets and if it is not feasible or preferable to increase capacity, the only solution is to reduce demand. We developed an interactive decision-support tool to enable the management of the AMC ophthalmology department to decide upon the future patient-mix to improve the KPIs, especially the long waiting list for the operating room. With this interactive tool, management is able to alter the number of patients per patient group, and see the consequences in terms of maximum workload so that the preferred KPIs can be met. For the AMC ophthalmology department we focused on the main bottleneck, namely the operating room. We assessed that it is not enough to use last year’s utilization rate to calculate the future maximum workload for a different patient-mix and higher performance requirements. Therefore, we used a combination of regression analysis and simulation to determine the effect of patient-mix characteristics and preferred KPIs on the maximum workload. With this interactive tool, management is able to better anticipate the future situation, either to alter the expected patient-mix or to expand capacity to ensure that the KPIs will be met structurally in the future. Clearly, capacity issues cannot be solved without taking the preferred service levels into account as well.
This research also shows that assessing operating room usage based exclusively on the actual utilization rate is unfair (the patient-mix is not taken into account) and shortsighted (the other performance measures are not assessed). Furthermore, focusing on maximizing the utilization rate might even lead to more overtime and an increased number of cancellations due to overrun of previous surgery and prioritizing semi-urgent and urgent patients.
173
GENERAL DISCUSSION
9.2 Generalizability of methodology and results
9.2.1 Generalizability of methodologyThe queuing models in Chapters 2 and 3 were used to provide insights into the effect of variability on access times of the AMC radiotherapy OPD. These queuing models could also be used to provide insights for other OPDs within the AMC and in other hospitals.
Computer simulation was used in Chapters 2 through 6 to include the dynamic interaction between the different steps of a multi-step hospital process, to model the complex scheduling rules, to incorporate all relevant types of variability, and to supply specific performance indicators. Subsequently, these simulation models were applied to quantitatively evaluate and compare the alternative solutions for cost-effectively improving the accessibility of hospital care. Although the specific simulation models must be adapted to analyze similar problems in other hospital departments, the need for computer simulation remains. Note that the aim to keep the simulation model’s scope and level of detail as limited as possible is in direct conflict with the generic application of the model.
In Chapter 4, we used a combination of computer simulation and integer linear programming (ILP) to reduce the access times for endoscopic procedures. The ILP model was necessary to reschedule the required number of timeslots for all procedure types in an available procedure room with the required equipment and a specialized physician present. It is relatively easy to adapt this ILP model for other endoscopy departments. It might even be useful for scheduling operating rooms, because these two scheduling problems are comparable. Note that we did not use the ILP model in Chapter 5 to reschedule the required timeslots for the various types of MRI scans: This scheduling problem was straightforward, and therefore could be solved without an ILP model.
As we already stated in the previous section, the various regression models used in Chapter 7 could be used to improve the accuracy of scheduling operations in other hospitals as well. These regression models could also be used to improve the accuracy of scheduled consultations in an OPD, various (endoscopic) procedures and (MRI) scan durations to increase the utilization rate given a maximum risk of overtime, a maximum percentage of cancellations due to overrun of previous operations/consultations/procedures/scans, and a waiting time target.
The combined approach of regression analysis and computer simulation we used in Chapter 8 is suitable for other hospitals as well. In our case study, we used only computer simulation to determine the effect of the waiting time target for elective patients on the maximum workload. In other case studies, computer simulation may have to be used for other factors included. This might be necessary if the historical data of an included factor cannot be retrieved, or if a specific factor was nearly

174
CHAPTER 9
constant over the past several years. Moreover, if the preferred level of a KPI differs considerably from actual performance over the past several years, using regression analysis would require extreme extrapolation. Therefore, it might be better to model this KPI explicitly with computer simulation.
9.2.2 Generalizability of results Other hospitals could also benefit from applying quantitative methods to support operational, tactical, and strategic decision making.
The positive effect of reduced demand variability and variability in process times on a hospital’s performance has been shown before (for example, [1] and [2] respectively), so they are clearly applicable to other hospitals. Capacity variability reduction could also be applied in other hospitals to reduce the access times of many OPDs. With respect to the applicability within central diagnostic departments, it depends on whether the available capacity is dependent on physicians. For example, the MRI capacity depends mainly on the availability of the MRI scanners and the presence of radiology assistants rather than on radiologists. Therefore, the capacity is not dependent on physicians, and the available capacity will be more stable. In contrast, an endoscopic procedure requires the presence of a specialized physician and the available capacity therefore depends mainly on these physicians, which often leads to higher fluctuations in capacity. Furthermore, less fluctuation in the capacity of a single step of a multi-step hospital process will probably also reduce the waiting times prior to the subsequent steps.
Although pooling different patient groups is often claimed to improve the efficiency of shared resources, this cannot be guaranteed. If the average duration per patient group differs substantially and if the changeover times per patient type are significant, efficiency might even decrease if the different groups are pooled. In addition, we cannot draw a general conclusion about when to pool or separate patient groups with different urgency levels. The radiotherapy case study presented here does show that this question of a trade-off depends mainly on the threshold value of the access time target of urgent patients.
Multiple studies (for example, [3] and [4]) have demonstrated that applying the lognormal regression model can improve the accuracy of scheduling operations. Clearly, the alternative regression models described in Chapter 7 could be applied in other hospitals as well.
Some modifications would have to be made to apply the interactive decision-support model described in Chapter 8 to other departments within the AMC or to other hospitals. First, to apply the current version of the interactive model, one has to analyze whether the operating room is the department’s main bottleneck. Next, one has to check whether the factors included are the same for the new department. If this is the case, the required data has to be gathered. Finally, one
175
GENERAL DISCUSSION
has to decide whether to use regression analysis or computer simulation to quantify the impact of an individual factor on the maximum workload of the operating room. Now the interactive model is ready to be used by management to decide upon the future patient-mix, taking the preferred operating room performance into account. Obviously, the main message holds for other hospitals as well: Be proactive and anticipate the future situation, either by altering the expected patient-mix or by expanding capacity to ensure that the KPIs will be met structurally in the future.
9.3 Limitations
The first limitation of this thesis is that all studies concern unit logistics rather than chain or network logistics [5]. An obvious disadvantage of process improvements in a single unit is that the overall hospital performance might not improve. This might be especially true for the studies described in Chapter 4 and 5 about reducing access times in a diagnostic department. Although we succeeded in reducing access times for endoscopic procedures and MRI scans, we did not check whether the total throughput times of the corresponding patients actually decreased. We assumed that the high access times for endoscopic procedures and MRI scans were the main bottlenecks for the total throughput time of the patients, but maybe the follow-up consultations or other diagnostic tests could not be scheduled earlier and these were the real bottlenecks.
The second limitation of our research is that although we did succeed in meeting the access time targets of two weeks with the current capacity, the preferred access times seem to be even lower with the emergence of “one-stop shopping”. Moreover, a recent study concluded that total hospital costs are minimized when waiting times are less than ten days [6]. Capacity might have to be expanded to reduce access times even further, something that would require investments in additional personnel and/or equipment.
The third limitation is that if patients with different urgency levels are to be separated, the definition of an urgent patient should be unambiguous. Otherwise, a referring physician might use the urgent indication more often than actually necessary. This would increase the number of urgent patients and, consequently, the access times for urgent patients would increase and the overall efficiency would decrease. Pooling different patient groups also has a disadvantage. For example, one subspecialty within a diagnostic department might expand the indication area, which would increase the number of this subspecialty’s patients. If various subspecialties were to be pooled, this increase would probably lead to higher access times for all pooled subspecialties. This negative effect could be reduced by dedicating most of the capacity to a single subspecialty and making only a small part of the capacity

176
CHAPTER 9
multipurpose. Another way to limit this risk is to maintain the dedicated capacity per subspecialty, and define conditional overflow rules that state when one subspecialty may use the dedicated capacity of another subspecialty.
9.4 Further research
Most articles about quantitative decision support in health care deal with a specific problem in a specific hospital setting. More research on how to implement best practices within other departments in the same hospital – and within the same departments in other hospitals – would be very valuable. This requires user-friendly, easily adaptable decision-support tools that clearly describe the goal, the assumptions, and the limitations.
In addition, it would be worthwhile to pay more attention to tactical-level decision support. In this thesis, we demonstrated that reducing fluctuations in OPD capacity through tactical management improves efficiency. Another application of tactical management is to adapt the operating schedule to better distribute the expected workload for nursing wards. Management could anticipate the remaining fluctuations in demand for nursing care by forming groups of multi-skilled nurses and a group of nurses with flexible working hours. Operations research techniques are required to decide upon the sizes of these groups, and to propose some rules of thumb about when to schedule certain types of nurses.
In this thesis, we investigated whether to pool logistically similar patient groups with different process times to improve efficiency. We also investigated whether to pool patient groups with different urgency levels. More research is necessary to explore the situations in which to either pool or separate patient groups that have both different process times and different urgency levels. It might even be possible to determine rules of thumb for when – and when not – to pool patient groups. An alternative to completely pooling or separating patient groups is to determine conditional overflow rules that set out the situations in which one patient group can use the dedicated capacity of another patient group. Chapter 3 illustrates that this alternative would probably be superior to completely pooling or separating patient groups. Another alternative for pooling entire patient groups is to limit the amount of multipurpose capacity, and to set out rules for the situations in which a patient is allowed to make use of this. Further research is needed to decide upon the amount of multipurpose capacity and to determine the set of rules. Although both alternatives seem promising, operational management will be required to correctly apply these overflow rules in practice. Note that the above suggestions for further research are applicable not only to OPDs and central diagnostic/therapeutic departments, but also to nursing wards.

177
GENERAL DISCUSSION
Applying the interactive tool described in Chapter 8 to other hospital departments would require more detailed modeling of the OPD and nursing ward. Moreover, the financial perspective would need to be integrated to investigate all consequences of a future patient-mix. Finally, an aggregated model for the entire hospital would have to be developed to incorporate interrelated patient groups (for example, diabetes patients) and to determine the future capacity requirements for shared resources such as central diagnostic/therapeutic facilities and the operating room. With this aggregated model, hospital management would be able to be proactive and anticipate a future situation, either to alter the preferred patient-mix or to expand capacity to ensure that the KPIs will be met structurally in the future.
A limitation of our research was that all studies concern unit logistics. Once the accessibility of the OPDs and the central diagnostic facilities is satisfactory, the AMC’s next step will be to focus on network logistics. In contrast to chain logistics, network logistics does not take just one specific patient group into account, but also aims to avoid adverse consequences for other patient groups [5]. Increasing competition in the near future will probably lead to a demand for shorter throughput times for patients. One way to reduce throughput times for a large number of patients would be to combine appointments more often, though this might require complex scheduling rules to avoid a substantial drop in efficiency [7]. Further research is necessary to develop scheduling rules that efficiently combine appointments within one department or for multiple departments. If these scheduling rules could be integrated with a web-based application, patients would be able to schedule their own appointments. Subsequently, patients could decide for themselves if they want to combine multiple appointments on one day or schedule individual appointments on multiple days. An alternative way of reducing the throughput times is to offer a walk-in system for central diagnostic facilities. This will clearly be neither possible nor desirable for all patients, but will substantially reduce the throughput time for all patients using the walk-in facility. Although a walk-in facility is likely to increase fluctuations in demand during a working day and therefore might lead to higher waiting times, it also has some advantages. One advantage is that the no-show percentage will drop, because walk-in patients always show up. Another advantage is that the amount of slack capacity for limiting waiting times is not necessary if patients walk in. In addition, patients might be willing to wait longer if they are able to walk in instead of being forced to return to the hospital on another day. The situations in which these advantages counterbalance the disadvantage of increased fluctuations in demand during a day cannot be determined without quantitative decision support. A research project is ongoing in the AMC to quantitatively and qualitatively investigate the consequences of a partial walk-in system for CT scans.

178
CHAPTER 9
9.5 Practical implications
9.5.1 The need for quantitative decision supportA hospital is a highly complex environment with numerous interactions between patient groups and hospital processes. Moreover, there are many types of variability that make it difficult to predict the effect of potential solutions for improving a hospital’s accessibility. This thesis has shown that quantitative methods such as queuing theory and computer simulation are very well-suited for quantifying the effect of a potential solution before implementing this solution in practice. Applying quantitative methods ensures that alternative solutions are compared objectively. These methods can be used to adapt historically grown capacity division of shared resources, and divide the capacity among the subspecialties so that the overall performance is optimal. Furthermore, these methods can be used to decide whether to pool patient groups that are different from a medical perspective but logistically similar. In short, queuing theory, computer simulation, and regression analysis support fact-based decision making with no hidden agenda. This reduces the risk of undesirable outcomes for patients or personnel, and also unnecessary investments. This thesis shows that the applicability of quantitative methods is not limited to operational- and tactical-level decision making, but that these methods are also valuable for strategic-level decision making.
Generally applied process improvement methods such as Lean (and) Six Sigma often require a pilot period to quantitatively predict a potential solution’s performance. Using a model instead of a pilot period has several advantages: 1. In a model, because one has control over the experimental conditions, the effect
of a single intervention can be quantified.2. Especially at tactical level, the experimentation period for comparing alternative
scenarios will be substantially shorter, thus making it possible to compare more scenarios and probably find a better solution.
3. If the effect of the intervention turns out to be negative, no harm will have been done to the interests of either patients or personnel.
4. If a considerable investment is required, using a model reduces the risk of investing in additional resources that do not result in a substantial increase in the KPIs.
9.5.2 Costs versus qualityWe expect that in the near future the goal of process improvements will shift increasingly from improving quality and accessibility of care towards reducing costs per patient. If costs are cut and resources are restricted without careful consideration, the quality and accessibility will probably decline (see Figure 1.2 in the General Introduction). The challenge will be to decrease costs and maintain the current level

179
GENERAL DISCUSSION
of quality and accessibility. Preferably, the cost reductions will go hand-in-hand with further improvements in quality and accessibility. This thesis demonstrates multiple solutions for accomplishing this.
The capacity of shared resources such as those of an endoscopy department and a radiology department are often divided among many subspecialties and/or patient groups. Both the capacity division as well as the division of the patient population into many groups have often grown historically and are hard to change. This results in capacity that is fragmented and not flexible enough to respond to alterations (including temporary ones) in the number of patients per subspecialty and/or patient groups. Quantitative methods can assist in the difficult, often political, process of redistributing capacity fairly among the patient groups by providing objective decision support. Moreover, by pooling logistically similar patient groups, the scarce capacity becomes more flexible, which will result in greater efficiency.
To increase the flexibility of shared resources even more, capacity claims for clinical paths should be avoided as much as possible. We demonstrated that greater flexibility of shared resources will lead to lower access times. If access times are less than two weeks, many capacity claims for clinical paths become superfluous because the preferred timeslot will probably be available when the indication for a scan or examination is set two or three weeks in advance. If capacity claims for multiple clinical paths are still necessary with low access times, these claims should be pooled on one specific day and with the timeslots for semi-urgent or urgent patients to improve efficiency. Unused timeslots should be made available to other patient groups as soon as possible.
To further reduce the costs per patient, physicians will need to play an active role, because they are involved in a major part of the costs. An additional advantage of more active involvement by physicians and other medical personnel is that the results of the process improvement projects will be more sustainable. Moreover, by creating a continuous improvement culture among all medical personnel (for example, with Lean Management), awareness of quality and cost will become more their own responsibility. Quality improvement personnel should facilitate this continuous improvement culture, and support the medical personnel by step-by-step improvements.
An alternative way of reducing the costs per patient and improving the quality of care is to enlarge the economy of scale by increasing specialization among hospitals. First, separating highly complex care from less complex care would reduce the cost for the less complex care because the “focused factory” concept could be applied more often [8]. Second, by concentrating highly complex care more, accessibility could be improved efficiently and/or costs could be reduced. Moreover, existing literature shows that this will also lead to higher medical quality of care for complex cancer surgery [9-11] and high-risk cardiac surgery [12]. Our interactive tool supplies
180
CHAPTER 9
quantitative decision support for these difficult strategic patient-mix decisions for both secondary and tertiary patient groups.
9.5.3 Reactive versus proactiveFinally, this thesis shows that being proactive rather than reactive is an efficient way of improving hospital performance:l At operational level. By using accurate estimates of an operation’s duration,
management can foresee the risk of overtime and the risk of a cancellation. Next, these accurate estimates should be used to objectively analyze a proposed operating room schedule and estimate the risk of overtime and the risk of cancellation in advance. Subsequently, if these risks exceed a certain threshold value, the operating room list should be adapted until both performance measures are satisfactory. In this way, management will be able to improve these important performance measures.
l At tactical level. Because many processes in hospitals are performed by physicians, the available capacity depends on the presence of these physicians. In academic hospitals, physicians are more frequently absent for different reasons. Moreover, due to the higher degree of subspecialty in academic hospitals, it is often more difficult to replace an absent physician. Also, due to the higher degree of subspecialty and other academic tasks (such as teaching medical students and doing research), patients can only be seen on a limited number of days during the week. Consequently, if one consultation session is cancelled, the access times of the patients increase more than with consultations that are held daily. Therefore, the irregular capacity of processes performed by physicians in academic hospitals fluctuates substantially. This artificial variability of capacity [13] reduces the efficiency or service level of the corresponding process. By using tactical management to reduce this variability, accessibility can be improved significantly with no investments. Furthermore, for a multi-step process, the waiting times prior to the subsequent steps will be reduced as well.
l At strategic level. By incorporating service levels into strategic planning, the additional capacity required could be calculated well in advance. Also, it would be possible to predict the effect of expected or preferred alterations in patient-mix on future service levels so that the necessary measures can be taken. By being proactive, high access times for consultations and high waiting times for surgery can be avoided. To make these patient-mix decisions, management should first decide upon the preferred levels of the KPIs, because the maximum workload depends on the preferred performance. This conclusion also implies that an operating room’s utilization rate alone is not
a good performance indicator for the operating room. To evaluate this performance correctly, management should also take into account the patient-mix and all KPIs

181
GENERAL DISCUSSION
(such as the current waiting list for elective patients, the actual amount of overtime, and the actual number of cancellations due to overrun of previous surgery or due to prioritizing urgent patients).
This thesis shows how quantitative decision support, variability reduction of hospital processes, pooling or separating patient groups, and proactive behavior contribute to improved accessibility by more efficient use of resources. This will enable hospitals to face the challenges in the near future, and cope adequately with budget restrictions, increased competition among hospitals, and the consequences of the aging population for both demand and capacity.

182
CHAPTER 9
References 1. Litvak E, Buerhaus PI, Davidoff F, Long MC, McManus ML, Berwick DM (2005) Managing
unnecessary variability in patient demand to reduce nursing stress and improve patient safety. Jt Comm J Qual Patient Saf 31(6):330-338.
2. Elkhuizen SG, van Sambeek JRC, Hans EW, Krabbendam JJ, Bakker PJM (2007) Applying the variety reduction principle to management of ancillary services. Health Care Manage Rev 32(1):37-45.
3. Strum, DP, May JH, Vargas LG (2000) Modeling the Uncertainty of Surgical Procedure Times. Anesthesiology 92(4):1160-1167.
4. Eijkemans MJC, van Houdenhoven M, Nguyen T, Boersma E, Steyerberg EW, Kazemier G (2010) Predicting the Unpredictable: A New Prediction Model for Operating Room Times Using Individual Characteristics and the Surgeon’s Estimate. Anesthesiology 112(1):41-49.
5. Vissers J, Beech R (2005) Health Operations Management. Routledge, London and New York.
6. Siciliani L, Stanciole A, Jacobs R (2009) Do waiting times reduce hospital costs? J Health Econ 28(4): 71-780.
7. Vermeulen IB, Bohte SM, Elkhuizen SG, Bakker PJM, La Poutré H (2008) Decentralized Online Scheduling of Combination-Appointments in Hospitals. Proc. of ICAPS 372-379.
8. de Vries GG, Bertrand JWM, Vissers JMH (1999) Design requirements for health care production control systems. Production Planning and Control 10(6):559-569.
9. Begg CB, Cramer LB, Hoskins WJ, Brennan MF (1998) Impact of Hospital Volume on Operative Mortality for Major Cancer Surgery. JAMA 280(20):1747-1751.
10. Finlayson EVA, Goodney PP, Birkmeyer JD (2003) Hospital Volume and Operative Mortality in Cancer Surgery: A National Study. Arch Surg 138(7):721-725.
11. Hannan EL, Radzyner M, Rubin D, Dougherty J, Brennan MF (2002) The influence of hospital and surgeon volume on in-hospital mortality for colectomy, gastrectomy, and lung lobectomy in patients with cancer. Surgery 131(1):6-15.
12. Birkmeyer JD, Finlayson EVA, Birkmeyer CM (2001) Volume standards for high-risk surgical procedures: Potential benefits of the Leapfrog initiative. Surgery 130(3):415-422.
13. Litvak E, Long MC (2000) Cost and quality under managed care: Irreconcilable differences? Am J Manag Care 6(3):305-312.


A composition of the photos from Chapter 1 through 9
The will to win means nothing without the will to prepare. Juma Ikangaa
A composition of the photos from Chapter 1 through 9
Summary
How to deal with fluctuations in hospital processes to improve accessibility?


187
SUMMARY
S.1 Summary of General Introduction
In the near future, hospitals are expected to deliver more care because of the aging of the population. At the same time, they are being confronted with budget restrictions as well as a structural shortage of health care professionals due to this aging population. This situation requires hospitals to optimize their processes as much as possible and to use their resources as efficiently as possible. Moreover, hospitals have to improve their accessibility to be able to deal with the increasing competition from new initiatives such as private clinics and diagnostic centers. From the patient’s perspective, low access times are preferable so that the period of uncertainty and inconvenience during their illness is kept as short as possible. More importantly, a patient’s condition may deteriorate while spending time on a waiting list. For several types of cancer and cardiac disorders, the literature shows that if patients have to wait longer for treatment, their chance of full recovery decreases and their risk of death increases significantly.
The overall research objective of this thesis is to show the added value of quantitative methods such as queuing theory, discrete event simulation, and regression analysis for generally applied process improvement methods in a complex hospital setting, in particular for decision support at strategic level. In addition to the overall research objective, this thesis aims to answer the following specific research questions: 1. How can waiting times, access times, and throughput times be reduced cost
effectively a by decreasing the various fluctuations in health care processes and/or b by pooling or separating various patient groups?2. How can hospital processes be made more predictable so that management is
able to anticipate future developments proactively, and structurally improve the hospital’s key performance indicators?
S.2 Summary of Research Studies
Chapters 2 through 8 are based on articles. Because this thesis should be seen as applied research, the order in which they are presented here is based primarily on the application area. Therefore, we have chosen to arrange the chapters according to the hospital departments rather than methodology.
Chapter 2, the first case study, aims to reduce the throughput times in the radiotherapy department of the Academic Medical Center (AMC) in Amsterdam, the Netherlands. We used a combination of queuing theory and computer simulation: queuing theory to provide insight into the effect of variability on the throughput times, and computer simulation to find the bottlenecks in the multi-step radiotherapy

188
SUMMARY
process and to quantitatively compare the alternative solutions to reduce the throughput times efficiently. Despite investing in an additional linear accelerator to remove the presumed bottleneck, the throughput time targets were still not met. The simulation model indicated that the capacity of the outpatient department (OPD) had to be increased. A cost-effective alternative for increasing the capacity of this department was to reduce the substantial fluctuations in capacity. This resulted in both reduced access times and waiting times prior to the consecutive steps (the preparation phase and the actual treatment). This chapter concludes with practical suggestions on how to reduce fluctuations in capacity, and could be of interest to other radiotherapy departments or multi-step processes in hospitals.
Chapter 3 also describes a research study done in the AMC radiotherapy department. Another cost-effective alternative for increasing the capacity of the OPD was to pool or separate urgent and elective patients waiting for a consultation at a radiotherapy OPD. Queuing theory shows that pooling does not always shorten the waiting times of urgent patients. Computer simulation was used to investigate when to pool or separate urgent and elective patients in real hospital situations. The current situation at the AMC radiotherapy OPD requires the same number of consultations for both pooling and separating capacity. One slight advantage of separating capacity is that the service level improves somewhat. The more stringent the performance target for urgent patients, the more advantageous the separation of queues becomes. Jockeying patients from the elective to the urgent queue can further reduce the required capacity.
In Chapter 4, we also investigate whether to pool or separate urgent and elective patients, but this research study deals with the AMC endoscopy department. We used an iterative combination of computer simulation and integer linear programming; computer simulation was used to determine the minimum capacity per patient group to meet the corresponding access time target while keeping the percentage of double-bookings limited. One result was that the dedicated capacity for urgent patients could almost be halved without a large increase in double-bookings. Next, integer linear programming was used to reschedule the required capacity for all patient groups in an available procedure room with the required equipment and a specialized physician present. After we determined the minimum capacity per patient group, we used the simulation model to decide whether to pool or separate certain patient groups. First, the simulation model showed that separating the urgent general gastroenterological and colonoscopy patients into semi-urgent and urgent would use the total capacity more efficiently. Second, the simulation model showed that pooling various patient groups with the same urgency level (in this case, the elective general gastroenterological and colonoscopy procedures) can also lead to improved utilization.

189
SUMMARY
Chapter 5 demonstrates that pooling various patient groups with the same urgency level can improve the efficiency of another central diagnostic facility, namely the magnetic resonance imaging scanner (MRI). In this case, we pooled elective patients from three patient groups and substantially reduced access times for MRI scans. To convince the radiologists to implement this solution, we used computer simulation to determine the order of magnitude of the reduction in access times: The reduction predicted with the simulation model was large enough to convince them, and the solution was successfully implemented in practice.
Chapter 6 describes how we also simulated the daily process to ensure that the reduction in access times for MRI scans would not lead to higher waiting times in the waiting room. In addition, we evaluate various alternative scenarios for reducing waiting times in the waiting room of the MRI department. One solution was to reduce the supervision by radiologists through increased standardization of the MRI protocols. Since the variability of durations with supervision exceeded the variability of durations without supervision, limiting such supervision would lead to an overall reduction in the variability of the process times. Subsequently, this would lead to lower waiting times in the waiting room. Another solution for reducing waiting times was to better estimate the scan duration. Consequently, we compared the scheduled duration and the actual duration per scan type. This comparison showed that for some types of scans the scheduled duration was overestimated, while for other types it was underestimated. By estimating the scan duration more accurately, waiting times could be reduced without decreasing the utilization rate of the MRI.
In contrast to Chapter 6, in Chapter 7 we actually demonstrate how to estimate the duration more accurately (in this case, of a surgical operation) by applying various econometric models. In Chapter 7, the goal was not to reduce waiting times but to reduce the risk of overtime in the operating room and to reduce the percentage of cancellations due to overrun of previous surgeries. We concluded that applying econometric models can significantly improve the estimates of durations. From our investigation, it follows that applying the lognormal model (which is often used in the existing literature) is not the optimal one. Applying an objective method for estimating duration can prevent serious under- or overestimation of the duration. This does not mean the surgeon’s estimate is of no value, because it turned out to be an important explanatory variable for the econometric models. More specifically, the surgeon’s estimate was significant for all departments and all econometric models (p < 0.01). Finally, the accurate estimates should be used to analyze a proposed operating room schedule objectively, and estimate the risk of overtime and the risk of cancellation in advance. Subsequently, if these risks exceed a certain threshold value, the proposed operating room schedule would have to be adapted until both performance measures are satisfactory. This way, management is able to improve these important performance measures proactively.

190
SUMMARY
In Chapter 8, we describe an interactive tool that supports management with strategic patient-mix decisions and takes the key performance indicators (KPIs) into account. This tool enables management to alter the number of patients in various patient groups, and to see the consequences in terms of the KPIs of the OPD, operating room, and nursing ward. In this case study of the AMC ophthalmology department, we focused on the bottleneck, namely the operating room. To decide upon the appropriate level of detail, we started with a literature review to identify all factors that influence an operating room’s utilization rate. Next, we decided upon which factors were relevant to our study. For these factors, we used regression analysis and computer simulation to quantify the impact of an individual factor on the maximum allowed utilization rate. The average duration of an operation, the number of cancellations due to overrun of previous surgeries, and the waiting-time target for elective patients all turned out to have a significant impact. The interactive tool offers management quantitative decision support to enable them to be proactive towards expected alterations in the patient-mix. Hence, management can anticipate the future situation, either to alter the expected patient-mix or to expand capacity to ensure that the KPIs will be met structurally in the future.
This research study also shows that the utilization rate of an operating room alone is not a good performance indicator for the operating room. To evaluate this performance correctly, management should also take the patient-mix and actual performance into account.
S.3 Summary of General Discussion
In Chapter 9, we present the main findings. Moreover, we describe the generalizability of the applied methodology and our results, the limitations of our research, and our recommendations for further research. We conclude Chapter 9 by listing the practical implications of this thesis.
S.3.1 Main findings In terms of added value, the quantitative methods applied in our research studies contributed to the following: 1. Selecting an effective solution for a logistical problem by fact-based decision
making with no hidden agenda (all chapters);2. Providing an objective way of comparing alternative solutions before selecting the
most cost-effective solution for meeting the performance target (all chapters);3. Reducing the risk of undesirable outcomes for patients or personnel and
unnecessary investments (Chapter 2);

191
SUMMARY
4. Quantifying the effect of variability reduction on demand, process times, and capacity (Chapters 2, 4, and 6);
5. Adapting historically grown capacity division of shared resources, and dividing the capacity among the subspecialties so that the overall performance is optimal (Chapter 4);
6. Deciding whether to pool patient groups that are different from a medical perspective but logistically similar (Chapters 3, 4, and 5); and
7. Enabling management to be proactive and anticipate the future situation to ensure that the preferred KPIs will be met structurally (Chapters 6, 7, and 8).
Generally applied process improvement methods such as Lean (and) Six Sigma often require a pilot period to quantitatively predict a potential solution’s performance. Using a model instead of a pilot period has several advantages: 1. In a model, because one has control over the experimental conditions, the effect
of a single intervention can be quantified.2. Especially at tactical level, the experimentation period for comparing alternative
scenarios will be substantially shorter, thus making it possible to compare more scenarios and probably find a better solution.
3. If the effect of the intervention turns out to be negative, no harm will have been done to the interests of either patients or personnel.
4. If a considerable investment is required, using a model reduces the risk of investing in additional resources that do not result in a substantial increase in the KPIs.
Chapters 2, 4, and 6 demonstrate ways to decrease fluctuations in health care processes:1. Decrease demand variability by stabilizing the capacity in the first step of a
multi-step (radiotherapy) process;2. Decrease variability in process times by increasing standardization of (MRI)
protocols; and3. Decrease capacity variability by introducing a backup system for physicians to
lower the number of occasional closures of (endoscopic) procedure rooms and by preparing an overview of the total number of consultations for new (radiotherapy) patients per week for the coming quarter, and being proactive if the expected number is below a certain threshold value.

192
SUMMARY
In Chapters 3, 4, and 5, we explore the situations in which patient groups should be either pooled or separated to improve accessibility. We investigated two different reasons for this:1. Pooling or separating patient groups based on urgency level: The radiotherapy
study shows that the difference in urgency level will determine whether pooling or separating urgent and elective patients will be beneficial. If elective patients are allowed to utilize free urgent timeslots (one day in advance), the capacity required to meet the access time targets would drop even further. In addition, the endoscopy study demonstrates that by separating the urgent patients into semi-urgent and urgent, the total capacity would be used more efficiently. As the semi-urgent capacity can be used more efficiently than the urgent capacity, a smaller number of urgent patients will lead to a higher overall utilization. This effect offsets the negative effect of separating the capacity into semi-urgent and urgent timeslots.
2. Pooling or separating capacity dedicated to specific patient groups that seem to be similar from a logistical point of view: In both the endoscopy study and the MRI study (Chapters 4 and 5), pooling elective patients in various patient groups will lead to reduced access times. Unfortunately, it was not possible to pool multiple patient groups in either study because personnel outside the (radiology) department needed to be present, or because different equipment and/or specialized physicians were required to perform the (endoscopic) procedures.
The research in Chapters 6, 7, and 8 was used to explore how to make hospital processes more predictable. By increasing standardization of (MRI) protocols, not only would the average duration decrease, but also the variability in process times. This variability reduction makes it easier to predict the actual duration more accurately. Although in Chapter 6 we showed only the effect of more accurate estimates of the duration on the relevant KPIs, in Chapter 7 we actually explain how to more accurately estimate the duration (in this case, of a surgical operation) by applying various econometric models. We conclude that applying such models can significantly improve these estimates. Finally, we show that more accurate predictions of the durations will result in less overtime and fewer cancellations due to overrun of previous surgeries.
In Chapter 8, we present an interactive decision-support tool we developed to enable the management of the AMC ophthalmology department to decide upon the future patient-mix to improve the KPIs. With this interactive tool, management is able to alter the number of patients per patient group and see the consequences in terms of maximum workload so that the preferred KPIs can be met. Therefore, management is able to better anticipate the future situation, either to alter the expected patient-mix, or to expand capacity to ensure that the KPIs will be met

193
SUMMARY
structurally in the future. Clearly, capacity issues cannot be solved without taking the preferred service levels into account as well.
S.3.2 Generalizability of methodology and resultsThe queuing models that were used to provide insight into the effect of variability to the access times of the AMC radiotherapy OPD could also be used to provide such insights for other OPDs within the AMC and in other hospitals. Although the specific simulation models used in this thesis must be adapted to analyze similar problems in other hospital departments, the need for computer simulation remains. The various regression models used in Chapter 7 could be used to improve the accuracy of scheduling operations in other hospitals as well. Moreover, the applied regression models could also be used to improve the accuracy of scheduled consultations in an OPD, various procedures, and various scan durations in other hospitals. The two combined approaches – namely computer simulation and integer linear programming for the endoscopy study, and regression analysis and computer simulation to support strategic patient-mix decisions – are also applicable for other hospitals. In the latter case, computer simulation may have to be used for other included factors.
For the reasons mentioned earlier, other hospitals could also benefit from applying quantitative methods to support operational, tactical, and strategic decision making. All the examples of variability reduction presented in this thesis are useful for other hospitals as well. We cannot draw a general conclusion for the situations in which patient groups should be either pooled or separated to improve accessibility. In addition to the lognormal regression model, the alternative regression models described in Chapter 7 could also be applied in other hospitals. Some modifications would have to be made to apply the interactive decision-support model described in Chapter 8 to other departments within the AMC or to other hospitals. Obviously, the main message holds for other hospitals as well: Be proactive and anticipate the future situation, either by altering the expected patient-mix or by expanding capacity to ensure that the KPIs will be met structurally in the future.
S.3.3 LimitationsThe first limitation of our research is that all studies concern unit logistics rather than chain or network logistics.
The second limitation of this thesis is that although we did succeed in meeting the access time targets of two weeks with the current capacity, the preferred access times seem to be even lower with the emergence of “one-stop shopping”. An obvious disadvantage of process improvements in a single unit is that the overall hospital performance might not improve.

194
SUMMARY
The third limitation is that if patients with different urgency levels are to be separated, the definition of an urgent patient should be unambiguous. Otherwise, a referring physician might use the urgent indication more often than actually necessary. This would increase the number of urgent patients and, consequently, the access times for urgent patients would increase and the overall efficiency would decrease.
S.3.4 Further researchWe suggest multiple directions for further research. More research on how to implement best practices within other departments in the same hospital – and within the same departments in other hospitals – would be very valuable. This requires user-friendly, easily adaptable decision-support tools that clearly describe the goal, the assumptions, and the limitations.
Building on the research in this thesis, more research is necessary to explore the situations in which to either pool or separate patient groups that have both different process times and different urgency levels.
Applying the interactive tool described in Chapter 8 to other hospital departments would require more detailed modeling of the OPD and nursing ward. Moreover, the financial perspective would need to be integrated to investigate all consequences of a future patient-mix.
Furthermore, additional research is necessary to develop scheduling guidelines that efficiently combine appointments within a single department or for multiple departments. Although an alternative way of reducing the number of hospital visits would be to introduce a partial walk-in system for central diagnostic facilities, research is necessary to investigate the situations in which the advantages counterbalance the disadvantage of increased fluctuations in demand during a given day.
S.3.5 Practical implications
The need for quantitative decision support
A hospital is a highly complex environment with numerous interactions between patient groups and hospital processes. Moreover, there are many types of variability that make it difficult to predict the effect of potential solutions for improving a hospital’s accessibility. This thesis has shown that quantitative methods such as queuing theory and computer simulation are very well-suited for quantifying the effect of a potential solution before implementing this solution in practice. Applying quantitative methods ensures that alternative solutions are compared objectively. These methods can be used to adapt historically grown capacity division of shared resources, and divide the capacity among the subspecialties so that the overall performance is optimal. Furthermore, these methods can be used to decide whether

195
SUMMARY
to pool patient groups that are different from a medical perspective but logistically similar. In short, queuing theory, computer simulation, and regression analysis support fact-based decision making with no hidden agenda. This reduces the risk of undesirable outcomes for patients or personnel, and also unnecessary investments. This thesis shows that the applicability of quantitative methods is not limited to operational- and tactical-level decision making, but that these methods are also valuable for strategic-level decision making.
Costs versus quality
We expect that in the near future the goal of process improvements will shift increasingly from improving quality and accessibility of care towards reducing costs per patient. This thesis demonstrates multiple solutions for achieving cost reductions and improving quality and accessibility of hospital care.
The capacity of shared resources such as those of an endoscopy department and a radiology department are often divided among many subspecialties and/or patient groups. Quantitative methods can assist in the difficult, often political, process of fairly redistributing the capacity among the patient groups by providing objective decision support. Moreover, by pooling logistically similar patient groups, the scarce capacity becomes more flexible, which will result in greater efficiency. To increase the flexibility of shared resources even more, capacity claims for clinical paths should be avoided as much as possible. If capacity claims for multiple clinical paths are still necessary with low access times, these claims should be pooled on one specific day and with the timeslots for semi-urgent or urgent patients to improve efficiency.
Reactive versus proactive
Finally, this thesis shows that being proactive rather than reactive is an efficient way of improving hospital performance:
At operational level. By using accurate estimates of an operation’s duration, management can foresee the risk of overtime and the risk of a cancellation. If these risks exceed a certain threshold value for a proposed operating room schedule, it should be adapted until both performance measures are satisfactory.
At tactical level. For multiple reasons, the capacity of processes performed by physicians in academic hospitals fluctuates substantially. By using tactical management to reduce this variability, accessibility can be improved significantly with no investments.
At strategic level. By incorporating service levels into strategic planning, the additional capacity required could be calculated well in advance. Also, it would be possible to predict the effect of expected or preferred alterations in patient-mix on

196
SUMMARY
future service levels so that the necessary measures can be taken. By being proactive, high access times for consultations and high waiting times for surgery can be avoided.
This thesis shows how quantitative decision support, variability reduction of hospital processes, pooling or separating patient groups, and proactive behavior contribute to improved accessibility by more efficient use of resources. This will enable hospitals to face the challenges in the near future, and cope effectively with budget restrictions, increased competition among hospitals, and the consequences of the aging population for both demand and capacity.


Een compositie van de foto’s uit hoofdstuk 1 tot en met 9
De wil om te winnen betekent niets zonder de wil om je daarvoor in te zetten. Juma Ikangaa

Een compositie van de foto’s uit hoofdstuk 1 tot en met 9
Samenvatting
Hoe om te gaan met fluctuaties in ziekenhuisprocessen teneinde de toegankelijkheid te verbeteren?

201
SAMENVATTING
Deze samenvatting is een overzicht van het toegepaste onderzoek waar we de afgelopen jaren aan hebben gewerkt: procesoptimalisatie met als doel de toegankelijkheid van het AMC te verbeteren. Eerst wordt de algemene introductie (hoofdstuk 1 van dit proefschrift) samengevat waarin wordt beschreven waarom de toegankelijkheid van ziekenhuizen verbeterd moet worden op een kosteneffectieve manier en welke onderzoeksvragen we met dit toegepaste onderzoek willen beantwoorden. Vervolgens geven we een samenvatting van de artikelen die we de afgelopen jaren over de verschillende onderzoeksprojecten hebben geschreven (zie hoofdstuk 2 tot en met 8 voor de complete artikelen). Tenslotte wordt de algemene discussie (hoofdstuk 9) samengevat met daarin: (1) de belangrijkste bevindingen, ofwel de antwoorden op onze onderzoeksvragen, (2) de algemene toepasbaarheid van de gebruikte methodieken en onze resultaten, (3) de beperkingen van ons onderzoek, (4) onze aanbevelingen voor vervolgonderzoek en (5) de praktische implicaties van dit proefschrift.
S.1 Samenvatting ‘General Introduction’
S.1.1 Aanleiding van ons onderzoekOm verschillende redenen wordt van ziekenhuizen verwacht dat zij de komende jaren op een kosteneffectieve manier de toegankelijkheid van de zorg verbeteren:1. Stijgende zorgvraag: In de nabije toekomst wordt van ziekenhuizen verwacht dat
zij meer zorg gaan leveren als gevolg van de vergrijzing. 2. Toekomstig personeelstekort: Er wordt een structureel tekort aan medisch
personeel verwacht, wederom als gevolg van de vergrijzing.3. Budgetbeperkingen: Ziekenhuizen worden geconfronteerd met budgetbeperkingen.
Deze situatie vereist dat ziekenhuizen hun processen optimaliseren en de beschikbare capaciteit zo efficiënt mogelijk inzetten.
4. Meer concurrentie: Bovendien moeten ziekenhuizen de toegangstijden voor een poliklinisch consult en diagnostisch onderzoek reduceren om de stijgende concurrentie van nieuwe initiatieven, als privéklinieken en diagnostische centra, het hoofd te bieden.
5. Gezondheidstoestand patiënten: Vanuit patiëntperspectief zijn lage toegangstijden en wachttijden voor een operatie wenselijk om de periode van onzekerheid en ongemak ten gevolge van hun klachten zo kort mogelijk te houden. Nog belangrijker is dat de gezondheidstoestand van de patiënt mogelijk achteruit gaat tijdens het wachten op een behandeling. Voor verschillende oncologische aandoeningen en hartafwijkingen is bewezen dat patiënten die langer op behandeling hebben gewacht, een lagere kans op volledig herstel hebben en een hogere sterftekans.

202
SAMENVATTING
S.1.2 Onderzoeksvragen van dit proefschriftOm de toegankelijkheid van het AMC op een kosteneffectieve manier te verbeteren, zijn de volgende onderzoeksvragen opgesteld:1. Hoe kunnen wachttijden, toegangstijden en doorlooptijden op een kosteneffectieve
wijze verlaagd worden a door de fluctuaties in ziekenhuisprocessen te reduceren en/of b door samenvoegen of scheiden van verschillende patiëntgroepen?2. Hoe kunnen ziekenhuisprocessen beter voorspelbaar gemaakt worden zodat het
management in staat is om tijdig te anticiperen op toekomstige ontwikkelingen en de prestatie-indicatoren van het ziekenhuis structureel te verbeteren?
Daarnaast willen we de toegevoegde waarde van kwantitatieve methoden als wachtrijtheorie1, computersimulatie2 en regressie-analyse3 ten opzichte van algemene procesverbeterings-methodieken4 laten zien in een complexe ziekenhuis omgeving. Dit geldt in het bijzonder voor besluitvorming op strategisch niveau.
S.2 Samenvatting van alle onderzoeksprojecten
Het eerste onderzoeksproject (hoofdstuk 2) had tot doel de doorlooptijden te reduceren van de afdeling Radiotherapie van het Academisch Medisch Centrum (AMC) in Amsterdam. Dit proces bestaat uit drie stappen: (1) een eerste consult bij de polikliniek, (2) de voorbereidingsfase en (3) de daadwerkelijke bestraling. We hebben een combinatie van wachtrijtheorie en computersimulatie toegepast om te analyseren hoe de doorlooptijden op een efficiënte manier verlaagd kunnen worden. Wachtrijtheorie is gebruikt om de effecten van verschillende fluctuaties inzichtelijk te maken. Vervolgens is computersimulatie gebruikt om de knelpunten in het radiotherapieproces te vinden en om de alternatieve oplossingen om de doorlooptijden te reduceren kwantitatief te vergelijken. Ondanks de aanschaf van een extra bestralingsapparaat om het verwachte knelpunt te elimineren, werden de doelstellingen voor de doorlooptijden nog niet gehaald. Het simulatiemodel gaf aan dat ook de capaciteit van de polikliniek Radiotherapie verhoogd moet worden. Een kosteneffectief alternatief voor het verhogen van de capaciteit van de polikliniek is het reduceren van de fluctuaties in poliklinische capaciteit (het aantal eerste consulten per week). Dit resulteert in zowel een afname van de toegangstijden
1 Wachtrijtheorie is de wiskundige bestudering van wachtrijen.2 Computersimulatie is de ontwikkeling van een model van een praktisch systeem en het
experimenteren met dit model op een computer om inzicht te verkrijgen over het systeem en verschillende scenario’s te evalueren aan de hand van kwantitatieve resultaten en animatie.
3 Regressie-analyse is een statische techniek voor het analyseren van gegevens waarin (mogelijk) sprake is van specifieke samenhang.
4 Voorbeelden van algemene procesverbeteringsmethodieken zijn: Business Process Redesign, Total Quality Management, Theory of Constraints, Lean management en Six Sigma.

203
SAMENVATTING
voor de polikliniek als een afname van de wachttijd voor de voorbereidingsfase en de daadwerkelijke bestraling. Dit hoofdstuk sluit af met praktische suggesties hoe de fluctuaties in capaciteit verminderd kunnen worden. Dit resultaat is tevens van belang voor andere radiotherapieafdelingen of andere ziekenhuisprocessen die uit meerdere stappen bestaan.
In hoofdstuk 3 wordt ook een onderzoeksproject van de radiotherapieafdeling van het AMC beschreven. Een ander kosteneffectief alternatief voor het verhogen van de capaciteit van de polikliniek is het samenvoegen of scheiden van spoed en electieve5 patiënten. Wachtrijtheorie laat zien dat samenvoegen niet altijd voordelig is voor de wachttijd van spoedpatiënten. Vervolgens is computersimulatie gebruikt om te onderzoeken in welke praktische situaties het efficiënter is de spoed en electieve patiënten samen te voegen of juist te scheiden. Uit de simulatie bleek dat in de huidige situatie de minimale capaciteit zodat zowel de spoed als electieve patiënten de toegangstijdnorm halen, in beide situaties gelijk is. Indien de patiëntgroepen gescheiden werden, was het serviceniveau wel hoger. Het voordeel van scheiden wordt groter wanneer de prestatienorm voor spoedpatiënten scherper wordt gesteld. Indien electieve patiënten gebruik mogen maken van vrije spoedplaatsen dan wordt het scheiden van de patiëntgroepen nog efficiënter.
Ook in hoofdstuk 4 onderzoeken we wanneer samenvoegen of scheiden van spoed en electieve patiënten efficiënter is, maar in dit geval voor de afdeling Endoscopie van het AMC. We hebben een iteratieve combinatie van computersimulatie en lineair programmeren6 toegepast om de minimaal benodigde capaciteit per patiëntgroep te bepalen. De minimale capaciteit is zo bepaald dat elke patiëntgroep de betreffende toegangstijdnorm haalt terwijl het percentage overboekingen7 beperkt blijft. Eén van de resultaten was dat de capaciteit voor spoedpatiënten bijna met de helft gereduceerd kon worden zonder dat dit zou leiden tot een grote toename in overboekingen. Vervolgens is deze vrijgevallen capaciteit met lineair programmeren opnieuw gepland zodat alle patiëntgroepen een beschikbare, geschikte behandelingkamer met een gespecialiseerde arts hebben. Nadat we de minimale capaciteit per patiëntgroep hadden bepaald, hebben we het simulatiemodel gebruikt om te beslissen of bepaalde patiëntgroepen beter samengevoegd of juist gescheiden konden worden. Het simulatiemodel liet zien dat door het scheiden van de ‘spoed’ gastro-enterologische en colonoscopie patiënten in semi-spoed en spoed de capaciteit efficiënter gebruikt kan worden. Daarnaast liet het simulatiemodel zien dat het samenvoegen van verschillende patiëntgroepen met dezelfde spoedcategorie (in dit geval electieve gastro-enterologische en colonoscopie patiënten) kan leiden tot een hogere efficiency.
5 Electieve zorg is niet spoedeisende zorg.6 Lineair programmeren is een wiskundige methode voor het oplossen van
optimaliseringproblemen waarbij de doelfunctie en de randvoorwaarden allen lineair zijn7 Een overboeking houdt in dat meerdere patiënten zijn gepland op hetzelfde tijdstip in
dezelfde behandelkamer.

204
SAMENVATTING
In hoofdstuk 5 laten we zien dat samenvoegen van verschillende patiëntgroepen met dezelfde spoedcategorie kan leiden tot een hogere efficiency van een andere centraal diagnostische faciliteit, te weten de MRI (Magnetic Resonance Imaging). In dit geval hebben we electieve patiënten van drie patiëntgroepen samengevoegd waardoor de toegangstijden voor een MRI-scan aanzienlijk werden verlaagd. Om de radiologen te overtuigen deze oplossing te implementeren, hebben we computersimulatie gebruikt om de orde van grootte van de afname in toegangstijden te bepalen. De voorspelde afname bleek groot genoeg om de radiologen te overtuigen en de oplossing is succesvol geïmplementeerd in de praktijk.
Om te zorgen dat de afname in toegangstijd voor een MRI-scan niet zou leiden tot een hogere wachttijd in de wachtruimte, hebben we ook het dagelijkse proces gesimuleerd (hoofdstuk 6). Bovendien hebben we verschillende alternatieve scenario’s gesimuleerd om de wachttijd in de wachtruimte te reduceren. Eén oplossing was om de supervisie van radiologen te verminderen door de MRI-protocollen beter te standaardiseren. Aangezien de fluctuaties in scantijden met supervisie hoger was dan de fluctuaties van de scantijden zonder supervisie, zou minder supervisie tot een algemene daling van fluctuaties in scantijden leiden. Dit leidt weer tot lagere wachttijden in de wachtruimte. Een andere oplossing was om de scantijd beter te voorspellen. Hiervoor hebben we de geplande scantijd en de gerealiseerde scantijd per type MRI-scan vergeleken. Uit deze vergelijking bleek dat voor bepaalde types de scantijd overschat werd terwijl voor andere types de scantijd structureel onderschat werd. Door de scantijd accurater te schatten, kunnen de wachttijden in de wachtruimte gereduceerd worden zonder dat de bezettingsgraad van de MRI-apparaten lager zou worden.
Voortbouwend op hoofdstuk 6, laten we in hoofdstuk 7 daadwerkelijk zien hoe de duur (van in dit geval een operatie) accurater geschat kan worden met behulp van regressie-analyse. In hoofdstuk 7 was het doel niet om wachttijden te reduceren maar om het risico van overwerken in de OK en het percentage annuleringen door uitloop van vorige operaties te reduceren. Onze conclusie was dat het mogelijk is om de operatieduren accurater in te schatten met behulp van regressie-analyse. Onderschatten van de operatieduur kan worden voorkomen door een objectieve methode van inschatten te gebruiken. Overigens heeft de inschatting van de chirurg nog steeds toegevoegde waarde want deze inschatting is namelijk een belangrijke verklarende variabele voor de regressie-analyse. Tenslotte zouden deze accuratere inschattingen gebruikt moeten worden om een voorgestelde operatieplanning objectief te toetsen en het risico van overwerken en de kans op een annulering vooraf in te schatten. Vervolgens zou de voorgestelde operatieplanning moeten worden aangepast totdat beide risico’s beperkt zijn. Op deze manier kan het management het overwerk en het percentage annuleringen ten gevolge van uitloop van vorige operaties proactief verminderen.
205
SAMENVATTING
In hoofdstuk 8 beschrijven we een interactief tool om het management van de afdeling Oogheelkunde kwantitatief te ondersteunen bij strategische patiëntmix beslissingen. Deze beslissingsondersteunende tool stelt het management in staat om het aantal patiënten per patiëntgroep aan te passen en de consequenties hiervan op de belangrijkste prestatie-indicatoren van de polikliniek, de OK en de verpleegafdeling te zien. In deze case studie focussen we op het grootste knelpunt van de afdeling Oogheelkunde, namelijk de OK. Om tot een geschikte modellering te komen, hebben we eerst een literatuuronderzoek uitgevoerd om alle factoren te achterhalen die de bezettingsgraad van een OK bepalen. Vervolgens hebben we vastgesteld welke van deze factoren voor onze case studie van belang zijn. Voor deze factoren hebben we regressie-analyse en computersimulatie gebruikt om de invloed van een specifieke factor op de maximale bezettingsgraad van de OK te bepalen. De gemiddelde operatieduur, het aantal annuleringen ten gevolge van uitloop van vorige operaties en de wachttijd voor electieve patiënten bleken significant effect te hebben. Deze interactieve tool biedt het management kwantitatieve ondersteuning om proactief te handelen op verwachte veranderingen in patiëntmix. Hierdoor kan het management op de toekomstige situatie anticiperen door strategische keuzes te maken in de patiëntmix en/of door de capaciteit tijdig uit te breiden zodat de belangrijkste prestatie-indicatoren in de toekomst structureel gehaald zullen worden.
S.3 Samenvatting ‘General Discussion’
In de algemene discussie van dit proefschrift (zie hoofdstuk 9 voor details) zijn de belangrijkste bevindingen toegelicht. Bovendien beschrijven we de algemene toepasbaarheid van de gebruikte methodieken en onze resultaten, de beperkingen van ons onderzoek, onze aanbevelingen voor vervolgonderzoek en de praktische implicaties van dit proefschrift.
S.3.1 Belangrijkste bevindingenDe belangrijkste bevindingen worden per onderzoeksvraag toegelicht:
Minder fluctuaties in ziekenhuisprocessen leiden tot betere toegankelijkheid
Hoofdstuk 2, 4 en 6 laten zien hoe de verschillende fluctuaties in ziekenhuisprocessen verminderd kunnen worden:1. in zorgvraag (aantal patiënten per week): door het stabiliseren van de capaciteit
in de eerste stap van een proces (zoals een radiotherapeutisch consult bij de polikliniek) wordt de aanvoer van patiënten in de vervolgstappen geleidelijker,

206
SAMENVATTING
2. in procestijden: door beter standaardiseren van (MRI-)protocollen zullen proces-tijden minder fluctueren en
3. in capaciteit (beschikbaar aantal consulten per week): de capaciteit zal minder fluctueren als een back-up systeem voor artsen wordt geïntroduceerd om te zorgen dat het aantal sluitingen van (endoscopie) behandelkamers verminderd wordt én door een overzicht bij te houden van het totaal aantal beschikbare consulten voor nieuwe (radiotherapie) patiënten per week voor het komende kwartaal om te voorkomen dat dit weekaantal onder een vastgestelde ondergrens zakt.
Het samenvoegen of juist scheiden van patiëntgroepen leidt tot verhoogde efficiency
In hoofdstuk 3, 4 en 5 onderzoeken we in welke situaties patiëntgroepen samen-gevoegd of juist gescheiden moeten worden om de toegankelijkheid te bevorderen. We hebben twee situaties onderzocht:1. samenvoegen of scheiden van patiëntgroepen met verschillende spoedcategorieën:
de radiotherapie studie (hoofdstuk 3) laat zien dat het verschil in urgentie bepalend is of samenvoegen of scheiden efficiënter is. Indien electieve patiënten gebruik mogen maken van vrije spoedplaatsen dan kan de efficiëntie nog verder verbeterd worden. Bovendien laat de endoscopiestudie (hoofdstuk 4) zien dat het scheiden van ‘spoed’ patiënten in semi-spoed en spoed, ook kan leiden tot een hogere efficiency.
2. samenvoegen of scheiden van medisch verschillende maar logistiek vergelijkbare patiëntgroepen: in zowel de endoscopiestudie als de MRI-studie (hoofdstuk 4 en 5) leidt het samenvoegen van verschillende electieve patiëntgroepen tot lagere toegangstijden. Helaas werden de mogelijkheden tot samenvoegen van patiëntgroepen beperkt omdat bij sommige patiëntgroepen personeel buiten de (radiologie)afdeling aanwezig moest zijn of omdat de patiëntgroepen andere apparatuur en/of gespecialiseerde artsen vereisen om de (endoscopie)procedure uit te voeren.
Betere voorspelbaarheid van ziekenhuisprocessen leidt tot betere prestaties
Het onderzoek uit hoofdstuk 6, 7 en 8 is gebruikt om te onderzoeken hoe ziekenhuis-processen beter voorspelbaar gemaakt kunnen worden.
Door de (MRI-)protollen beter te standaardiseren zouden niet alleen de gemiddelde procestijden (scantijden) verlaagd worden maar ook de fluctuaties in procestijden. Deze daling in fluctuaties maakt het makkelijker de verwachte duur accuraat in te schatten. In hoofdstuk 7 laten we daadwerkelijk zien hoe de duur (van in dit geval een operatie) accurater geschat kan worden door middel van regressie-analyse. De

207
SAMENVATTING
conclusie is dat de duur inderdaad accurater geschat kan worden door de toepassing van regressie-analyse.
In hoofdstuk 8 hebben we een interactief beslissingsondersteunende tool ontwikkeld om het management van de afdeling Oogheelkunde van het AMC in staat te stellen keuzes te maken in de toekomstige patiëntmix ten einde de belangrijkste prestatie-indicatoren te verbeteren. Met deze interactieve tool kan het management het aantal patiënten per patiëntgroep aanpassen en de consequenties van deze aanpassing op de gewenste prestatie-indicatoren zien. Hierdoor is het management beter in staat om te anticiperen op een toekomstige situatie, of door de patiëntmix aan te passen of door de capaciteit tijdig uit te breiden zodat de belangrijkste prestatie-indicatoren in de toekomst structureel gehaald zullen worden. Uit dit onderzoek is duidelijk naar voren gekomen dat capaciteitsproblemen niet kunnen worden opgelost zonder rekening te houden met de gewenste logistieke prestaties (zoals wachttijd, percentage annuleringen en uitloop van het dagprogramma).
Kwantitatieve methoden hebben veel toegevoegde waarde voor ziekenhuizen
Dankzij het toepassen van kwantitatieve methoden binnen onze onderzoeksprojecten zijn we in staat gebleken om:1. een geschikte oplossing te selecteren voor een logistiek probleem met feitelijke
onderbouwing (alle hoofdstukken),2. alternatieve oplossingen objectief te vergelijken en de meest kosteneffectieve
oplossingen of combinatie van oplossingen te selecteren zodat de vastgestelde prestatie-indicatoren gehaald worden (alle hoofdstukken),
3. het risico van ongewenste uitkomsten voor patiënten (bv hogere wachttijden of toegangstijden) en personeel (bv meer overwerk) te reduceren én om onnodige investeringen te voorkomen (alle hoofdstukken),
4. het effect van verminderde fluctuaties in zorgvraag, procestijden en capaciteit te kwantificeren (hoofdstuk 2, 4 en 6),
5. historische gegroeide capaciteitsverdeling van gedeelde middelen aan te passen en de beschikbare capaciteit te verdelen onder de (sub)specialisaties zodat de algehele prestatie zo optimaal mogelijk is (hoofdstuk 4),
6. te beslissen of patiëntgroepen die verschillend zijn vanuit medisch oogpunt maar logistiek gezien vergelijkbaar, samengevoegd of juist gescheiden moeten worden (hoofdstuk 3, 4 en 5) en
7. het management in staat te stellen proactief te handelen en te anticiperen op een toekomstige situatie zodat de belangrijkste prestatie-indicatoren structureel gehaald zullen worden (hoofdstuk 6, 7 en 8).
208
SAMENVATTING
Algemeen toegepaste procesverbeteringsmethodieken als Lean (en) Six Sigma vereisen vaak een testperiode om het effect van een mogelijke oplossing kwantitatief te bepalen. Een model gebruiken in plaats van een testperiode heeft verschillende voordelen:1. een model biedt controle over de experimentele condities zodat het effect van een
enkele interventie kan worden gekwantificeerd,2. de experimentatieperiode om alternatieve oplossingen te vergelijken is substantieel
korter waardoor meer oplossingen vergeleken kunnen worden en waarschijnlijk betere oplossingen gevonden kunnen worden (dit geldt in het bijzonder op tactisch niveau),
3. als het effect van een mogelijke oplossing negatief blijkt te zijn, is het belang van de patiënten en het personeel niet geschaad en
4. indien substantiële investeringen noodzakelijk zijn, zorgt het gebruik van een model voor een lager risico dat de extra middelen niet tot het gewenst effect leiden.
S.3.2 Algemene toepasbaarheid van de gebruikte methodieken en onze resultatenIn deze paragraaf wordt toegelicht of de gebruikte methodieken ook binnen andere ziekenhuizen dan het AMC toepasbaar zijn en in welke mate onze resultaten interessant zijn voor andere ziekenhuizen.
De modellen uit de wachtrijtheorie die gebruikt zijn om inzicht te verschaffen in het effect van de fluctuaties op de toegangstijden van de polikliniek Radiotherapie kunnen ook gebruikt worden om inzicht te verschaffen voor andere poliklinieken binnen het AMC en in andere ziekenhuizen. Hoewel de in dit proefschrift beschreven simulatiemodellen moeten worden aangepast om soortgelijke problemen in andere ziekenhuisafdelingen te analyseren, blijft het gebruik van computersimulatie noodzakelijk. De regressie-analyse uit hoofdstuk 7 kunnen ook gebruikt worden om de inschattingen van operatieduren in andere ziekenhuizen te verbeteren. Bovendien kan regressie-analyse ook gebruikt worden om consultduren van een polikliniek, verschillende procedures/behandelingen en allerlei scantijden accurater te voorspellen. De twee gecombineerde benaderingen – namelijk computersimulatie en lineair programmeren voor de endoscopie studie én regressie-analyse en computersimulatie voor de strategische patiëntmix beslissingen – zijn beide toepasbaar op andere ziekenhuizen. In het laatste geval kan computersimulatie nodig zijn voor andere relevante factoren.
Om eerder genoemde redenen (zie paragraaf 11.3.1) kunnen andere ziekenhuizen ook hun voordeel doen met de toepassing van kwantitatieve methoden om operationeel, tactisch en strategische besluitvorming te ondersteunen. Alle voorbeelden van verminderde fluctuaties van ziekenhuisprocessen zijn direct bruikbaar voor andere ziekenhuizen. We kunnen helaas geen algemene conclusie trekken in welke situaties patiëntgroepen samengevoegd of gescheiden moeten worden om de toegankelijkheid

209
SAMENVATTING
te verbeteren. Regressie-analyse kan ook in andere ziekenhuizen worden toegepast om operatieduren accurater in te schatten. Om de interactieve tool (hoofdstuk 8) bruikbaar te maken voor andere afdelingen en/of ziekenhuizen, zijn verschillende aanpassingen vereist. Desondanks is het advies om meer proactief te handelen en te anticiperen op toekomstige situaties ook nuttig voor andere ziekenhuizen.
S.3.3 Beperkingen van ons onderzoekIn deze paragraaf wordt toegelicht welke beperkingen ons onderzoek heeft:
De eerste beperking van ons onderzoek is dat de vastgestelde normen voor de toegangstijd minder scherp lijken te zijn dan de door patiënten gewenste toegangstijd, zeker gezien de opkomst van het zogenaamde “one-stop-shop” principe waarbij alle afspraken van een patiënt op één dag gepland zijn.
Een tweede beperking is dat alle studies slechts een enkele afdeling (zogenaamde unit logistiek) betreffen in plaats van keten- of netwerk logistiek. Een nadeel van procesverbeteringen binnen één afdeling kan zijn dat de overkoepelende ziekenhuisprestaties niet verbeteren.
Een derde beperking is dat als patiënten op basis van spoedcategorie gescheiden moeten worden, de definitie van de spoedcategorieën duidelijk moet worden vastgesteld. Anders zou een arts een patiënt een spoedindicatie kunnen geven opdat deze sneller aan de beurt komt terwijl dit medisch gezien niet noodzakelijk is. Een hoger percentage spoedpatiënten zorgt ervoor dat de toegangstijden voor spoedpatiënten stijgen en de algehele efficiency uiteindelijk zal dalen.
S.3.4 Aanbevelingen voor vervolgonderzoekNaar aanleiding van ons onderzoek, zien we meerdere mogelijkheden voor vervolg-onderzoek.
Meer onderzoek naar de verspreiding van best practices8 binnen andere afdelingen van hetzelfde ziekenhuis en binnen andere ziekenhuizen zou erg waardevol zijn. Dit verlangt wel gebruikvriendelijke, makkelijk aan te passen beslissingsondersteunende tools waarbij het doel, de aannames en beperkingen duidelijk vermeld moeten worden.
Voortbouwend op het onderzoek in dit proefschrift, is meer onderzoek nodig om te achterhalen in welke situaties samenvoegen of scheiden van patiëntgroepen met zowel verschillende procestijden als verschillende spoedcategorieën tot een hogere efficiency leidt.
Om de interactieve tool uit hoofdstuk 8 op andere ziekenhuisafdelingen toe te passen, is een gedetailleerdere modellering van de polikliniek en de verpleegafdeling
8 Een best practice is een oplossing(srichting) of aanpak die effectiever is om een bepaald resultaat te halen dan enige andere oplossing(srichting) of aanpak.

210
SAMENVATTING
vereist. Bovendien zou het financiële perspectief geïntegreerd moeten worden met het logistieke perspectief om alle consequenties van een toekomstige patiëntmix te analyseren.
Tevens is extra onderzoek nodig om planningsregels op te stellen om op een efficiënte manier afspraken van één patiënt binnen dezelfde afdeling of binnen meerdere afdelingen zoveel mogelijk te combineren op één dag. Een alternatief voor het reduceren van het aantal ziekenhuisbezoeken zou zijn om (deels) een inloopsysteem voor diagnostische faciliteiten te creëren. Daarbij is onderzoek nodig om te bepalen in welke situatie de voordelen opwegen tegen het nadeel van meer onvoorspelbaarheid in het aankomstproces van patiënten.
S.3.5 Praktische implicaties
Kwantitatieve beslissingsondersteuning is noodzakelijk voor ziekenhuizen
Een ziekenhuis is een erg complexe omgeving met vele interacties tussen patiënt-groepen en ziekenhuisprocessen. Bovendien treden veel soorten fluctuaties op die het lastig maken om het effect te voorspellen van een potentiële oplossing om de toegankelijkheid van het ziekenhuis te verbeteren. Dit proefschrift laat zien dat kwantitatieve methoden zoals wachtrijtheorie en computersimulatie erg geschikt zijn om het effect van een potentiële oplossing te kwantificeren voordat deze oplossing in de praktijk wordt geïmplementeerd. De toepassing van kwantitatieve methoden garandeert bovendien dat de alternatieve oplossingen objectief worden vergeleken. Deze methoden kunnen worden gebruikt om historisch gegroeide capaciteitsverdeling aan te passen en te zorgen dat de capaciteit zo optimaal mogelijk over de betreffende (sub)specialisaties wordt verdeeld. Ook kan worden bepaald of patiëntgroepen die vanuit medisch oogpunt verschillend zijn maar vanuit logistiek oogpunt vergelijkbaar, beter samengevoegd kunnen worden of niet.
Wachtrijtheorie, computersimulatie en regressie-analyse dragen bij aan feitelijk onderbouwde besluitvorming zonder verborgen agenda. Dit verlaagt het risico van ongewenste gevolgen voor patiënten en personeel, alsmede onnodige investeringen. Dit proefschrift toont tevens aan dat de toepassing van kwantitatieve methoden niet beperkt is tot operationele en tactische besluitvorming maar zeker ook waardevol is voor strategische besluitvorming.
Kostenreductie en kwaliteitverbetering sluiten elkaar niet uit
We verwachten dat in de nabije toekomst het doel van procesverbeteringen steeds meer zal verschuiven van kwaliteit en toegankelijkheid richting doelmatigheid. Dit proefschrift laat meerdere voorbeelden zien waarbij deze doelstellingen tegelijkertijd bereikt kunnen worden.
211
SAMENVATTING
De capaciteit van centraal diagnostische faciliteiten zoals de afdeling Endoscopie en de afdeling Radiologie is vaak verdeeld onder vele (sub)specialismen. Door logistiek vergelijkbare patiëntgroepen samen te voegen wordt de efficiency verhoogd. Om de flexibiliteit van de gedeelde faciliteiten nog verder te verhogen zouden capaciteitsreserveringen voor klinische- of zorgpaden zoveel mogelijk vermeden moeten worden. Indien deze reserveringen zelfs met lage toegangstijden nodig blijven, zouden ze gebundeld moeten worden op een specifieke dag en/of gecombineerd moeten worden met de reserveringen voor semi-spoed en spoedpatiënten.
Proactief handelen zorgt voor een betere toegankelijkheid
Ten slotte laat dit proefschrift zien dat proactief in plaatst van reactief handelen een efficiënte manier is om de toegankelijkheid van een ziekenhuis te verbeteren:
Op operationeel niveau. Door accurate voorspellingen van operatieduren te gebruiken kan het management vooraf het risico op overwerk en de kans op een annulering beter voorzien. Indien deze risico’s een vastgestelde grenswaarde overschrijden zou het voorgestelde operatieschema aangepast moeten worden totdat beide risico’s aanvaardbaar zijn.
Op tactisch niveau. Om verschillende redenen fluctueert de capaciteit van processen die door artsen worden uitgevoerd aanzienlijk, in het bijzonder in een academisch ziekenhuis als het AMC. Door meer tactisch management toe te passen kunnen deze fluctuaties verminderd worden wat de toegankelijkheid van het ziekenhuis verbetert zonder investeringen in extra capaciteit.
Op strategisch niveau. Door in de strategische planning ook de gewenste prestaties mee te nemen, kan de vereiste capaciteit tijdig worden bepaald. Bovendien wordt het mogelijk om het effect van verwachte veranderingen in de patiëntmix op toekomstige prestaties te voorspellen zodat noodzakelijke acties tijdig kunnen worden uitgevoerd. Door proactief te handelen kunnen hoge toegangstijden voor poliklinische consulten en diagnostische onderzoeken alsmede hoge wachttijden voor een operatie structureel worden voorkomen.
Dit proefschrift laat zien hoe kwantitatieve beslissingsondersteuning, het verminderen van fluctuaties in ziekenhuisprocessen, het samenvoegen of juist scheiden van patiëntgroepen en het proactief handelen bijdragen aan verbeterde toegankelijkheid door efficiënter gebruik van beschikbare mensen en middelen. Dit stelt ziekenhuizen in staat om de toekomstige uitdagingen het hoofd te bieden en effectief om te gaan met budgetbeperkingen, de verhoogde concurrentie onder ziekenhuizen en de gevolgen van de vergrijzing op zowel de zorgvraag als de beschikbaarheid van medisch personeel.


