“Utilizing” Signal Detection Theory Abstract Keywords
27
“Utilizing” Signal Detection Theory Spencer K. Lynn 1 and Lisa Feldman Barrett 1,2 In press, Psychological Science General Article DOI: 10.1177/0956797614541991 Received 2/19/14; Revision accepted 6/8/14 Manuscript version: 21 July 2014 1 Department of Psychology, Northeastern University, and 2 Department of Psychiatry and the Martinos Center for Biomedical Imaging, Massachusetts General Hospital, Boston, Massachusetts, and Harvard Medical School Corresponding Author: Spencer K. Lynn, Psychology NI-125, Northeastern University, 360 Huntington Ave., Boston, MA 02115. E-mail: [email protected] Abstract What do inferring what a person is thinking or feeling, judging a defendant’s guilt, and navigating a dimly lit room have in common? They involve perceptual uncertainty (e.g., a scowling face might indicate anger or concentration, for which different responses are appropriate) and behavioral risk (e.g., a cost to making the wrong response). Signal detection theory describes these types of decisions. In this tutorial, we show how incorporating the economic concept of utility allows signal detection theory to serve as a model of optimal decision making, going beyond its common use as an analytic method. This utility approach to signal detection theory clarifies otherwise enigmatic influences of perceptual uncertainty on measures of decision-making performance (accuracy and optimality) and on behavior (an inverse relationship between bias magnitude and sensitivity optimizes utility). A “utilized” signal detection theory offers the possibility of expanding the phenomena that can be understood within a decision-making framework. Keywords signal detection theory, utility, perception, decision making
Transcript of “Utilizing” Signal Detection Theory Abstract Keywords
“Utilizing” Signal Detection Theory
Spencer K. Lynn1 and Lisa Feldman Barrett1,2
In press, Psychological Science General Article DOI: 10.1177/0956797614541991 Received 2/19/14; Revision accepted 6/8/14 Manuscript version: 21 July 2014 1Department of Psychology, Northeastern University, and 2Department of Psychiatry and the Martinos Center for Biomedical Imaging, Massachusetts General Hospital, Boston, Massachusetts, and Harvard Medical School Corresponding Author: Spencer K. Lynn, Psychology NI-125, Northeastern University, 360 Huntington Ave., Boston, MA 02115. E-mail: [email protected] Abstract
What do inferring what a person is thinking or feeling, judging a defendant’s guilt, and navigating a dimly lit room have in common? They involve perceptual uncertainty (e.g., a scowling face might indicate anger or concentration, for which different responses are appropriate) and behavioral risk (e.g., a cost to making the wrong response). Signal detection theory describes these types of decisions. In this tutorial, we show how incorporating the economic concept of utility allows signal detection theory to serve as a model of optimal decision making, going beyond its common use as an analytic method. This utility approach to signal detection theory clarifies otherwise enigmatic influences of perceptual uncertainty on measures of decision-making performance (accuracy and optimality) and on behavior (an inverse relationship between bias magnitude and sensitivity optimizes utility). A “utilized” signal detection theory offers the possibility of expanding the phenomena that can be understood within a decision-making framework.
Keywords
signal detection theory, utility, perception, decision making
2
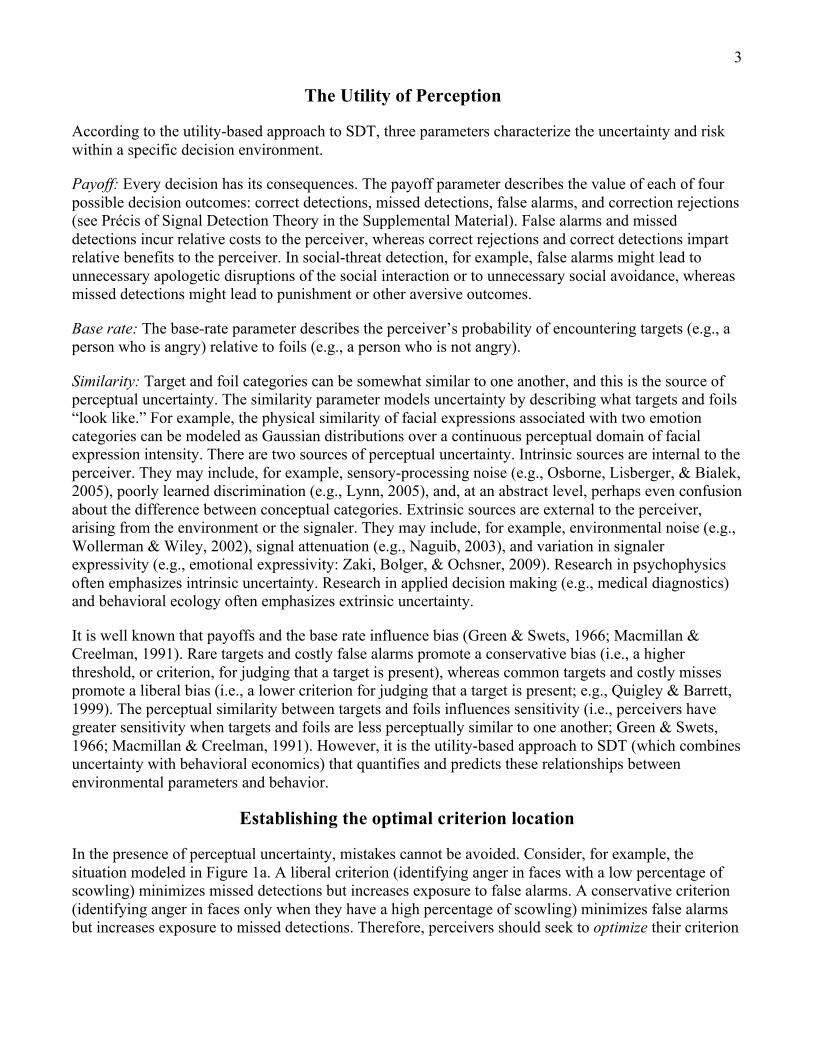
The goal of this tutorial is to familiarize readers with aspects of signal detection theory (SDT; Green & Swets, 1966; Macmillan & Creelman, 1991) that stem from using it as a model of optimal decision making. SDT characterizes how perceivers separate meaningful information from “noise.” It is widely used to measure performance on perception, memory, and categorization tasks. In the realm of social perception, for example, when interacting with someone, it is advantageous to know whether the person is angry (and likely means you harm) or not. Signals such as the person’s facial expression inform this judgment. SDT is particularly useful in situations of uncertainty and risk. Uncertainty is present when the alternative options are perceptually similar to one another (e.g., a scowling facial expression sometimes means that the person is angry and sometimes means that the person is merely concentrating). Risk is present when misclassification carries some relative cost (e.g., when failing to correctly identify someone as angry incurs punishment that would otherwise have been avoided).1
Overview of SDT
SDT’s power as an analytic tool comes from separating a perceiver’s behavior into two underlying components, sensitivity and bias (see Précis of Signal Detection Theory in the Supplemental Material available online). Sensitivity is the perceiver’s ability to discriminate alternatives: targets (e.g., a person who is angry) versus foils (e.g., a person who is not angry). Response bias is the perceiver’s propensity to categorize stimuli as targets rather than foils and is described as liberal, neutral, or conservative. For example, if failing to correctly identify threat is relatively costly (resulting in, say, psychological or physical punishment), or if targets are common relative to foils, then a perceiver might treat equivocal stimuli as threatening targets rather than safe foils (a liberal bias, in which even mildly scowling faces are treated as angry). If, instead, incorrectly identifying a stimulus as a threat is relatively costly (resulting in, say, embarrassment arising from a misperceived need to apologize), or if targets are uncommon relative to foils, then a perceiver might treat equivocal stimuli as safe (a conservative bias, in which only strongly scowling faces are treated as angry).
SDT is applicable across a spectrum from perceptual to conceptual domains. In fact, a diverse array of nonpsychophysical “perceptions” have been treated as involving issues of signal detection. The SDT framework has been used to examine eyewitnesses’ identification of suspects (Clark, 2012), decisions to place children in foster homes (Ruscio, 1998), memory (Wixted & Stretch, 2004), cancer detection (Abbey, Eckstein, & Boone, 2009), statistical hypothesis testing (Green & Swets, 1966), and diagnostic decisions more generally (Swets, Dawes, & Monahan, 2000). Here, we use social-threat detection as an example to illustrate our points (see the Supplemental Material for additional examples across the perceptual-conceptual spectrum: interoception, social perception, jury deliberation, and navigation speed).
Despite SDT’s breadth of application, it is largely used in a descriptive way to compare sensitivity and bias across study conditions or people. For example, in a previous study, people with current depression exhibited decreased sensitivity for emotion perception, and people with remitted depression exhibited increased sensitivity and more neutral response bias for emotion perception, relative to control groups (Anderson et al., 2011). Yet SDT has much more to offer as a generative model of decision making. Combining SDT’s treatment of perceptual uncertainty with the behavioral-economic concept of utility (the net benefit expected to accrue from a series of decisions) highlights important aspects of decision making overlooked both by typical applications of SDT and by traditional models of decision making that focus on utility alone.
3
The Utility of Perception
According to the utility-based approach to SDT, three parameters characterize the uncertainty and risk within a specific decision environment.
Payoff: Every decision has its consequences. The payoff parameter describes the value of each of four possible decision outcomes: correct detections, missed detections, false alarms, and correction rejections (see Précis of Signal Detection Theory in the Supplemental Material). False alarms and missed detections incur relative costs to the perceiver, whereas correct rejections and correct detections impart relative benefits to the perceiver. In social-threat detection, for example, false alarms might lead to unnecessary apologetic disruptions of the social interaction or to unnecessary social avoidance, whereas missed detections might lead to punishment or other aversive outcomes.
Base rate: The base-rate parameter describes the perceiver’s probability of encountering targets (e.g., a person who is angry) relative to foils (e.g., a person who is not angry).
Similarity: Target and foil categories can be somewhat similar to one another, and this is the source of perceptual uncertainty. The similarity parameter models uncertainty by describing what targets and foils “look like.” For example, the physical similarity of facial expressions associated with two emotion categories can be modeled as Gaussian distributions over a continuous perceptual domain of facial expression intensity. There are two sources of perceptual uncertainty. Intrinsic sources are internal to the perceiver. They may include, for example, sensory-processing noise (e.g., Osborne, Lisberger, & Bialek, 2005), poorly learned discrimination (e.g., Lynn, 2005), and, at an abstract level, perhaps even confusion about the difference between conceptual categories. Extrinsic sources are external to the perceiver, arising from the environment or the signaler. They may include, for example, environmental noise (e.g., Wollerman & Wiley, 2002), signal attenuation (e.g., Naguib, 2003), and variation in signaler expressivity (e.g., emotional expressivity: Zaki, Bolger, & Ochsner, 2009). Research in psychophysics often emphasizes intrinsic uncertainty. Research in applied decision making (e.g., medical diagnostics) and behavioral ecology often emphasizes extrinsic uncertainty.
It is well known that payoffs and the base rate influence bias (Green & Swets, 1966; Macmillan & Creelman, 1991). Rare targets and costly false alarms promote a conservative bias (i.e., a higher threshold, or criterion, for judging that a target is present), whereas common targets and costly misses promote a liberal bias (i.e., a lower criterion for judging that a target is present; e.g., Quigley & Barrett, 1999). The perceptual similarity between targets and foils influences sensitivity (i.e., perceivers have greater sensitivity when targets and foils are less perceptually similar to one another; Green & Swets, 1966; Macmillan & Creelman, 1991). However, it is the utility-based approach to SDT (which combines uncertainty with behavioral economics) that quantifies and predicts these relationships between environmental parameters and behavior.
Establishing the optimal criterion location
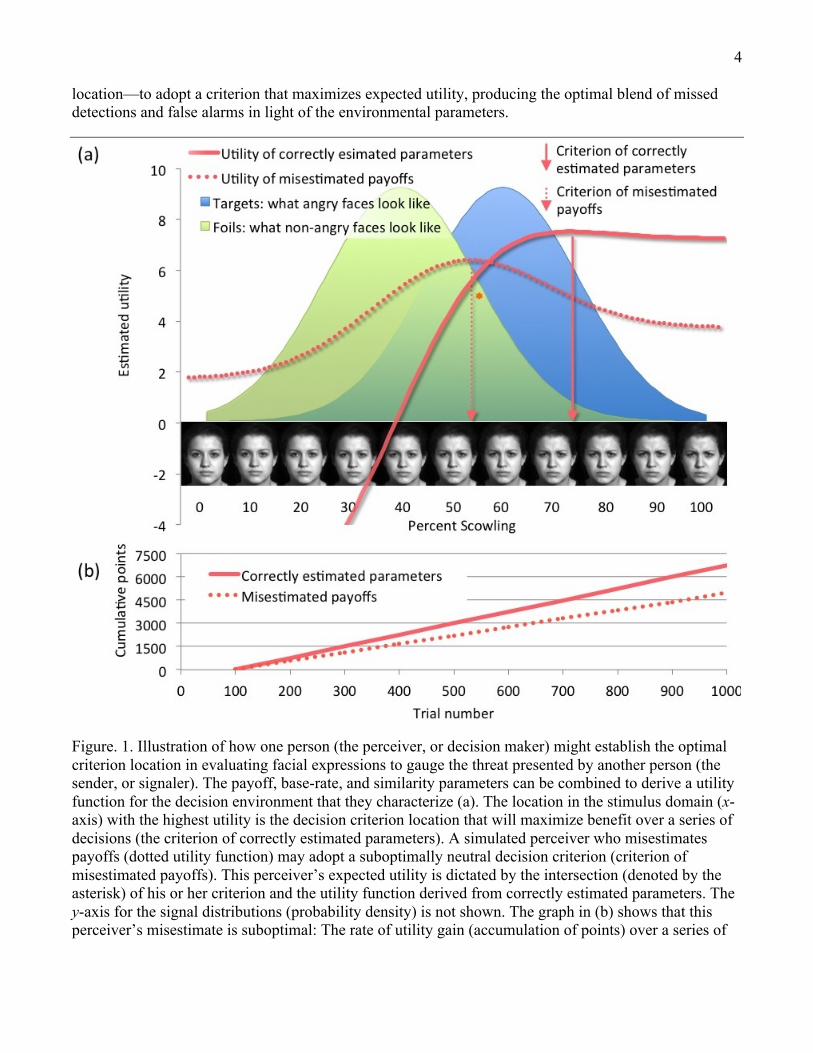
In the presence of perceptual uncertainty, mistakes cannot be avoided. Consider, for example, the situation modeled in Figure 1a. A liberal criterion (identifying anger in faces with a low percentage of scowling) minimizes missed detections but increases exposure to false alarms. A conservative criterion (identifying anger in faces only when they have a high percentage of scowling) minimizes false alarms but increases exposure to missed detections. Therefore, perceivers should seek to optimize their criterion
4
location—to adopt a criterion that maximizes expected utility, producing the optimal blend of missed detections and false alarms in light of the environmental parameters.
Figure. 1. Illustration of how one person (the perceiver, or decision maker) might establish the optimal criterion location in evaluating facial expressions to gauge the threat presented by another person (the sender, or signaler). The payoff, base-rate, and similarity parameters can be combined to derive a utility function for the decision environment that they characterize (a). The location in the stimulus domain (x-axis) with the highest utility is the decision criterion location that will maximize benefit over a series of decisions (the criterion of correctly estimated parameters). A simulated perceiver who misestimates payoffs (dotted utility function) may adopt a suboptimally neutral decision criterion (criterion of misestimated payoffs). This perceiver’s expected utility is dictated by the intersection (denoted by the asterisk) of his or her criterion and the utility function derived from correctly estimated parameters. The y-axis for the signal distributions (probability density) is not shown. The graph in (b) shows that this perceiver’s misestimate is suboptimal: The rate of utility gain (accumulation of points) over a series of
5
trials is shallower than would have been the case if all the parameters had been estimated correctly. Parameter values for these models are provided in the Supplemental Material.
The SDT utility function uses the payoff, base-rate, and similarity parameters to calculate the expected value (to the perceiver) of placing a decision criterion at any given location in the perceptual domain (see The Signal Utility Estimator and Receiver Operating Characteristics, in the Supplemental Material). For example, it is possible to compute the expected utility of placing a decision criterion at each facial expression along the continuum in Figure 1a. The criterion location with the highest expected utility will maximize net benefit over a series of decisions. By modeling the environmental parameters that underlie bias and sensitivity, one can mathematically predict perceivers’ optimality within environments or experimental conditions of a study or empirically compare perceivers’ optimality across environments or experimental conditions.
To implement these ideas within an experiment in a laboratory setting, one can create different decision environments by assigning values to the three parameters (see Lynn, Cnaani, & Papaj, 2005, for an example with nonhumans; see Lynn, Zhang, & Barrett, 2012, for an example with humans). Payoffs can be implemented behaviorally. For example, participants can earn or lose points depending on the outcome of each trial. In this way, it is possible to set unequal payoff outcomes (e.g., a missed detection and a false alarm might have different costs in a particular context). Outside the laboratory, payoffs may not be known or easily quantified, of course. In such cases, a ratio of payoffs might be used. For example, Clark (2012) explored the utility of eyewitness-lineup reforms using a 10:1 ratio of the cost of missed detections (the perpetrator goes free) to false alarms (the wrong person is identified as the perpetrator). Base rate can be implemented as the proportion of targets to foils shown. The base rate can model, for example, the fact that some people with whom a perceiver interacts may be angry more often than other people. The similarity parameter can be implemented with targets and foils randomly drawn from their respective distributions imposed on a continuum of stimuli.
Because criterion location is a function of the three environmental parameters, suboptimal bias or sensitivity in a perceiver can be understood as a perceiver’s “misestimate” of one or more parameters, which can result in suboptimal decisions (Fig. 1b). Individual differences, alone or in interaction with the decision environment, may influence parameter estimates (see Estimating Perceivers' Parameter Values in the Supplemental Material; Lynn et al., 2012).
The application of utility to SDT is not new—it was part of the theory’s initial development in psychophysics (Green & Swets, 1966; Tanner & Swets, 1954). Nonetheless, a “utilized” SDT—which incorporates the notion that perceivers attempt to maximize net benefit while operating under perceptual uncertainty2—generates a number of unexpected but important theoretical observations that have yet to be widely explored in the psychological literature. One surprising observation is that there are contexts in which maximizing accuracy conflicts with maximizing utility, so that there are common situations in which accuracy should be sacrificed to achieve effective decision making. This conflict has implications for the use of accuracy as a measure of performance. A second surprising observation is that there is a functional relationship between bias and sensitivity: Within a perceiver, the optimal criterion location is not independent of sensitivity. Probably the most widely appreciated insight of SDT is its separation of sensitivity and bias as factors explaining behavior (Swets, Tanner, & Birdsall, 1961), and many users believe that these two parameters are orthogonal, or independent of one another. This relationship between sensitivity and bias has implications for interpreting differences in sensitivity and bias among perceivers or different contexts.
6
Measuring Behavior: Optimal Is Better Than Accurate
One clear tenet of SDT is that estimates of accuracy (i.e., the proportion of trials garnering correct response) should be abandoned in favor of estimates of bias and sensitivity as measures of performance when feasible (Macmillan & Creelman, 1991). There are two reasons to avoid accuracy. First, accuracy does not account for two aspects of decision making under uncertainty and risk that are important for a full understanding of the perceiver’s behavior: Accuracy confounds the effects of sensitivity and bias on performance, and this is true whether one applies a utility framework to SDT or not. Second, the inadequacy of accuracy is compounded under economic risk, when payoffs should optimally bias behavior, because accuracy is the simple tally of correct and incorrect decisions without regard to their actual benefits and costs.
Accuracy confounds sensitivity and bias
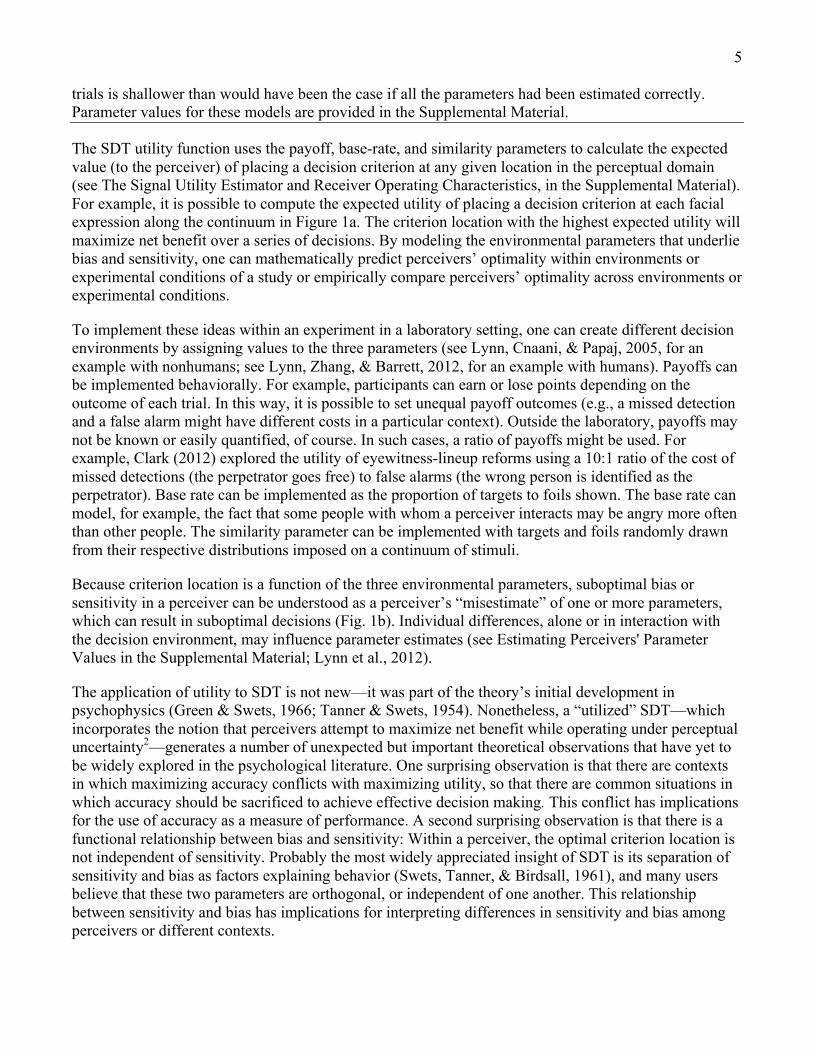
Accuracy is not a good indicator of what people are doing; it does not describe their behavior. This is because accuracy is blind to the separate contributions of sensitivity and bias to decision making. Although this fact is well known, it is less appreciated that multiple combinations of sensitivity and bias values produce the same accuracy (Fig. 2). The overt behaviors that yield a given accuracy level may encompass dramatic extremes of liberal and conservative bias. Consequently, the researcher analyzing accuracy rather than optimality will pool participants who are potentially behaving quite differently from one another (Lynn, Hoge, Fischer, Barrett, & Simon, in press).
Figure 2. Illustration showing that multiple combinations of sensitivity and response bias produce the same accuracy. For example, the iso-accuracy gradients in this simulated neutral-bias environment show that at moderate sensitivity (d! = 2), both liberal bias (c = −0.5) and conservative bias (c = 0.5) can produce accuracy near .8. Parameter values for this model are provided in the Supplemental Material.
7
Accuracy is blind to payoffs but not base rate
When benefits and costs differ, accuracy is not a good indicator of how well people are doing; it is an inadequate measure of their performance. Accuracy is blind to the influences of benefits and costs on decision making (Egan, 1975; Maddox & Bohil, 2005) because it is determined without regard to the value the perceiver accrues for those decisions. This means that maximizing accuracy and maximizing utility can be at odds with one another in environments in which bias is due to payoffs. However, because accuracy is derived from the proportions of correct and incorrect responses, it is congruent with utility in environments in which bias is due to the base rate.
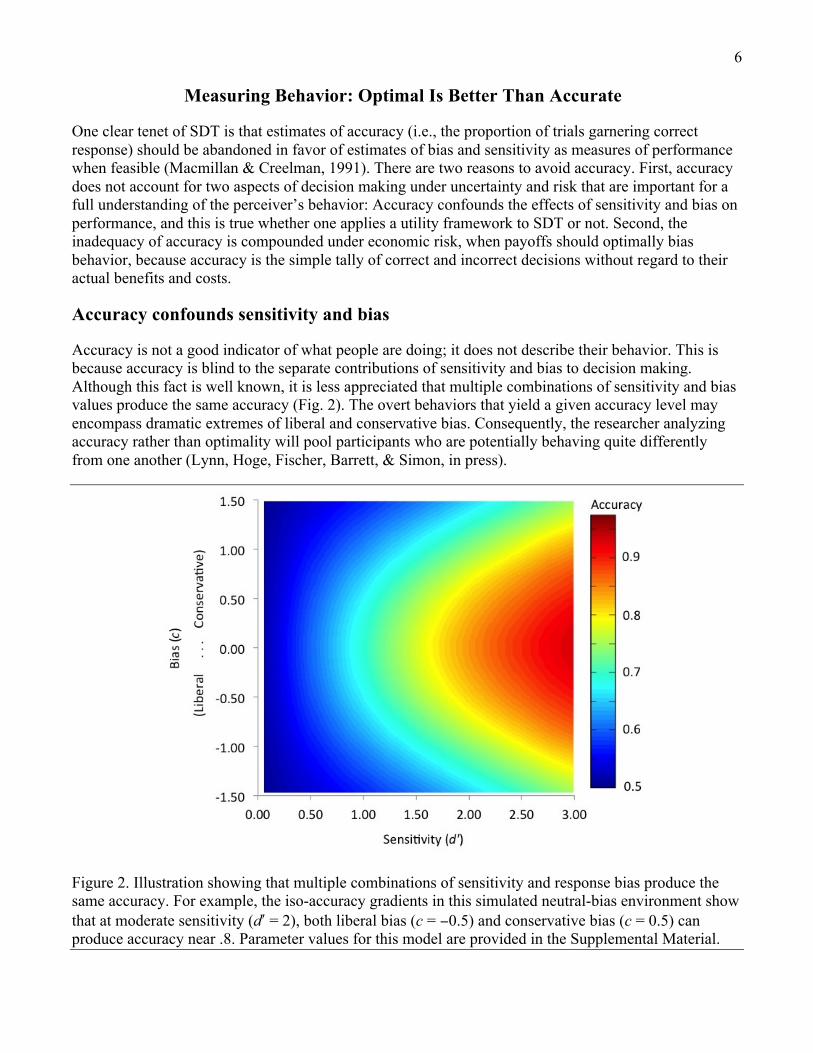
A comparison of simulated environments with different sources of bias exemplifies these points (Table 1). When payoffs alone bias behavior (the payoff environment, in which false alarms are relatively costly but the base rate is balanced at .5), accuracy is highest when bias equals 0 (neutral bias). Nevertheless, utility is maximized when bias equals 0.4 (i.e., a somewhat conservative bias). Utility at the criterion that maximizes accuracy is 7.1 points, less than the maximum utility possible, 7.5 points. Accuracy at the criterion that maximizes utility is .82, less than the maximum accuracy possible, .84. Perceivers with bias of 0 will achieve lower maximum utility over a series of decisions than will those with bias of 0.4, despite exhibiting higher accuracy. When the base rate alone biases behavior (the base-rate environment, in which benefits and costs cancel each other out but the base rate is .3), the amount of bias that maximizes accuracy also maximizes utility (again at bias = 0.4). For comparison, Table 1 also contains results for neutral and base-rate-and-payoff environments. When benefits and costs differ, then, optimally biased decision making will yield lower accuracy than unbiased decision making, despite its greater utility. Consequently, accuracy cannot properly describe performance in environments in which there is risk due to payoffs.
Table&1.&Expected&Accuracy,&Criterion&Locations,&Bias,&and&Utility&in&Four&Simulated&Decision&Environments.&Measure! Type&of&decision&environment&
Neutral& Base&rate& Base&rate&and&payoff& Payoff&Maximum&accuracy& .84& .86& .86& .84&Criterion&location&that&maximizes&accuracy&& 50.0& 50.4& 50.4& 50.0&Bias&that&maximizes&accuracy& 0.0& 0.4& 0.4& 0.0&Utility&at&the&criterion&location&that&maximizes&accuracy& 6.8& 7.2& 7.7& 7.1&Maximum&utility& 6.8& 7.2& 8.0& 7.5&Criterion&location&that&maximizes&utility& 50.0& 50.4& 50.8& 50.4&Bias&that&maximizes&utility& 0.0& 0.4& 0.8& 0.4&Accuracy&at&the&criterion&location&that&maximizes&utility& .84& .86& .85& .82&Note:&Values&for&expected&accuracy,&criterion&location&(percentage&of&range),&bias&(c),&and&utility&(points&accrued)&were&derived&by&applying&each&environment’s¶meters&to&the&utility&function&in&signal&detection&theory.&The¶meter&values&for&the&neutral&environment&are&as&follows:&correct&detections&and&correct&rejections&=&10&points;&missed&detections&and&false&alarms&=&−10&points;&base&rate&=&.5;&and&means&of&target&and&foil&signal&distributions&=&60%&and&40%&of&the&perceptual&domain’s&range,&respectively,&with&standard&deviation&=&10%&for&both&distributions.&The&baseYrate&environment&is&identical&to&the&neutral&environment&except&that&the&base&rate&is&reduced&to&.3.&The&payoff&environment&is&identical&to&the&neutral&environment&except&that&false&alarms&are&more&costly&(−15&points)&and&missed&detections&less&costly&(−1&point).&The&baseYrateYandYpayoff&environment&combines&the&base&rate&and&payoffs&from&the&baseYrate&and&payoff&environments,&respectively;&the&similarity¶meter&values&are&the&same&as&in&the&neutral&environment.&
8
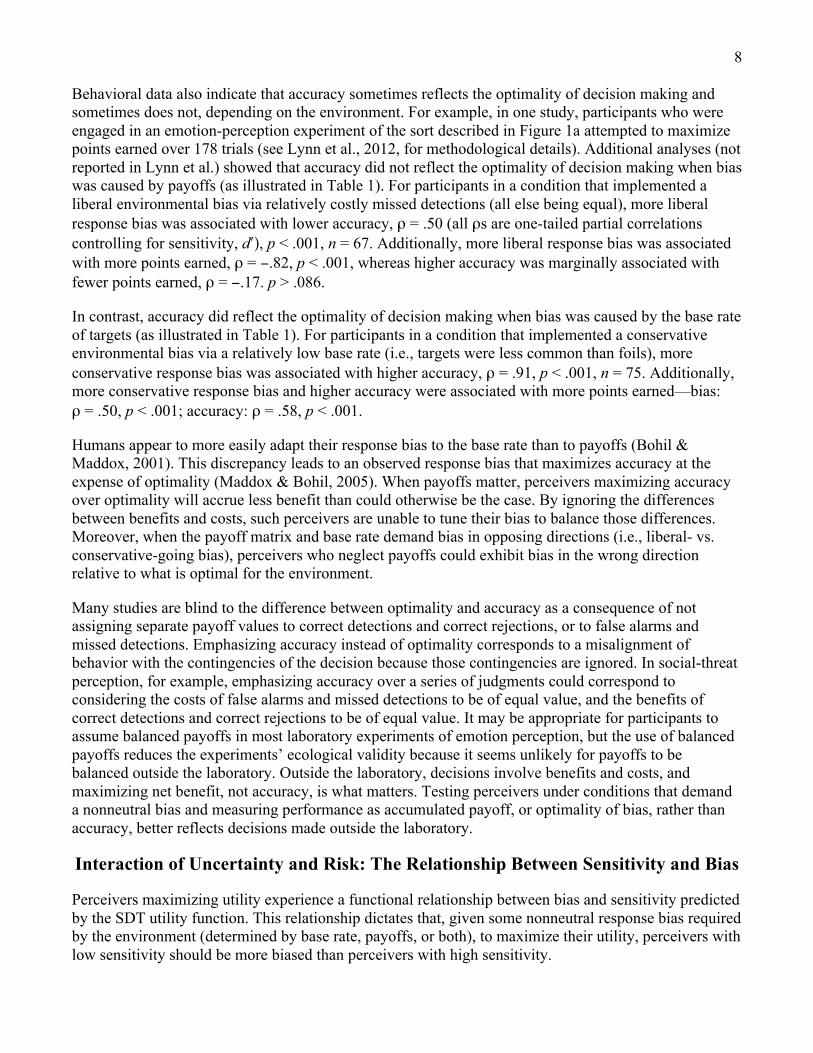
Behavioral data also indicate that accuracy sometimes reflects the optimality of decision making and sometimes does not, depending on the environment. For example, in one study, participants who were engaged in an emotion-perception experiment of the sort described in Figure 1a attempted to maximize points earned over 178 trials (see Lynn et al., 2012, for methodological details). Additional analyses (not reported in Lynn et al.) showed that accuracy did not reflect the optimality of decision making when bias was caused by payoffs (as illustrated in Table 1). For participants in a condition that implemented a liberal environmental bias via relatively costly missed detections (all else being equal), more liberal response bias was associated with lower accuracy, ρ = .50 (all ρs are one-tailed partial correlations controlling for sensitivity, d!), p < .001, n = 67. Additionally, more liberal response bias was associated with more points earned, ρ = −.82, p < .001, whereas higher accuracy was marginally associated with fewer points earned, ρ = −.17. p > .086.
In contrast, accuracy did reflect the optimality of decision making when bias was caused by the base rate of targets (as illustrated in Table 1). For participants in a condition that implemented a conservative environmental bias via a relatively low base rate (i.e., targets were less common than foils), more conservative response bias was associated with higher accuracy, ρ = .91, p < .001, n = 75. Additionally, more conservative response bias and higher accuracy were associated with more points earned—bias: ρ = .50, p < .001; accuracy: ρ = .58, p < .001.
Humans appear to more easily adapt their response bias to the base rate than to payoffs (Bohil & Maddox, 2001). This discrepancy leads to an observed response bias that maximizes accuracy at the expense of optimality (Maddox & Bohil, 2005). When payoffs matter, perceivers maximizing accuracy over optimality will accrue less benefit than could otherwise be the case. By ignoring the differences between benefits and costs, such perceivers are unable to tune their bias to balance those differences. Moreover, when the payoff matrix and base rate demand bias in opposing directions (i.e., liberal- vs. conservative-going bias), perceivers who neglect payoffs could exhibit bias in the wrong direction relative to what is optimal for the environment.
Many studies are blind to the difference between optimality and accuracy as a consequence of not assigning separate payoff values to correct detections and correct rejections, or to false alarms and missed detections. Emphasizing accuracy instead of optimality corresponds to a misalignment of behavior with the contingencies of the decision because those contingencies are ignored. In social-threat perception, for example, emphasizing accuracy over a series of judgments could correspond to considering the costs of false alarms and missed detections to be of equal value, and the benefits of correct detections and correct rejections to be of equal value. It may be appropriate for participants to assume balanced payoffs in most laboratory experiments of emotion perception, but the use of balanced payoffs reduces the experiments’ ecological validity because it seems unlikely for payoffs to be balanced outside the laboratory. Outside the laboratory, decisions involve benefits and costs, and maximizing net benefit, not accuracy, is what matters. Testing perceivers under conditions that demand a nonneutral bias and measuring performance as accumulated payoff, or optimality of bias, rather than accuracy, better reflects decisions made outside the laboratory.
Interaction of Uncertainty and Risk: The Relationship Between Sensitivity and Bias
Perceivers maximizing utility experience a functional relationship between bias and sensitivity predicted by the SDT utility function. This relationship dictates that, given some nonneutral response bias required by the environment (determined by base rate, payoffs, or both), to maximize their utility, perceivers with low sensitivity should be more biased than perceivers with high sensitivity.
9
To get an intuitive feel for this relationship, consider walking through an obstacle-strewn room as a signal detection issue (this example is further developed in the Supplemental Material). Why do people navigate space more cautiously in conditions of poor visibility than in conditions of good visibility? A missed detection (say, stepping barefoot on an object) is costly (it is painful to the perceiver and may break the object). When the room is well lit, a person can walk quickly through the room. When the room is dimly lit, the person walks more cautiously, reducing the frequency of missed detections that would otherwise occur. This increased caution corresponds to a change in bias. What about the environment has changed to cause this change in bias? The benefits and costs of correct and incorrect judgments about the presence or absence of obstacles in the person’s path have not changed, nor has the base rate of encountering obstacles. Only the perceptual similarity between targets and foils has changed: Obstacles and clear space look more similar in the dark, which reduces the person’s sensitivity to discriminate obstacles against the background. In this example, a decrease in sensitivity leads to a more liberal bias, which produces a change in response: Decreased walking speed results in fewer missed detections and more false alarms.
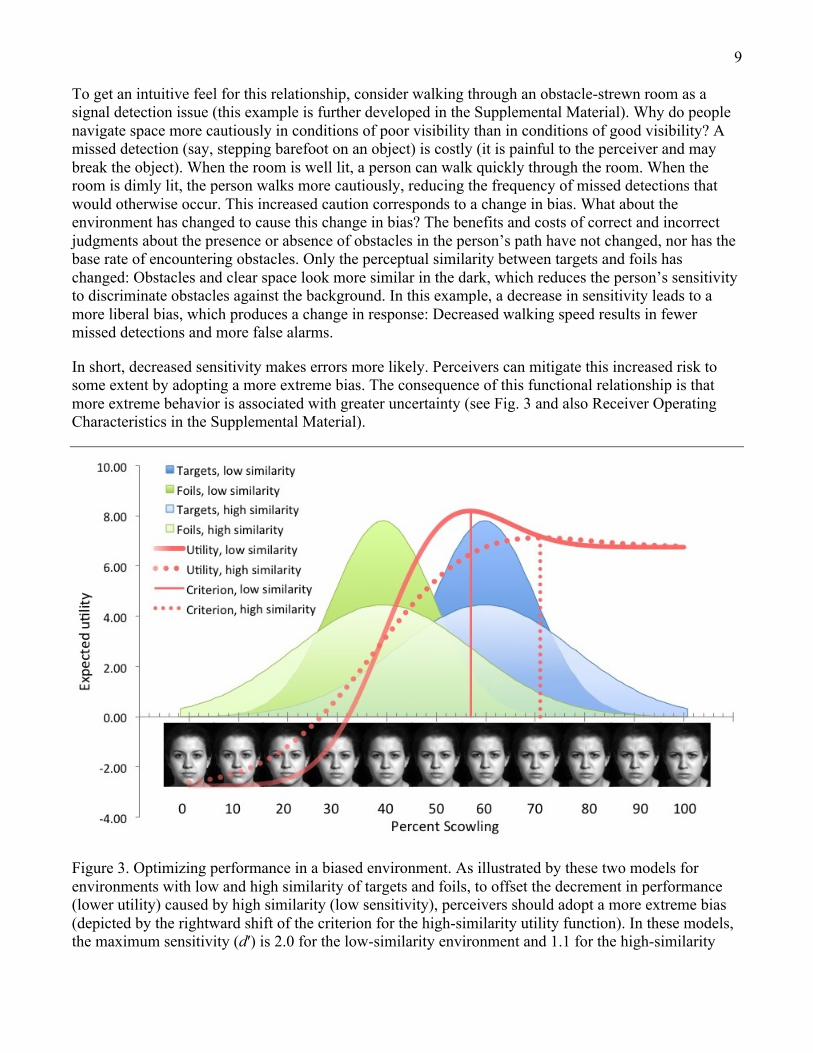
In short, decreased sensitivity makes errors more likely. Perceivers can mitigate this increased risk to some extent by adopting a more extreme bias. The consequence of this functional relationship is that more extreme behavior is associated with greater uncertainty (see Fig. 3 and also Receiver Operating Characteristics in the Supplemental Material).
Figure 3. Optimizing performance in a biased environment. As illustrated by these two models for environments with low and high similarity of targets and foils, to offset the decrement in performance (lower utility) caused by high similarity (low sensitivity), perceivers should adopt a more extreme bias (depicted by the rightward shift of the criterion for the high-similarity utility function). In these models, the maximum sensitivity (d′) is 2.0 for the low-similarity environment and 1.1 for the high-similarity
10
environment. Given these levels of sensitivity, the amount of bias (c) that will optimize a perceiver’s decisions is 0.7 for the low-similarity environment and 1.2 for the high-similarity environment. Note that bias as measured by the ratio of target to foil likelihood at the criterion (β) is 4.0 in both models and does not explicitly reflect the difference in behavior. Parameter values for these models are provided in the Supplemental Material.
The line of optimal response
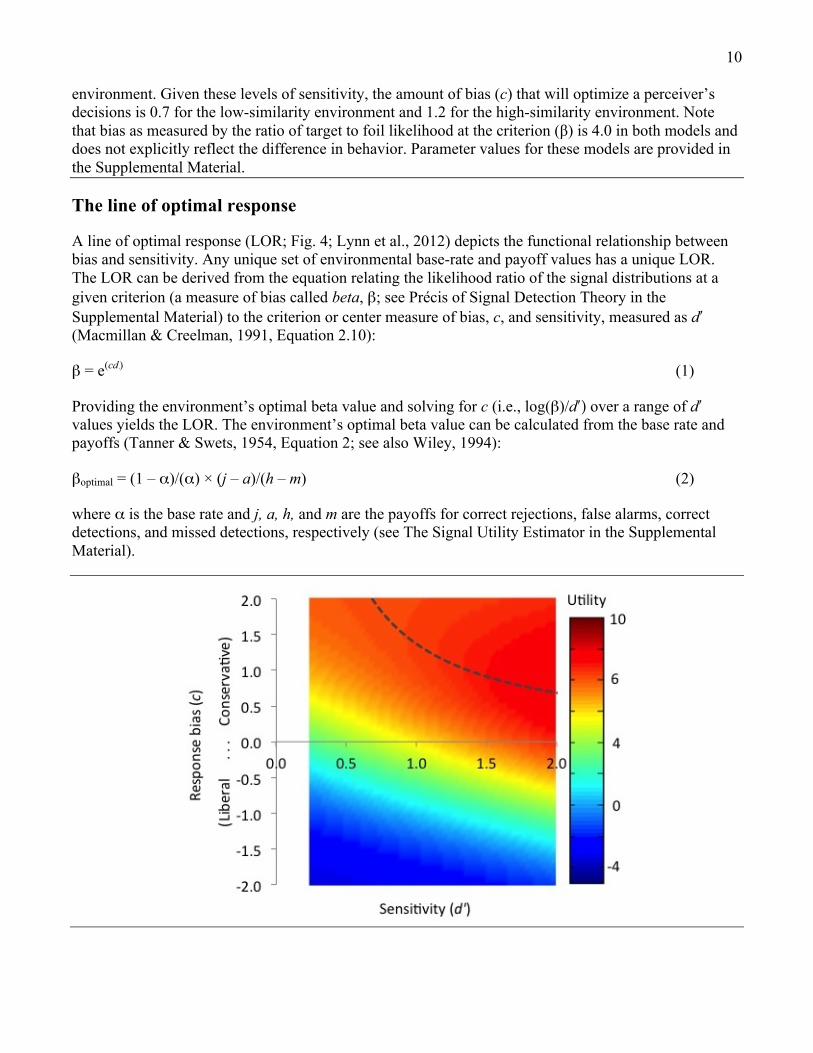
A line of optimal response (LOR; Fig. 4; Lynn et al., 2012) depicts the functional relationship between bias and sensitivity. Any unique set of environmental base-rate and payoff values has a unique LOR. The LOR can be derived from the equation relating the likelihood ratio of the signal distributions at a given criterion (a measure of bias called beta, β; see Précis of Signal Detection Theory in the Supplemental Material) to the criterion or center measure of bias, c, and sensitivity, measured as d! (Macmillan & Creelman, 1991, Equation 2.10):
β = e(cd!) (1)
Providing the environment’s optimal beta value and solving for c (i.e., log(β)/d!) over a range of d! values yields the LOR. The environment’s optimal beta value can be calculated from the base rate and payoffs (Tanner & Swets, 1954, Equation 2; see also Wiley, 1994):
βoptimal = (1 – α)/(α) × (j – a)/(h – m) (2)
where α is the base rate and j, a, h, and m are the payoffs for correct rejections, false alarms, correct detections, and missed detections, respectively (see The Signal Utility Estimator in the Supplemental Material).
11
Figure 4. Illustration of the relationship between bias and sensitivity according to the utility approach to signal detection theory. Mathematical modeling shows that for the utility of perceptual decisions to be maximized, a perceiver’s sensitivity and response-bias magnitude should be inversely related. A line of optimal response (LOR; dashed line) is defined by the bias that yields maximum utility for any given level of sensitivity, for constant base-rate and payoff values. The nonzero slope of the LOR indicates that the decrease in utility that results from reduced sensitivity can be mitigated by increased magnitude of bias (here, a more conservative-going bias). Parameter values for this model are provided in the Supplemental Material.
The value of βoptimal is constant for all sensitivity values; it is set by the environmental payoffs and base rate, and is not a function of sensitivity. By Equation 1, which defines beta in terms of c and d!, c must change with sensitivity if beta is constant. Although there is a literature examining beta (e.g., Snodgrass & Corwin, 1988; Wood, 1976), we have chosen to focus on how c changes with sensitivity (Stretch & Wixted, 1998). Focusing on the lability of c, rather than the stability of beta, emphasizes how perceivers’ behavior—which stimuli they categorize as targets and which as foils—should differ between environments that differ in target-foil similarity or among individuals who differ in sensitivity (e.g., in the high- and low-similarity environments of Fig. 3, β does not change, but c does).
We interpret the distance from the point defined by a perceiver’s observed sensitivity and bias (d!, c) to the LOR as a measure of how well the perceiver is able to adjust his or her bias to optimally accommodate his or her level of sensitivity. We have elected to measure distance to the LOR as euclidean distance rather than vertical distance, as a means of accounting for the unknown bivariate error distribution in the estimates of sensitivity and bias (Lynn et al., 2012).
Sensitivity as a source of bias
Surprisingly, this functional relationship means that low sensitivity can prompt extreme bias, just as the payoff and base-rate parameters can. As a consequence, bias can change solely from a difference in the perceived similarity of targets and foils, without any changes in the parameters commonly understood to drive bias (i.e., base rate and payoffs).3 In studies that have found response bias (c) to be inversely associated with perceptual sensitivity (d!), the associations have sometimes been explained as methodological or measurement artifact (e.g., See, Warm, Dember, & Howe, 1997; Snodgrass & Corwin, 1988). However, when sensitivity and bias magnitude (measured as either c or the criterion’s location in the perceptual domain) vary inversely between conditions, low sensitivity should be considered as a possible explanation for extreme bias.
Recognizing a functional relationship between sensitivity and bias is critical because it has the potential to reverse researchers’ conclusions about differences in bias that are observed whenever signal detection issues occur (i.e., decisions involving category uncertainty and costly miscategorization). For example, under the assumption that bias is functionally independent of sensitivity, perceivers exhibiting poor sensitivity combined with extreme bias (relative to a control group) would be considered to exhibit two separate impairments in decision making: poor sensitivity and extreme bias. For decision making to be optimal, however, bias magnitude should vary inversely with sensitivity, particularly at low sensitivity. According to the utility-based account, therefore, more extreme bias may reflect not an impairment but a normal adaptive mechanism that offsets the single impairment, poor sensitivity. Conversely, under the independence assumption, perceivers exhibiting poor sensitivity with no difference in bias (relative to more sensitive individuals) would be considered to exhibit a single impairment, in sensitivity. In fact,
12
such individuals may have a dual impairment: poor sensitivity coupled with failure to calibrate their bias to their poor sensitivity.
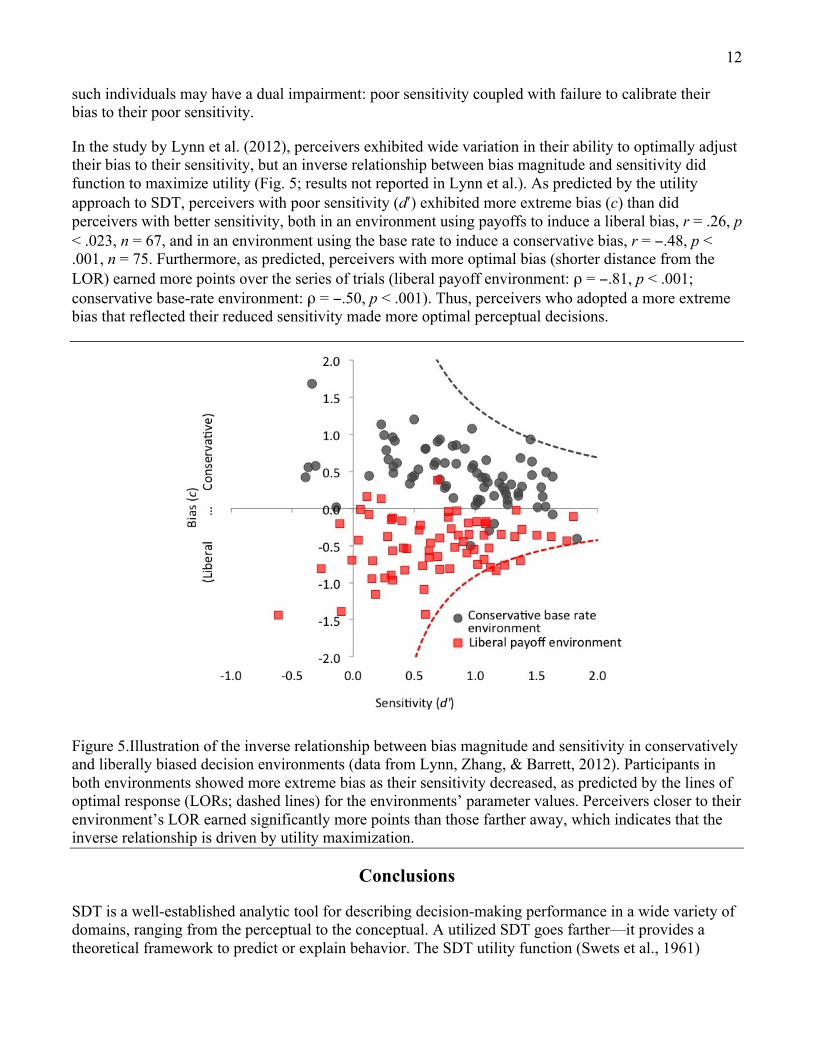
In the study by Lynn et al. (2012), perceivers exhibited wide variation in their ability to optimally adjust their bias to their sensitivity, but an inverse relationship between bias magnitude and sensitivity did function to maximize utility (Fig. 5; results not reported in Lynn et al.). As predicted by the utility approach to SDT, perceivers with poor sensitivity (d!) exhibited more extreme bias (c) than did perceivers with better sensitivity, both in an environment using payoffs to induce a liberal bias, r = .26, p < .023, n = 67, and in an environment using the base rate to induce a conservative bias, r = −.48, p < .001, n = 75. Furthermore, as predicted, perceivers with more optimal bias (shorter distance from the LOR) earned more points over the series of trials (liberal payoff environment: ρ = −.81, p < .001; conservative base-rate environment: ρ = −.50, p < .001). Thus, perceivers who adopted a more extreme bias that reflected their reduced sensitivity made more optimal perceptual decisions.
Figure 5.Illustration of the inverse relationship between bias magnitude and sensitivity in conservatively and liberally biased decision environments (data from Lynn, Zhang, & Barrett, 2012). Participants in both environments showed more extreme bias as their sensitivity decreased, as predicted by the lines of optimal response (LORs; dashed lines) for the environments’ parameter values. Perceivers closer to their environment’s LOR earned significantly more points than those farther away, which indicates that the inverse relationship is driven by utility maximization.
Conclusions
SDT is a well-established analytic tool for describing decision-making performance in a wide variety of domains, ranging from the perceptual to the conceptual. A utilized SDT goes farther—it provides a theoretical framework to predict or explain behavior. The SDT utility function (Swets et al., 1961)
13
makes SDT a predictive tool by modeling the perceptual uncertainty and behavioral risk that are inherent to many decisions both inside and outside the laboratory. The model can be used to generate novel experimental questions about computational processes underlying bias and sensitivity and functional decision making (e.g., see Affective Calibration in Mental Illness in the Supplemental Material).
Understanding decision making and criterion placement as dependent on perceivers’ subjective estimates of parameters that characterize the environment has exciting ramifications. First, designing experiments to manipulate the payoff, base-rate, and similarity parameters, and measuring the optimality of decision making, will provide a more mechanistic approach to understanding the factors that underlie perceivers’ bias and sensitivity. Examining how perceivers make decisions in biased conditions will yield better understanding of decision making because biased environments are more realistic than those that are typically implemented in cognitive and perceptual experiments, in which payoffs are unspecified and the base rate is balanced across alternatives.
Second, adopting SDT as a theoretical model of decision making offers a path by which behavioral-economic and neuroeconomic studies of judgment and decision making can investigate the influence of uncertainty. Examining perceivers operating under uncertainty would reflect decision making in more realistic environments than are typically employed in judgment and decision-making tasks that manipulate economic risk—variation in payoffs—but ignore signal-borne risk—variation in what options look like.
Sensitivity to the three signal parameters is taxonomically widespread, exhibited by vertebrates and arthropods (e.g., Lynn, 2010). Model-driven approaches (Glimcher & Rustichini, 2004; Gold & Shadlen, 2007; Redish, 2004; Redish, Jensen, & Johnson, 2008) in which these three parameters are systematically manipulated may thus permit a broadly comparative investigation of how decision making is accomplished across levels of biological organization and complexity.
Author Contributions
S. K. Lynn developed the tutorial and drafted the manuscript. L. F. Barrett provided critical revisions. Both authors approved the final version of the manuscript for submission.
Acknowledgments
We thank Eric Anderson, Jennifer Fugate, and David Levari for helpful feedback during the development of the manuscript.
Declaration of Conflicting Interests
The authors declared that they had no conflicts of interest with respect to their authorship or the publication of this article.
Funding
Preparation of this manuscript was supported by the National Institutes of Health (Grant R01MH093394 to S. K. Lynn, Grant DP1OD003312 to L. F. Barrett) and the U.S. Army Research Institute for the Behavioral and Social Sciences (Contract W5J9CQ-12-C-0028 to S. K. Lynn, Contract W91WAW-08-
14
C-0018 to L. F. Barrett). The views, opinions, and findings contained in this article are those of the authors and should not be construed as an official National Institutes of Health or Department of the Army position, policy, or decision, unless so designated by other documents.
Supplemental Material
Additional supporting information may be found at http://pss.sagepub.com/content/by/supplemental-data
Notes
1. These definitions of uncertainty and risk differ somewhat from those used in the literature on economic decision making, where commonly risk is defined as knowable variation in the value (payoff) of a decision’s outcome and uncertainty as unknowable variation in that value (e.g., see the review by Volz & Gigerenzer, 2012).
2. It is perceptual uncertainty, modeled by the similarity parameter, that distinguishes SDT from other models of decision making. Other models of decision making attempt to account for how decisions are influenced by variability in benefits and costs accrued from correct or incorrect decisions, by variability in the probability of alternative choices or events, and by variability in factors internal to the decision maker that affect risk sensitivity, singly or in combination (e.g., see reviews in Krebs & Kacelnik, 1991; McNamara, Houston, & Collins, 2001). Game-theoretic approaches to decision making additionally account for the effect of other individuals’ responses on the decision maker’s own behavior (e.g., Grafen, 1991). Yet these models ignore that a perceiver’s expectations of the payoff to be accrued, the probabilities of alternative choices, the responses of others, and even the perceiver’s own body state (e.g., homeostatic and metabolic response) are based on signals emitted by the resources, game partners, body, and so forth. SDT posits that these signals themselves have variation.
3. Sensitivity and bias independently characterize decision making: A perceiver’s ability to distinguish targets from foils is conceptually separate from his or her estimate of the payoffs and base rate. Additionally, the measures d! and c are estimated with statistical independence from one another (Dusoir, 1975; Macmillan & Creelman, 1990; See, Warm, Dember, & Howe, 1997; Snodgrass & Corwin, 1988). Nonetheless, these notions of conceptual and statistical independence have inadvertently influenced assumptions about functional independence, such that there exists a misconception that a perceiver’s observed bias should be independent of his or her observed sensitivity. The utility approach to SDT shows instead that a perceiver’s observed bias and sensitivity are functionally related by the goal of maximizing utility.
15
References
Abbey, C. K., Eckstein, M. P., & Boone, J. M. (2009). An equivalent relative utility metric for evaluating screening mammography. Medical Decision Making, 30, 113–122.
Anderson, I. M., Shippen, C., Juhasz, G., Chase, D., Thomas, E., Downey, D., . . . Deakin, J. F. W. (2011). State-dependent alteration in face emotion recognition in depression. British Journal of Psychiatry, 198, 302–308.
Bohil, C., & Maddox, W. (2001). Category discriminability, base-rate, and payoff effects in perceptual categorization. Attention, Perception, & Psychophysics, 63, 361–376.
Clark, S. E. (2012). Costs and benefits of eyewitness identification reform: Psychological science and public policy. Perspectives on Psychological Science, 7, 238–259.
Dusoir, A. (1975). Treatments of bias in detection and recognition models: A review. Perception & Psychophysics, 17, 167–178.
Egan, J. P. (1975). Signal detection theory and ROC analysis. New York, NY: Academic Press. Glimcher, P. W., & Rustichini, A. (2004). Neuroeconomics: The consilience of brain and decision.
Science, 306, 447–452. Gold, J. I., & Shadlen, M. N. (2007). The neural basis of decision making. Annual Review of
Neuroscience, 30, 535–574. Grafen, A. (1991). Modelling in behavioural ecology. In J. R. Krebs & N. B. Davies (Eds.), Behavioural
ecology: An evolutionary approach (3rd ed., pp. 5–31). Oxford, England: Blackwell Scientific. Green, D. M., & Swets, J. A. (1966). Signal detection theory and psychophysics. New York, NY: Wiley. Krebs, J. R., & Kacelnik, A. (1991). Decision-making. In J. R. Krebs & N. B. Davies (Eds.),
Behavioural ecology: An evolutionary approach (3rd ed., pp. 105–136). Oxford, England: Blackwell Scientific.
Lynn, S. K. (2005). Learning to avoid aposematic prey. Animal Behaviour, 70, 1221–1226. Lynn, S. K. (2010). Decision-making and learning: The peak shift behavioral response. In M. Breed & J.
Moore (Eds.), Encyclopedia of animal behavior (Vol. 1, pp. 470–475). Oxford, England: Academic Press.
Lynn, S. K., Cnaani, J., & Papaj, D. R. (2005). Peak shift discrimination learning as a mechanism of signal evolution. Evolution, 59, 1300–1305.
Lynn, S. K., Hoge, E. A., Fischer, L. E., Barrett, L. F., & Simon, N. M. (in press). Gender differences in oxytocin-associated disruption of decision bias during emotion perception. Psychiatry Research.
Lynn, S. K., Zhang, X., & Barrett, L. F. (2012). Affective state influences perception by affecting decision parameters underlying bias and sensitivity. Emotion, 12, 726–736.
Macmillan, N. A., & Creelman, C. D. (1990). Response bias: Characteristics of detection theory, threshold theory, and “nonparametric” indexes. Psychological Bulletin, 107, 401–413.
Macmillan, N. A., & Creelman, C. D. (1991). Detection theory: A user’s guide. New York, NY: Cambridge University Press.
Maddox, W. T., & Bohil, C. (2005). Optimal classifier feedback improves cost-benefit but not base-rate decision criterion learning in perceptual categorization. Memory & Cognition, 33, 303–319.
McNamara, J. M., Houston, A. I., & Collins, E. J. (2001). Optimality models in behavioral biology. SIAM Review, 43, 413–466.
Naguib, M. (2003). Reverberation of rapid and slow trills: Implications for signal adaptations to long-range communication. The Journal of the Acoustical Society of America, 113, 1749–1756.
Osborne, L. C., Lisberger, S. G., & Bialek, W. (2005). A sensory source for motor variation. Nature, 437, 412–416.
16
Quigley, K. S., & Barrett, L. F. (1999). Emotional learning and mechanisms of intentional psychological change. In J. Brandtstadter & R. M. Lerner (Eds.), Action and development: Origins and functions of intentional self-development (pp. 435–464). Thousand Oaks, CA: Sage.
Redish, A. D. (2004). Addiction as a computational process gone awry. Science, 306, 1944–1947. Redish, A. D., Jensen, S., & Johnson, A. (2008). A unified framework for addiction: Vulnerabilities in
the decision process. Behavioral & Brain Sciences, 31, 415–437. Ruscio, J. (1998). Information integration in child welfare cases: An introduction to statistical decision
making. Child Maltreatment, 3, 143–156. See, J. E., Warm, J. S., Dember, W. N., & Howe, S. R. (1997). Vigilance and signal detection theory:
An empirical evaluation of five measures of response bias. Human Factors: The Journal of the Human Factors and Ergonomics Society, 39, 14–29.
Snodgrass, J. G., & Corwin, J. (1988). Pragmatics of measuring recognition memory: Applications to dementia and amnesia. Journal of Experimental Psychology: General, 117, 34–50.
Stretch, V., & Wixted, J. T. (1998). Decision rules for recognition memory confidence judgments. Journal of Experimental Psychology: Learning, Memory, and Cognition, 24, 1397–1410.
Swets, J. A., Dawes, R. M., & Monahan, J. (2000). Psychological science can improve diagnostic decisions. Psychological Science in the Public Interest, 1(1).
Swets, J. A., Tanner, W. P., Jr., & Birdsall, T. G. (1961). Decision processes in perception. Psychological Review, 68, 301–340.
Tanner, W. P., Jr., & Swets, J. A. (1954). A decision-making theory of visual detection. Psychological Review, 61, 401–409.
Volz, K. G., & Gigerenzer, G. (2012). Cognitive processes in decisions under risk are not the same as in decisions under uncertainty. Frontiers in Neuroscience, 6, Article 105. Retrieved from http://journal.frontiersin.org/Journal/10.3389/fnins.2012.00105/full
Wiley, R. H. (1994). Errors, exaggeration, and deception in animal communication. In L. A. Real (Ed.), Behavioral mechanisms in evolutionary ecology (pp. 157–189). Chicago, IL: University of Chicago Press.
Wixted, J., & Stretch, V. (2004). In defense of the signal detection interpretation of remember/know judgments. Psychonomic Bulletin & Review, 11, 616–641.
Wollerman, L., & Wiley, R. H. (2002). Background noise from a natural chorus alters female discrimination of male calls in a Neotropical frog. Animal Behaviour, 63, 15–22.
Wood, C. C. (1976). Discriminability, response bias, and phoneme categories in discrimination of voice onset time. The Journal of the Acoustical Society of America, 60, 1381–1389.
Zaki, J., Bolger, N., & Ochsner, K. (2009). Unpacking the informational bases of empathic accuracy. Emotion, 9, 478–487.
SUPPLEMENTAL*MATERIAL*!
"Utilizing" Signal Detection Theory Spencer K. Lynn and Lisa Feldman Barrett
Northeastern University !
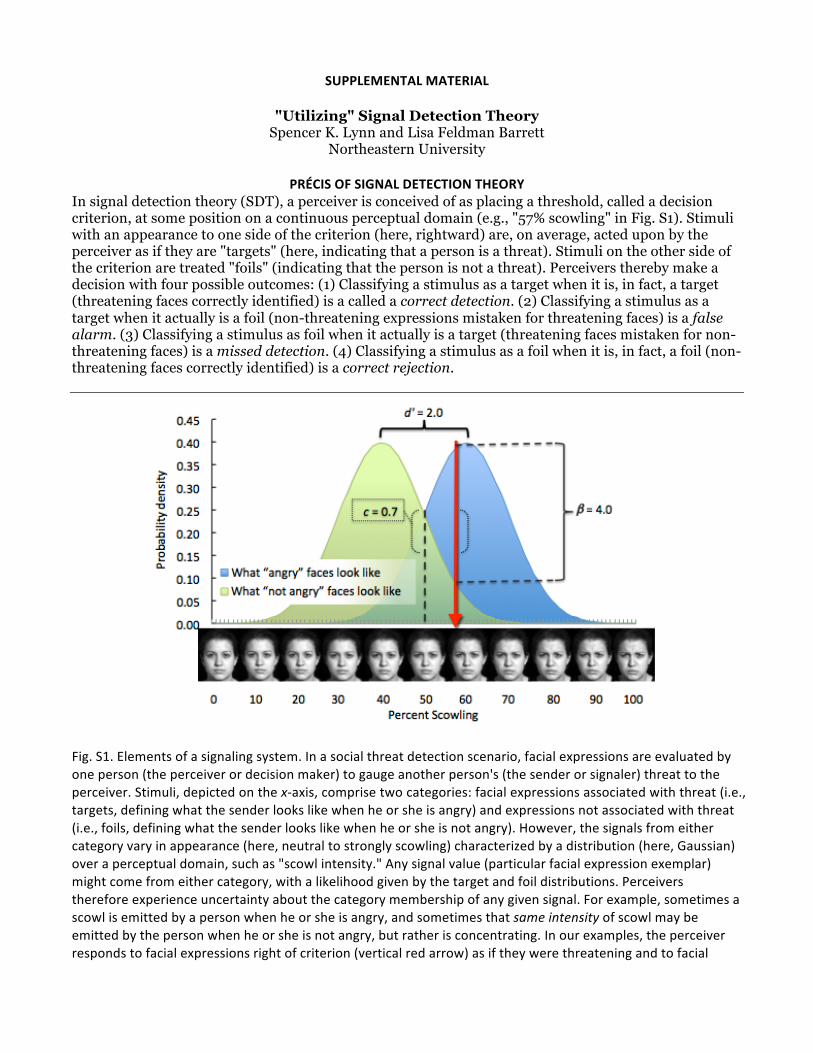
PRÉCIS*OF*SIGNAL*DETECTION*THEORY*In signal detection theory (SDT), a perceiver is conceived of as placing a threshold, called a decision criterion, at some position on a continuous perceptual domain (e.g., "57% scowling" in Fig. S1). Stimuli with an appearance to one side of the criterion (here, rightward) are, on average, acted upon by the perceiver as if they are "targets" (here, indicating that a person is a threat). Stimuli on the other side of the criterion are treated "foils" (indicating that the person is not a threat). Perceivers thereby make a decision with four possible outcomes: (1) Classifying a stimulus as a target when it is, in fact, a target (threatening faces correctly identified) is a called a correct detection. (2) Classifying a stimulus as a target when it actually is a foil (non-threatening expressions mistaken for threatening faces) is a false alarm. (3) Classifying a stimulus as foil when it actually is a target (threatening faces mistaken for non-threatening faces) is a missed detection. (4) Classifying a stimulus as a foil when it is, in fact, a foil (non-threatening faces correctly identified) is a correct rejection.
!
Fig.!S1.!Elements!of!a!signaling!system.!In!a!social!threat!detection!scenario,!facial!expressions!are!evaluated!by!
one!person!(the!perceiver!or!decision!maker)!to!gauge!another!person's!(the!sender!or!signaler)!threat!to!the!
perceiver.!Stimuli,!depicted!on!the!xBaxis,!comprise!two!categories:!facial!expressions!associated!with!threat!(i.e.,!
targets,!defining!what!the!sender!looks!like!when!he!or!she!is!angry)!and!expressions!not!associated!with!threat!
(i.e.,!foils,!defining!what!the!sender!looks!like!when!he!or!she!is!not!angry).!However,!the!signals!from!either!
category!vary!in!appearance!(here,!neutral!to!strongly!scowling)!characterized!by!a!distribution!(here,!Gaussian)!
over!a!perceptual!domain,!such!as!"scowl!intensity."!Any!signal!value!(particular!facial!expression!exemplar)!
might!come!from!either!category,!with!a!likelihood!given!by!the!target!and!foil!distributions.!Perceivers!
therefore!experience!uncertainty!about!the!category!membership!of!any!given!signal.!For!example,!sometimes!a!
scowl!is!emitted!by!a!person!when!he!or!she!is!angry,!and!sometimes!that!same&intensity!of!scowl!may!be!
emitted!by!the!person!when!he!or!she!is!not!angry,!but!rather!is!concentrating.!In!our!examples,!the!perceiver!
responds!to!facial!expressions!right!of!criterion!(vertical!red!arrow)!as!if!they!were!threatening!and!to!facial!
Lynn!&!Barrett,!"Utilizing"!Signal!Detection!Theory,!Supplemental!Material!!
2!
expressions!left!of!criterion!as!if!they!were!safe.!Measures!of!sensitivity!(e.g.,!d')!characterize!overlap!of!the!target!and!foil!distributions,!which!corresponds!to!perceptual!uncertainty.!Measures!of!bias!(e.g.,!c&and&β)!characterize!the!decision!criterion's!location!on!the!perceptual!domain.!c,!for!"criterion,"!represents!the!distance!(in!units!of!standard!deviation)!from!the!decision!criterion's!location!on!the!xBaxis!to!the!"crossBover!point"!of!the!signal!distributions!(vertical!dashed!line).!β, beta,!represents!the!ratio!of!target:foil!likelihood!(horizontal!dashed!lines)!at!the!decision!criterion!location.!!
Measures of sensitivity and bias (Fig. S1 and main text) are derived from the numbers of correct detections and false alarms committed over a series of decisions. For "yes/no" decisions such as the examples in this tutorial, these measures can be calculated from observed frequencies of correct detections (CDs), missed detections (MDs), false alarms (FAs) and correct rejections (CRs): d'=z(CDs/(CDs+MDs))-z(FAs/(FAs+CRs)) (S1) c=-0.5*(z(CDs/(CDs+MDs))+z(FAs/(FAs+CRs))) (S2) where z is the inverse of the normal cumulative distribution function (Macmillan & Creelman, 1991). The formula for beta is given as Equation 1 of the main text. See Macmillan & Creelman (1991) for adjustments to these formulae for other experimental designs, such as 2-alternative forced-choice. Measures of sensitivity are estimates of perceptual uncertainty. Measures of bias are estimates of criterion location. The combination of sensitivity and bias determine overt behavior–a perceiver might correctly withdraw from a person who means harm, unnecessarily disrupt the social interaction to a false alarm, fail to take appropriate defensive action during a misdetection, or appropriately affiliate during a correct rejection. Uncertainty causes the perceiver to make mistakes no matter what criterion is adopted; missed detections cannot be reduced without increasing false alarms. We view the unidimentional nature of the perceptual domain as an heuristic. On a conceptual level, the unidimentional domain is considered a "degree-of-evidence" variable: the likelihood that a signal is a target relative to a foil, whatever its sensory dimension(s) might be (Swets, 1998). As a physical stimulus measurement, a single dimension may be realistic in some applications (e.g., visual contrast). In other applications a single dimension may be highly salient to the decision (e.g., facial expression intensity is salient to mental state attribution). In still other applications, multiple or complex dimensions (e.g., guilt vs. innocence) might be reasoned about heuristically on a single conceptual dimension. When multiple dimensions are known and measurable, multi-dimensional extensions to SDT may be applied (Ashby, 2000; Bohil, Szalma, & Hancock, In press). Another alternative is to reduce dimensionality via statistical techniques such as principal component analysis, as implemented in computational models of perception (e.g., Edelman & Intrator, 1997). Applied solutions to dimensionality reduction have used multidimensional scaling to determine relevant perceptual dimensions, followed by discriminant function analysis to derive a single mathematical dimension that best separates the categories over the multiple perceptual dimensions (Getty, Pickett, D'Orsi, & Swets, 1988). The discriminant function can then be used as a computational aid in decision making (Getty et al., 1988; Swets, 1998). It is common to use or assume normal, bell-shaped (Gaussian) signal distributions (probability density functions defined by means and standard deviations) to characterize targets and foils. Nonetheless, the central tenets of SDT apply to any distribution shape (e.g., Egan, 1975; Wiley, 1994; Bradbury & Vehrencamp, 1998).
EXAMPLE*APPLICATIONS*OF*SDT*SDT is applicable across a spectrum of perceptual to conceptual domains. Although SDT is most well known for application to exteroceptive perception, on the perceptual end of the spectrum, SDT is applicable to phenomena that extend beyond the exteroceptive five senses. For example, interoception, a person's perception of sensations from the internal environment of his or her body (e.g., Critchley & Harrison, 2013) involves decisions about whether or not the sensations are normal or are symptoms
Lynn!&!Barrett,!"Utilizing"!Signal!Detection!Theory,!Supplemental!Material!!
3!
indicative of illness and should be reported to a physician. Someone experiencing tightness in the chest must decide, for example, if the sensation is due to temporary anxiety or heart attack. The cost of a false alarm might include unnecessary worry and doctor visits, whereas the cost of a missed detection would include progression of serious illness. The base rate represents the probability that the interoceptive percept is a target, a feeling indicating an illness that would benefit from medical attention, vs. a foil, a feeling that does not stem from such illness. The signal distributions of the similarity parameter might vary over a domain characterized as "degree of abnormality" in the perceiver's bodily feelings, mood, or perceptual experience. On the conceptual end of the spectrum, jurors, for example, must discriminate incriminating from exculpatory evidence to decide a defendant's guilt or innocence. Here, the "perceptual" domain might comprise an abstract domain of what evidence of guilt vs. innocence "looks like," where "looks like" can be considered a metaphoric shorthand for probative value. The cost of a false alarm is conviction of the innocent, whereas the cost of a missed detection is the guilty evading justice. The base rate represents the proportion of cases that go to trial in which the defendant is, in fact, guilty. The signal distributions of the similarity parameter represent what evidence "looks like" when a person is guilty (targets) vs. innocent (foils). Jury deliberation exemplifies a signal detection issue in which the costs are not borne by the perceiver (i.e., the jury) directly, but by other elements of a larger "perceptual" system of which the jury is a representative part. Here, society and the defendant accrue the payoffs. Some decisions are a blend of perceptual and conceptual components. Emotion perception, such as the social threat perception example used throughout the main text, is both perceptual and conceptual. It involves action identification (is the person smiling/scowling) and mental state inference (is the person angry or happy) (Wegner & Vallacher, 1986; Gilbert, 1998; Kozak, Marsh, & Wegner, 2006). SDT can also be applied to decisions that involve continuously variable responses as opposed to dichotomous responses. For example, navigation–moving a body or other object through a space–involves decisions about travel speed, a continuous variable. The decision might be reframed dichotomously, however, as whether or not to accelerate or decelerate relative to some baseline (e.g., current velocity), making it amenable to signal detection theory. The cost of a false alarm might include missed opportunities resulting from overly cautious, slow movement, whereas the cost of a missed detection includes collision with an obstacle. The base rate represents the encounter rate with obstacles. To transform decisions about continuously variable velocity into a dichotomous judgment about whether to increase or decrease velocity, the perceptual domain might be taken to be contrast level of obstacles against the background, with the similarity parameter defined by signal distributions of contrast level that afford deceleration (targets) vs. acceleration (foils). Optimal*is*better*than*accurate*Emphasizing accuracy over a series of judgments, in lieu of optimality, corresponds to misalignment of behavior with the contingencies of the decision because those contingencies are ignored (see Fig. 2 and Table 1 of main text). As in social threat perception (discussed in main text), in interoception, jury deliberation, and navigation, emphasizing accuracy over a series of judgments could correspond to considering the costs of false alarm and missed detection to be of equal value, and the benefits of correct detection and correct rejection to be of equal value. In jury deliberation, for example, emphasizing accuracy could correspond to minimizing the number of missed convictions of the guilty (missed detections) and false imprisonments of the innocent (false alarms), without distinguishing the difference in the costs to society between the two. While a jury's sensitivity (ability to discriminate guilt from innocence) should always be maximized for an individual case, using accuracy as a metric of policy effectiveness would run contrary to the maxims of "innocent until proven guilty" and "beyond reasonable doubt." These principles signify a willingness to tolerate missed convictions of the guilty over false imprisonments of the innocent, embodying a conservative bias (Lillquist, 2002).
Lynn!&!Barrett,!"Utilizing"!Signal!Detection!Theory,!Supplemental!Material!!
4!
In navigating obstacles, for example, some contexts may be liberally biased due to a high cost of missed detection–e.g., collisions between a body or vehicle and an obstacle. Other contexts may be conservatively biased due to a high cost of false alarm–e.g., the time lost by slow travel. Emphasizing accuracy (proportion of obstacles avoided) over a series of movements would ignore the difference in payoffs between contexts. Like accuracy, precision (the proportion of "target" responses given to true targets) is also derived from simple proportions of correct and incorrect responses. Therefore, the arguments here against accuracy also apply to precision. !
Interaction*of*uncertainty*and*risk*For perceivers, the consequence of the functional relationship between sensitivity and bias (Figs. 3 and 4 of main text) is more extreme behavior associated with greater uncertainty. This relationship is described for social threat and navigation in the main text, but can be interpreted for our other examples as well. In interoception, a person with less interoceptive sensitivity (ability to tell real from false "symptoms") might tend towards hypochondriasis or hysteria (a liberal bias to judge interoceptive percepts as abnormal), or stoicism or flat affect (a conservative bias to judge interoceptive percepts as normal) as a result of an inability to discriminate changes in his or her internal milieu. In jury deliberation, evidence that affords greater uncertainty will amplify a juror's bias in judgments of guilt vs. innocence. A juror's beliefs about the base rate of guilty defendants who go to trial and the benefits and costs of correct vs. incorrect judgments will control his or her direction of bias (liberal or conservative).
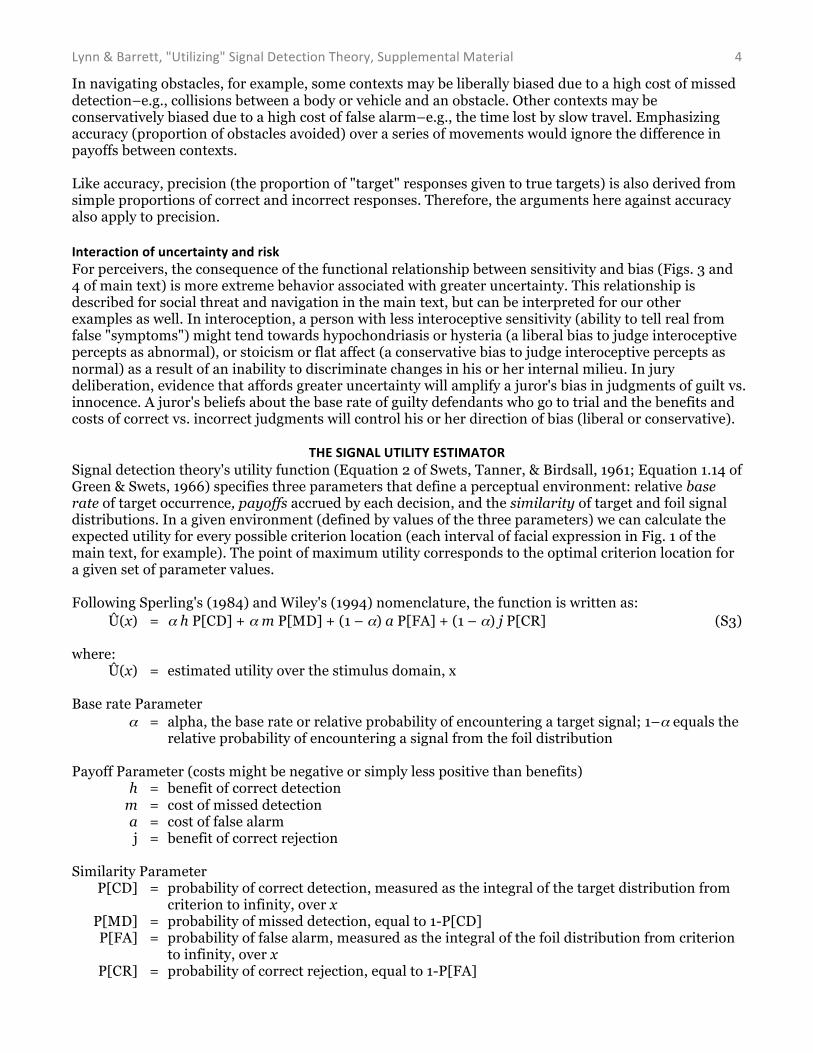
THE*SIGNAL*UTILITY*ESTIMATOR*Signal detection theory's utility function (Equation 2 of Swets, Tanner, & Birdsall, 1961; Equation 1.14 of Green & Swets, 1966) specifies three parameters that define a perceptual environment: relative base rate of target occurrence, payoffs accrued by each decision, and the similarity of target and foil signal distributions. In a given environment (defined by values of the three parameters) we can calculate the expected utility for every possible criterion location (each interval of facial expression in Fig. 1 of the main text, for example). The point of maximum utility corresponds to the optimal criterion location for a given set of parameter values. Following Sperling's (1984) and Wiley's (1994) nomenclature, the function is written as: Û(x) = α h P[CD] + α m P[MD] + (1 – α) a P[FA] + (1 – α) j P[CR] (S3) where: Û(x) = estimated utility over the stimulus domain, x Base rate Parameter α = alpha, the base rate or relative probability of encountering a target signal; 1–α equals the
relative probability of encountering a signal from the foil distribution Payoff Parameter (costs might be negative or simply less positive than benefits) h = benefit of correct detection m = cost of missed detection a = cost of false alarm j = benefit of correct rejection Similarity Parameter P[CD] = probability of correct detection, measured as the integral of the target distribution from
criterion to infinity, over x P[MD] = probability of missed detection, equal to 1-P[CD] P[FA] = probability of false alarm, measured as the integral of the foil distribution from criterion
to infinity, over x P[CR] = probability of correct rejection, equal to 1-P[FA]
Lynn!&!Barrett,!"Utilizing"!Signal!Detection!Theory,!Supplemental!Material!!
5!
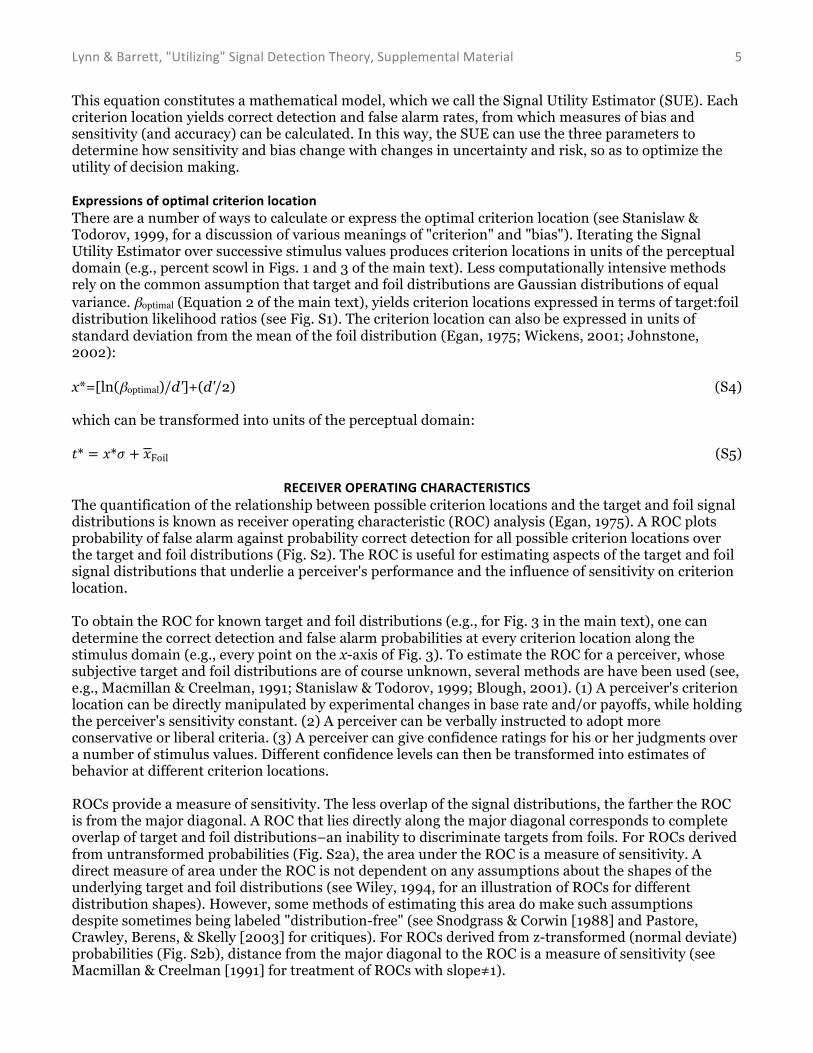
This equation constitutes a mathematical model, which we call the Signal Utility Estimator (SUE). Each criterion location yields correct detection and false alarm rates, from which measures of bias and sensitivity (and accuracy) can be calculated. In this way, the SUE can use the three parameters to determine how sensitivity and bias change with changes in uncertainty and risk, so as to optimize the utility of decision making. Expressions*of*optimal*criterion*location*There are a number of ways to calculate or express the optimal criterion location (see Stanislaw & Todorov, 1999, for a discussion of various meanings of "criterion" and "bias"). Iterating the Signal Utility Estimator over successive stimulus values produces criterion locations in units of the perceptual domain (e.g., percent scowl in Figs. 1 and 3 of the main text). Less computationally intensive methods rely on the common assumption that target and foil distributions are Gaussian distributions of equal variance. βoptimal (Equation 2 of the main text), yields criterion locations expressed in terms of target:foil distribution likelihood ratios (see Fig. S1). The criterion location can also be expressed in units of standard deviation from the mean of the foil distribution (Egan, 1975; Wickens, 2001; Johnstone, 2002): x*=[ln(βoptimal)/d']+(d'/2) (S4) which can be transformed into units of the perceptual domain: !* = !*! + !Foil (S5)
RECEIVER*OPERATING*CHARACTERISTICS*The quantification of the relationship between possible criterion locations and the target and foil signal distributions is known as receiver operating characteristic (ROC) analysis (Egan, 1975). A ROC plots probability of false alarm against probability correct detection for all possible criterion locations over the target and foil distributions (Fig. S2). The ROC is useful for estimating aspects of the target and foil signal distributions that underlie a perceiver's performance and the influence of sensitivity on criterion location. To obtain the ROC for known target and foil distributions (e.g., for Fig. 3 in the main text), one can determine the correct detection and false alarm probabilities at every criterion location along the stimulus domain (e.g., every point on the x-axis of Fig. 3). To estimate the ROC for a perceiver, whose subjective target and foil distributions are of course unknown, several methods are have been used (see, e.g., Macmillan & Creelman, 1991; Stanislaw & Todorov, 1999; Blough, 2001). (1) A perceiver's criterion location can be directly manipulated by experimental changes in base rate and/or payoffs, while holding the perceiver's sensitivity constant. (2) A perceiver can be verbally instructed to adopt more conservative or liberal criteria. (3) A perceiver can give confidence ratings for his or her judgments over a number of stimulus values. Different confidence levels can then be transformed into estimates of behavior at different criterion locations. ROCs provide a measure of sensitivity. The less overlap of the signal distributions, the farther the ROC is from the major diagonal. A ROC that lies directly along the major diagonal corresponds to complete overlap of target and foil distributions–an inability to discriminate targets from foils. For ROCs derived from untransformed probabilities (Fig. S2a), the area under the ROC is a measure of sensitivity. A direct measure of area under the ROC is not dependent on any assumptions about the shapes of the underlying target and foil distributions (see Wiley, 1994, for an illustration of ROCs for different distribution shapes). However, some methods of estimating this area do make such assumptions despite sometimes being labeled "distribution-free" (see Snodgrass & Corwin [1988] and Pastore, Crawley, Berens, & Skelly [2003] for critiques). For ROCs derived from z-transformed (normal deviate) probabilities (Fig. S2b), distance from the major diagonal to the ROC is a measure of sensitivity (see Macmillan & Creelman [1991] for treatment of ROCs with slope≠1).
Lynn!&!Barrett,!"Utilizing"!Signal!Detection!Theory,!Supplemental!Material!!
6!
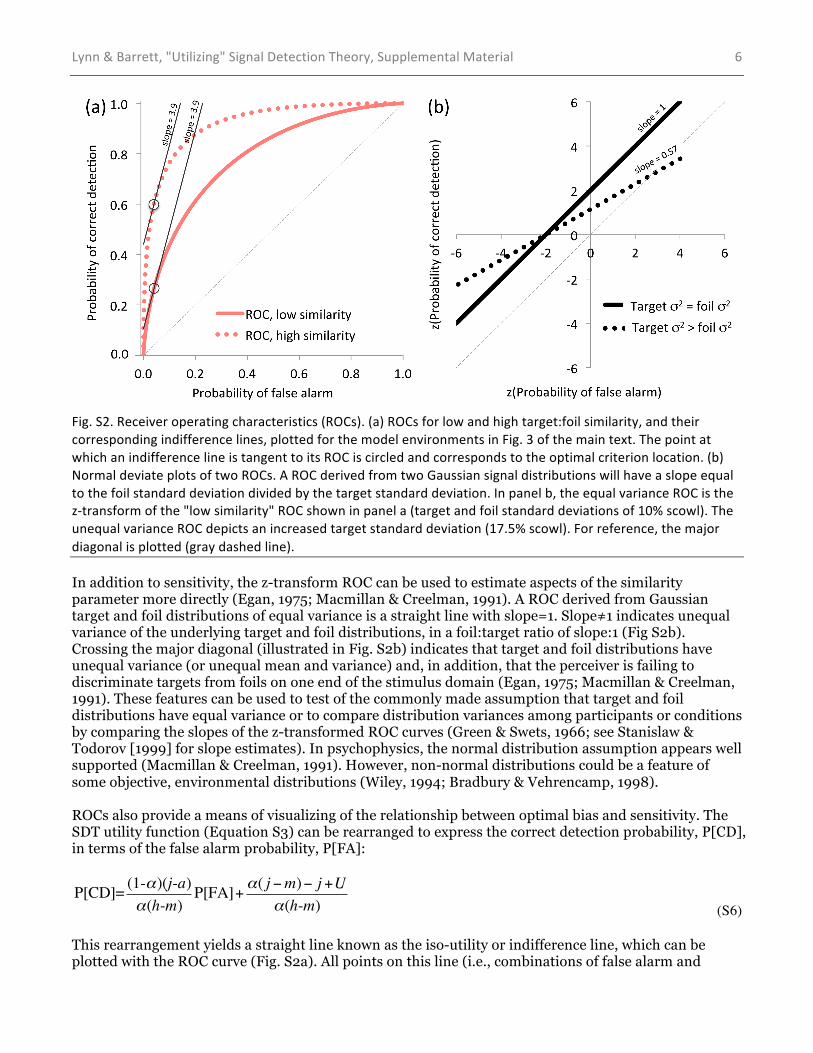
Fig.!S2.!Receiver!operating!characteristics!(ROCs).!(a)!ROCs!for!low!and!high!target:foil!similarity,!and!their!
corresponding!indifference!lines,!plotted!for!the!model!environments!in!Fig.!3!of!the!main!text.!The!point!at!
which!an!indifference!line!is!tangent!to!its!ROC!is!circled!and!corresponds!to!the!optimal!criterion!location.!(b)!
Normal!deviate!plots!of!two!ROCs.!A!ROC!derived!from!two!Gaussian!signal!distributions!will!have!a!slope!equal!
to!the!foil!standard!deviation!divided!by!the!target!standard!deviation.!In!panel!b,!the!equal!variance!ROC!is!the!
zBtransform!of!the!"low!similarity"!ROC!shown!in!panel!a!(target!and!foil!standard!deviations!of!10%!scowl).!The!
unequal!variance!ROC!depicts!an!increased!target!standard!deviation!(17.5%!scowl).!For!reference,!the!major!
diagonal!is!plotted!(gray!dashed!line).!!
In addition to sensitivity, the z-transform ROC can be used to estimate aspects of the similarity parameter more directly (Egan, 1975; Macmillan & Creelman, 1991). A ROC derived from Gaussian target and foil distributions of equal variance is a straight line with slope=1. Slope≠1 indicates unequal variance of the underlying target and foil distributions, in a foil:target ratio of slope:1 (Fig S2b). Crossing the major diagonal (illustrated in Fig. S2b) indicates that target and foil distributions have unequal variance (or unequal mean and variance) and, in addition, that the perceiver is failing to discriminate targets from foils on one end of the stimulus domain (Egan, 1975; Macmillan & Creelman, 1991). These features can be used to test of the commonly made assumption that target and foil distributions have equal variance or to compare distribution variances among participants or conditions by comparing the slopes of the z-transformed ROC curves (Green & Swets, 1966; see Stanislaw & Todorov [1999] for slope estimates). In psychophysics, the normal distribution assumption appears well supported (Macmillan & Creelman, 1991). However, non-normal distributions could be a feature of some objective, environmental distributions (Wiley, 1994; Bradbury & Vehrencamp, 1998). ROCs also provide a means of visualizing of the relationship between optimal bias and sensitivity. The SDT utility function (Equation S3) can be rearranged to express the correct detection probability, P[CD], in terms of the false alarm probability, P[FA]:
P[CD]= (1-α)(j-a)α(h-m)
P[FA]+α( j −m)− j +Uα(h-m) (S6)
This rearrangement yields a straight line known as the iso-utility or indifference line, which can be plotted with the ROC curve (Fig. S2a). All points on this line (i.e., combinations of false alarm and
Lynn!&!Barrett,!"Utilizing"!Signal!Detection!Theory,!Supplemental!Material!!
7!
correct detection probabilities) yield the same expected utility, so a perceiver should be indifferent to (have no preference for) one combination vs. another. However, only points that lie on a perceiver's ROC are attainable by that perceiver. The slope of the indifference line is βoptimal (Equation 2 in the main text; Tanner & Swets, 1954). This correspondence means that, of all the possible criterion locations plotted by the ROC, the point whose tangent is the indifference line defines the correct detection and false alarm probability pair corresponding to the optimal threshold location for a given set of signal parameters (Egan, 1975). As a determination of optimal beta, the indifference line and ROC explicitly show the link between perceiver sensitivity and bias, and the influence of sensitivity, payoffs, and base rate on behavior.
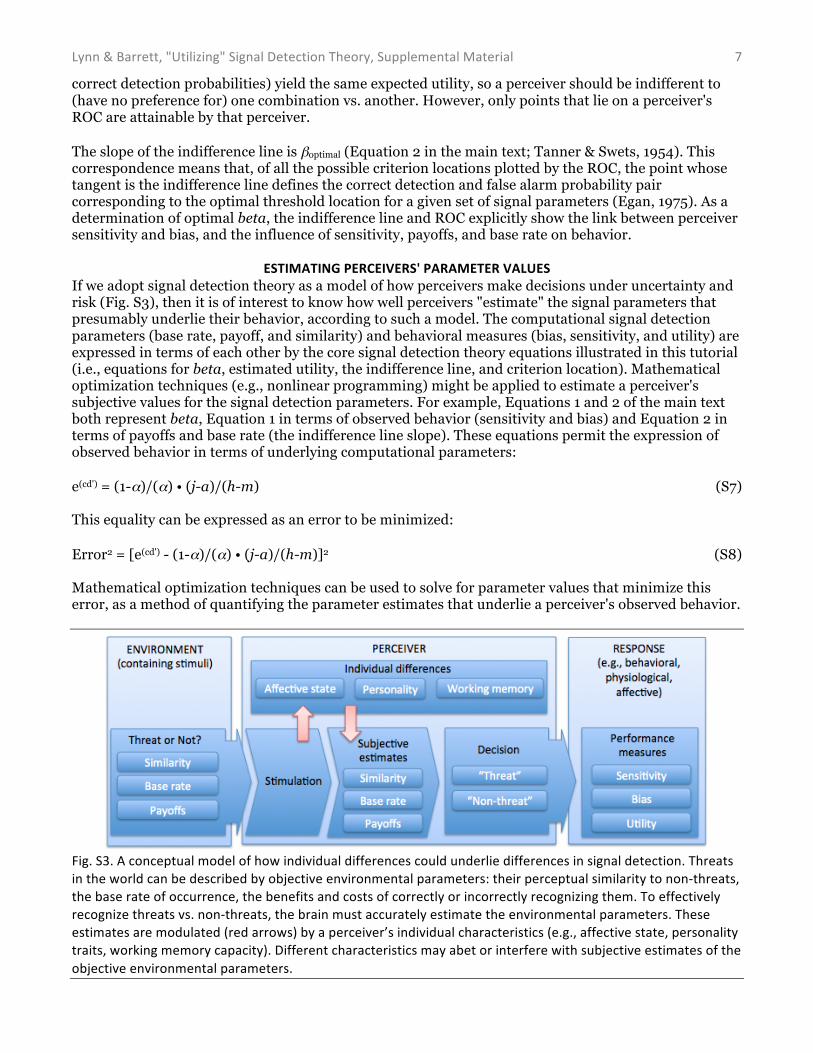
ESTIMATING*PERCEIVERS'*PARAMETER*VALUES*If we adopt signal detection theory as a model of how perceivers make decisions under uncertainty and risk (Fig. S3), then it is of interest to know how well perceivers "estimate" the signal parameters that presumably underlie their behavior, according to such a model. The computational signal detection parameters (base rate, payoff, and similarity) and behavioral measures (bias, sensitivity, and utility) are expressed in terms of each other by the core signal detection theory equations illustrated in this tutorial (i.e., equations for beta, estimated utility, the indifference line, and criterion location). Mathematical optimization techniques (e.g., nonlinear programming) might be applied to estimate a perceiver's subjective values for the signal detection parameters. For example, Equations 1 and 2 of the main text both represent beta, Equation 1 in terms of observed behavior (sensitivity and bias) and Equation 2 in terms of payoffs and base rate (the indifference line slope). These equations permit the expression of observed behavior in terms of underlying computational parameters: e(cd') = (1-α)/(α) • (j-a)/(h-m) (S7) This equality can be expressed as an error to be minimized: Error2 = [e(cd') - (1-α)/(α) • (j-a)/(h-m)]2 (S8) Mathematical optimization techniques can be used to solve for parameter values that minimize this error, as a method of quantifying the parameter estimates that underlie a perceiver's observed behavior.
!Fig.!S3.!A!conceptual!model!of!how!individual!differences!could!underlie!differences!in!signal!detection.!Threats!
in!the!world!can!be!described!by!objective!environmental!parameters:!their!perceptual!similarity!to!nonBthreats,!
the!base!rate!of!occurrence,!the!benefits!and!costs!of!correctly!or!incorrectly!recognizing!them.!To!effectively!
recognize!threats!vs.!nonBthreats,!the!brain!must!accurately!estimate!the!environmental!parameters.!These!
estimates!are!modulated!(red!arrows)!by!a!perceiver’s!individual!characteristics!(e.g.,!affective!state,!personality!
traits,!working!memory!capacity).!Different!characteristics!may!abet!or!interfere!with!subjective!estimates!of!the!
objective!environmental!parameters.!

Lynn!&!Barrett,!"Utilizing"!Signal!Detection!Theory,!Supplemental!Material!!
8!
PARAMETER*VALUES*USED*TO*GENERATE*FIGURES*IN*THE*MAIN*TEXT*
Figure*1*For the correctly estimated environment, parameters are: benefit of correct detection of targets=10 points, missed detection of targets=-1 point, false alarm to foils=-15 points, and correct rejection of foils=10 points; base rate=0.25 (25% percent of signals originate from the "target" distribution); and a similarity parameter defined by Gaussian distributions with the mean of target and foil expressions at 60% and 40% scowl intensity, respectively, and standard deviation=15% for both distributions. For the misestimating perceiver, costs are misestimated as missed detection=-15, false alarm=-1, with other parameters as above. Point accumulation (panel b) reflects the average of 10 repetitions of 1000 signals drawn randomly under the given parameters. Figure*2*Correct detections and correct rejections=10 points, missed detections and false alarms=-10 points; base rate=0.5; and similarity parameter with mean target and foil expressions at 60% and 40% intensity, respectively, and standard deviation=10% for both distributions. Figure*3*Correct detections and correct rejections=10 points, missed detections=-3 points, and false alarms=-7 points; base rate=0.25. For the "low similarity" environment, mean of target and foil expressions at 60% and 40% scowl intensity, respectively, and standard deviation=10% scowl for both distributions. For the "high similarity" environment, target and foil standard deviations=17.5% scowl, with other parameters as for the low similarity function. Figure*4*Correct detections and correct rejections=10 points, missed detections=-3 points, and false alarms=-7 points; base rate=0.25. These are the same values as used in Fig. 3. Figure*5*Lines of optimal response are plotted for two experimental conditions from Lynn et al. (2012). For the "conservative base rate environment," the payoff and base rate are the same as for the utility functions in Fig. 3 and the line of optimal response in Fig. 4. For the "liberal payoff environment," correct detections and correct rejections=10 points, missed detections=-15 points, and false alarms=-1 point; base rate=0.5.
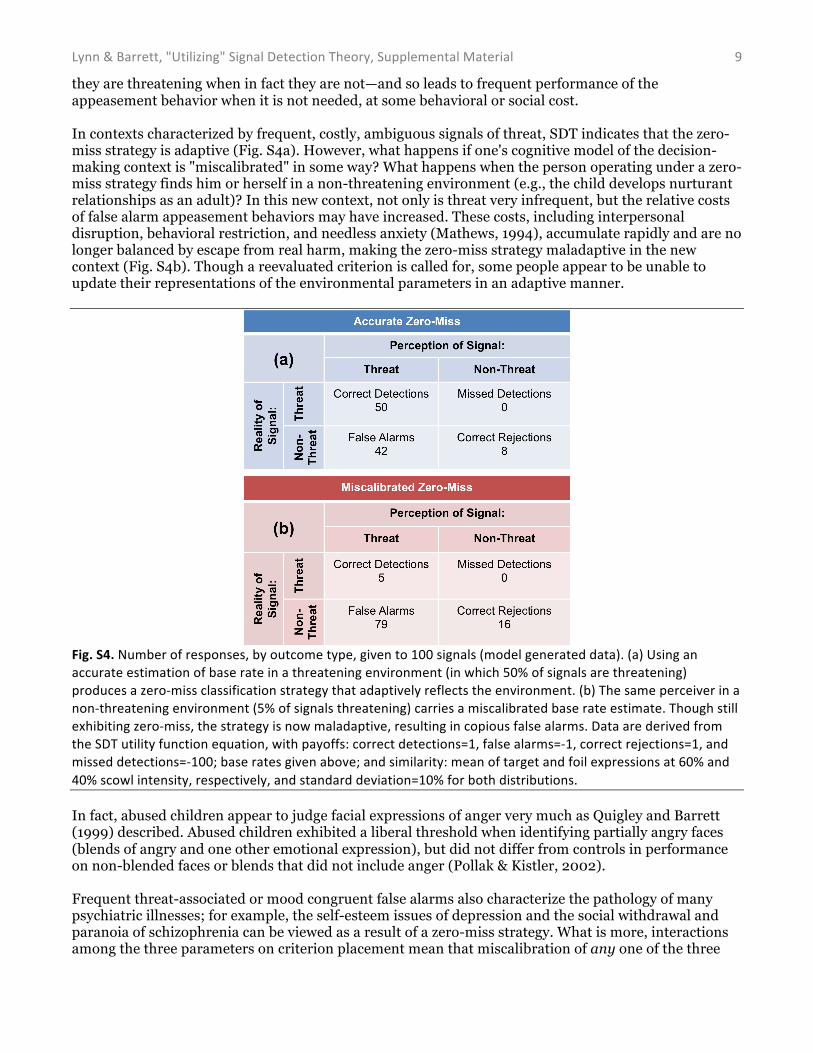
AFFECTIVE*CALIBRATION*IN*MENTAL*ILLNESS:*AN*EXAMPLE*OF*SDT*AS*A*MODEL*More than a decade ago, Quigley and Barrett (1999) used signal detection theory to understand how momentary judgments about the presence or absence of threat become pathologically impaired due to prior experiences with threat. They argued that people who live in a context where the base rate of threat is high, or a missed threat is costly, develop a "zero-miss" judgment strategy that functions to minimize missed detections of threat. As a simplified example, imagine that a child raised in an abusive household gauges whether or not an aversive outcome such as criticism or physical punishment is imminent by reading the facial expression of his or her care giver. On occasions when the child can correctly detect this threat, it can be mitigated by, e.g., engaging in an appeasement behavior. We can assume that the care giver's threatening and non-threatening facial expressions (the signal) can be characterized by a mean and variance (Fig. 1 of main text). Framing this example as a signal detection issue suggests that, when faced with uncertainty (i.e., Is the care giver angry?), the child should respond to expressions perceived as above some criterion of "angry-looking" as if they indicate threat (i.e., perform the appeasement behavior) and respond to those expressions below criterion as if they indicate no threat (i.e., do nothing). Quigley & Barrett hypothesized that when threat is frequent and missed detections are costly (either psychologically or physically), perceivers will adopt a very liberal threshold in an attempt to mitigate threat as completely as possible. This liberal classification strategy minimizes missed detections of threat, but it simultaneously maximizes false alarms—responses to signals as if
Lynn!&!Barrett,!"Utilizing"!Signal!Detection!Theory,!Supplemental!Material!!
9!
they are threatening when in fact they are not—and so leads to frequent performance of the appeasement behavior when it is not needed, at some behavioral or social cost. In contexts characterized by frequent, costly, ambiguous signals of threat, SDT indicates that the zero-miss strategy is adaptive (Fig. S4a). However, what happens if one's cognitive model of the decision-making context is "miscalibrated" in some way? What happens when the person operating under a zero-miss strategy finds him or herself in a non-threatening environment (e.g., the child develops nurturant relationships as an adult)? In this new context, not only is threat very infrequent, but the relative costs of false alarm appeasement behaviors may have increased. These costs, including interpersonal disruption, behavioral restriction, and needless anxiety (Mathews, 1994), accumulate rapidly and are no longer balanced by escape from real harm, making the zero-miss strategy maladaptive in the new context (Fig. S4b). Though a reevaluated criterion is called for, some people appear to be unable to update their representations of the environmental parameters in an adaptive manner.
*Fig.*S4.!Number!of!responses,!by!outcome!type,!given!to!100!signals!(model!generated!data).!(a)!Using!an!
accurate!estimation!of!base!rate!in!a!threatening!environment!(in!which!50%!of!signals!are!threatening)!
produces!a!zeroBmiss!classification!strategy!that!adaptively!reflects!the!environment.!(b)!The!same!perceiver!in!a!
nonBthreatening!environment!(5%!of!signals!threatening)!carries!a!miscalibrated!base!rate!estimate.!Though!still!
exhibiting!zeroBmiss,!the!strategy!is!now!maladaptive,!resulting!in!copious!false!alarms.!Data!are!derived!from!
the!SDT!utility!function!equation,!with!payoffs:!correct!detections=1,!false!alarms=B1,!correct!rejections=1,!and!
missed!detections=B100;!base!rates!given!above;!and!similarity:!mean!of!target!and!foil!expressions!at!60%!and!
40%!scowl!intensity,!respectively,!and!standard!deviation=10%!for!both!distributions.!
In fact, abused children appear to judge facial expressions of anger very much as Quigley and Barrett (1999) described. Abused children exhibited a liberal threshold when identifying partially angry faces (blends of angry and one other emotional expression), but did not differ from controls in performance on non-blended faces or blends that did not include anger (Pollak & Kistler, 2002). Frequent threat-associated or mood congruent false alarms also characterize the pathology of many psychiatric illnesses; for example, the self-esteem issues of depression and the social withdrawal and paranoia of schizophrenia can be viewed as a result of a zero-miss strategy. What is more, interactions among the three parameters on criterion placement mean that miscalibration of any one of the three
Lynn!&!Barrett,!"Utilizing"!Signal!Detection!Theory,!Supplemental!Material!!
10!
environmental parameters (payoff, base rate, or via the the functional relationship between sensitivity and bias, even similarity) is capable of producing identical criterion placement and behavior. Characterizing psychopathology as impaired optimality of signal detection suggests that calibration may be dependent on internal states of the perceiver (Fig. S3). Congruent with this idea, Lynn et al (2012) found, in a control sample, associations between affective state (valence and arousal) and ability to adapt to changes in the three environmental parameters.
REFERENCES*FOR*SUPPLEMENTARY*MATERIAL*Ashby, F. G. (2000). A stochastic version of general recognition theory. Journal of Mathematical
Psychology, 44, 310-329. Blough, D. S. (2001). Some contributions of signal detection theory to the analysis of stimulus control in
animals. Behavioural Processes, 54, 127-136. Bohil, C. J., Szalma, J. L., & Hancock, P. A. (In press). Psychophysical methods and signal detection:
Recent advances in theory. In J. L. Szalma, M. Scerbo, R. Parasuraman, P. A. Hancock & R. R. Hoffman (Eds.), Cambridge Handbook of Applied Perception Research. Cambridge: Cambridge University Press.
Bradbury, J. W., & Vehrencamp, S. L. (1998). Principles of Animal Communication. Sunderland: Sinauer.
Critchley, H. D., & Harrison, N. A. (2013). Visceral influences on brain and behavior. Neuron, 77, 624-638.
Edelman, S., & Intrator, N. (1997). Learning as Extraction of Low-Dimensional Representations. In D. L. M. Robert L. Goldstone & G. S. Philippe (Eds.), Psychology of Learning and Motivation (Vol. Volume 36, pp. 353-380): Academic Press.
Egan, J. P. (1975). Signal Detection Theory and ROC Analysis. New York, NY: Academic Press. Getty, D. J., Pickett, R. M., D'Orsi, C. J., & Swets, J. A. (1988). Enhanced Interpretation of Diagnostic
Images. Investigative Radiology, 23, 240-252. Gilbert, D. T. (1998). Ordindary personology. In D. T. Gilbert, S. T. Fiske & G. Lindzey (Eds.), The
handbook of social psychology (Vol. 1, pp. 89-150). New York: McGraw-Hill. Green, D. M., & Swets, J. A. (1966). Signal Detection Theory and Psychophysics. New York: Wiley. Johnstone, R. A. (2002). The evolution of inaccurate mimics. Nature, 418, 524-526. Kozak, M. N., Marsh, A. A., & Wegner, D. M. (2006). What do I think you're doing? Action
identification and mind attribution. Journal of Personality and Social Psychology, 90, 543-555. Lillquist, E. (2002). Recasting reasonable doubt: Decision theory and the virtues of variability.
University of California Davis Law Review, 36, 85-197. Lynn, S. K., Zhang, X., & Barrett, L. F. (2012). Affective state influences perception by affecting decision
parameters underlying bias and sensitivity. Emotion, 12, 726-736. Macmillan, N. A., & Creelman, C. D. (1991). Detection Theory: A User's Guide. New York: Cambridge
University Press. Mathews, A. (1994). Cognitive approaches to emotion and emotional disorders. Annual Review of
Psychology, 45, 25. Mickes, L., Wixted, J., & Wais, P. (2007). A direct test of the unequal-variance signal detection model of
recognition memory. Psychonomic Bulletin & Review, 14, 858-865. Pastore, R., Crawley, E., Berens, M., & Skelly, M. (2003). “Nonparametric”A’ and other modern
misconceptions about signal detection theory. Psychonomic Bulletin & Review, 10, 556-569. Pollak, S. D., & Kistler, D. J. (2002). Early experience is associated with the development of categorical
representations for facial expressions of emotion. Proceedings of the National Academy of Sciences of the United States of America, 99, 9072-9076.
Quigley, K. S., & Barrett, L. F. (1999). Emotional learning and mechanisms of intentional psychological change. In J. Brandtstadter & R. M. Lerner (Eds.), Action and Development: Origins and Functions of Intentional Self-Development (pp. 435–464). Thousand Oaks, CA: Sage.
Snodgrass, J. G., & Corwin, J. (1988). Pragmatics of measuring recognition memory: Applications to dementia and amnesia. Journal of Experimental Psychology: General, 117, 34-50.
Lynn!&!Barrett,!"Utilizing"!Signal!Detection!Theory,!Supplemental!Material!!
11!
Sperling, G. (1984). A unified theory of attention and signal detection. In R. Parasuraman & R. R. Davies (Eds.), Varieties of attention (pp. 103-181). Orlando, FL: Academic Press.
Stanislaw, H., & Todorov, N. (1999). Calculation of signal detection theory measures. Behavior Research Methods, Instruments, & Computers, 31, 137-149.
Swets, J. A. (1998). Separating discrimination and decision in detection, recognition, and matters of life and death. In D. Scarborough, S. Sternberg & D. N. Osherson (Eds.), An Invitation to Cognitive Science, Volume 4: Methods, Models, and Conceptual Issues (pp. 635-702). Cambridge: The MIT Press.
Swets, J. A., Tanner, W. P., Jr., & Birdsall, T. G. (1961). Decision processes in perception. Psychological Review, 68, 301-340.
Tanner, W. P., Jr., & Swets, J. A. (1954). A decision-making theory of visual detection. Psychological Review, 61, 401-409.
Wegner, D. M., & Vallacher, R. R. (1986). Action identification. In R. M. Sorrentino & E. T. Higgins (Eds.), Handbook of Motivation and Cognition: Foundations of Social Behavior (pp. 550-582). New York: Guilford Press.
Wickens, T. D. (2001). Elementary Signal Detection Theory. Oxford: Oxford University Press. Wiley, R. H. (1994). Errors, exaggeration, and deception in animal communication. In L. A. Real (Ed.),
Behavioral Mechanisms in Evolutionary Ecology (pp. 157-189). Chicago: University of Chicago Press.