Utilizing Google Analytics Data in Assessing Various ...
24
Utilizing Google Analytics Data in Assessing Various Strategies for Increasing Website Traffic Nur Fathin Harnani Binti Mohd Zainal 57221 Bachelor of Computer Science with Honours (Computational Science) 2019
Transcript of Utilizing Google Analytics Data in Assessing Various ...

Utilizing Google Analytics Data in Assessing Various Strategies for
Increasing Website Traffic
Nur Fathin Harnani Binti Mohd Zainal 57221
Bachelor of Computer Science with Honours
(Computational Science)
2019


TABLE OF CONTENT
DECLARATION………………………………………………………………..……………1
ACKNOWLEDGEMENT………………………………………………………………..….2
LIST OF FIGURES……………………………………………………………………...…3-5
LIST OF TABLES……………………………………………………………………………6
ABSTRACT……………………………………………………………………………….….7
ABSTRAK…………………………………………………………………………………….7
CHAPTER 1: INTRODUCTION
1.1 BACKGROUND…………………………………………………………………….…….8
1.2 PROBLEM STATEMENT………………………………………………………………...8
1.3 OBJECTIVES……………………………………………………………………………...9
1.4 METHODOLOGY………………..…………………………………………………...9-10
1.5 SCOPE…………………………………………………………………………………....10
1.6 SIGNIFICANCE OF PROJECT………………………………………………………….11
1.7 EXPECTED OUTCOME………………………………………………………………...11
1.8 PROJECT SCHEDULE………………………………………………………………12-13
CHAPTER 2: LITERATURE REVIEW
2.1 INTRODUCTION……………………………………………………………………14-15
2.2 KEY FEATURES OF GOOGLE ANALYTICS……………………………...……...16-19
2.3 ARCHITECTURE OF THE GOOGLE ANALYTICS TOOL…………………….…19-25
2.4 FACEBOOK PIXEL…………………………………………….……………………25-29

2.5 CONCLUSION……………………………………………………………………….29-30
CHAPTER 3: METHODOLOGY
3.1 INTRODUCTION…………………………………………………………………….…31
3.2 DATA COLLECTION…………………………………………………………….....31-37
3.3 DATA VISUALIZATION AND INSIGHTS………………………………………..37-40
3.4 EXPERIMENTS AND RESULTS…………………………………………………........40
3.5 DATA ANALYSIS AND CONCLUSIONS…………………………………………40-41
CHAPTER 4: IMPLEMENTATION AND TESTING
4.1 INTRODUCTION…………………………………………………………………..……42
4.2 DATA COLLECTION…..…………………………………….……………………..42-59
4..3 DATA VISUALIZATION AND INSIGHTS………………………………………..59-65
CHAPTER 5: DISCUSSION AND CONCLUSION
5.1 INTRODUCTION…………………………………………………………………….…66
5.2 LIMITATION OF STUDY……………………………………………………….......66-67
5.3 RECOMMENDATION FOR FUTURE WORK…………………………………….67-69
5.4 SUMMARY……………………...…………………………………………………........69

REFERENCES………………………………………………………………………….70-72
APPENDIX A……………………………………………………………………….…...73-74

1
DECLARATION
This is to certify that to the best of my knowledge and the content of this project is my own
work. This project has not been submitted for any degree or other purposes. I certify that the
intellectual content of this project is the product of my own work and that all the assistance
received in preparing this project and sources have been acknowledged.
Nur Fathin Harnani Binti Mohd Zainal
57221

2
ACKNOWLEDGEMENT
In the name of Allah, the Most Gracious and the Most Merciful who bless me and give me the
ability for completing this project. I would like to express my deepest gratitude to my
supervisor, Dr. Shapi-ee Bin Abd Rahman, and my examiner, Dr. Nuha Binti Loling Othman
for the useful guidance and insightful comments throughout this final year project. I would also
want to send my appreciation to all my parents and friends for their supports and motivation.
3
LIST OF FIGURES
Figure 2.1 Dimensions and metrics………………………………………………………15
Figure 2.2 Goal Conversion Rate………………………………………………………...16
Figure 2.3 Bounce Rate…………………………………………………………………..17
Figure 2.4 Number of Visits Using Different Operating System…………………………17
Figure 2.5 Percentage of New Visitors and Returning Visitors…………………….…….17
Figure 2.6 Google Analytics Dashboard…………………………………………………18
Figure 2.7 An Overview of Analytics Intelligence………………………………….……18
Figure 2.8 Google Analytics Architecture……………………………………………….20
Figure 2.9 Audience Overview Report…………………………………………………..21
Figure 2.10 Traffic Overview Dashboard…………………………………………………22
Figure 2.11 Active Users………………………………………………………………….23
Figure 2.12 The Transaction in the eCommerce Website…………………………….……23
Figure 2.13 Number of Visitors All Around the World……………………………………24
Figure 2.14 Number of Visitors from Tamil Nadu and Karnataka………………………...25
Figure 2.15 Custom Audience…………………………………………………………….26
Figure 2.16 Custom Conversion…………………………………………………………..28
Figure 2.17 Example of Code to Track Conversions………………………………………29
Figure 3.1 Start for Free…………………………………………………………….……32
Figure 3.2 Start Measuring………………………………………………………….……32

4
Figure 3.3 Create Account……………………………………………………………….33
Figure 3.4 Tracking ID and Tracking Code………………………………………………34
Figure 3.5 Line Graph and Pie Chart from Google Analytics……………………….……39
Figure 3.6 SPSS Chart Builder…………………………………………………………...39
Figure 4.1 Demographics: Overview…………………………………..………………...43
Figure 4.2 Dimension: Age…………………………………..…………..……………....44
Figure 4.3 Dimension: Gender……………………………………...……………………44
Figure 4.4 Interests: Overview of All Users……………………………….……….…….45
Figure 4.5 Affinity Category …………………………………………..……...………....46
Figure 4.6 In-Market Segment …………………………………………………………..47
Figure 4.7 Other Category …………………………..……………………………….…..48
Figure 4.8 Overview: Interests of Young and Older Visitors………………..……….…..49
Figure 4.9 Affinity Category: Young and Older Visitors …………………………….….50
Figure 4.10 New Visitor vs Returning Visitor ……………………………………….…..52
Figure 4.11 Behaviors: Frequency & Recency …………………………………………....52
Figure 4.12 Behaviors: Frequency Report ……………………………………………...…53
Figure 4.13 Behaviors: Recency Report ………………...…………………………...……54
Figure 4.14 Device Category …………………………………………………………..…54
Figure 4.15 Operating System ……………………………………………………...……..55
Figure 4.16 Top Channels …………………………..………………………………….....56

5
Figure 4.17 Channel Grouping ……………………………..………………..……………56
Figure 4.18 Source/Medium: Bounce Rate …………………………………………….....57
Figure 4.19 Social Sources: Social Network ……………………………………………...57
Figure 4.20 Pages: Shared URL ………………………………………………………......58
Figure 4.21 Behavior: Overview ……………………………………………………….....58
Figure 4.22 Site Content: All Pages………………...…………………………..……..…..59
Figure 4.23 Pageview by Gender ……………………………………………..……..…....60
Figure 4.24 Sessions and Users …………………………………………...………..……..62
Figure 4.25 Sessions by Social Network…………...……………………….….…...……..63
Figure 4.26 Bounce Rate by Page Title……………...…………………………...………..64
Figure 4.27 Conversion Report: Overview …………...…………………………..……….68
Figure 4.28 Goals……………………………...……………………………...….………..68
Figure 4.29 Goal Setup, Description, and Details ……………...……………......…….…..69

6
LIST OF TABLES
Table 2.1 Similarities and Differences of Google Analytics and Facebook Pixel…………..30
Table 3.1 Terminology and Description……………...………………………………..……37
Table 3.2 Metrics and Description…………………………………………………………38

7
ABSTRACT
Google Analytics is one of the most preferred digital analytics tools used to analyze in-
depth details about the visitors on the company website (Thakur, 2017). It provides valuable
insights that can help the company to better understand their visitors' behavior. Google
Analytics can also help in assessing various strategies such as SEO (search engine
optimization) for increasing website traffic.
ABSTRAK
Google Analytics adalah salah satu alat analitik digital yang paling digemari yang
digunakan untuk menganalisis butiran mendalam tentang pelawat di laman web syarikat
(Thakur, 2017). Ia memberikan pandangan berharga yang boleh membantu syarikat untuk lebih
memahami tingkah laku pengunjung mereka. Google Analytics juga dapat membantu dalam
menilai pelbagai strategi seperti SEO (Search Engine Optimization) untuk meningkatkan trafik
laman web.
8
CHAPTER 1: INTRODUCTION
1. 1 BACKGROUND
Living in an advanced world, having an online presence is essential for any business.
Business website is one of the ways to create business online identity. A website can help to
generate business, promote goodwill among customers, and is an effective platform to
showcase the products or services a company have to offer.
Google Analytics is one of the most preferred digital analytics tools used to analyze in-
depth details about the visitors on the company website (Thakur, 2017). It provides valuable
insights that can help the company to better understand their visitors' behavior. Google
Analytics can also help in assessing various strategies such as SEO (search engine
optimization) for increasing website traffic. For instance, by knowing the website visitors'
demographic and interest, the company can create targeted content and get better visibility on
search engines which will increase website traffic.
With so many other website analytics tools, Google Analytics remains a highly relevant
free solution to manage the website's analytics (Thakur, 2017). It is easy to set up,
customizable, and provides all the basic information about the website (DiSilvestro, 2018).
1.2 PROBLEM STATEMENT
Having a website can help to promote the business to a wider audience. However,
without a proper strategy and understanding on the visitors' behavior on the website, it is
pointless and not giving any benefit to the business owner. The business owner needs to
understand what kind of content they need to deliver to his website visitors and make the right
decision to increase website traffic and consequently increase profits.

9
1.3 OBJECTIVES
The main objectives of this project are:
1. To analyze website visitors’ demographics, interests, and browsing behavior.
2. To implement various strategies to increase website traffic.
3. To visualize the Google Analytics data in analyzing the implemented strategies
to increase website traffic.
1.4 METHODOLOGY
The following are the methodology that will be applied in this project:
1.4.1 Data Collection
Data will be collected from Google Analytics data. Some useful data
that is needed for this project are website visitors’ demographics,
interest, and browsing behaviors.
1.4.2 Data Analysis
This project will focus on analyzing the data from 4 reports that are
available in Google Analytics, namely Audience, Acquisition, Behavior,
and Conversions.
• Audience
The Audience report helps to better understand the
characteristics of the visitors as it provides reports on specific
details of the visitors’ demographic such as their age and gender
(Akash, 2018).
• Acquisition
The Acquisition report shows where the visitors originated from,
such as search engines, social networks, or referrals (Hines,

10
2014). It determines which online marketing strategies will bring
the most visitors to the website.
• Behavior
The Behavior report describes the behavior of website visitors.
By using this report, the performance of the website content can
be assessed and determine whether the visitors are taking the
actions as the website owner want them to (Shivar, 2019).
• Conversions
The Conversions report contains four sections which are goals,
eCommerce, multi-channel funnel, and attribution. This report
shows the rate of conversion of visitors to customers.
1.4.3 Data Visualization
The collected data will be visualized to make it more delightful by
presenting those insights in various meaningful charts. It will also make
it easier for the researcher to understand and detect the pattern of the
website visitors' behavior.
1.4.4 Statistical Analysis Software
SPSS
1.5 SCOPE
The scope of this project is web analytics. Data trends obtained from the website
analysis can provide valuable insights for the business. As such, this project focuses on the
analysis of the website traffic of the case company.

11
1.6 SIGNIFICANCE OF PROJECT
The research results could benefit the business owner in increasing website traffic. The
researcher can study the patterns of website visitors’ behavior to provide insights to understand
the data obtained from Google Analytics.
1.7 EXPECTED OUTCOME
To analyze Google Analytics data on a selected website (as a case study) and determine
a better strategy to increase website traffic.

12
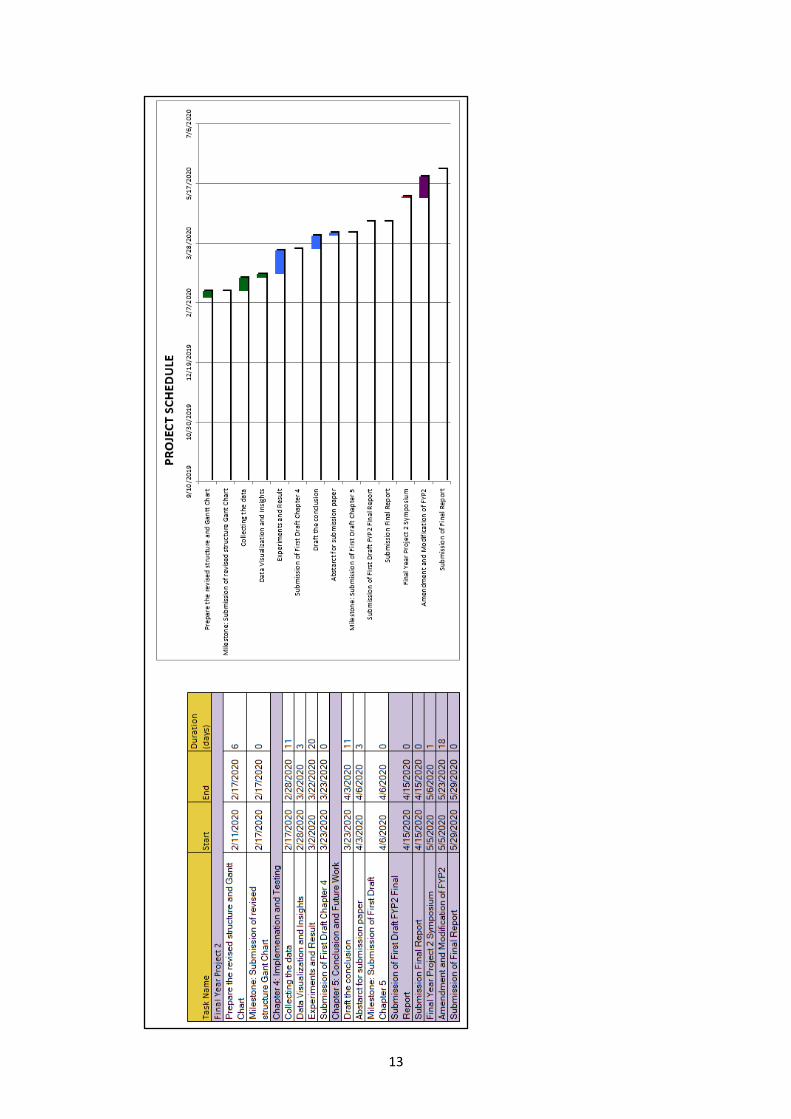
1.8 PROJECT SCHEDULE
13

14
CHAPTER 2: LITERATURE REVIEW
2.1 INTRODUCTION
Omidvar, Mirabi, and Shokry (2011) in their study suggest that to gain more profit, web
developing should be carried out competently and professionally as the number of internet
users, websites, and retail sales are increasing. Website analytics is essential for business
growth as it provides in-depth details of the website visitors that can be used to optimize the
website contents based on the visitors’ interest.
One of the most popular website analytics tools is Google Analytics as it is being used
by over 20 million websites around the world. Google Analytics is a free analytics tool offered
by Google to help a business owner to track their digital marketing effectiveness (Su, 2017).
Google Analytics works by adding a block of JavaScript code on the website’s pages
(“Tracking Code Overview, n.d.”). As the visitors access the website’s page, the JavaScript
code records various activities of the visitors which then executes the tracking operation for
Analytics.
Google Analytics reports consist of two types of data, which are dimensions and metrics
(Clifton, 2012). The data are usually present in the form of a table as shown in Figure 2.1. The
row represents dimension, while the column represents metrics.
Dimensions describe the attributes of the website visitors. For example, gender, age,
city, browser, device category, and operating system. While metrics are the numbers associated
with the dimensions such as the number of visitors, number of pageview per visit, bounce rate
and goal value (Clifton, 2012). Sharma states that Google Analytics metrics are reported under
three categories, namely Acquisition, Behavior, Conversions. The Acquisition report shows
where the visitors originate from, whether search engines, social networks or referrals (Hines,
2014). Hines also mentioned that the Acquisition report determines which online marketing
strategies will bring the most visitors to the website. Next, the Behavior report. This report

15
describes the behavior of website visitors. By using this report, the performance of the website
content can be assessed and is used to determine whether the visitors are taking the actions as
the website owner want them to (Shivar, 2019). Lastly, the Conversion report. This report
shows the rate of conversion of visitors to customers (Mazaheri, 2018). Mazaheri states that
the conversions can occur through filling out a form, purchasing item, or just simply by
showing a high level of engagement with the site.
In this literature review, we will discuss some of the key features of Google Analytics,
the architecture of the Google Analytics, and Facebook pixel. These studies are important to
better understand the scope of Google Analytics tools for a business website and to compare
the difference between Google Analytics and Facebook pixel.
Figure 2.1 Dimensions and metrics. Reprinted from The 10 Most-Tracked Google Analytics
Metrics, by J. Bonini, 2019.

16
2.2 KEY FEATURES OF GOOGLE ANALYTICS
To get additional visitors, eCommerce site owner must bid improved excellence site.
Google Analytics is a specific illustrative instruments from Google which serves to trace
visitors and collect an extensive variety of profitable data concerning them (Gaur, Singh, Paul,
& Kumar, 2016). Some of the key features of Google Analytics that has been discussed in this
project is describe as follows:
1. Goal Conversion Rate
The conversion rate is the percentage of visitors who take a desired action
on the website for example purchasing a product. Figure 2.2 shows the
conversion rate of a website which is 2.57%.
Figure 2.2 Goal Conversion Rate.
2. Bounce Rate
Bounce rate describes the percentage of visitors to a website who then
navigate away from the site after viewing only one page. If the bounce rate
is high, it means the visitors assume that they are not interested with the
webpage. As such, the owner can make decision whether the page need for
an improvement or they might as well remove it.

17
Figure 2.3 Bounce Rate
3. Mobile Tracking
Mobile tracking is used to track what operating system that the visitors use
when visiting the website, such as Android, Windows, iOS and others. It is
useful for the website owners in making decision of building a mobile apps
for their businesses.
Figure 2.4 Number of Visits Using Different Operating System
4. Advanced Segmentation
Advanced segmentation allows certain types of visitors to accumulate
together such as new visitors, returning visitors and paid visitors.
Figures 2.5 Percentage of New Visitors and Returning Visitors

18
5. Dashboard
Customizable dashboard gives an opportunity to user for incorporating
report trough drag and drop functionality. Users can run custom dashboard
as an interactive web application on intranets, website, blogs and others.
Figure 2.6 Google Analytics Dashboard
6. Analytics Intelligence
This tool creates custom alerts, for major changes in website behavior. It
automatically notifies the site owner, when threshold reaches the target.
Figure 2.7 An Overview of Analytics Intelligence
In this project, the authors also described the benefits of Google Analytics. Firstly, they
mentioned that Google Analytics is unrestricted as it is free compared to its competitor such as

19
W3Counter. Secondly, Google Analytics is user friendly as it does not require any
programming skills and to analyze the data gained is much easier and can be done by experts
and non-experts. Next, Google Analytics is easy to learn as one can easily access and learn
about Google Analytics through any online tutorial available. They also stated that Google
Analytics is easy to setup as it can be easily installed by anyone who have the basic knowledge
of computer. Lastly, Google Analytics provides a detailed visitors profile such as the duration
they stay in the website, where are they navigated from, which country and region they come
from and much more. In conclusion, the metrics that can be obtained in Google Analytics
reports is simple and easy for users to understand. If a business owner fully utilizes the use of
Google Analytics, they are guaranteed to be able to increase their website traffic which may
lead to increasing of profits.
2.3 ARCHITECTURE OF THE GOOGLE ANALYTICS TOOL
In Thushara and Ramesh’s (2016) research paper, they discussed how Google Analytics
helps in analyzing an eCommerce website to know what appears interesting to the visitors to
purchase a product. According to Thushara and Ramesh, Google Analytics lets a website’s
owner to measure their advertising ROI (Return on Investment) as well as tracking the social
networking sites and applications. Google Analytics tool also offers Geo-Targeting that helps
to target visitors in a specific geographic area, executive dashboard, site overlay, traffic
conversion funnels, eCommerce reports and visitor segmentation analysis. The reports allow a
website’s owner to learn how visitors reach the website, on which page they exit, what they
purchase, how long they stay on each page and some other metrics that are provided by Google
Analytics. By analyzing the reports, the website’s owner can tailor the pages to suit their
visitors’ interests.
In this project, they also described how Google Analytics JavaScript code works on the
webpage as below and the architecture of the Google Analytics is show in Figure 2.8: