Using the PACE 2.0 Growth Model Strategies & Tools for … the PACE 2.… · Using the PACE 2.0...
42
Using the PACE 2.0 Growth Model Strategies & Tools for Achieving Your Growth Aim January 31, 2019
Transcript of Using the PACE 2.0 Growth Model Strategies & Tools for … the PACE 2.… · Using the PACE 2.0...
Using the PACE 2.0 Growth ModelStrategies & Tools for Achieving Your Growth Aim
January 31, 2019
Achieving Your Growth Aim
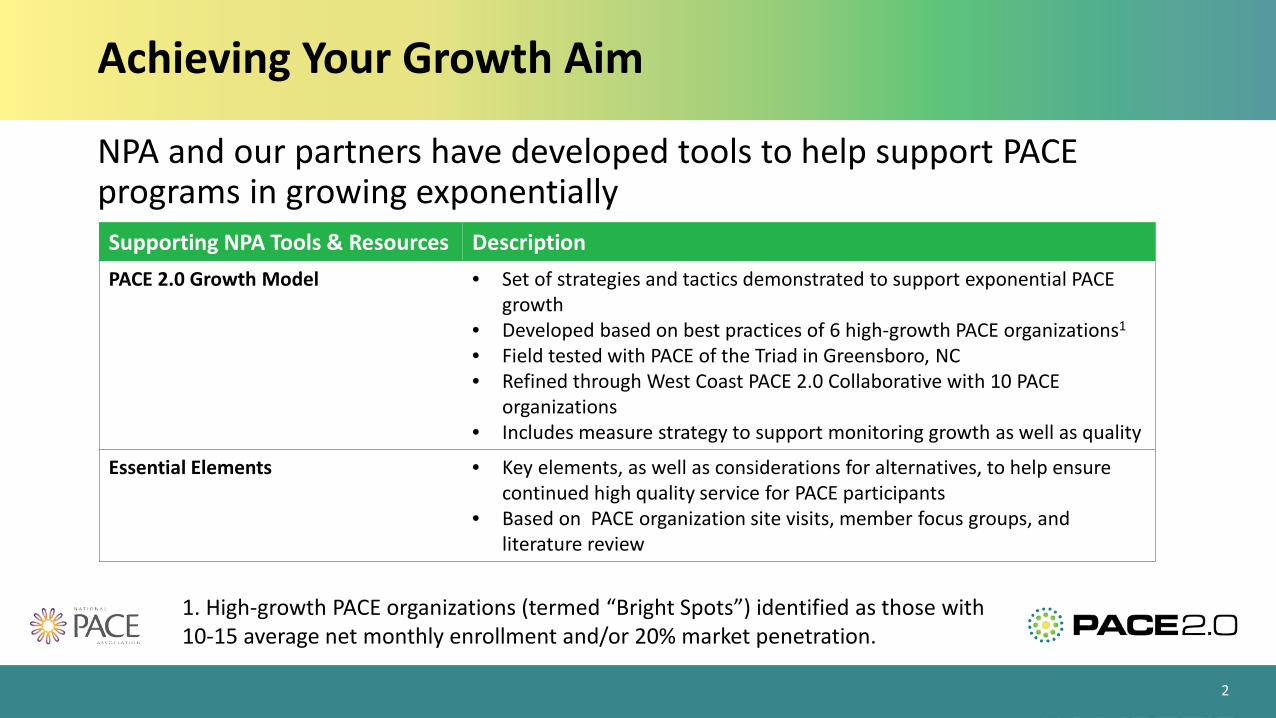
NPA and our partners have developed tools to help support PACE programs in growing exponentially
2
Supporting NPA Tools & Resources DescriptionPACE 2.0 Growth Model • Set of strategies and tactics demonstrated to support exponential PACE
growth• Developed based on best practices of 6 high-growth PACE organizations1
• Field tested with PACE of the Triad in Greensboro, NC• Refined through West Coast PACE 2.0 Collaborative with 10 PACE
organizations• Includes measure strategy to support monitoring growth as well as quality
Essential Elements • Key elements, as well as considerations for alternatives, to help ensure continued high quality service for PACE participants
• Based on PACE organization site visits, member focus groups, and literature review
1. High-growth PACE organizations (termed “Bright Spots”) identified as those with 10-15 average net monthly enrollment and/or 20% market penetration.
Growth Drivers & Tactics

About the Growth Model
• Growth drivers identified based on lessons learned from 6 PACE “Bright Spot”1
organizations that have grown exponentially• Tactics and methodology field tested with PACE
of the Triad in Greensboro, North Carolina• Tactics and methodology further refined with
10 PACE Organizations through the West Coast PACE 2.0 Collaborative
4
5 key drivers support exponential growth
1. Bright Spots: PACE organizations with 10-15 average net monthly enrollment and/or 20% Market Penetration
GROWTHDRIVERS
Primary Growth Drivers
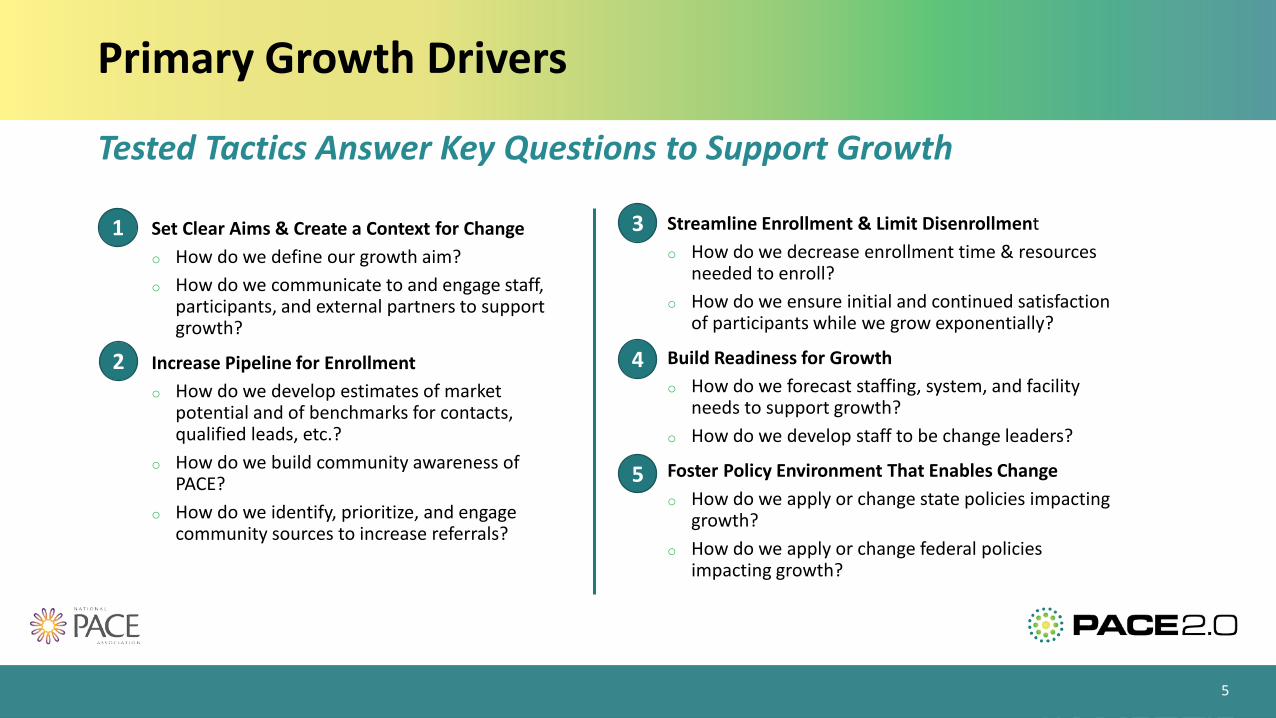
• Set Clear Aims & Create a Context for Changeo How do we define our growth aim?o How do we communicate to and engage staff,
participants, and external partners to support growth?
• Increase Pipeline for Enrollmento How do we develop estimates of market
potential and of benchmarks for contacts, qualified leads, etc.?
o How do we build community awareness of PACE?
o How do we identify, prioritize, and engage community sources to increase referrals?
5
Tested Tactics Answer Key Questions to Support Growth
1
2
3
4
5
• Streamline Enrollment & Limit Disenrollmento How do we decrease enrollment time & resources
needed to enroll?o How do we ensure initial and continued satisfaction
of participants while we grow exponentially?
• Build Readiness for Growtho How do we forecast staffing, system, and facility
needs to support growth?o How do we develop staff to be change leaders?
• Foster Policy Environment That Enables Changeo How do we apply or change state policies impacting
growth?o How do we apply or change federal policies
impacting growth?
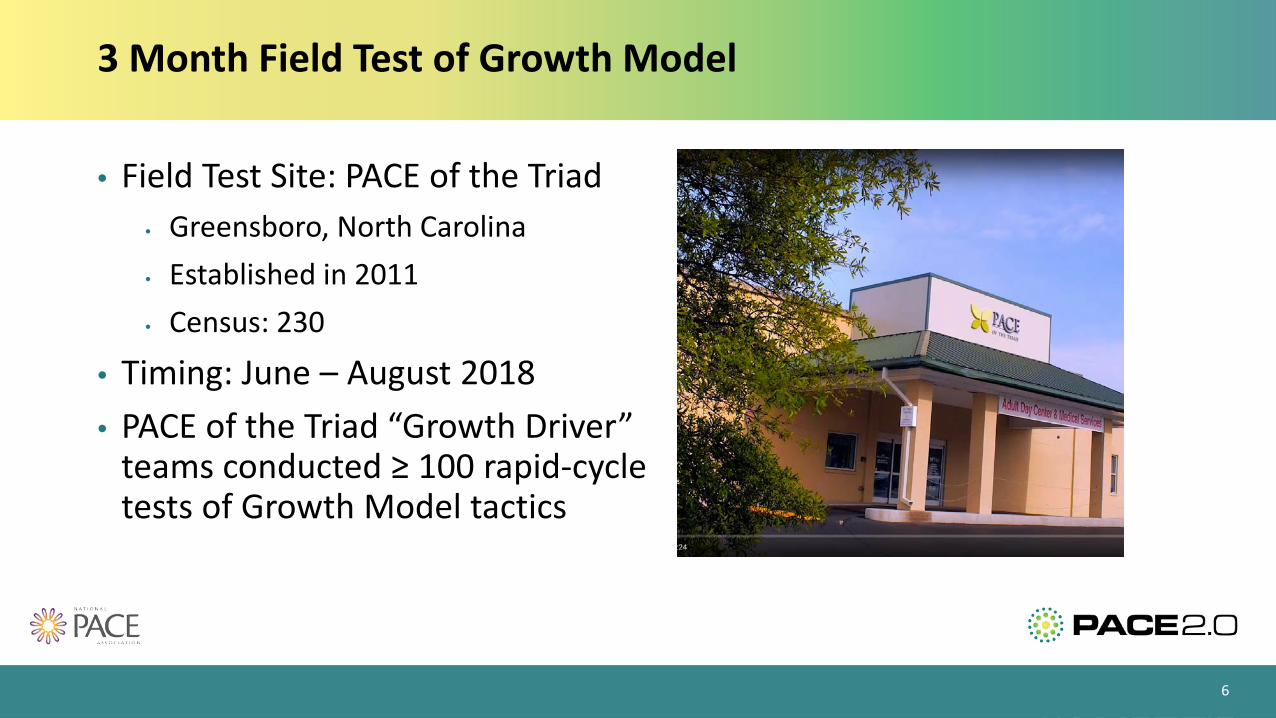
3 Month Field Test of Growth Model
• Field Test Site: PACE of the Triad• Greensboro, North Carolina• Established in 2011• Census: 230
• Timing: June – August 2018• PACE of the Triad “Growth Driver”
teams conducted ≥ 100 rapid-cycle tests of Growth Model tactics
6
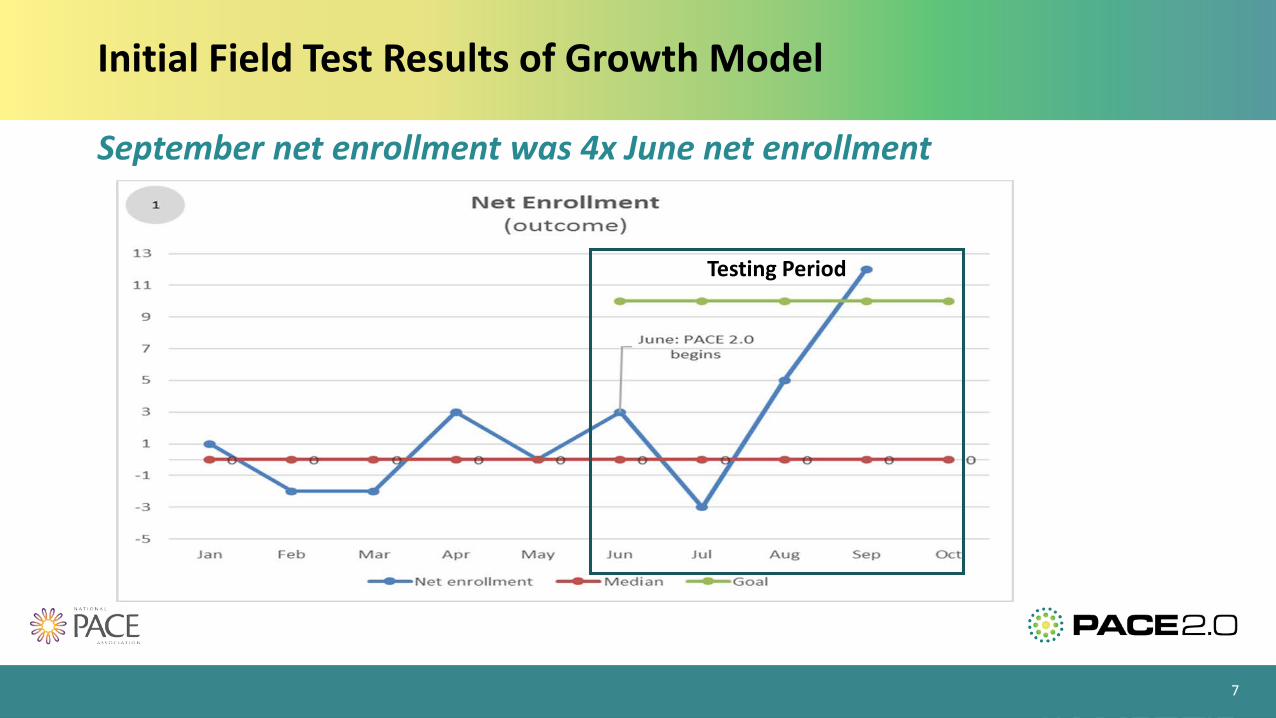
Initial Field Test Results of Growth Model
7
September net enrollment was 4x June net enrollment
Testing Period

Continued Spread & Refinement of Growth Tactics through the West Coast PACE 2.0 Learning Collaborative
West Coast Learning Collaborative:• Includes 10 PACE organizations from California,
Washington, and Oregon• Kicked-off with an in-person learning session on
October 3,2018• Will continue for 12-months • Participants conduct rapid cycle tests of tactics, collect
data, and share lessons learning
8
Learnings will be incorporated in the driver diagram and shared with the broader NPA membership
What is a Driver Diagram?
• Tree Diagram organized to depict a Theory of Changeo Shared view of what the new system will includeo Prediction that chosen drivers will result in progress towards your aimo Depicts a causal relationship between the drivers and the aimo What elements or drivers will cause a desired effect
• Not statico Updated regularly as we learn what is needed to reach the aim
9
What is a Driver Diagram? (Continued)
• Explains a project’s purpose and how project activities will deliver that aim• Reinforces desired project outcomes, or aim• Defines:
o Key leverage points, or “drivers,” in the systemo How project progress and results should be measured and monitored
• Links specific project activities and changes - (the “Hows”) to key components in the system
10
What is a Driver Diagram? (Continued)
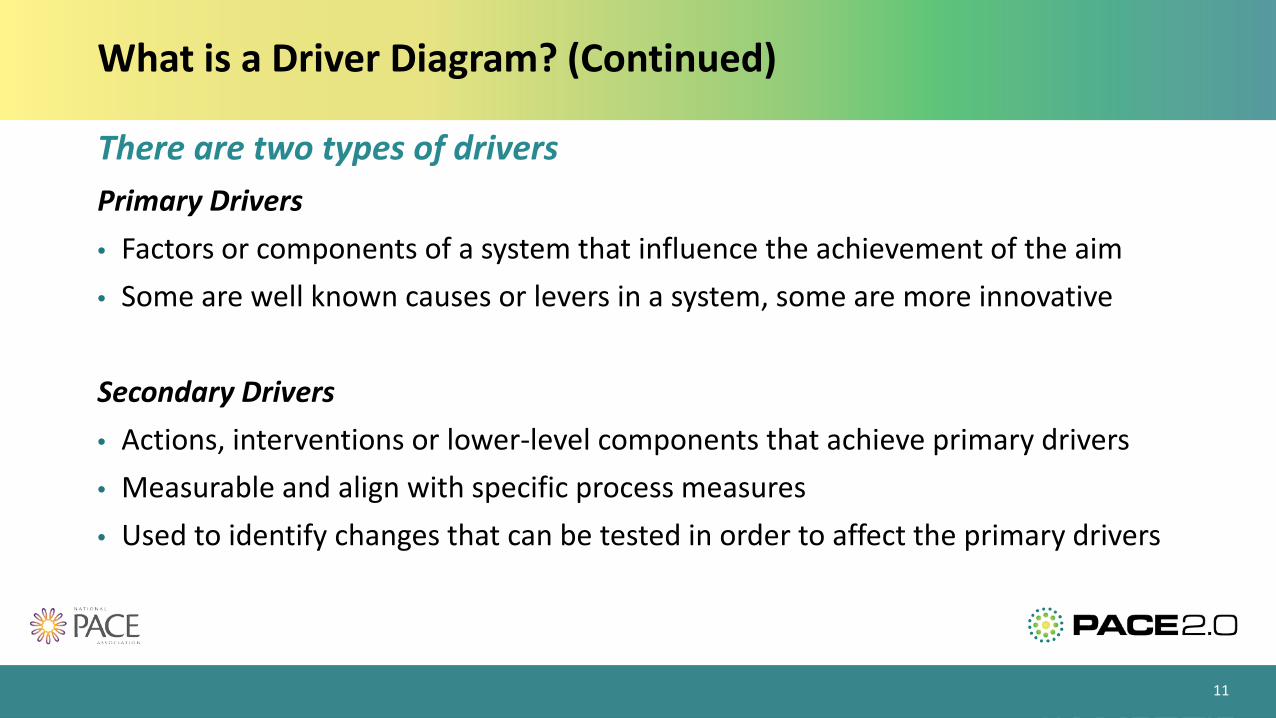
Primary Drivers • Factors or components of a system that influence the achievement of the aim• Some are well known causes or levers in a system, some are more innovative
Secondary Drivers • Actions, interventions or lower-level components that achieve primary drivers• Measurable and align with specific process measures• Used to identify changes that can be tested in order to affect the primary drivers
11
There are two types of drivers
What is a Driver Diagram? (Continued)
12
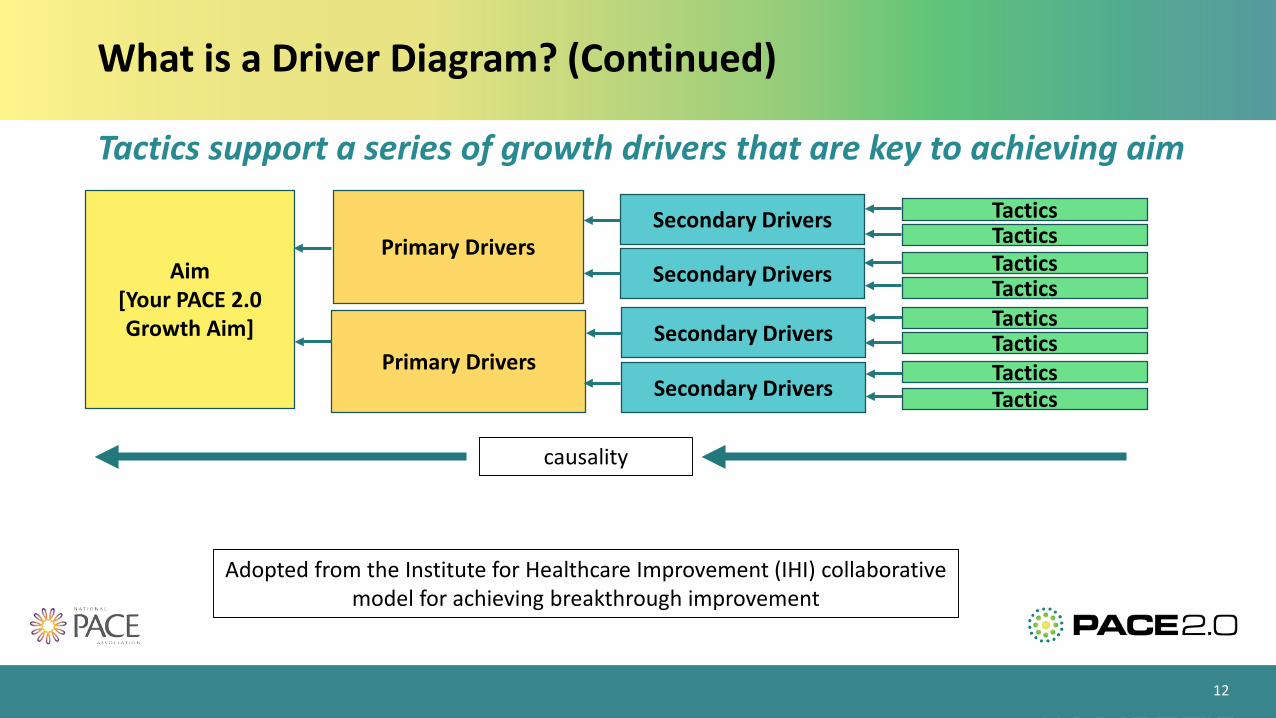
Tactics support a series of growth drivers that are key to achieving aim
Aim[Your PACE 2.0 Growth Aim]
Secondary DriversPrimary Drivers
Primary Drivers
Secondary Drivers
Secondary Drivers
Secondary Drivers
TacticsTacticsTacticsTacticsTacticsTacticsTacticsTactics
Adopted from the Institute for Healthcare Improvement (IHI) collaborative model for achieving breakthrough improvement
causality
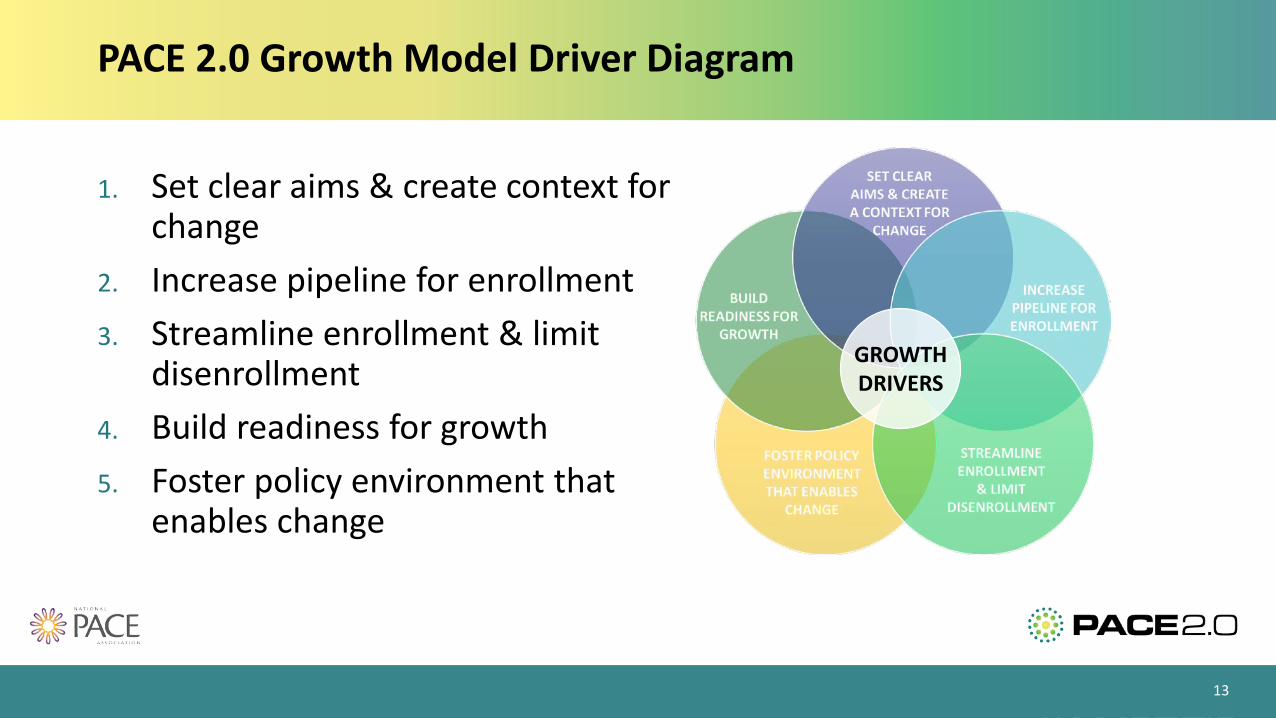
PACE 2.0 Growth Model Driver Diagram
1. Set clear aims & create context for change
2. Increase pipeline for enrollment3. Streamline enrollment & limit
disenrollment4. Build readiness for growth5. Foster policy environment that
enables change
13
GROWTHDRIVERS
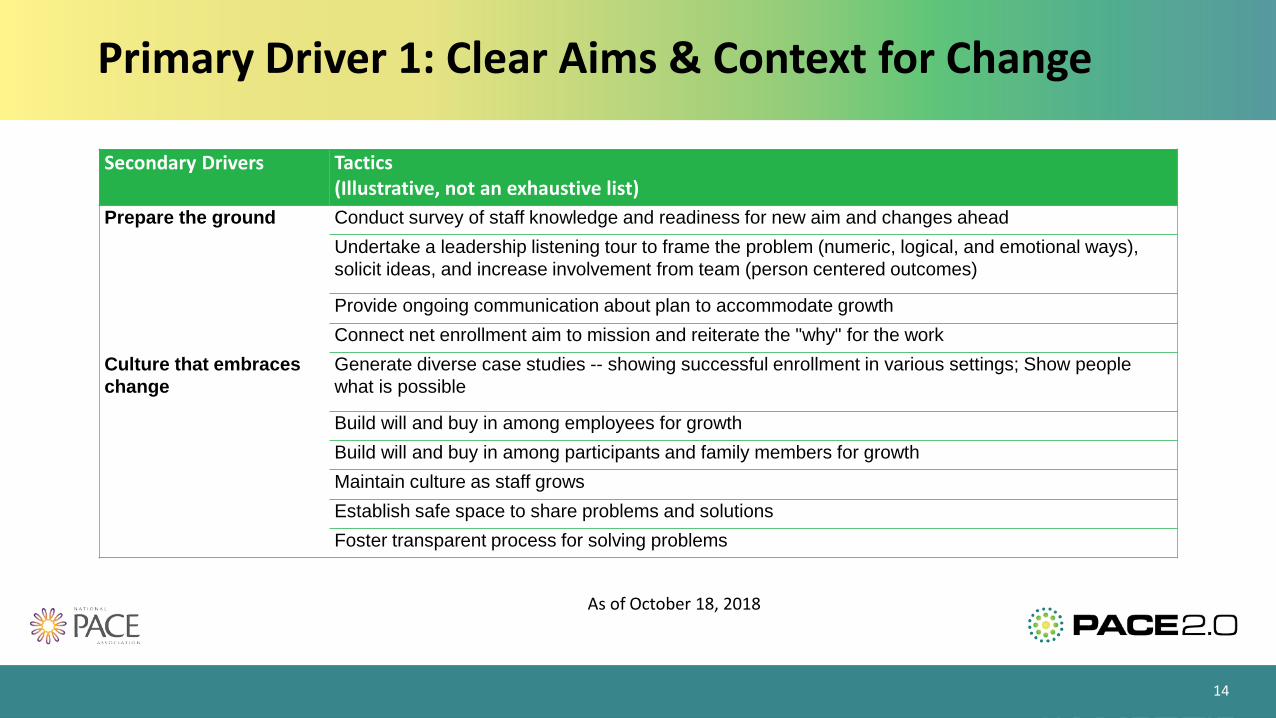
Primary Driver 1: Clear Aims & Context for Change
14
Secondary Drivers Tactics(Illustrative, not an exhaustive list)
Prepare the ground Conduct survey of staff knowledge and readiness for new aim and changes aheadUndertake a leadership listening tour to frame the problem (numeric, logical, and emotional ways), solicit ideas, and increase involvement from team (person centered outcomes)
Provide ongoing communication about plan to accommodate growthConnect net enrollment aim to mission and reiterate the "why" for the work
Culture that embraces change
Generate diverse case studies -- showing successful enrollment in various settings; Show people what is possible
Build will and buy in among employees for growthBuild will and buy in among participants and family members for growthMaintain culture as staff growsEstablish safe space to share problems and solutionsFoster transparent process for solving problems
As of October 18, 2018

Secondary Drivers Tactics(Illustrative, not an exhaustive list)
Market potential for your specific PACE organization
Conduct analysis of top 5 or 10 referral sources to direct outreach activitiesIdentify unmet needs in specific communities and geographiesSet targets for number of calls/visits for marketing/intake staff and measure effectiveness
Brand awareness in the community
Create virtual PACE tourCreate an information toolkit for promotion and education about PACE (talking points, virtual PACE tour, testimonials, participant stories)Brand PACE vans with PACE logoMarket through traditional mediaEstablish a marketing budget to support growth
Targeted outreach Identify and partner with community based organizations that specialize in specific sub-populations for referralsTarget potential participants who are known to be eligible (i.e., Medicaid beneficiaries)Conduct outreach presentations in the communityIncrease referrals from participantsIncrease referrals from staffIncrease referrals from participant family members and caregivers
Primary Driver 2: Pipeline for Enrollment
15
As of October 18, 2018
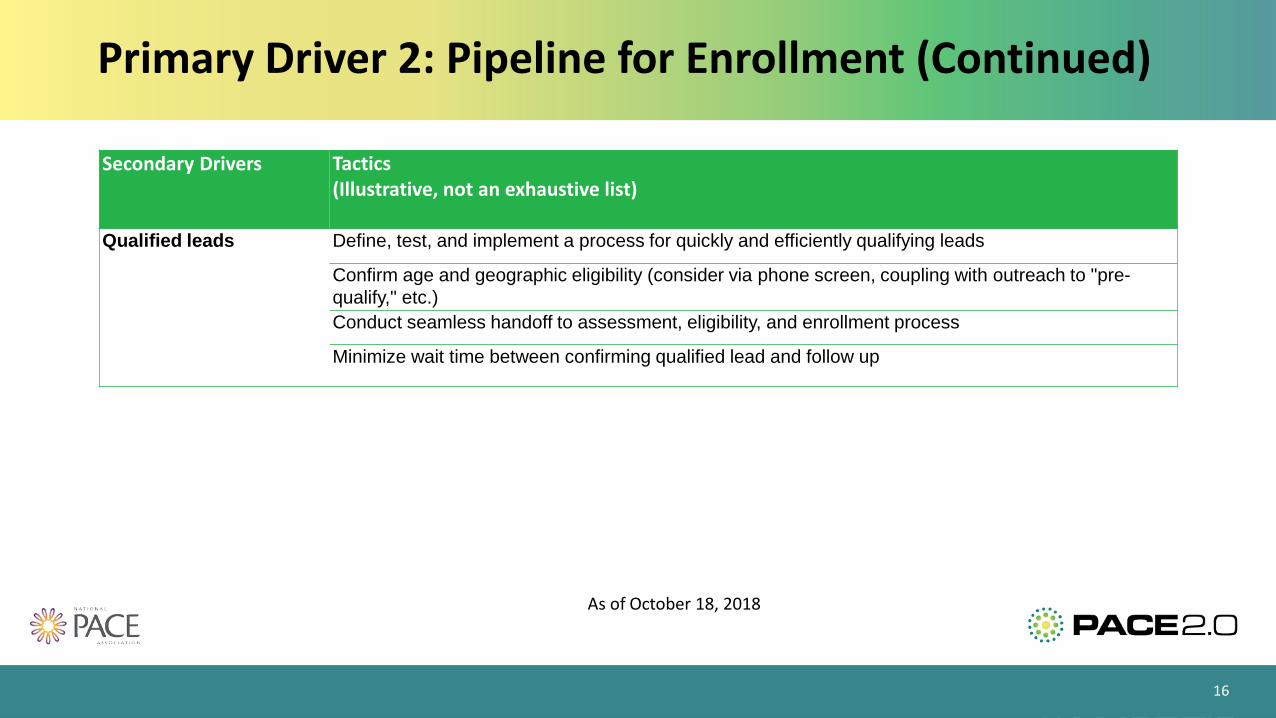
Secondary Drivers Tactics(Illustrative, not an exhaustive list)
Qualified leads Define, test, and implement a process for quickly and efficiently qualifying leads
Confirm age and geographic eligibility (consider via phone screen, coupling with outreach to "pre-qualify," etc.) Conduct seamless handoff to assessment, eligibility, and enrollment process
Minimize wait time between confirming qualified lead and follow up
Primary Driver 2: Pipeline for Enrollment (Continued)
16
As of October 18, 2018
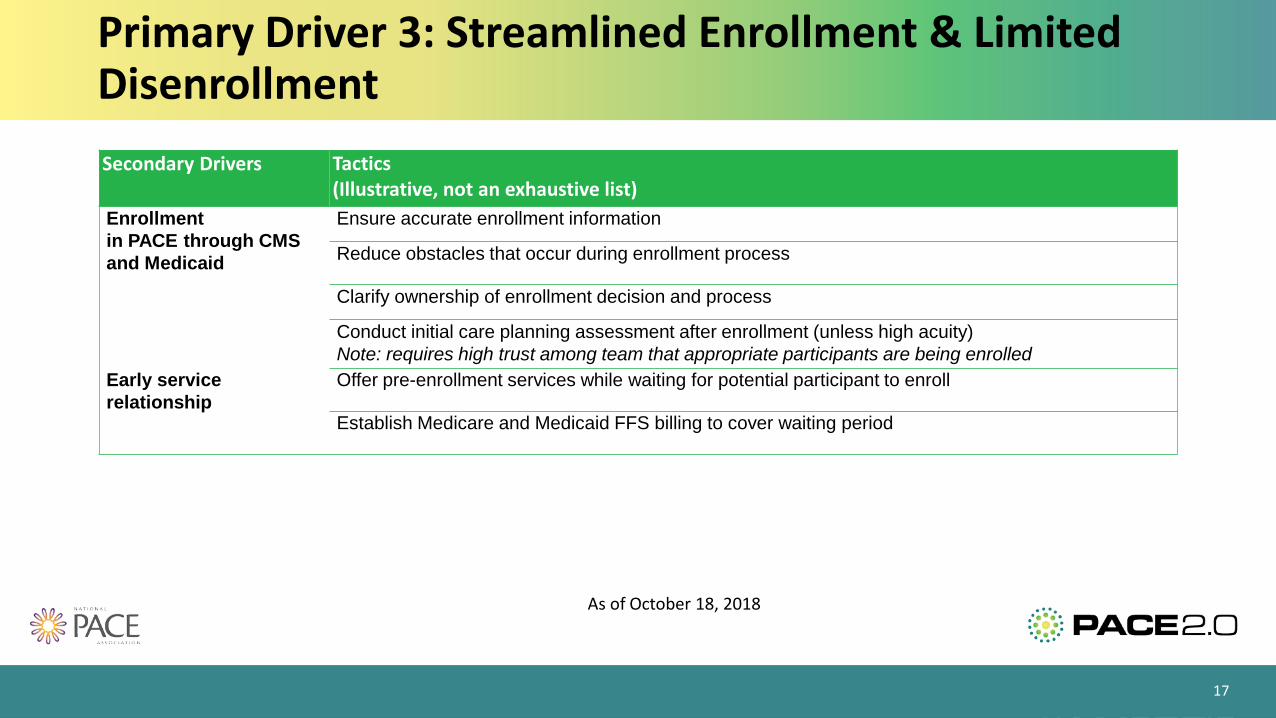
Secondary Drivers Tactics(Illustrative, not an exhaustive list)
Enrollmentin PACE through CMS and Medicaid
Ensure accurate enrollment information
Reduce obstacles that occur during enrollment process
Clarify ownership of enrollment decision and process
Conduct initial care planning assessment after enrollment (unless high acuity)Note: requires high trust among team that appropriate participants are being enrolled
Early service relationship
Offer pre-enrollment services while waiting for potential participant to enroll
Establish Medicare and Medicaid FFS billing to cover waiting period
Primary Driver 3: Streamlined Enrollment & Limited Disenrollment
17
As of October 18, 2018
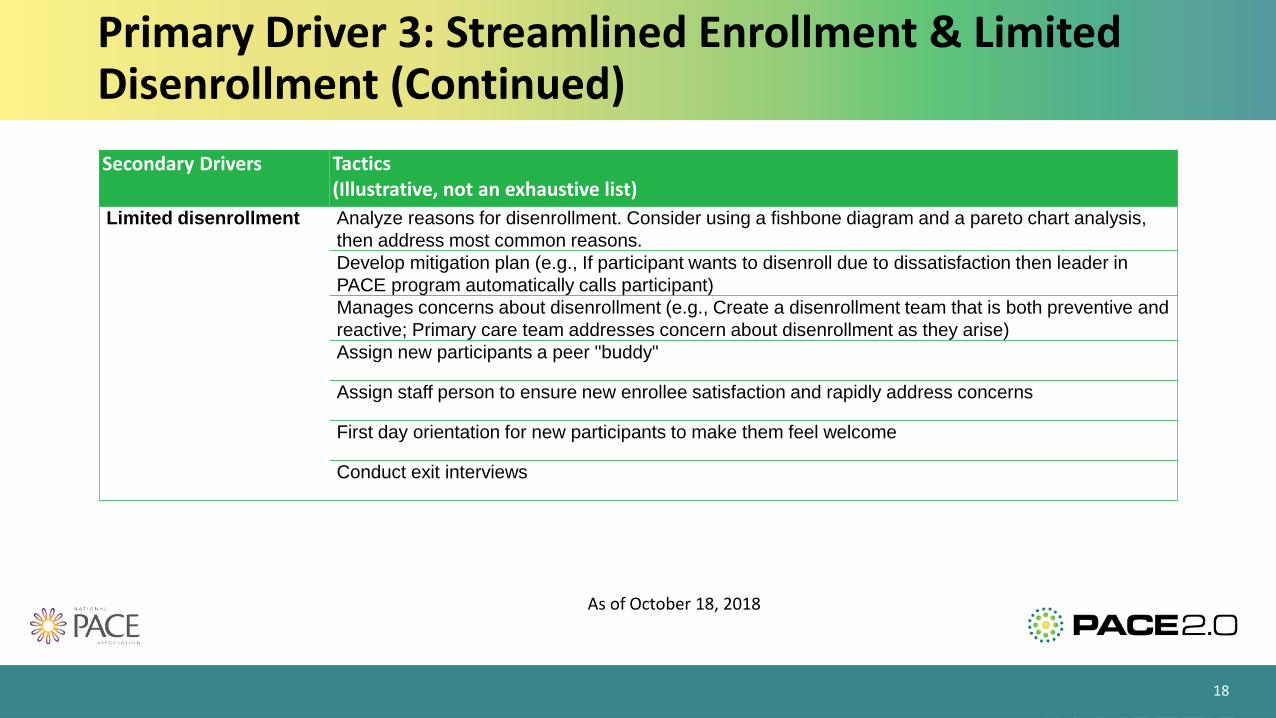
Secondary Drivers Tactics(Illustrative, not an exhaustive list)
Limited disenrollment Analyze reasons for disenrollment. Consider using a fishbone diagram and a pareto chart analysis, then address most common reasons.Develop mitigation plan (e.g., If participant wants to disenroll due to dissatisfaction then leader in PACE program automatically calls participant)Manages concerns about disenrollment (e.g., Create a disenrollment team that is both preventive and reactive; Primary care team addresses concern about disenrollment as they arise)Assign new participants a peer "buddy"
Assign staff person to ensure new enrollee satisfaction and rapidly address concerns
First day orientation for new participants to make them feel welcome
Conduct exit interviews
Primary Driver 3: Streamlined Enrollment & Limited Disenrollment (Continued)
18
As of October 18, 2018
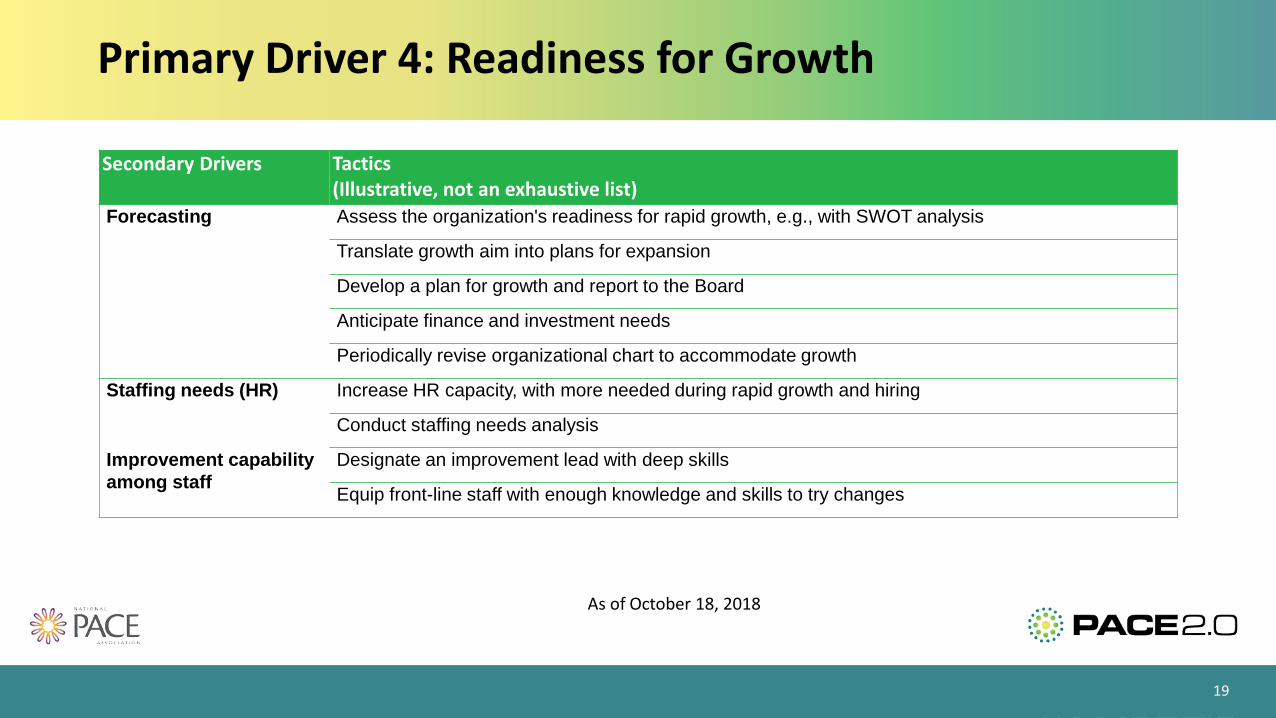
Secondary Drivers Tactics(Illustrative, not an exhaustive list)
Forecasting Assess the organization's readiness for rapid growth, e.g., with SWOT analysis
Translate growth aim into plans for expansion
Develop a plan for growth and report to the Board
Anticipate finance and investment needs
Periodically revise organizational chart to accommodate growth
Staffing needs (HR) Increase HR capacity, with more needed during rapid growth and hiring
Conduct staffing needs analysis
Improvement capability among staff
Designate an improvement lead with deep skills
Equip front-line staff with enough knowledge and skills to try changes
Primary Driver 4: Readiness for Growth
19
As of October 18, 2018
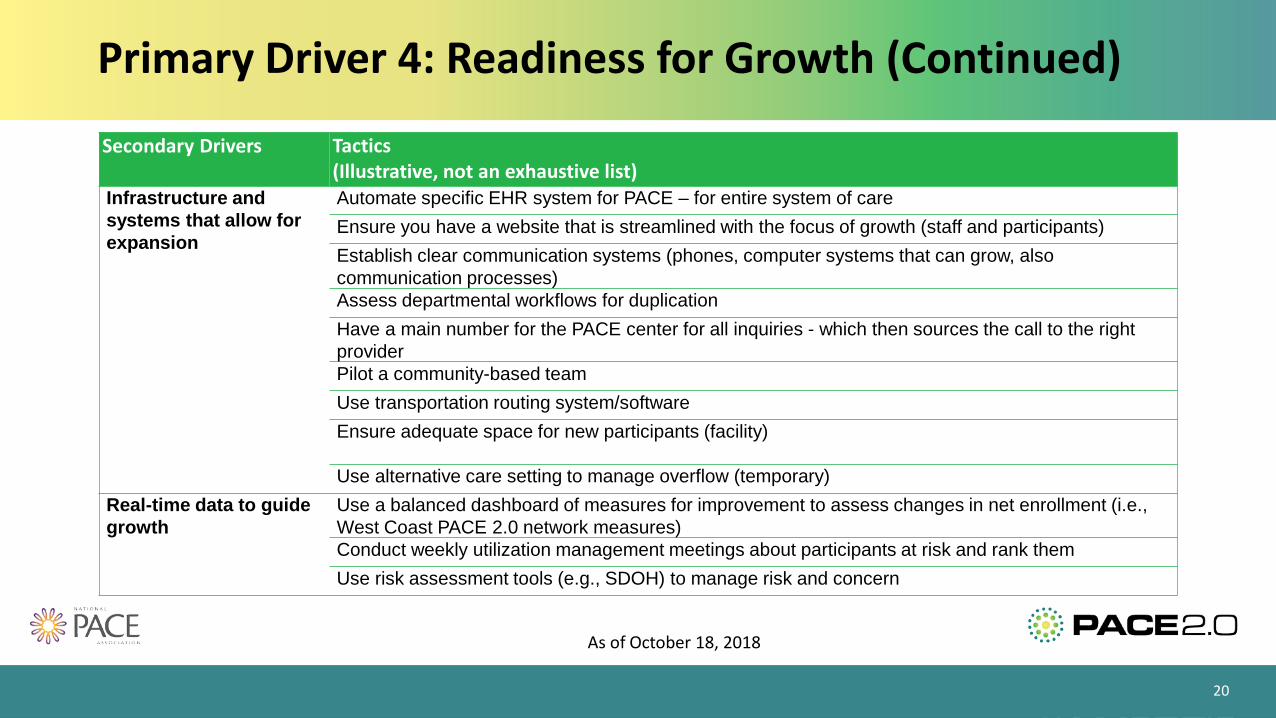
Secondary Drivers Tactics(Illustrative, not an exhaustive list)
Infrastructure and systems that allow for expansion
Automate specific EHR system for PACE – for entire system of careEnsure you have a website that is streamlined with the focus of growth (staff and participants)Establish clear communication systems (phones, computer systems that can grow, also communication processes)Assess departmental workflows for duplicationHave a main number for the PACE center for all inquiries - which then sources the call to the right providerPilot a community-based teamUse transportation routing system/softwareEnsure adequate space for new participants (facility)
Use alternative care setting to manage overflow (temporary)Real-time data to guide growth
Use a balanced dashboard of measures for improvement to assess changes in net enrollment (i.e., West Coast PACE 2.0 network measures)Conduct weekly utilization management meetings about participants at risk and rank themUse risk assessment tools (e.g., SDOH) to manage risk and concern
Primary Driver 4: Readiness for Growth (Continued)
20
As of October 18, 2018
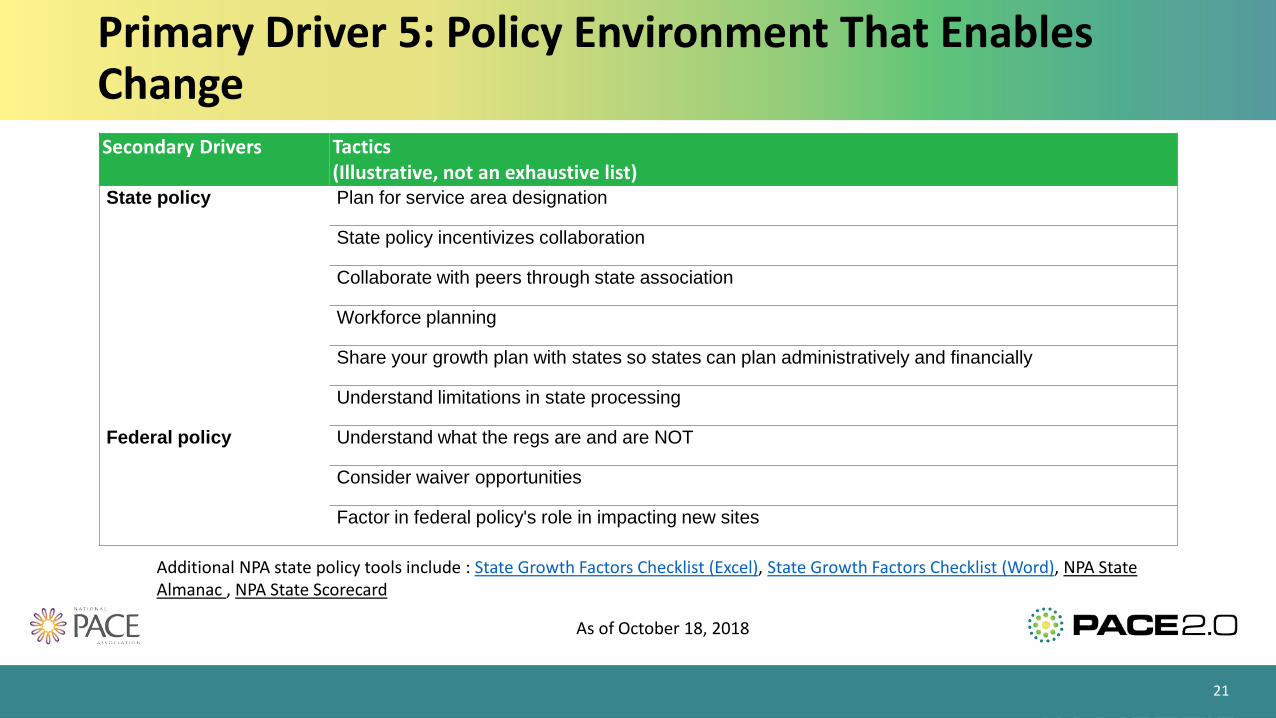
Secondary Drivers Tactics(Illustrative, not an exhaustive list)
State policy Plan for service area designation
State policy incentivizes collaboration
Collaborate with peers through state association
Workforce planning
Share your growth plan with states so states can plan administratively and financially
Understand limitations in state processing
Federal policy Understand what the regs are and are NOT
Consider waiver opportunities
Factor in federal policy's role in impacting new sites
Primary Driver 5: Policy Environment That Enables Change
21
Additional NPA state policy tools include : State Growth Factors Checklist (Excel), State Growth Factors Checklist (Word), NPA State Almanac , NPA State Scorecard
As of October 18, 2018
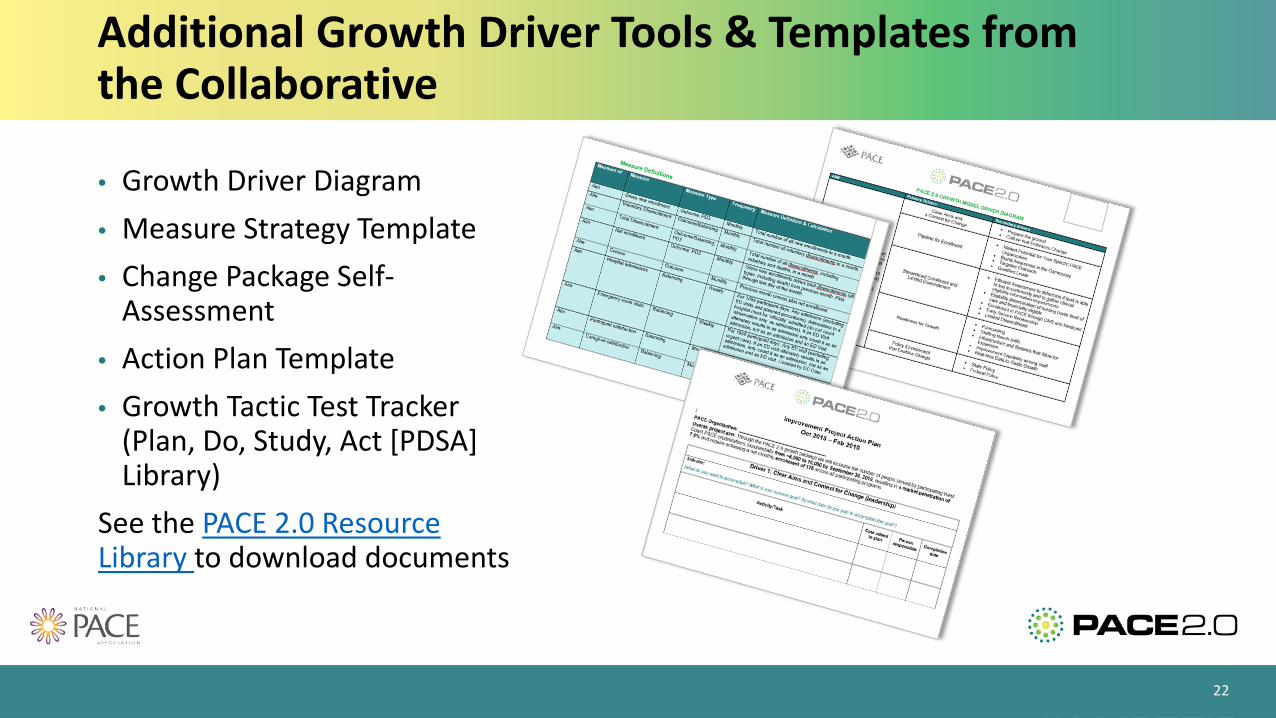
• Growth Driver Diagram• Measure Strategy Template• Change Package Self-
Assessment• Action Plan Template• Growth Tactic Test Tracker
(Plan, Do, Study, Act [PDSA] Library)
See the PACE 2.0 Resource Library to download documents
Additional Growth Driver Tools & Templates from the Collaborative
22

How to Use the Driver Diagram
• Review potential tactics for each driver• Before implementing tactics, we recommend conducting small-scale tests to confirm and make
site-specific refinements, including:o Plan – Define specific plan for testing a tactic as well as a prediction of the test’s outcomeo Do – Test the growth tactico Study – Compare results to predictiono Act – Based on the study of the test
Further refine and test if results did not meet improvement expectations Or, test with a larger audience until evidence of positive improvement on a smaller scale
demonstrates readiness for broad-based implementation
• We strongly recommend that organizations track key change measures to help:o Assess impacts from tactics o Identify potential focus areas for supporting growth
23
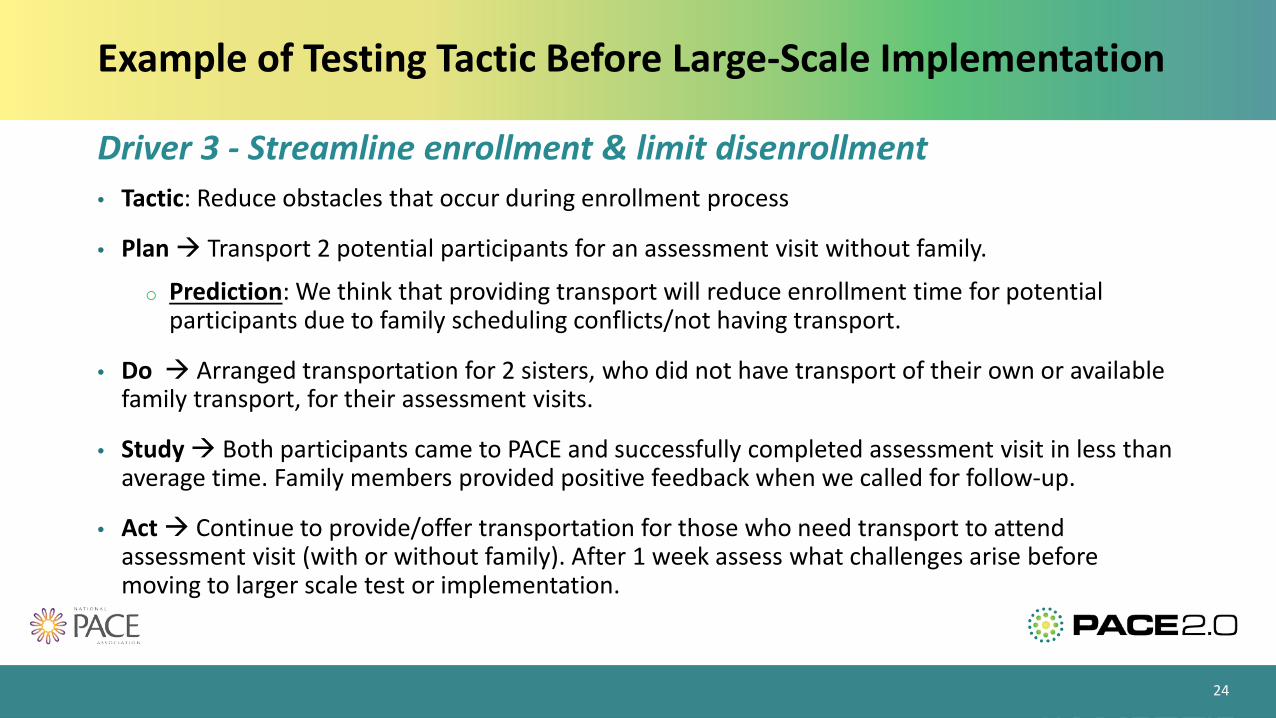
Example of Testing Tactic Before Large-Scale Implementation
24
Driver 3 - Streamline enrollment & limit disenrollment• Tactic: Reduce obstacles that occur during enrollment process
• Plan Transport 2 potential participants for an assessment visit without family.
o Prediction: We think that providing transport will reduce enrollment time for potential participants due to family scheduling conflicts/not having transport.
• Do Arranged transportation for 2 sisters, who did not have transport of their own or available family transport, for their assessment visits.
• Study Both participants came to PACE and successfully completed assessment visit in less than average time. Family members provided positive feedback when we called for follow-up.
• Act Continue to provide/offer transportation for those who need transport to attend assessment visit (with or without family). After 1 week assess what challenges arise before moving to larger scale test or implementation.
Growth Model Measures
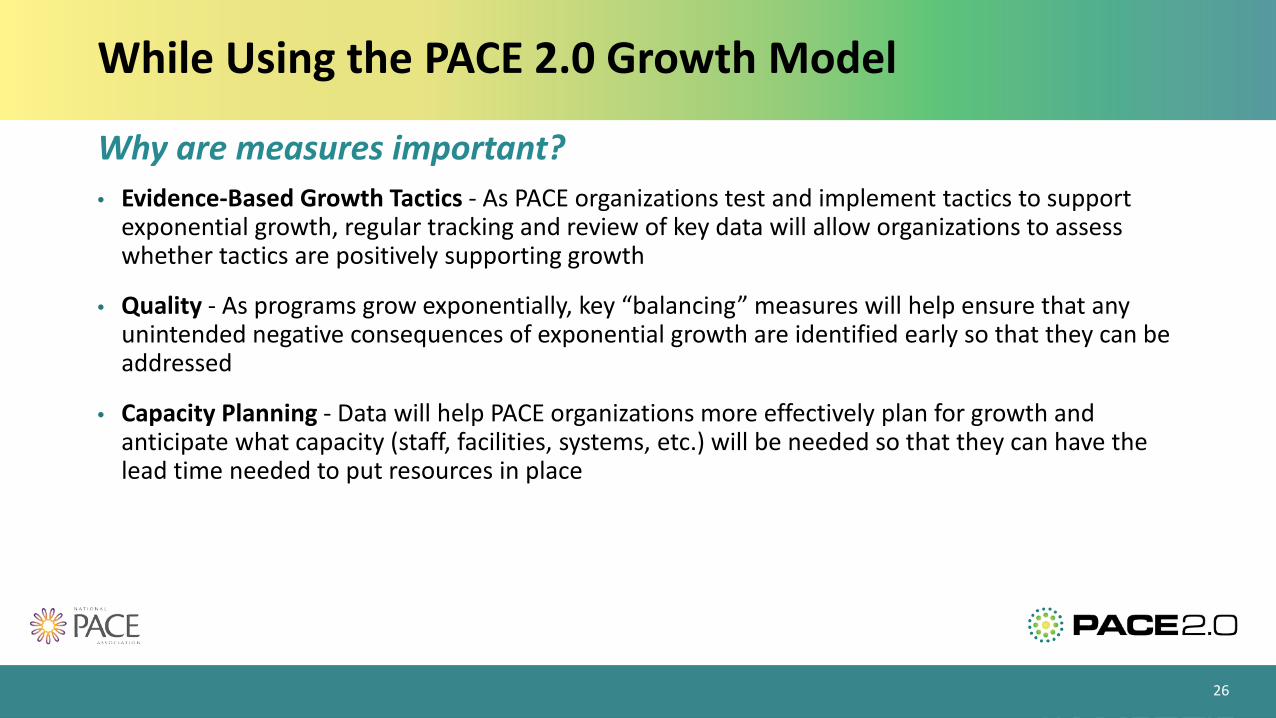
While Using the PACE 2.0 Growth Model
26
Why are measures important?• Evidence-Based Growth Tactics - As PACE organizations test and implement tactics to support
exponential growth, regular tracking and review of key data will allow organizations to assess whether tactics are positively supporting growth
• Quality - As programs grow exponentially, key “balancing” measures will help ensure that any unintended negative consequences of exponential growth are identified early so that they can be addressed
• Capacity Planning - Data will help PACE organizations more effectively plan for growth and anticipate what capacity (staff, facilities, systems, etc.) will be needed so that they can have the lead time needed to put resources in place
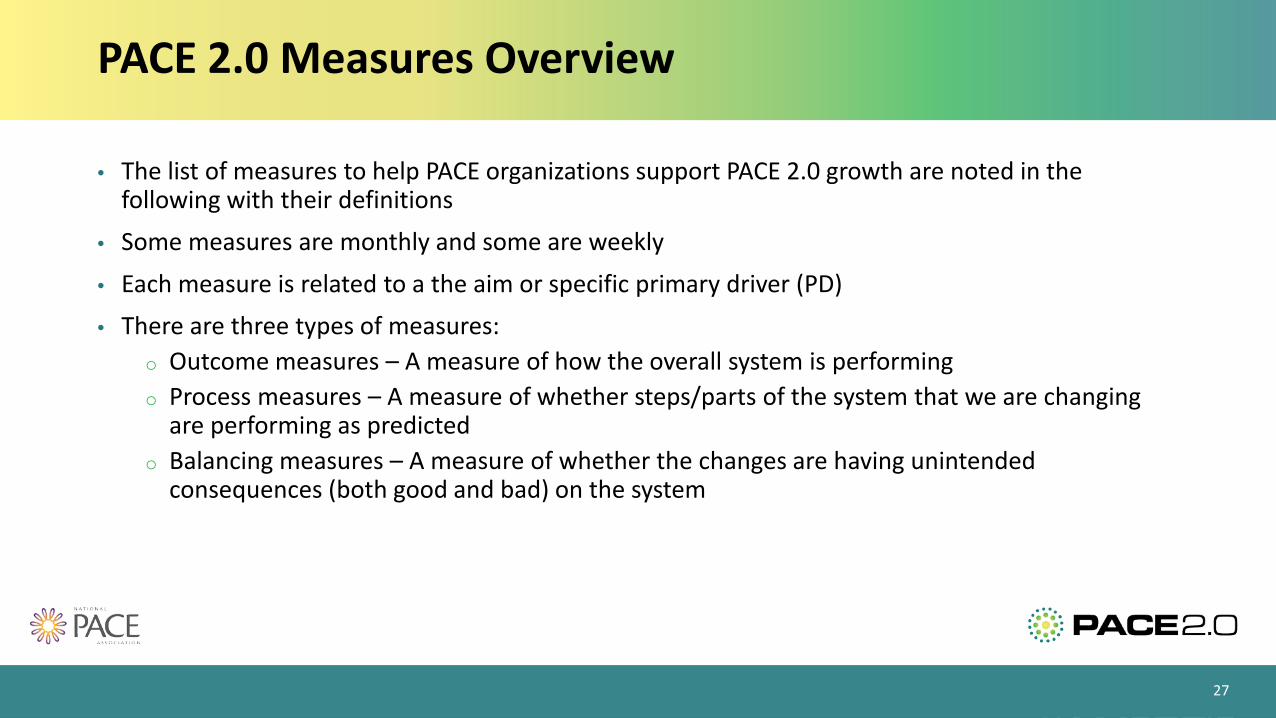
PACE 2.0 Measures Overview
• The list of measures to help PACE organizations support PACE 2.0 growth are noted in the following with their definitions
• Some measures are monthly and some are weekly
• Each measure is related to a the aim or specific primary driver (PD)• There are three types of measures:
o Outcome measures – A measure of how the overall system is performingo Process measures – A measure of whether steps/parts of the system that we are changing
are performing as predictedo Balancing measures – A measure of whether the changes are having unintended
consequences (both good and bad) on the system
27
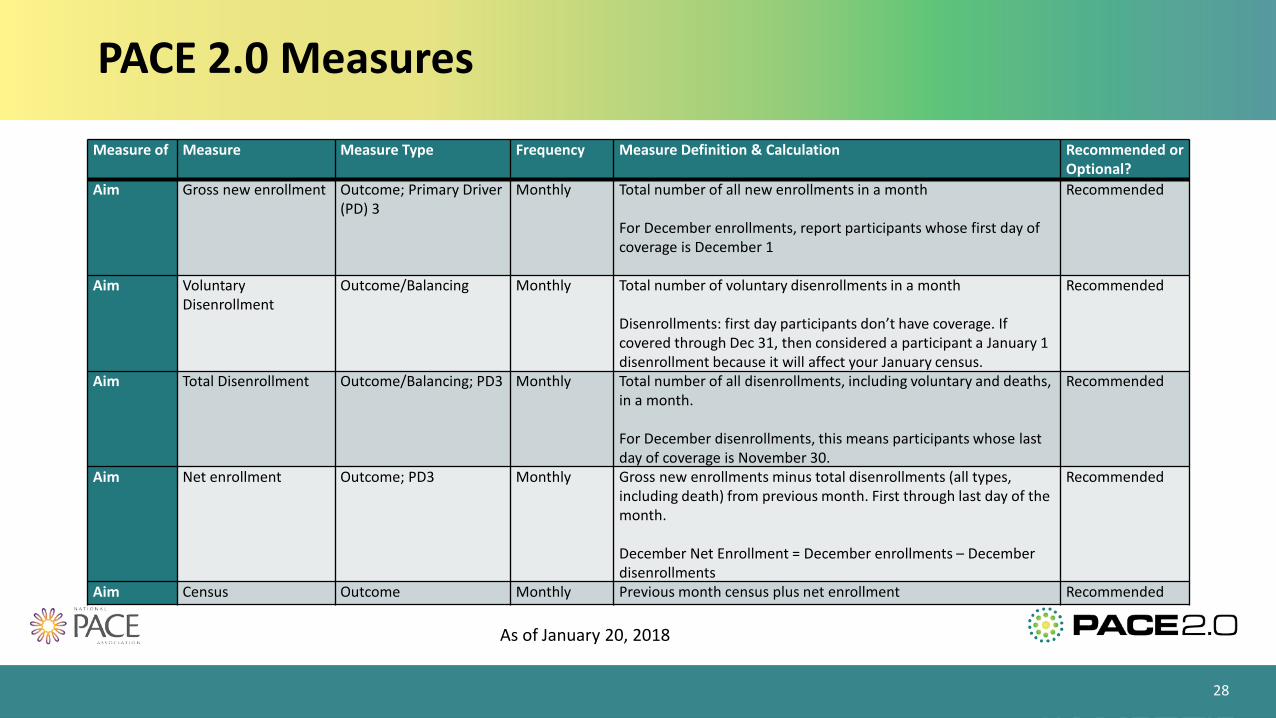
PACE 2.0 Measures
28
Measure of Measure Measure Type Frequency Measure Definition & Calculation Recommended or Optional?
Aim Gross new enrollment Outcome; Primary Driver (PD) 3
Monthly Total number of all new enrollments in a month
For December enrollments, report participants whose first day of coverage is December 1
Recommended
Aim Voluntary Disenrollment
Outcome/Balancing Monthly Total number of voluntary disenrollments in a month
Disenrollments: first day participants don’t have coverage. If covered through Dec 31, then considered a participant a January 1 disenrollment because it will affect your January census.
Recommended
Aim Total Disenrollment Outcome/Balancing; PD3 Monthly Total number of all disenrollments, including voluntary and deaths, in a month.
For December disenrollments, this means participants whose last day of coverage is November 30.
Recommended
Aim Net enrollment Outcome; PD3 Monthly Gross new enrollments minus total disenrollments (all types, including death) from previous month. First through last day of the month.
December Net Enrollment = December enrollments – December disenrollments
Recommended
Aim Census Outcome Monthly Previous month census plus net enrollment Recommended
As of January 20, 2018
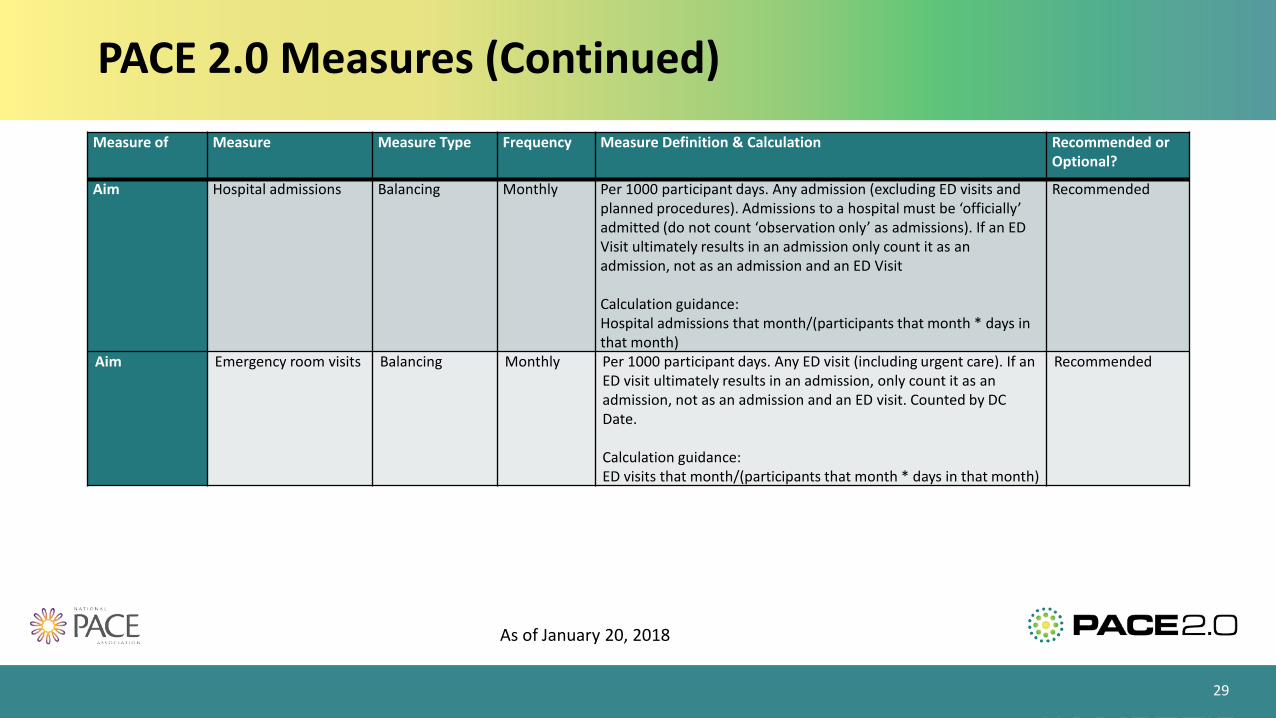
PACE 2.0 Measures (Continued)
29
Measure of Measure Measure Type Frequency Measure Definition & Calculation Recommended or Optional?
Aim Hospital admissions Balancing Monthly Per 1000 participant days. Any admission (excluding ED visits and planned procedures). Admissions to a hospital must be ‘officially’ admitted (do not count ‘observation only’ as admissions). If an ED Visit ultimately results in an admission only count it as an admission, not as an admission and an ED Visit
Calculation guidance:Hospital admissions that month/(participants that month * days in that month)
Recommended
Aim Emergency room visits Balancing Monthly Per 1000 participant days. Any ED visit (including urgent care). If an ED visit ultimately results in an admission, only count it as an admission, not as an admission and an ED visit. Counted by DC Date.
Calculation guidance:ED visits that month/(participants that month * days in that month)
Recommended
As of January 20, 2018
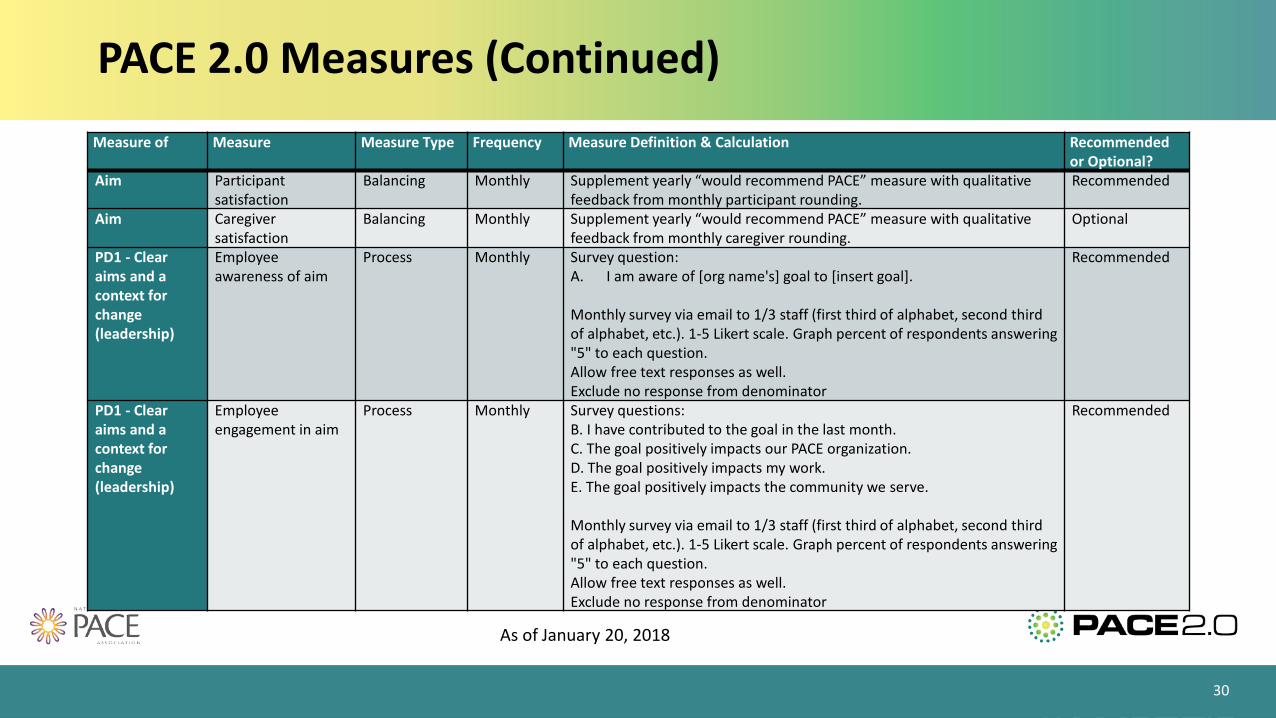
PACE 2.0 Measures (Continued)
30
Measure of Measure Measure Type Frequency Measure Definition & Calculation Recommended or Optional?
Aim Participant satisfaction
Balancing Monthly Supplement yearly “would recommend PACE” measure with qualitative feedback from monthly participant rounding.
Recommended
Aim Caregiver satisfaction
Balancing Monthly Supplement yearly “would recommend PACE” measure with qualitative feedback from monthly caregiver rounding.
Optional
PD1 - Clear aims and a context for change (leadership)
Employee awareness of aim
Process Monthly Survey question: A. I am aware of [org name's] goal to [insert goal].
Monthly survey via email to 1/3 staff (first third of alphabet, second third of alphabet, etc.). 1-5 Likert scale. Graph percent of respondents answering "5" to each question.Allow free text responses as well.Exclude no response from denominator
Recommended
PD1 - Clear aims and a context for change (leadership)
Employee engagement in aim
Process Monthly Survey questions:B. I have contributed to the goal in the last month. C. The goal positively impacts our PACE organization. D. The goal positively impacts my work. E. The goal positively impacts the community we serve.
Monthly survey via email to 1/3 staff (first third of alphabet, second third of alphabet, etc.). 1-5 Likert scale. Graph percent of respondents answering "5" to each question.Allow free text responses as well.Exclude no response from denominator
Recommended
As of January 20, 2018
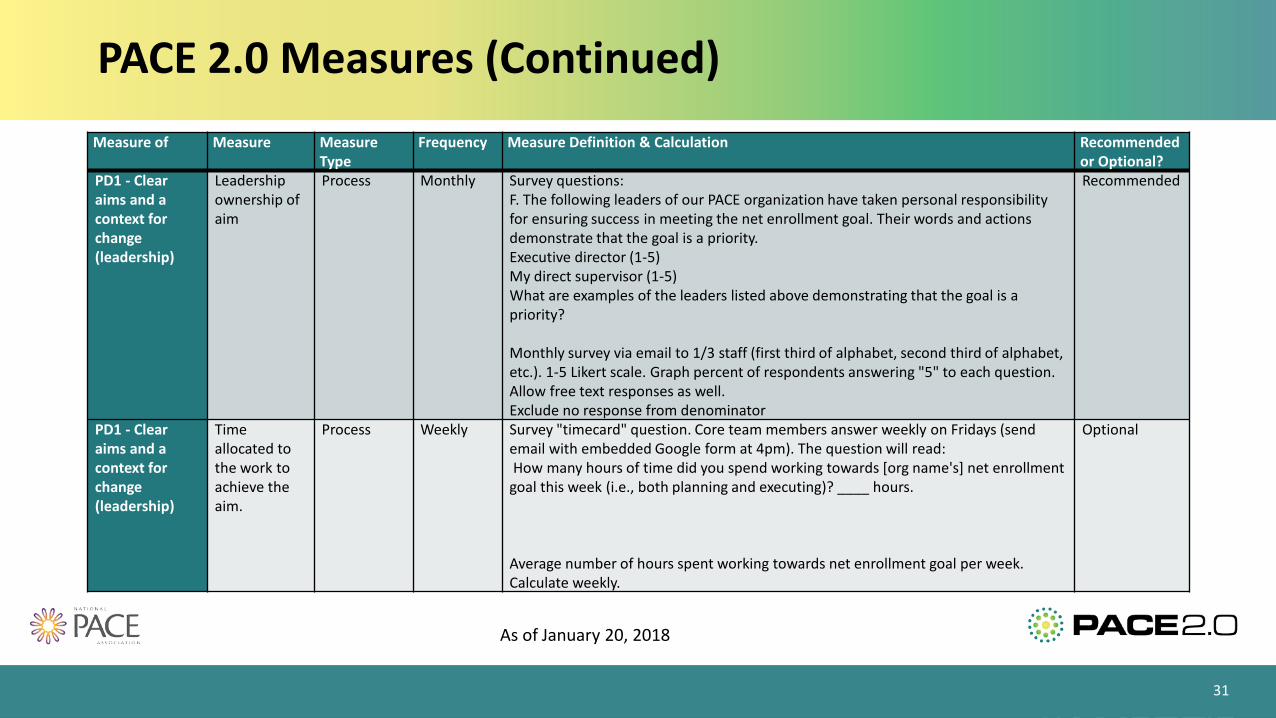
PACE 2.0 Measures (Continued)
31
Measure of Measure Measure Type
Frequency Measure Definition & Calculation Recommended or Optional?
PD1 - Clear aims and a context for change (leadership)
Leadership ownership of aim
Process Monthly Survey questions: F. The following leaders of our PACE organization have taken personal responsibility for ensuring success in meeting the net enrollment goal. Their words and actions demonstrate that the goal is a priority.Executive director (1-5)My direct supervisor (1-5)What are examples of the leaders listed above demonstrating that the goal is a priority?
Monthly survey via email to 1/3 staff (first third of alphabet, second third of alphabet, etc.). 1-5 Likert scale. Graph percent of respondents answering "5" to each question.Allow free text responses as well.Exclude no response from denominator
Recommended
PD1 - Clear aims and a context for change (leadership)
Time allocated to the work to achieve the aim.
Process Weekly Survey "timecard" question. Core team members answer weekly on Fridays (send email with embedded Google form at 4pm). The question will read:How many hours of time did you spend working towards [org name's] net enrollment
goal this week (i.e., both planning and executing)? ____ hours.
Average number of hours spent working towards net enrollment goal per week. Calculate weekly.
Optional
As of January 20, 2018

PACE 2.0 Measures (Continued)
32
Measure of Measure Measure Type
Frequency Measure Definition & Calculation Recommended or Optional?
PD2. Pipeline for Enrollment
Number of new inquiries
Process Weekly Number of unique inquiries about the PACE program (phone calls, emails) per week. Week is Sunday through Saturday.
Note: Over time this measure can be predictive of conversion rate to enrollment.
Recommended
PD2. Pipeline for Enrollment
Number of new qualified leads
Process Weekly A lead is qualified when a potential participant passes an initial screen of basic eligibility requirements for age and living within the service area. Whether the potential participant is approved by the county or state is not a requirement to be a qualified lead, nor is an assessment of the potential participant's ability to live safely in the community. Count number of qualified leads in a week as Sunday through Saturday.
Recommended
PD2. Pipeline for Enrollment
Conversion rate to enrollment (from qualified lead)
Process Monthly From qualified lead to actual enrollment.
Numerator: number of enrollments in a calendar month
Denominator: Number of qualified leads in total pipeline (i.e., determined to live in your service area and be age 55 or older; you may know more about them including their Medicaid status but that is not necessary for them to be considered “qualified”)
Recommended
As of January 20, 2018
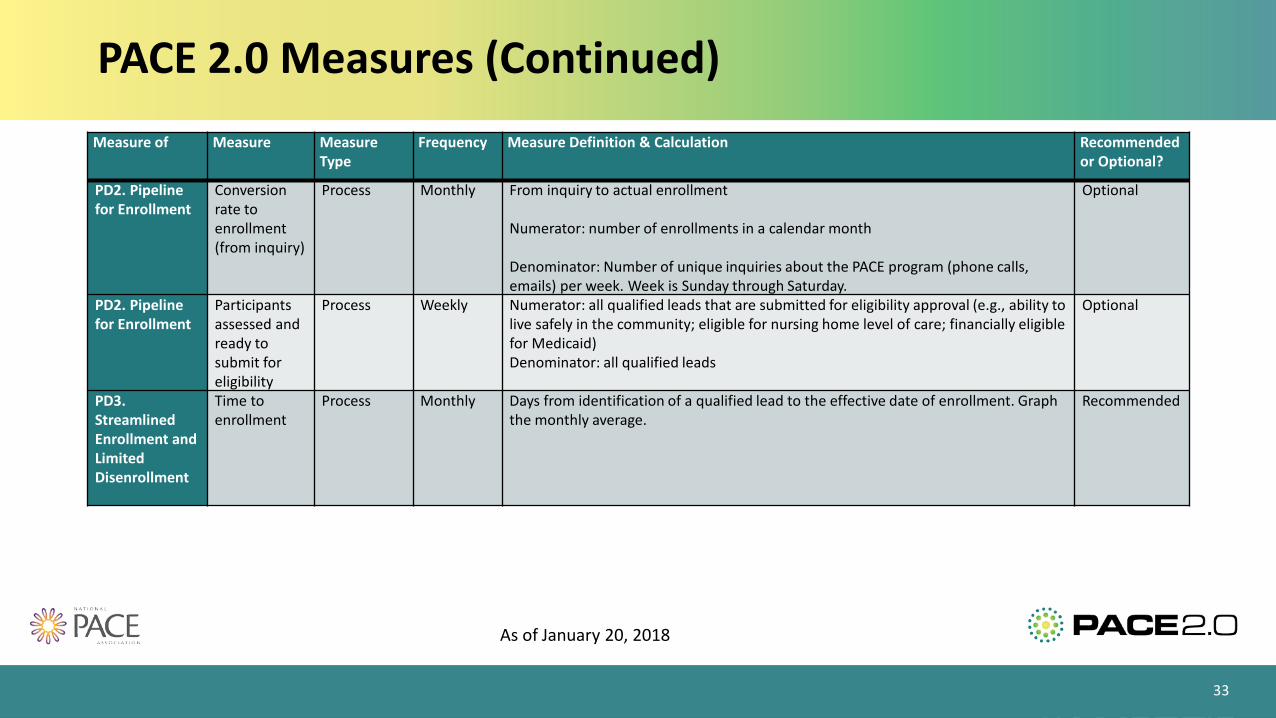
PACE 2.0 Measures (Continued)
33
Measure of Measure Measure Type
Frequency Measure Definition & Calculation Recommended or Optional?
PD2. Pipeline for Enrollment
Conversion rate to enrollment (from inquiry)
Process Monthly From inquiry to actual enrollment
Numerator: number of enrollments in a calendar month
Denominator: Number of unique inquiries about the PACE program (phone calls, emails) per week. Week is Sunday through Saturday.
Optional
PD2. Pipeline for Enrollment
Participants assessed and ready to submit for eligibility
Process Weekly Numerator: all qualified leads that are submitted for eligibility approval (e.g., ability to live safely in the community; eligible for nursing home level of care; financially eligible for Medicaid)Denominator: all qualified leads
Optional
PD3. Streamlined Enrollment and Limited Disenrollment
Time to enrollment
Process Monthly Days from identification of a qualified lead to the effective date of enrollment. Graph the monthly average.
Recommended
As of January 20, 2018
PACE 2.0 Measures (Continued)
34
Measure of Measure Measure Type
Frequency Measure Definition & Calculation Recommended or Optional?
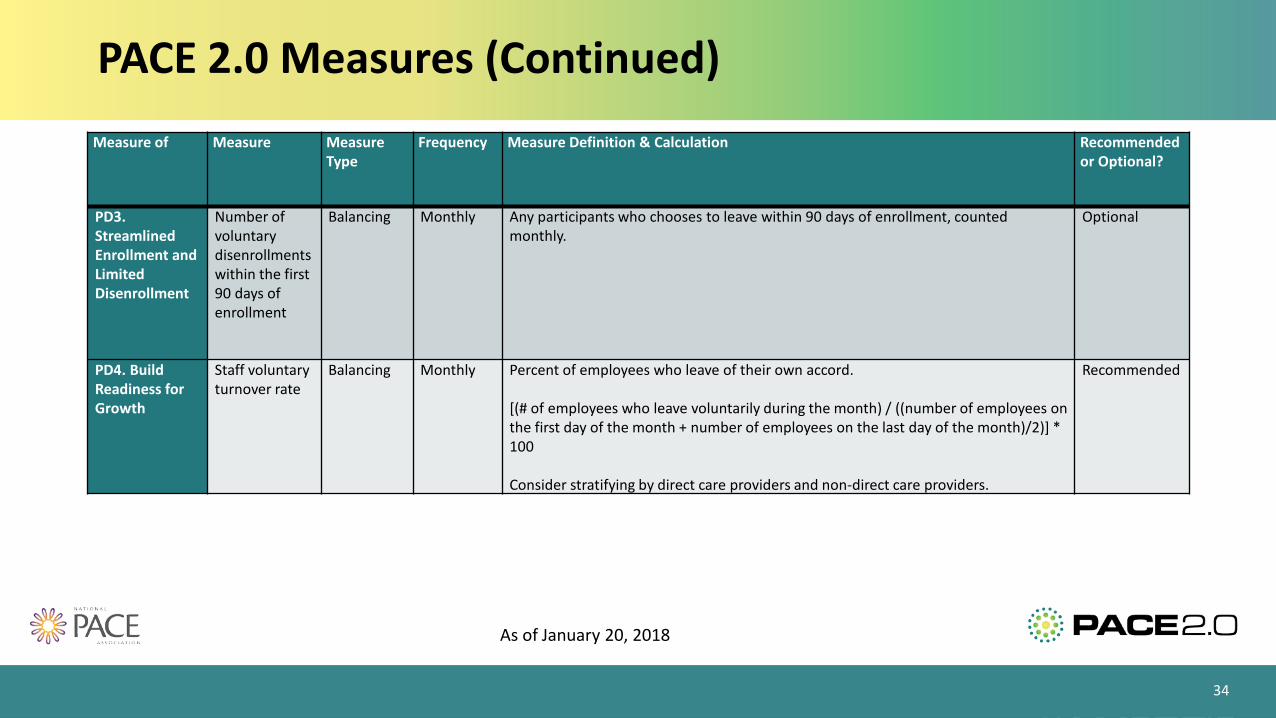
PD3. Streamlined Enrollment and Limited Disenrollment
Number of voluntary disenrollments within the first 90 days of enrollment
Balancing Monthly Any participants who chooses to leave within 90 days of enrollment, counted monthly.
Optional
PD4. Build Readiness for Growth
Staff voluntary turnover rate
Balancing Monthly Percent of employees who leave of their own accord.
[(# of employees who leave voluntarily during the month) / ((number of employees on the first day of the month + number of employees on the last day of the month)/2)] * 100
Consider stratifying by direct care providers and non-direct care providers.
Recommended
As of January 20, 2018
PACE 2.0 Measures (Continued)
35
Measure of Measure Measure Type
Frequency Measure Definition & Calculation Recommended or Optional?
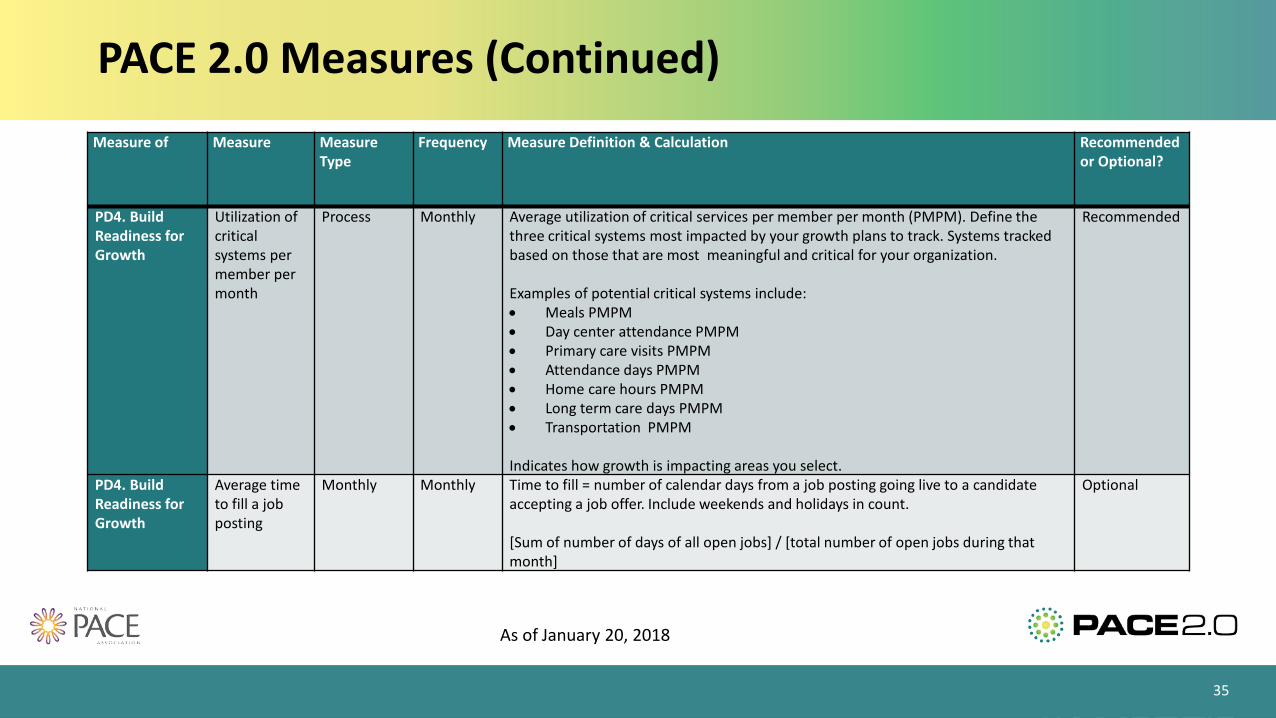
PD4. Build Readiness for Growth
Utilization of critical systems per member per month
Process Monthly Average utilization of critical services per member per month (PMPM). Define the three critical systems most impacted by your growth plans to track. Systems tracked based on those that are most meaningful and critical for your organization.
Examples of potential critical systems include:• Meals PMPM• Day center attendance PMPM• Primary care visits PMPM• Attendance days PMPM• Home care hours PMPM• Long term care days PMPM• Transportation PMPM
Indicates how growth is impacting areas you select.
Recommended
PD4. Build Readiness for Growth
Average time to fill a job posting
Monthly Monthly Time to fill = number of calendar days from a job posting going live to a candidate accepting a job offer. Include weekends and holidays in count.
[Sum of number of days of all open jobs] / [total number of open jobs during that month]
Optional
As of January 20, 2018
PACE 2.0 Measures (Continued)
36
Measure of Measure Measure Type
Frequency Measure Definition & Calculation Recommended or Optional?
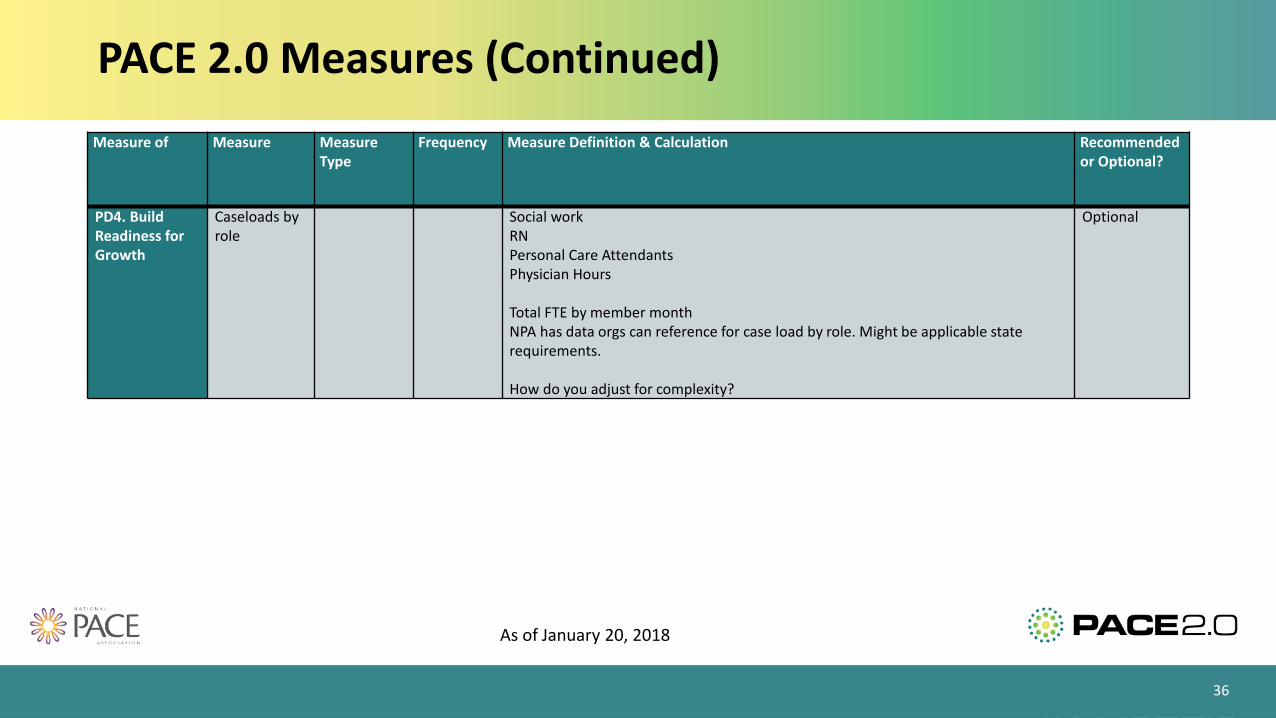
PD4. Build Readiness for Growth
Caseloads by role
Social workRNPersonal Care Attendants Physician Hours
Total FTE by member monthNPA has data orgs can reference for case load by role. Might be applicable state requirements.
How do you adjust for complexity?
Optional
As of January 20, 2018

Essential Elements
Essential Elements
• NPA identified elements of the PACE care model that are essential to its effectiveness through:o Focus groups with PACE organizationso Site visits to PACE organizationso Review of relevant literature
• Essential elements of PACE programs should be monitored as PACE organizations grow exponentially to ensure the continued delivery of high quality service to all PACE participants
• To support monitoring service quality, PACE programs can utilize the Measure Strategy Template (referenced in the Growth Driver Diagram & Tactics Section of this toolkit), which includes growth measures as well a key quality control measures
38
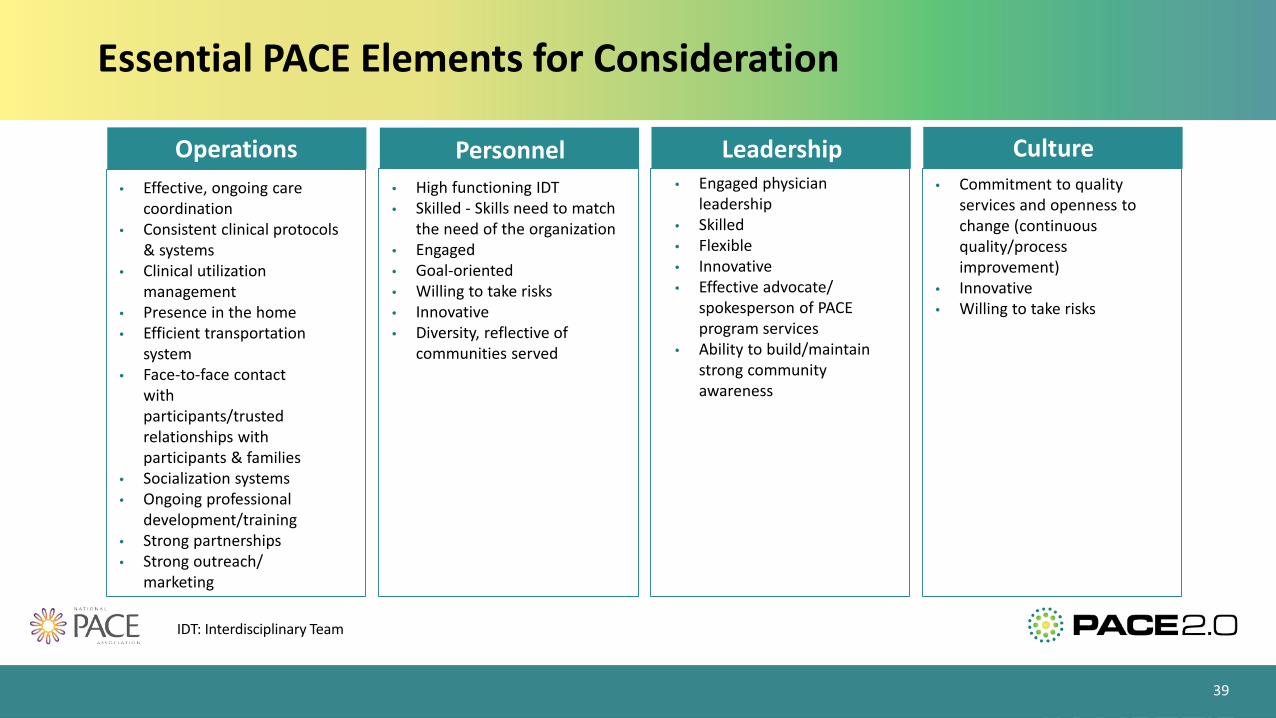
Essential PACE Elements for Consideration
39
• Effective, ongoing care coordination
• Consistent clinical protocols & systems
• Clinical utilizationmanagement
• Presence in the home• Efficient transportation
system• Face-to-face contact
with participants/trusted relationships with participants & families
• Socialization systems• Ongoing professional
development/training• Strong partnerships• Strong outreach/
marketing
• High functioning IDT• Skilled - Skills need to match
the need of the organization• Engaged• Goal-oriented• Willing to take risks• Innovative• Diversity, reflective of
communities served
• Engaged physician leadership
• Skilled• Flexible• Innovative• Effective advocate/
spokesperson of PACE program services
• Ability to build/maintain strong community awareness
• Commitment to quality services and openness to change (continuous quality/process improvement)
• Innovative• Willing to take risks
Operations Personnel Leadership Culture
IDT: Interdisciplinary Team
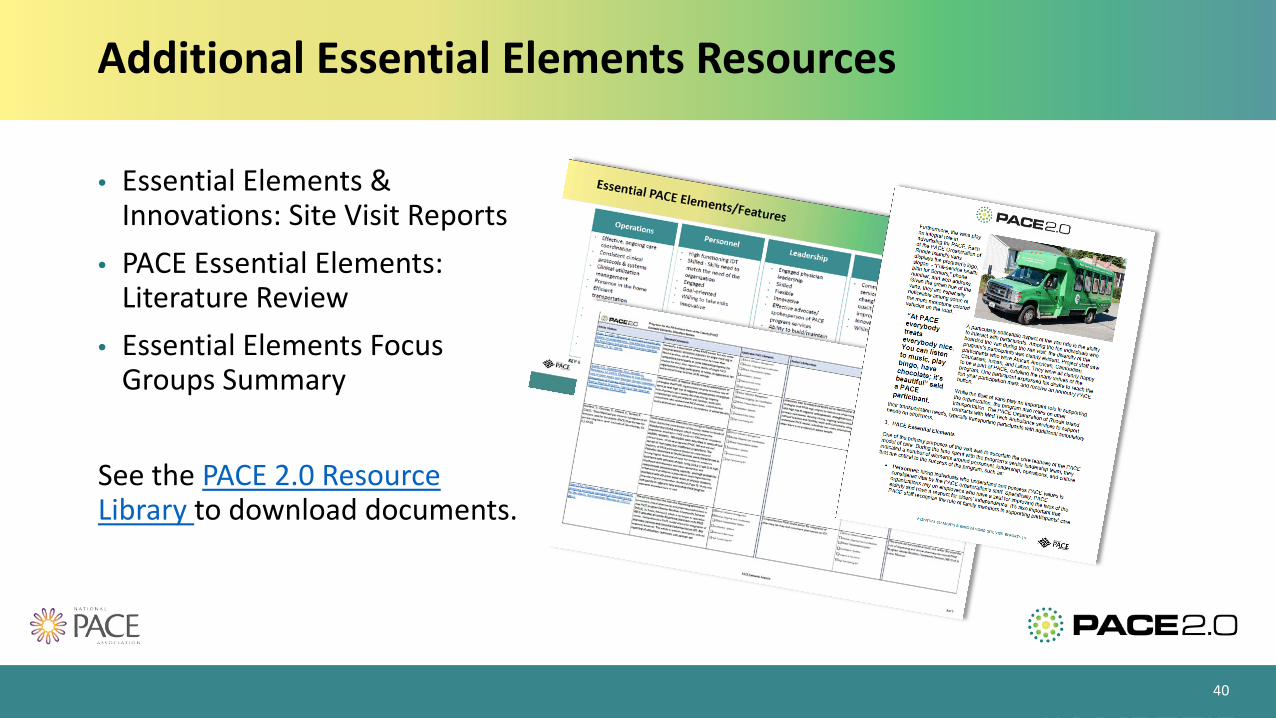
• Essential Elements & Innovations: Site Visit Reports
• PACE Essential Elements: Literature Review
• Essential Elements Focus Groups Summary
See the PACE 2.0 Resource Library to download documents.
Additional Essential Elements Resources
40

PACE 2.0 - Ready to Grow!
41
The National PACE Association would love to assist your PACE organization in achieving your growth aim
LET US KNOW YOUR AIM & HOW YOU WILL HELP MEET THE PACE 2.0 GOAL OF SERVING
100,000 PARTICIPANTS BY 2021!
Peter FitzgeraldExecutive Vice PresidentStrategy & [email protected]
Anita GibsonSenior DirectorProject Management & Policy [email protected]
For more information, please contact:
The National PACE Association (NPA) is dedicated to advancing the efforts of Programs of All-Inclusive Care for the Elderly (PACE®). NPA launched the PACE 2.0 initiative with support from The John A. Hartford Foundation and the West Health Policy Center. The initiative will expand access to PACE® for many complex high-need, high-cost populations across the country. For more information about PACE 2.0, contact Peter Fitzgerald or visit www.npaonline.org.
National PACE Association675 North Washington StreetSuite 300Alexandria, Virginia 22314Phone: 703.535.1565Fax: 703.535.1566
The John A. Hartford Foundation, based in New York City, is a private, nonpartisan philanthropy dedicated to improving the care of older adults. Established in 1929, the Foundation has three priority areas: creating age-friendly health systems, supporting family caregiving, and improving serious illness and end-of-life care. For more information, visit www.johnahartford.org and follow @johnahartford
West Health is dedicated to lowering healthcare costs and enabling seniors to successfully age in place with access to high-quality, affordable health and support services that preserve and protect their dignity, quality of life and independence. For more information, visit www.westhealth.org and follow @westhealth.