
Using Statgraphics and R for Text Mining Mining.pdf · • The new interface between Statgraphics...
41
Using Statgraphics and R for Text Mining Presented by Dr. Neil W. Polhemus
Transcript of Using Statgraphics and R for Text Mining Mining.pdf · • The new interface between Statgraphics...

Using Statgraphics and
R for Text Mining
Presented by
Dr. Neil W. Polhemus
Statgraphics/R Interface
• The new interface between Statgraphics and R
makes it possible to construct scripts and save
them in StatFolios.
• Users can build generic StatFolios that access
selected R procedures.
• Analysts can then take these StatFolios and edit
them to meet their particular needs.
Example: Text Mining
• Refers to the process of extracting useful
information from text.
• Usually we are looking for patterns or trends.
• Of particular interest is the frequency of
occurrence of different terms or phrases.
Two Examples
• Example 1: Analyzing a column of text loaded
into a Statgraphics datasheet.
• Example 2: Analyzing a directory containing
multiple text documents.
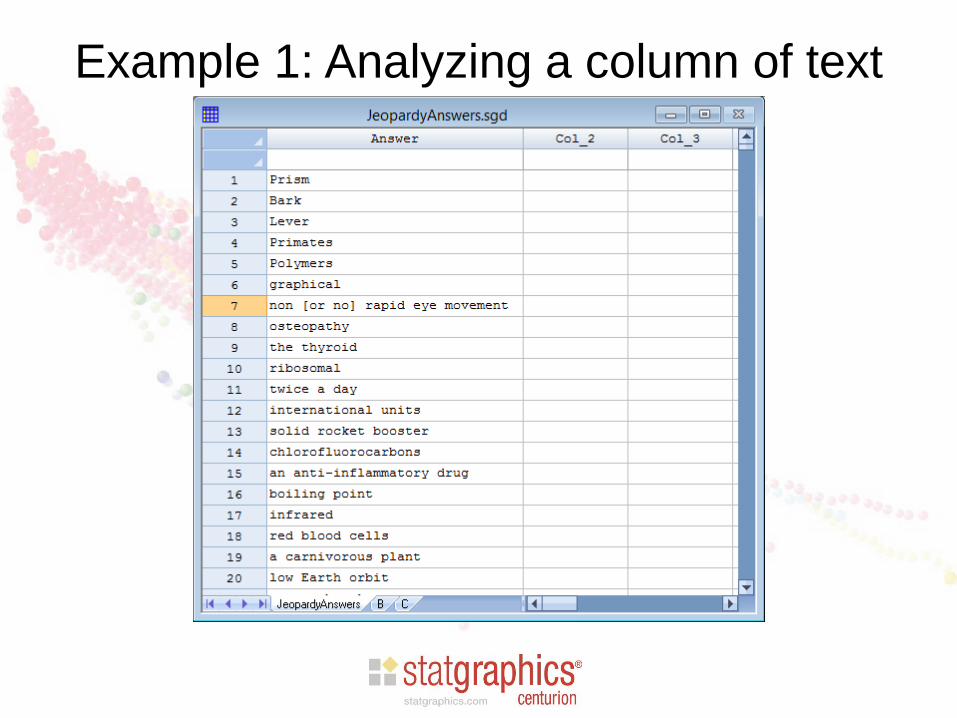
Example 1: Analyzing a column of text

Preliminaries
• Download and install R by going to:
https://cran.r-project.org/
• Start R and install the basic libraries:
> install.packages(“installr”)
> require(installr)
> install.pandoc()
• Install the text mining library:
>install.packages(“tm”)

StatFolio: MineTextColumn.sgp

Analysis Options

Specify Path to R
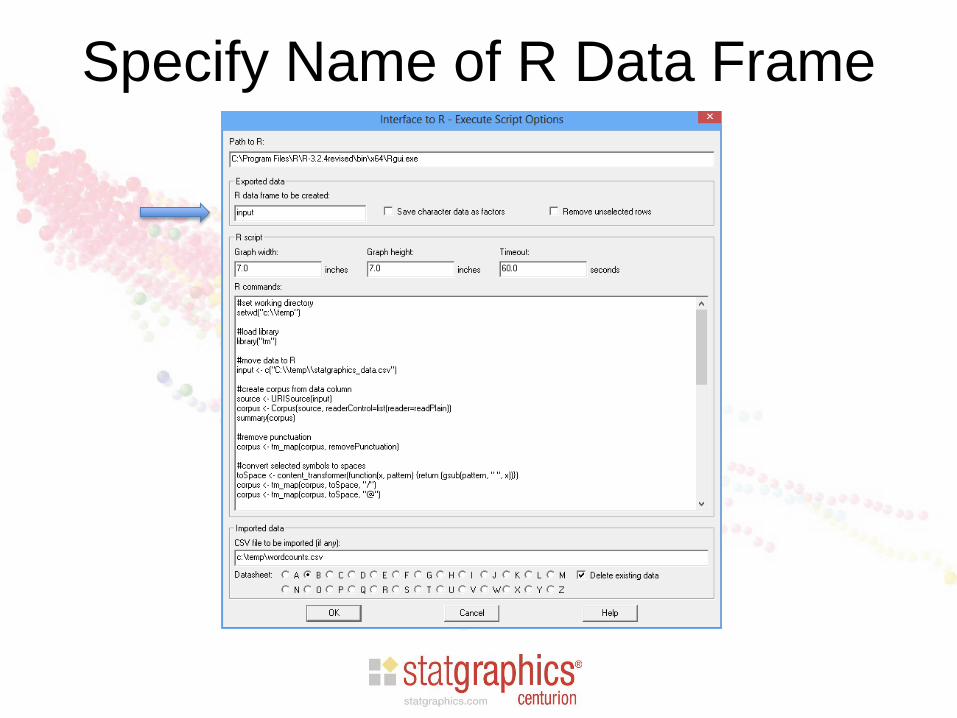
Specify Name of R Data Frame
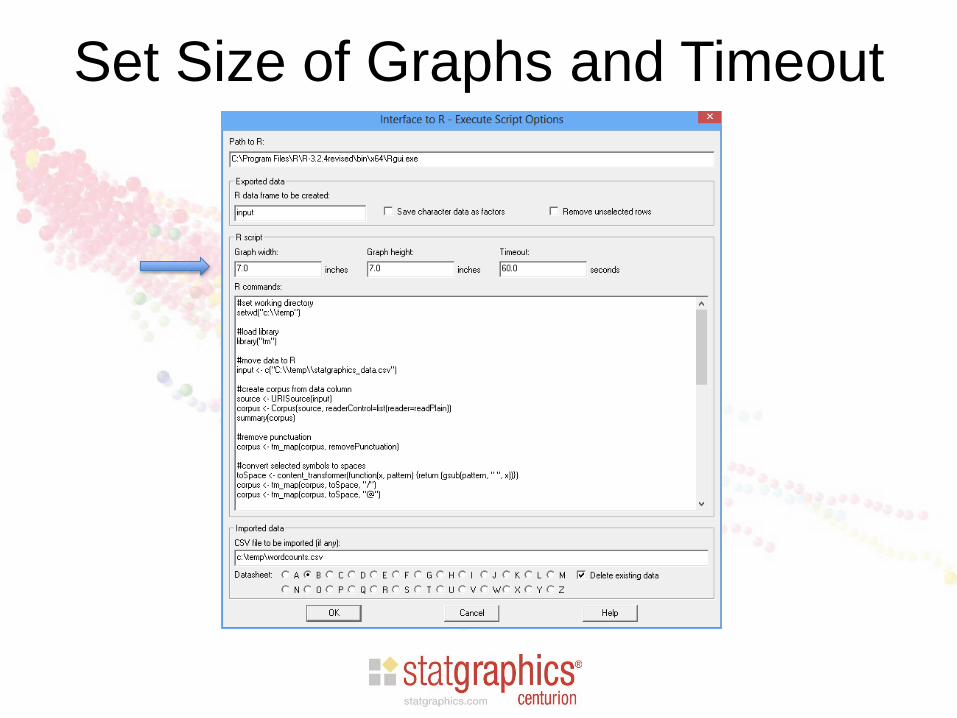
Set Size of Graphs and Timeout
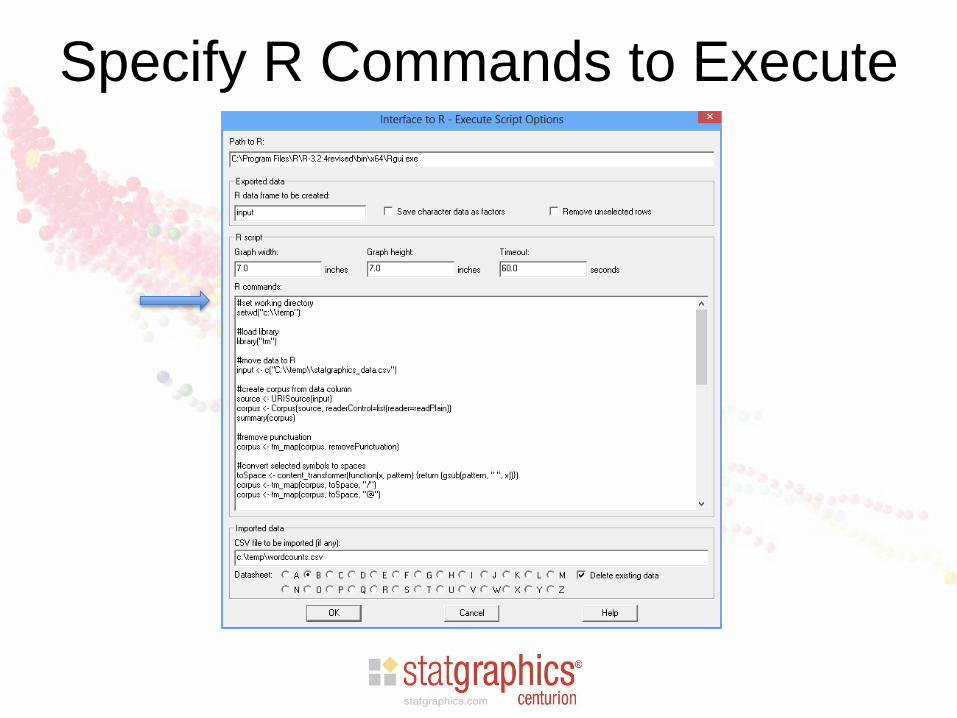
Specify R Commands to Execute
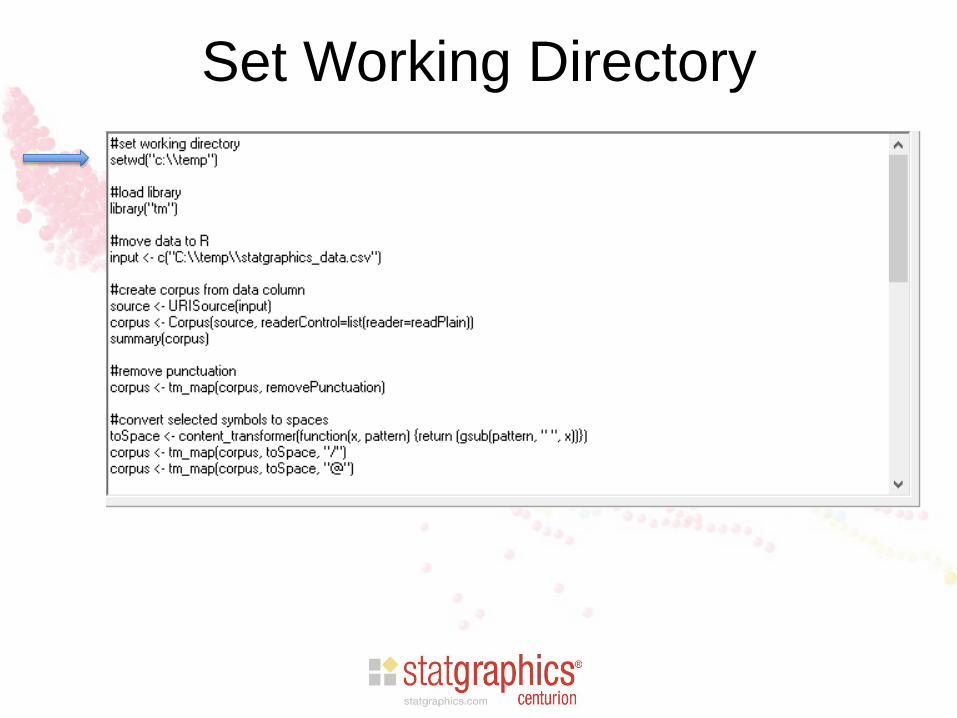
Set Working Directory
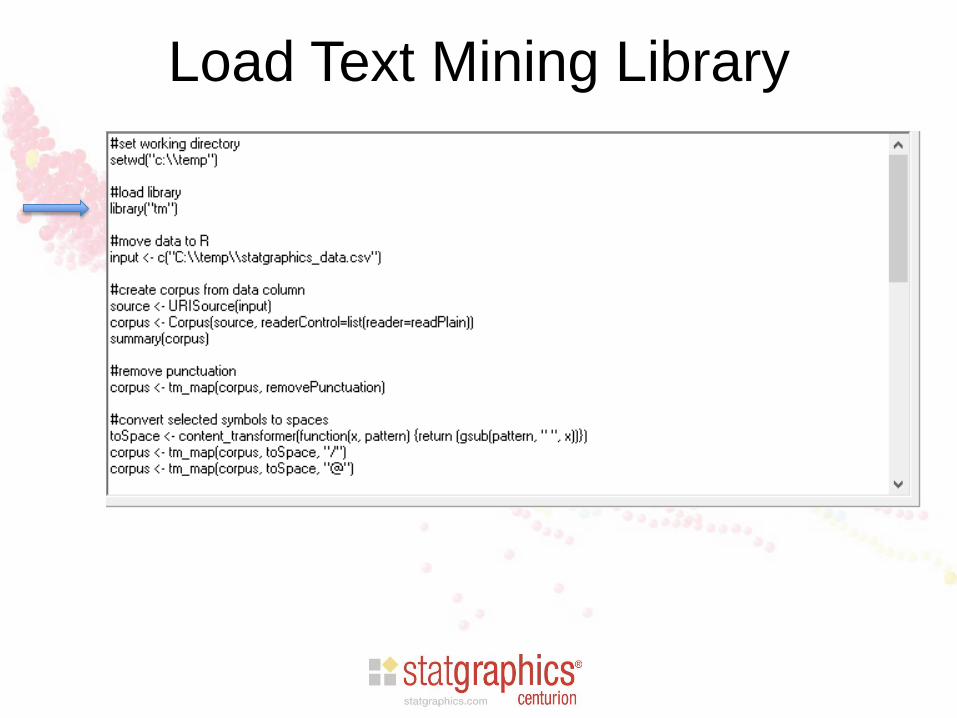
Load Text Mining Library
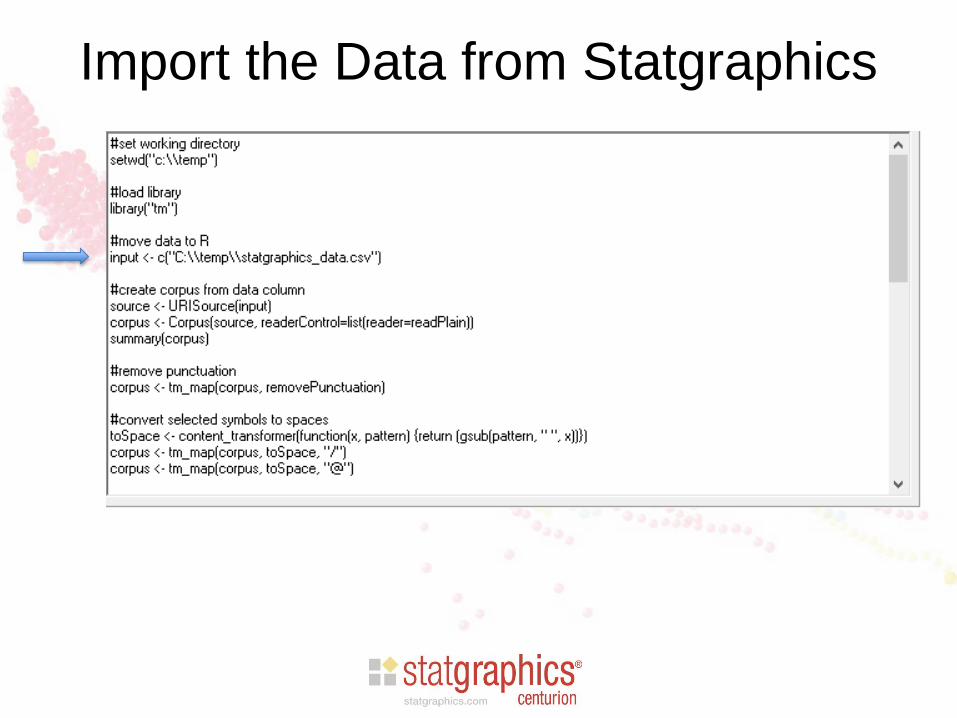
Import the Data from Statgraphics

Create a Corpus
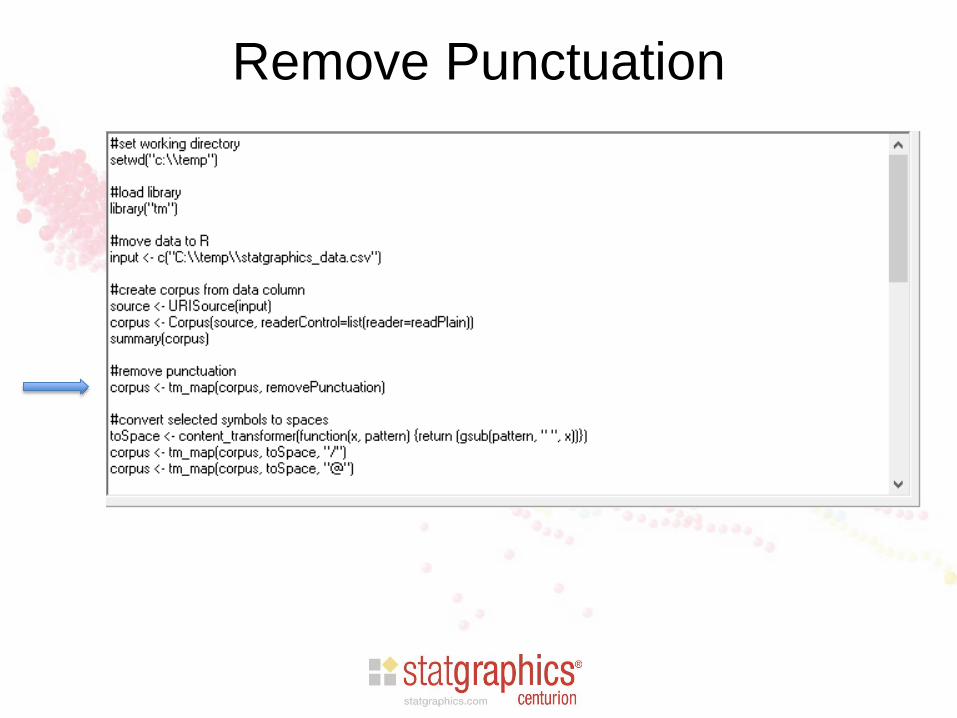
Remove Punctuation
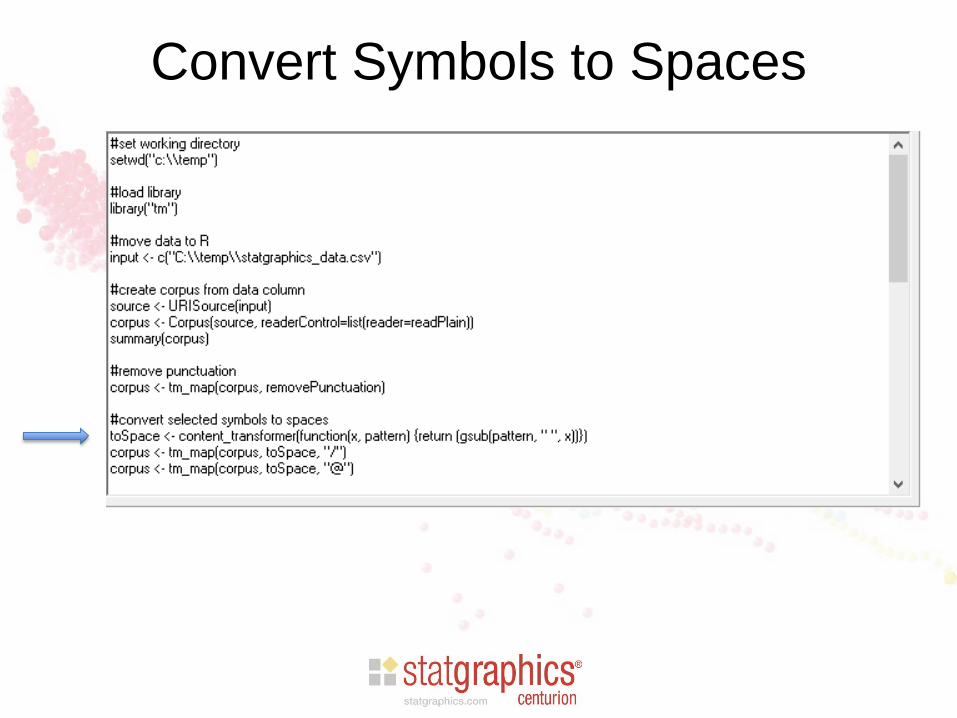
Convert Symbols to Spaces

Remove Numbers
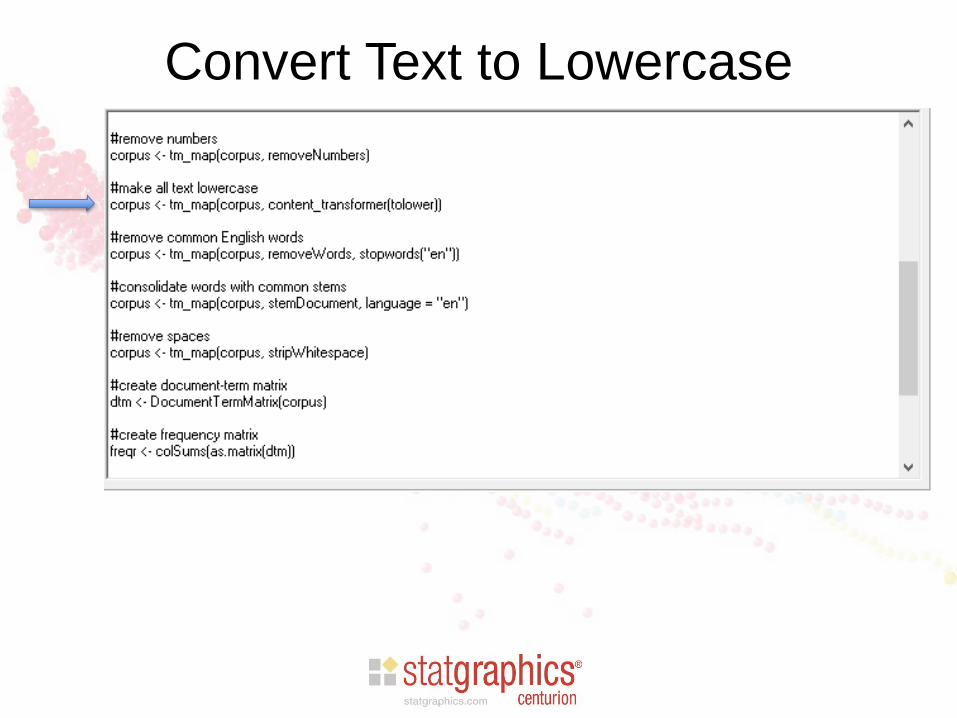
Convert Text to Lowercase
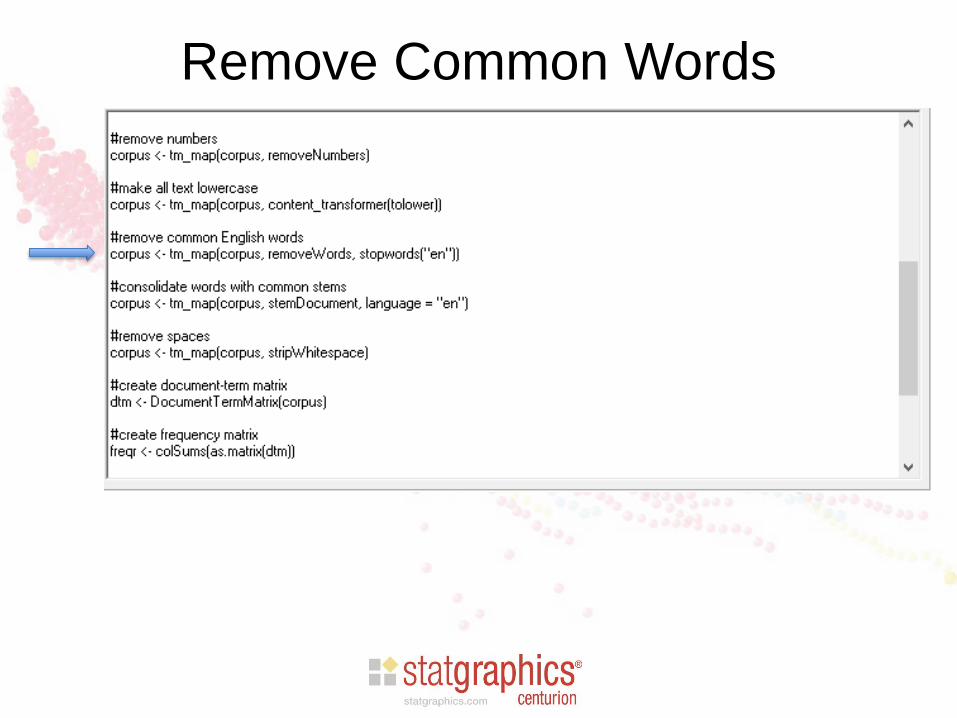
Remove Common Words

Consolidate Words with Same Stem
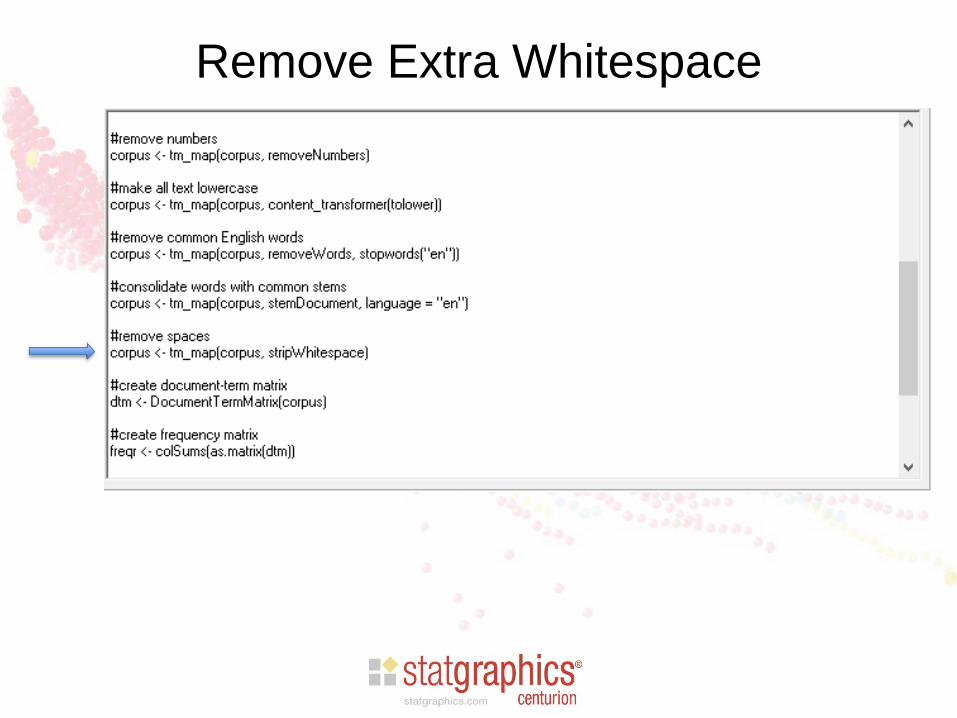
Remove Extra Whitespace
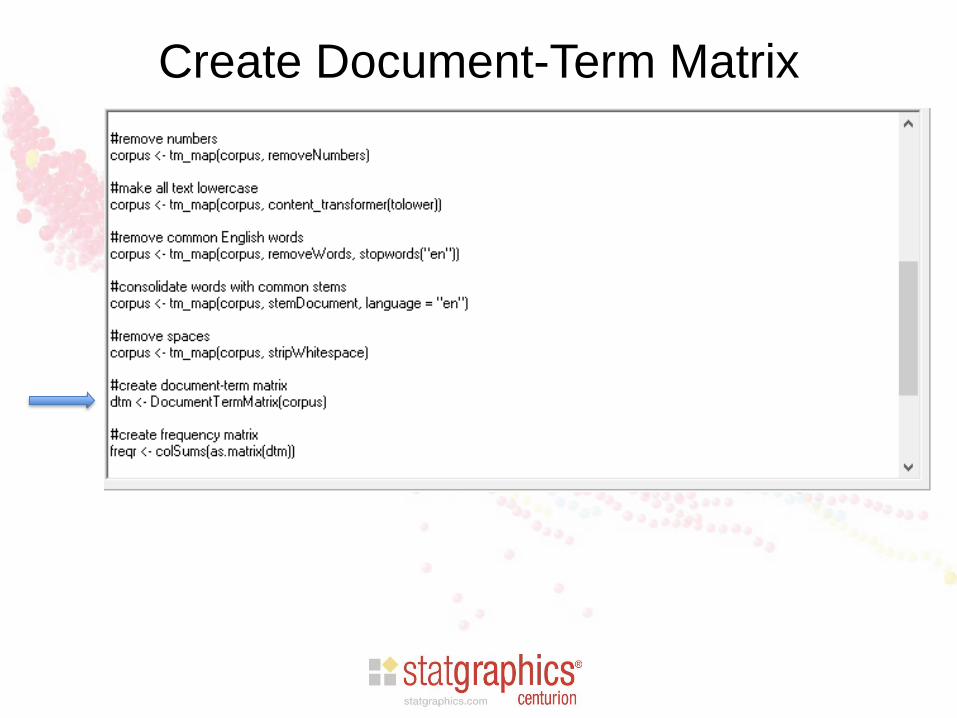
Create Document-Term Matrix

Create Frequency Matrix
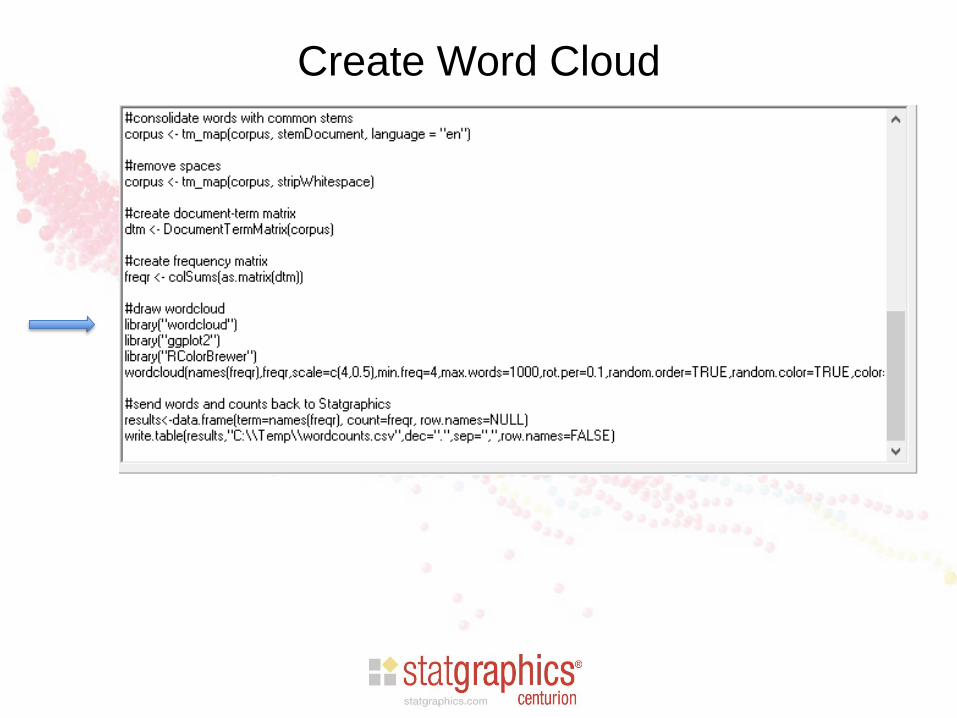
Create Word Cloud

Wordcloud Options
• scale=c(4,0.5): range of the word sizes
• min.freq=4: minimum frequency to include word
• max.words=1000: maximum number of words
• rot.per=0.1: fraction of words shown vertically
• random.order=TRUE: randomize word order
• random.color=TRUE: randomize colors
• colors=brewer.pal(8,”Dark2”): color palette
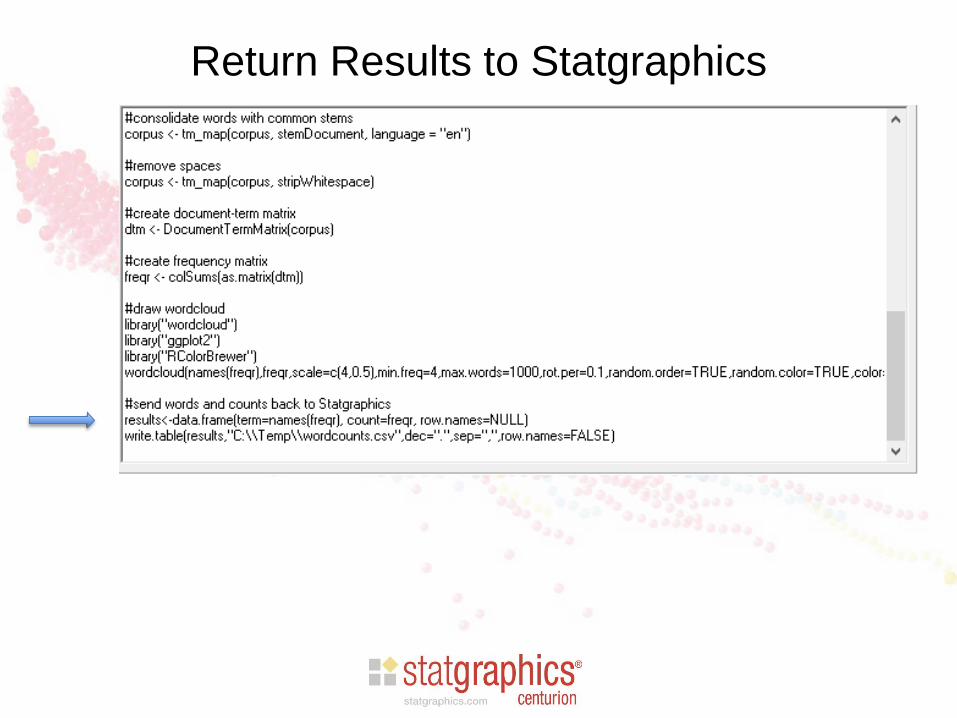
Return Results to Statgraphics
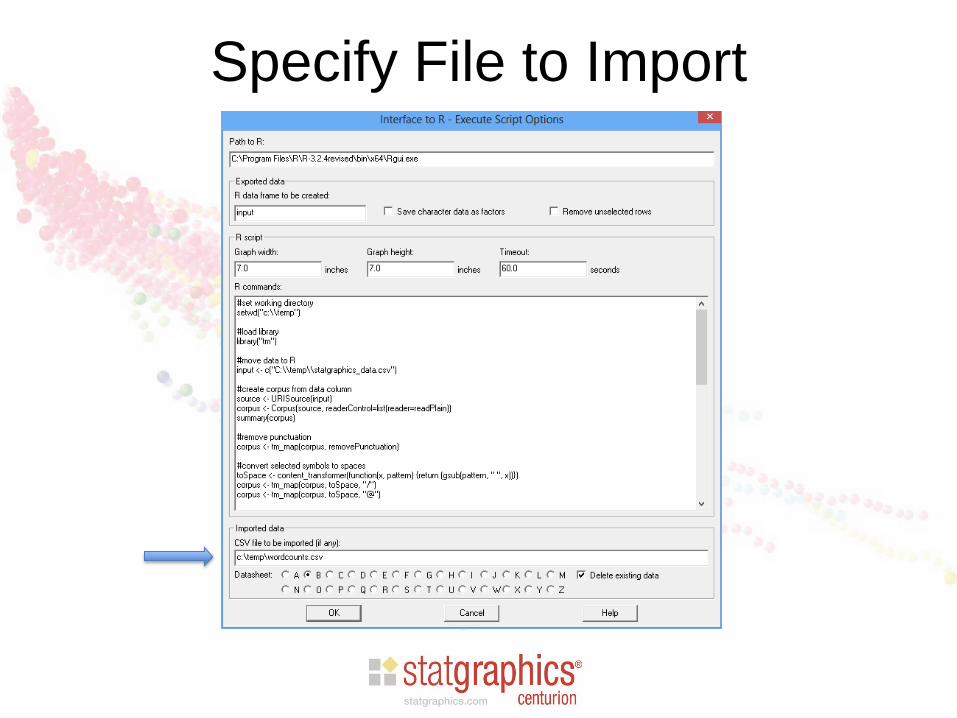
Specify File to Import
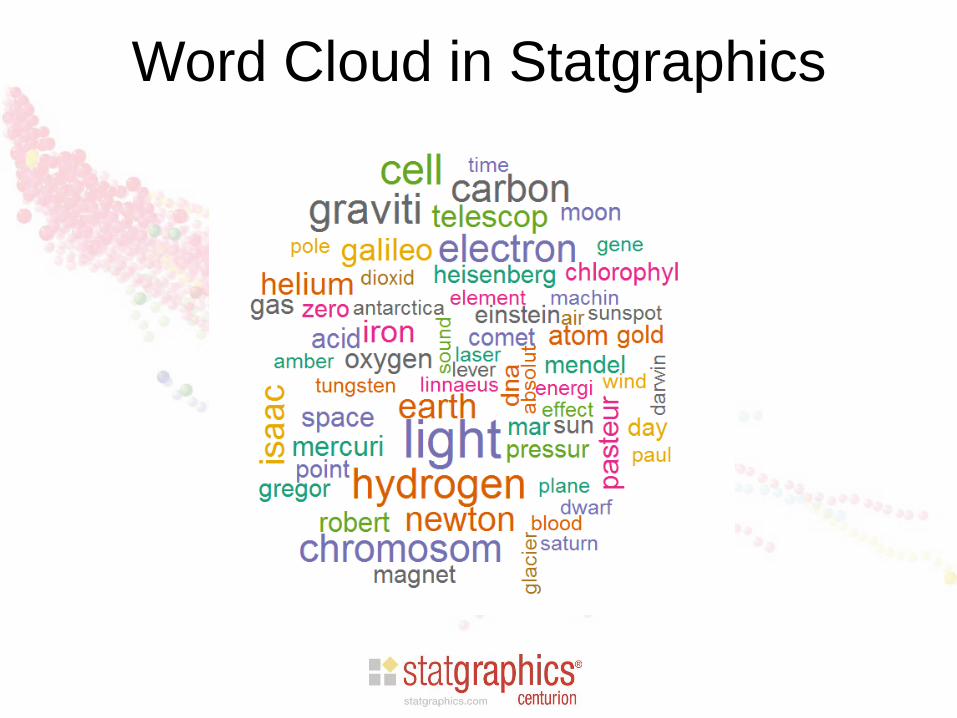
Word Cloud in Statgraphics

Results
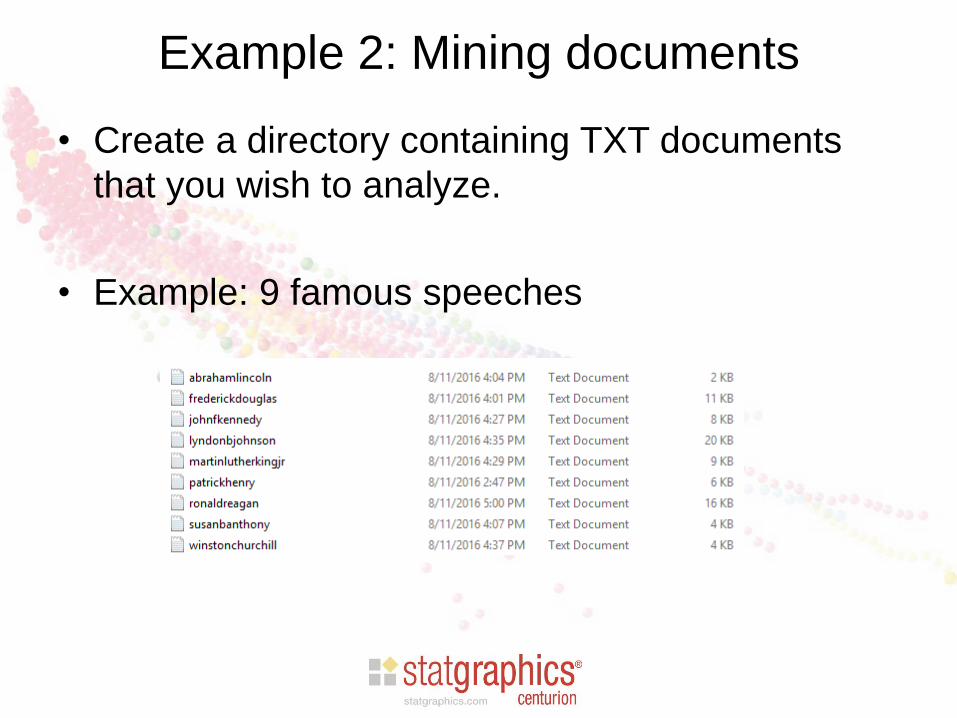
Example 2: Mining documents
• Create a directory containing TXT documents
that you wish to analyze.
• Example: 9 famous speeches
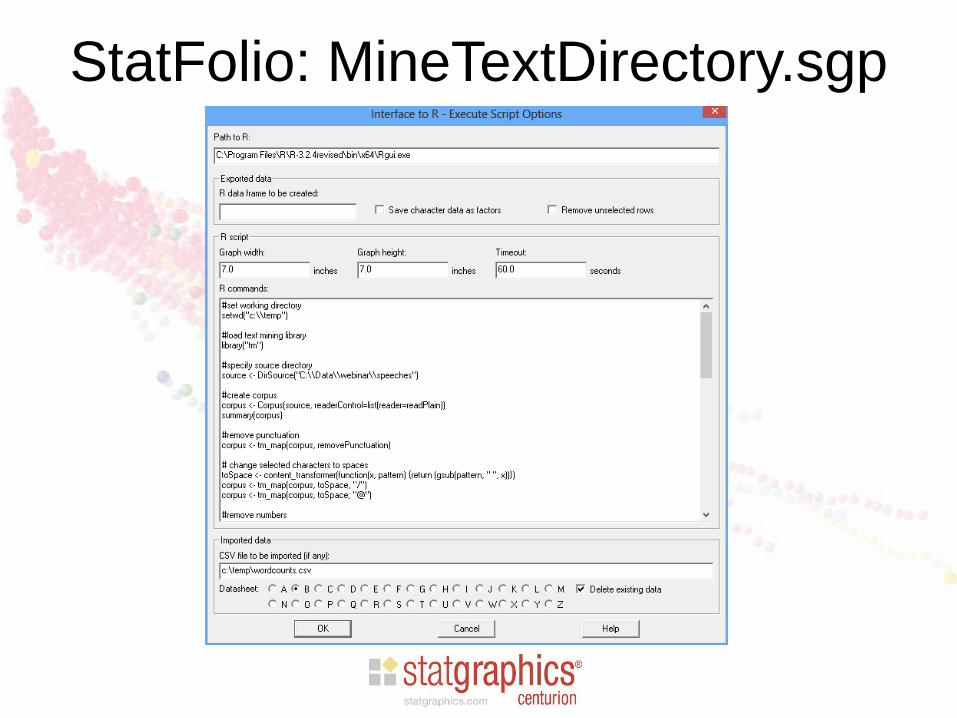
StatFolio: MineTextDirectory.sgp
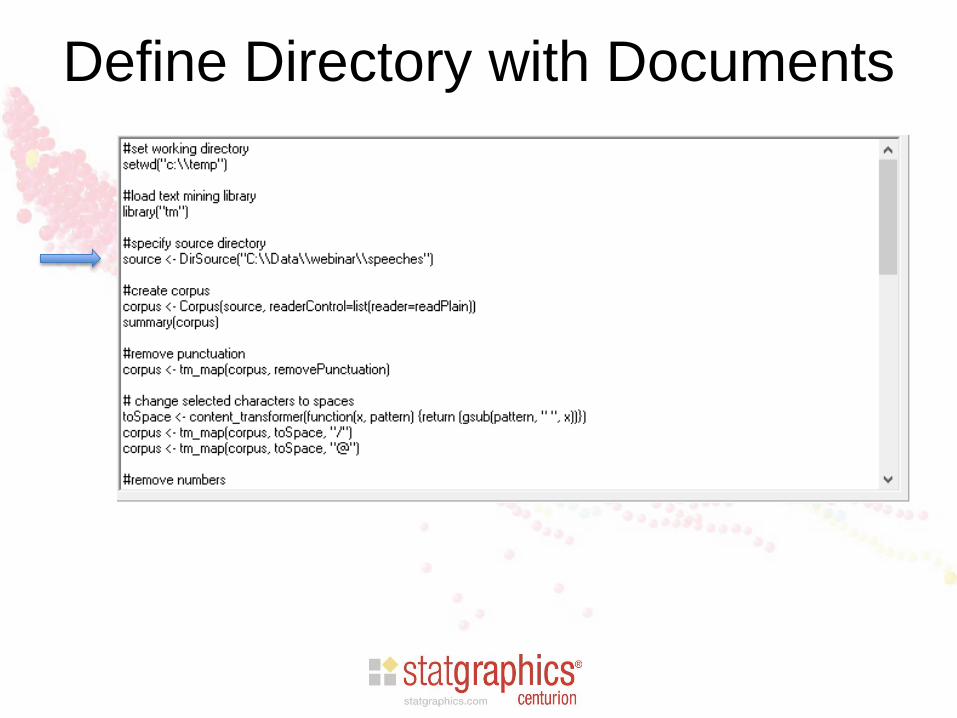
Define Directory with Documents

Remove Selected Words

Remove Sparse Terms
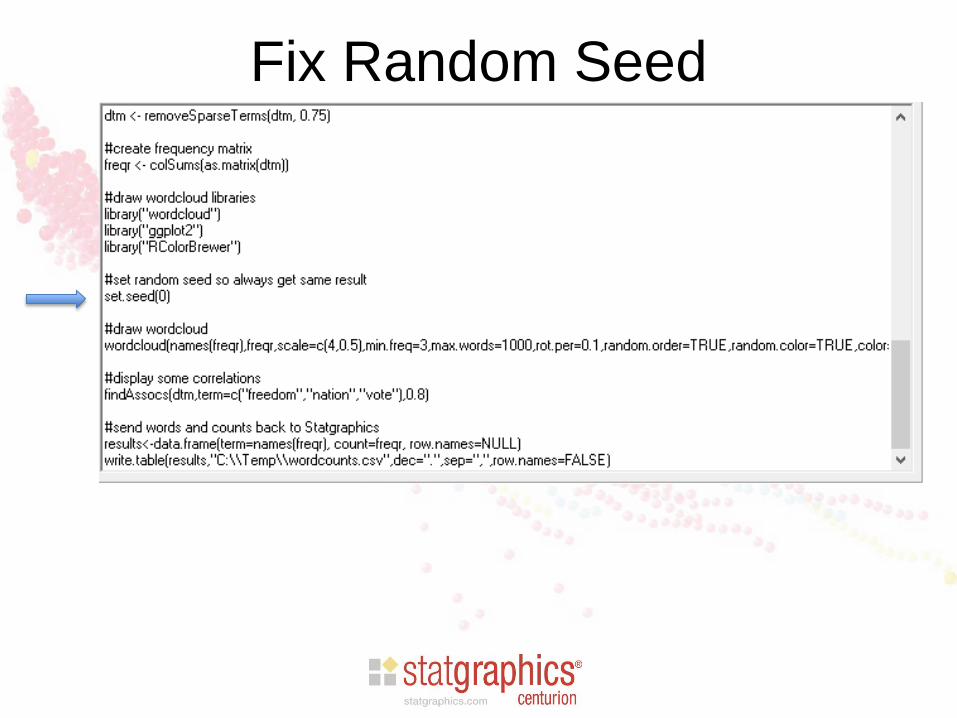
Fix Random Seed

Find Associations

Word Cloud

Word Associations
References
• StatFolios and data files are at: www.statgraphics.com/webinars
• Primary manual for tm library is at:
https://cran.r-project.org/web/packages/tm/tm.pdf
• Good tutorial on tm is at:
https://cran.r-project.org/web/packages/tm/vignettes/tm.pdf


