
USING SENSITIVITY ANALYSIS AND OPTIMIZATION FOR …€¦ · USING SENSITIVITY ANALYSIS AND...
8
MINERIT & GEOMECANICĂ BULETIN Resurse Minerale Nr.2/2006 1 USING SENSITIVITY ANALYSIS AND OPTIMIZATION FOR CIVIL ENGINEERING AND GEOTECHNICAL APPLICATIONS R. Schlegel, Dr., J. Will, Dr. Dynardo GmbH, Weimar, Germany H. Konietzky, Prof. Dr.-Ing. habil Institut für Geotechnik, Technische Universität Bergakademie Freiberg, Germany Abstract: To achieve the demands for safe and economic designs in mining and civil engineering mathematical based optimization is necessary. Based on stochastic sampling methods sensitivity analyses are used to identify the critical parameters of the system. Later on, evolutionary Pareto-optimization is used to get the best design. The underlying physical problem is modeled via numerical approaches. Based on a simple example - the roof support of a drift by anchors - the whole procedure and potential are demonstrated. 1 INTRODUCTION Recent developments in software, both (I) numerical tools for mechanical or coupled hydro-thermal- mechanical problems in geomechanics as well as (II) sensitivity and optimization software, and the increase in computational speed even in the PC range, allows the combination of both methodologies. Therefore, mathematical based sensitivity analysis and optimization will replace the classical approach of simple parameter studies. As in many other industries, the international competition demands cost-effective (economic), ecological, safe and robust products and designs. For the mining industry, this means that additional effort is necessary to optimize the mine design and to minimize the necessary security reserves. This article documents up-to-date strategies to reach this aim. Based on a simple mine anchor design, some of the procedures are illustrated. Computer-based optimization, robustness analysis, sensitivity analysis and stochastic approaches need the coupling between two components: a tool to perform the geomechanical calculations and a tool, who manages the individual runs in terms of the definition of input parameters including the corresponding evaluation. Figure 1 illustrates, who such a combination in form of a master-slave-relation. The optimization tool (e.g. optiSLang) acts as the master and the numerical code (e.g. FLAC) as the slave. Figure 1 Work flow of optimization tool and numerical solver in form of a master-slave-relation First, the geomechanical problem is transferred from a conceptual model into a numerical model. Relevant input parameters are parsed, so that the optimization tool has access to them. Also, within the numerical code response functions are programmed, which deliver values to the master, who defines the next input parameter set. This loop will passed through until reliable results are obtained. FLAC is a 2-dimensional numerical explicit Finite- Difference Code (FLAC, 2006), which was developed to solve mechanical and hydro-thermal-mechanical coupled problems in geotechnical engineering and mining. The code allows to simulate support measures, like anchors, props, struts, shotcrete, geotextiles, etc.
Transcript of USING SENSITIVITY ANALYSIS AND OPTIMIZATION FOR …€¦ · USING SENSITIVITY ANALYSIS AND...
MINERIT & GEOMECANICĂ
B U L E T I N R e s u r s e M i n e r a l e N r . 2 / 2 0 0 6 1
USING SENSITIVITY ANALYSIS AND OPTIMIZATION FOR CIVIL ENGINEERING AND GEOTECHNICAL APPLICATIONS
R. Schlegel, Dr., J. Will, Dr. Dynardo GmbH, Weimar, Germany
H. Konietzky, Prof. Dr.-Ing. habil Institut für Geotechnik, Technische Universität Bergakademie Freiberg, Germany
Abstract: To achieve the demands for safe and economic designs in mining and civil engineering mathematical based optimization is necessary. Based on stochastic sampling methods sensitivity analyses are used to identify the critical parameters of the system. Later on, evolutionary Pareto-optimization is used to get the best design. The underlying physical problem is modeled via numerical approaches. Based on a simple example - the roof support of a drift by anchors - the whole procedure and potential are demonstrated.
1 INTRODUCTION
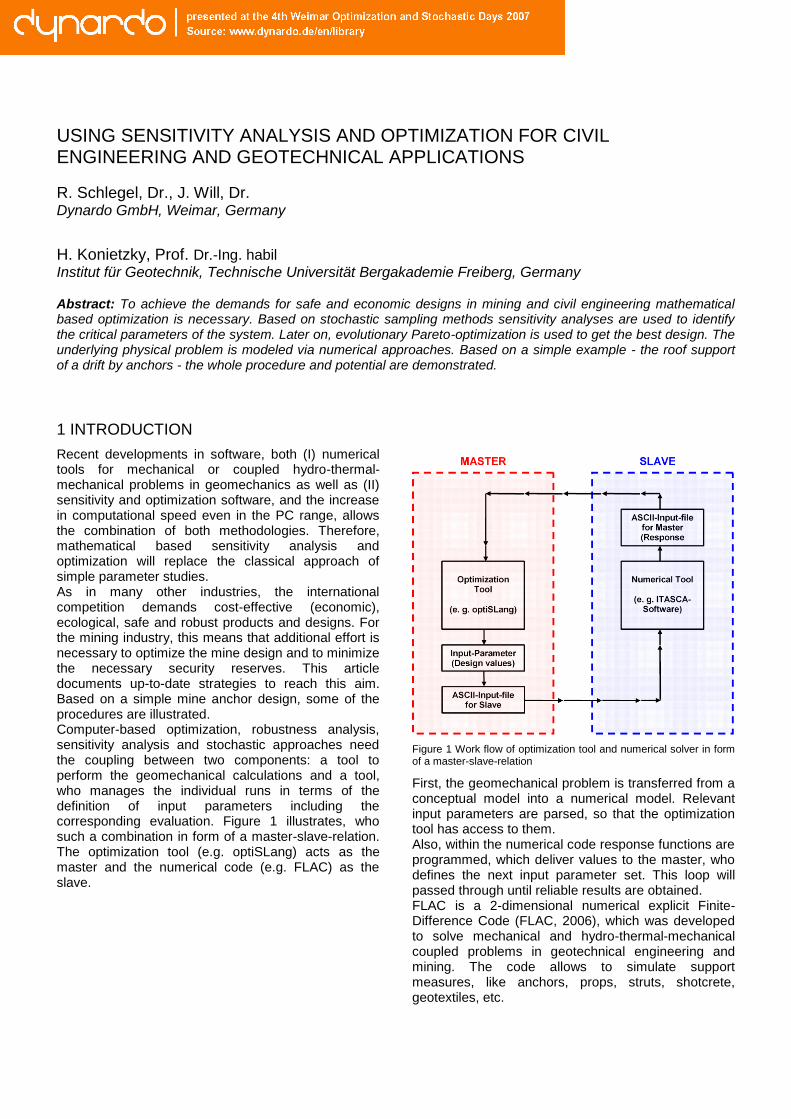
Recent developments in software, both (I) numerical tools for mechanical or coupled hydro-thermal-mechanical problems in geomechanics as well as (II) sensitivity and optimization software, and the increase in computational speed even in the PC range, allows the combination of both methodologies. Therefore, mathematical based sensitivity analysis and optimization will replace the classical approach of simple parameter studies. As in many other industries, the international competition demands cost-effective (economic), ecological, safe and robust products and designs. For the mining industry, this means that additional effort is necessary to optimize the mine design and to minimize the necessary security reserves. This article documents up-to-date strategies to reach this aim. Based on a simple mine anchor design, some of the procedures are illustrated. Computer-based optimization, robustness analysis, sensitivity analysis and stochastic approaches need the coupling between two components: a tool to perform the geomechanical calculations and a tool, who manages the individual runs in terms of the definition of input parameters including the corresponding evaluation. Figure 1 illustrates, who such a combination in form of a master-slave-relation. The optimization tool (e.g. optiSLang) acts as the master and the numerical code (e.g. FLAC) as the slave.
Figure 1 Work flow of optimization tool and numerical solver in form of a master-slave-relation
First, the geomechanical problem is transferred from a conceptual model into a numerical model. Relevant input parameters are parsed, so that the optimization tool has access to them. Also, within the numerical code response functions are programmed, which deliver values to the master, who defines the next input parameter set. This loop will passed through until reliable results are obtained. FLAC is a 2-dimensional numerical explicit Finite-Difference Code (FLAC, 2006), which was developed to solve mechanical and hydro-thermal-mechanical coupled problems in geotechnical engineering and mining. The code allows to simulate support measures, like anchors, props, struts, shotcrete, geotextiles, etc.

MINING & GEOMECHANICS
2 B U L E T I N R e s u r s e M i n e r a l e N r . 2 / 2 0 0 6
The applied constitutive relations can be arbitrary non-linear. FLAC is used to perform deformation and stability analysis and to investigate the interaction between the rock mass and the geotechnical construction including support measures. optiSLang – the Optimizing Structural Language – is a software platform for sensitivity analysis, multi-criteria and multi-disciplinary optimization, robustness evaluation, and reliability analysis (optiSLang, 2006). Sensitivity studies serve to determine the influence of the different optimization (input) variables on the response variables. In optiSLang, a set of design realizations are calculated by means of the Design-of-Experiment method or Latin Hypercube Sampling strategies, respectively. Based on these samples, the correlations and variations are evaluated by means of statistical post-processing. The obtained correlations show which input parameter influences which response parameter, while the variations define how strongly the response variables are influenced. This can give valuable hints on profitable parameter sets for a subsequent optimization, as well as on promising objective functions. Additionally, from the sensitivity study it can be deduced whether the response variables can be influenced in the chosen parameter space, and if yes, to what extend. For parameter optimization gradient based methods, genetic algorithms and evolutionary algorithms, adaptive response surface methods, as well as Pareto optimization methods can be employed. From the point of view of optimal component dimensioning, it is of special importance to take into account the unavoidable random scatters in an appropriate way. To this end, methods of robustness evaluation as well as reliability analysis are available. Robustness evaluations serve to investigate the sensitivity of design response variables towards scattering of the input variables. With statistical measurements the sensitivity of the response variables towards relatively frequent scatters is investigated. Thus, robustness evaluations ensure operability and reliability for relatively frequent events, i.e. events with a probability of occurrence of at least about 1%. In cases where operability and reliability is to be ensured for much less frequent events (one out of a million), methods of reliability analysis have to be employed. All these methods can help the engineer to develop safe designs of high quality.
2 THE PRINCIPLES OF SENSITIVITY ANALYSIS AND OPTIMIZATION
2.1 Sensitivity analysis
The aim of a sensitivity analysis is the investigation of the sensitivity of varying input variables on the variability of system responses using parametric studies. Parameter studies, in case of the variation of single parameters, belong to the everyday life of an
engineer for a long time. In analogy thereto design of experiment methods, which systematically calculate single parameters and combinations of parameters, can be used in small parameter spaces. If the dimension or the nonlinearly of the parameter space increases, stochastic sampling strategies are to be favoured for creating supporting point sets. A further advantage of stochastic sampling strategies compared to design of experiments is, that they furthermore permit a statistical evaluation of sensitivities via correlation hypothesis (which optimization variables operate on which result variable and how) a variation analysis (estimate the possible variations of the result to align in the chosen design space). The variation of the input variables can be described by lower and upper bounds or a set of discrete realizations. The generated set of design realizations is analyzed and evaluated by statistical measurements of variation and correlation. The variation in the system responses and their correlation to the input parameters as well as the significance of the input parameter are investigated by statistical methods.
2.1.1 Statistical Assessment
The samples are investigated with respect to their correlation and variation properties using statistical methods. The variation of response values are investigated in histograms. The range from minimum and maximum values approximate the potential of minimizing or maximizing. In addition to the variation of response values the analysis of the correlation structure allows to establish important relations between input and output variables. It is convenient to plot coefficients of linear and quadratic correlation between input and response variables in terms of a coefficient matrix. This allows the detection of possible linear or quadratic dependencies between the variables. The coefficients of correlation are a normalized (between –1 and 1) measure of the dependence between two variables. While the pair wise correlation coefficients identifies the explicit relation between the random variations of two variables, e.g. one input variable and one response variable, the Principal Component Analysis (PCA) describes higher-dimensional relations, which reveal correlations of groups of random variables among each other. Therefore, the correlation analysis enables the investigation of causal connections between input and output variables, so that ideally the set of significant input variables responsible for the variation of an output quantity can be identified. An other important statistical measurement is the coefficient of determination. In Figure 2 for example the measure of determination shows, that 95% of the variation of the maximum force results from linear correlation and the “most sensitive” input variables are the yield stress as well as the thickness of two sheet blanks (Part 1007 and 1009). Consequently the sub space of optimization of this result variable can be

MINERIT & GEOMECANICĂ
B U L E T I N R e s u r s e M i n e r a l e N r . 2 / 2 0 0 6 3
reduced to these four sensitive parameters. From the histogram one can read off, that the resulting variables in the design space varies at least between 69.515 N and 85.756 N. For description of further statistical measures (Will & Bucher, 2006) shall be referred.
Figure 2 Measures of determination and histogram of a single result variable
Consequently, sensitivity studies enable a reduction of the parameter space for subsequent optimization problems. Also, the previous knowledge obtained from the sensitivity studies about properties of the design space is very helpful for an adequate formulation of constraints and objective functions. From the computation of the sensitivity studies adequate starting points for gradient optimization, adequate starting approximation spaces for adaptive response surface methods or input information for starting generations of evolutionary search strategies can be obtained.
2.2 Optimization methods
Basically at least three categories of algorithms are available for solving an optimization problem:
mathematical methods of optimization using gradients (gradient methods), response surface methods (RSM) and stochastic search strategies. Mathematical optimization methods (Schittkowski et al.), which determine the search direction using gradient information, offer the best convergence behaviour of the above mentioned methods. But they also have the greatest requirements on the mathematical composition of the numerical problem formulation, on continuity, differentiability, smoothness, scalability as well as the accuracy of the gradient determination. Most critical from the practical point of view is the unavailability of analytical or semi-analytical gradients adverse important result variables to estimate and the impracticality of numerical gradients for example when dealing with noise afflicted problems, non differentiable problems or problems of accuracy when determining numerical gradients, respectively. Successful practical application is consequentially concentrated on optimization problems with continues optimization variables with mathematically adequate problem formulations where suited gradients can be calculated. If the amount of optimization variables is limited to a few variables (5 to 15), response surface methods (Meyers & Montogmery, 1995) offer attractive possibilities of optimization. This method creates an approximation of the design space using an approximation function on a suitable set of support points (samples of the variable space). The support points should be determined using optimal support point pattern (Design of Experiments – DOE) for the approximation function. The approximation function usually has smooth mathematical properties. For the search for the optimum in the subspace mathematical methods of optimization can be used. Weak point of the response surface methods is the proof that the approximation at points of interest in the design space is sufficient and accurate enough for the optimization. To secure the approximation quality Adaptation Response Surface Schemes are used. Hereby, Adaptive Response Surface Methods (ARSM) which zoom and scroll the approximation space until the optimum converges on the response surface are the most successful (Stander & Craig, 2002). The critical value from the practical point of view is the number of optimization variables. Therefore, response surface methods are used in small dimension of the most sensitive optimization variables which have been determined before using sensitivity studies. Designs which have been pre-optimized in such a manner can be used as starting points for gradient optimization or as input information of evolutionary search strategies. If the aforementioned algorithms do not lead to the desired goal stochastic search methods, of which the evolutionary algorithms with the subdivisions genetic algorithms (Goldberg, 1995) and evolutionary strategies (Rechenberg, 1994) are the most successful, remain for solving the problem. The term

MINING & GEOMECHANICS
4 B U L E T I N R e s u r s e M i n e r a l e N r . 2 / 2 0 0 6
stochastic search method is used as “random” events leading to the change in design. Important differentiating factor between genetic algorithms and evolutionary strategies is the method of evolutionary development of the optimization variables. Most important evolutionary process of the genetic algorithms is the random substitution of genes (optimization variables) between two parent designs to produce a descendant. Most important evolutionary process of evolutionary search strategies is mutation (random change) of single genes of a parental design to produce a descendant. Genetic algorithms thereby are especially useful for a relatively wide-ranging search in the design space. Therefore, they are often used as a “global” search of a possible calibration. Evolutionary strategies are especially useful if a proper previous knowledge is available in the starting generation. Starting with pre-optimized designs from genetic search strategies or ARSM runs evolutionary strategies can be used for local optimization for fine-tuning. Depending on the settings of the replacement and mutation operators hybrids between genetic and evolutionary search strategies can be presented and used for combined global and local optimization. In this paper evolutionary algorithms are used for optimization. In single objective optimization an optimization task with one objective function and arbitrary constraints is formulated. In case of multi-criteria optimization an optimization task with more than one objective, which are conflicting and arbitrary constraints are formulated (Pareto-Optimization). By definition a design point x is said to be Pareto-Optimal if no objective function criterion can be improved without worsening at least one other objective criterion. The set of all Pareto Optimal solutions is the so called Pareto-Front or Functional Efficient Boundary (see Figure 3).
Figure 3 Pareto Front of two objectives f1 and f2
It should be mentioned that only in case of conflicting objectives a Pareto front of compromise solutions exist and Pareto optimization is recommended. Because Pareto optimization significantly increases the effort to obtain the Pareto front (compared with the effort to obtain one optimum) the user should have a good understanding of conflicting objectives before starting a Pareto optimization to resolve that conflict. If multiple
objectives are not in significant conflict, single objective optimization is recommended, if for example two objectives f1 and f2 are not conflicting, then they depend on each other, which means that the single minimization of only one objective automatically implies the minimization of the other objective.
3 EXAMPLE: OPTIMIZATION OF AN ANCHOR SCHEME
3.1 Task
To demonstrate the general procedure of a combined sensitivity and optimization analysis, a simple, but typical mining application was used: the roof support of a drift by anchors. How the intended support behaves depends on several parameters like type of anchor, distance between anchors, length of anchors, material parameters of anchor, constitutive behaviour of rock mass, depth below surface, geometry of opening, geological conditions, characteristics of grout etc. All these and other parameters have a more or less significant influence on the system behaviour. For the further steps (optimization, robustness assessment, safety analysis …) it is essential to know the importance of these parameters on the system behaviour. The sensitivity analysis answers this question. The most important (critical) impact parameters will be detected and less important or unimportant parameters can be excluded from further studies. Based on this sensitivity analysis an optimization analysis follows. To perform an optimization evaluation criteria objectives for the optimization have to be defined. If one single objective with multiple criterions is defined, the single objective optimization ends with one result (optimum). However, in some cases two or more criteria exist, which are contradictory and therefore no single optimum, but a set of PARETO optimal solutions exist. The below given simple example uses the maximum roof displacement (safety criterion) and the minimum total anchor length (economic criterion) as optimization criteria. To demonstrate the whole procedure a simple 2-dimensional numerical model as shown in Figure 2 was used. The model represents half of a chamber 10 m wide and 5 m high. Due to the symmetry conditions a half-space model was used. The model has a vertical symmetry line at the left boundary and contains 5 roof anchors. The rock mass was modeled using the classical elasto-plastic Mohr-Coulomb model with tension cut-off and non-associated flow rule. The virgin principal stress state is characterized by 10 MPa vertical stress and 5 MPa horizontal stress. The outer model boundaries are fixed in the normal direction. Parameters are given in Table 1.
MINERIT & GEOMECANICĂ
B U L E T I N R e s u r s e M i n e r a l e N r . 2 / 2 0 0 6 5
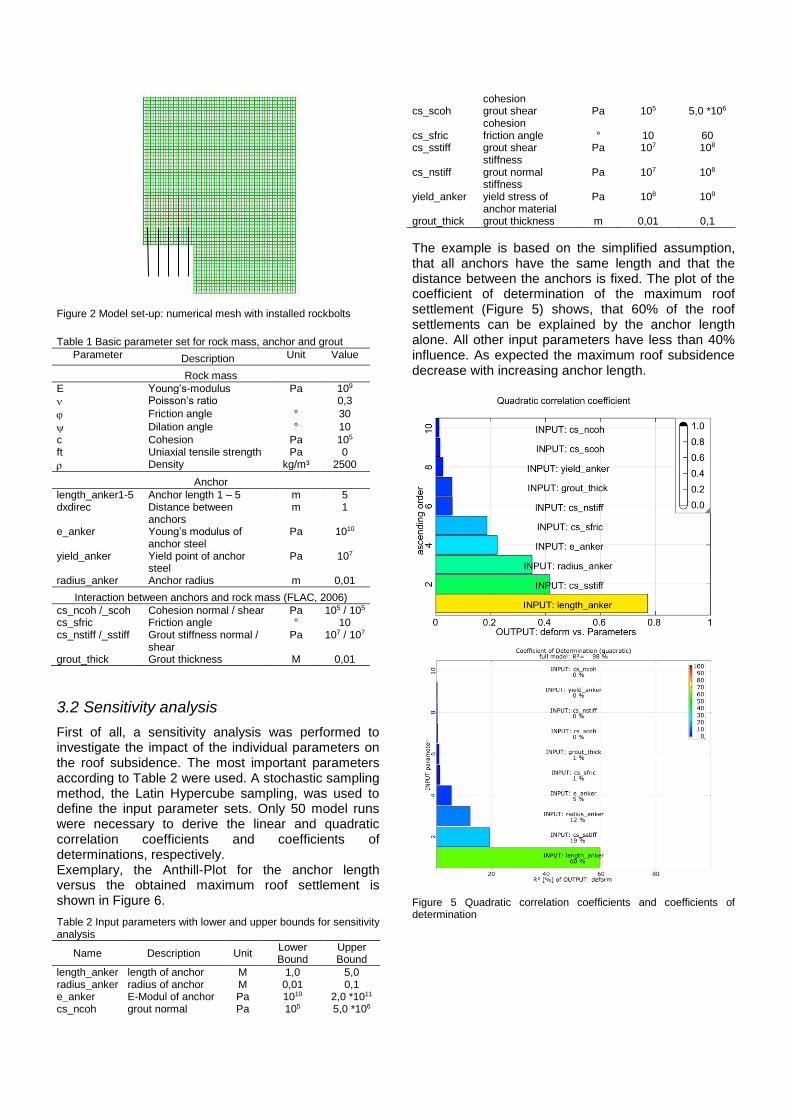
Figure 2 Model set-up: numerical mesh with installed rockbolts
Table 1 Basic parameter set for rock mass, anchor and grout
Parameter Description Unit Value
Rock mass
E Young’s-modulus Pa 109
Poisson’s ratio 0,3
Friction angle ° 30
Dilation angle ° 10
c Cohesion Pa 105 ft Uniaxial tensile strength Pa 0
Density kg/m³ 2500
Anchor
length_anker1-5 Anchor length 1 – 5 m 5 dxdirec Distance between
anchors m 1
e_anker Young’s modulus of anchor steel
Pa 1010
yield_anker Yield point of anchor steel
Pa 107
radius_anker Anchor radius m 0,01
Interaction between anchors and rock mass (FLAC, 2006)
cs_ncoh /_scoh Cohesion normal / shear Pa 105 / 105 cs_sfric Friction angle ° 10 cs_nstiff /_sstiff Grout stiffness normal /
shear Pa 107 / 107
grout_thick Grout thickness M 0,01
3.2 Sensitivity analysis
First of all, a sensitivity analysis was performed to investigate the impact of the individual parameters on the roof subsidence. The most important parameters according to Table 2 were used. A stochastic sampling method, the Latin Hypercube sampling, was used to define the input parameter sets. Only 50 model runs were necessary to derive the linear and quadratic correlation coefficients and coefficients of determinations, respectively. Exemplary, the Anthill-Plot for the anchor length versus the obtained maximum roof settlement is shown in Figure 6.
Table 2 Input parameters with lower and upper bounds for sensitivity analysis
Name Description Unit Lower Bound
Upper Bound
length_anker length of anchor M 1,0 5,0 radius_anker radius of anchor M 0,01 0,1 e_anker E-Modul of anchor Pa 1010 2,0 *1011 cs_ncoh grout normal Pa 105 5,0 *106
cohesion cs_scoh grout shear
cohesion Pa 105 5,0 *106
cs_sfric friction angle ° 10 60 cs_sstiff grout shear
stiffness Pa 107 108
cs_nstiff grout normal stiffness
Pa 107 108
yield_anker yield stress of anchor material
Pa 108 109
grout_thick grout thickness m 0,01 0,1
The example is based on the simplified assumption, that all anchors have the same length and that the distance between the anchors is fixed. The plot of the coefficient of determination of the maximum roof settlement (Figure 5) shows, that 60% of the roof settlements can be explained by the anchor length alone. All other input parameters have less than 40% influence. As expected the maximum roof subsidence decrease with increasing anchor length.
Figure 5 Quadratic correlation coefficients and coefficients of determination

MINING & GEOMECHANICS
6 B U L E T I N R e s u r s e M i n e r a l e N r . 2 / 2 0 0 6
Figure 6 Anthill-plot: anchor length (m) versus output (maximum roof settlement; m)
Based on the knowledge, that the anchor length plays a dominate role, a second sensitivity analysis was performed, there both, the parameters for the rock mass as well as the parameters for the interaction between the rock mass and the anchors were fixed. Instead of fixed anchor locations, now the anchors are allowed to move along the roof and the anchor length can be different for each anchor within the values of 1 to 5 m, Table 3.
Table 3 Input parameters with lower and upper bounds for sensitivity analysis
Name Description Unit Lower Bound
Upper Bound
length1 length of anchor 1 m 1,0 5,0 length2 length of anchor 2 m 1,0 5,0 length3 length of anchor 3 m 1,0 5,0 length4 length of anchor 4 m 1,0 5,0 length5 length of anchor 5 m 1,0 5,0 dxdirec1 distance between
symmetry axis and anchor 1
m 0,25 2,5
dxdirec2 distance between anchor 1 and 2
m 0,5 2,5
dxdirec3 distance between anchor 2 and 3
m 0,5 2,5
dxdirec4 distance between anchor 3 and 4
m 0,5 2,5
dxdirec5 distance between anchor 4 and 5
m 0,5 2,5
This sensitivity analysis shows that the anchors 1 and 2 have by far the strongest influence on the roof subsidence. The length of the anchor 5 (nearest to the side wall) shows no correlation to the maximum roof subsidence, Figures 7 and 8.
3.3 Optimization
Based on the results of the sensitivity analysis, an optimization based on evolutionary algorithms was performed. A quite interesting approach is the Pareto-Optimization, where several contradictory objective functions are defined.
Figure 3: Numerical model set-up
Figure 4 Quadratic correlation coefficients and coefficients of determination

MINERIT & GEOMECANICĂ
B U L E T I N R e s u r s e M i n e r a l e N r . 2 / 2 0 0 6 7
Besides the technical (safety) objective f1 (= maximum allowable roof settlement) a second economic objective f2 (= minimum of total anchor length) was defined:
first objective
min subsidence roof maximumf1
second objective:
minlf
5
1i
i2
with the constraint:
m5,4dxdirec
5
1i
i
1000 runs were performed. The Pareto-Optimization automatically results in the maximum anchor length (5 x 5m) at the left upper corner and minimum anchor length (5 x 1m) at the right lower corner of the Pareto-front (see Figure 9). The best design gives an accumulated anchor length of 11 m for 2.5 cm roof subsidence (see Figure 10).
Figure 9 Roof settlement [m] versus accumulated anchor length [m]
Along the Pareto-front all other optimum designs can be obtained. The minimum roof subsidence is reached with the anchor lengths l1-5 = 5 m and the respective minima for the anchor distances.
Figure 10 Parameters for best design
The interesting point is, that both anchor length and location are strongly inhomogeneous for the optimum designs. This is caused by the inhomogeneous secondary stress field, the non-linearities of rock behaviour (plastifications) and the interaction between rock mass and anchors.
4 CONCLUSIONS
Numerical simulation tools as well as optimization and sensitivity analysis tools are developed and validated to a stage, that the can be used in geotechnical engineering. Also, the computational speed allows to perform such a combined analysis at least for some of the problems. Sensitivity analysis using the Latin hypercube sampling results in time-effective solution schemes, which need app. 50 to a few 100 runs only for even complex problems with more than 10 input variables. The evolutionary based Pareto-optimization is a valuable tool to combine safety and economic requirements to get an optimum design. Especially for the optimum design of support measures (anchors, nails, shotcrete, geotextiles etc.) this strategy offers a great perspective. Due to the demand to optimize processes in mining and civil engineering, mathematical based optimization is a valuable tool with no real alternative. The practical application of such strategies needs more specific definitions of constraints, e.g. restriction of a few discrete anchor lengths or anchors distances to allow the direct transfer into the engineering practice.

MINING & GEOMECHANICS
8 B U L E T I N R e s u r s e M i n e r a l e N r . 2 / 2 0 0 6
A group at the Department of Geotechnics at the Technical University of Freiberg (Germany) has started to work on such practical tasks for the mining industry.
REFERENCES
Goldberg, D. E. (1995). Evolution strategies ii: Theoretical aspects. In Genetic Algorithms in Engineering and Computer Science, chapter 7; Wiley, Chichester.
FLAC 2006. Itasca Consulting Group, Minneapolis, Minnesota, USA, www.itasca.de.
Myers, H.; Montgomery, C. (1995). Response Surface Methodology: Process and Product Optimization Using Designed Experiments. Wiley, New York.
optiSLang (2006). The optimizing Structural Language; Dynardo GmbH ; www.dynardo.de.
Rechenberg, I. (1994): Evolutionsstrategie '94. Werkstatt Bionik und Evolutionstechnik Vol. 1; Frommann-Holzboog, Stuttgart.
Schittkowski, K.; Zillober, C.; Zotemantel, R. Numerical comparison of nonlinear programming algorithms for structural optimisation. Structural Optimization, Vol.7, Nr.1, S. 1-28.
Stander,N.; Craig, K. (2002). On The Robustness of a Simple Domain Reduction Scheme for Simulation-Based Optimization. Int. Journal for Computer-Aided Engineering and Software.
Will, J.: Bucher, C. (2006). Statistische Maße für rechnerische Robustheitsbewertungen CAE-gestützter Berechnungsmodelle, Proceedings Weimarer Optimierungs - und Stochastiktage 3.0, , Weimar, Germany.


![SAMPLING-BASED RBDO USING STOCHASTIC SENSITIVITY …inverse reliability analysis using HMV+ and design optimization using PMA+ [14,15]. The propagation of the input uncertainty into](https://static.fdocuments.net/doc/165x107/5ede3c05ad6a402d66698d10/sampling-based-rbdo-using-stochastic-sensitivity-inverse-reliability-analysis-using.jpg)


