Near Real Time Satellite Event Detection, Characterization ...

Using Satellite Fire Detection to CalibrateComponents of the Fire Weather Index System inMalaysia and Indonesia
CAREN C. DYMOND
Canadian Forest Service506 Burnside Road, Victoria, BC V8Z 1M5, Canada
ROBERT D. FIELD
Canadian Forest Service5320 - 122nd StreetEdmonton AB T6H 3S5, Canada
ORBITA ROSWINTIARTI
Indonesian National Institute of Aeronautics and Space(LAPAN) Jl. Lapan, No. 70, 13710, Jakarta, Indonesia
GUSWANTO
Indonesian Bureau of Meteorology and Geophysics (BMG)Jl. Angkasa I/2,Kemayoran, Jakarta, 10720, Indonesia
ABSTRACT / Vegetation fires have become an increasingproblem in tropical environments as a consequence ofsocioeconomic pressures and subsequent land-usechange. In response, fire management systems are beingdeveloped. This study set out to determine the relationshipsbetween two aspects of the fire problems in western Indo-nesia and Malaysia, and two components of the CanadianForest Fire Weather Index System. The study resulted in anew method for calibrating components of fire danger ratingsystems based on satellite fire detection (hotspot) data.
Once the climate was accounted for, a problematic numberof fires were related to high levels of the Fine Fuel MoistureCode. The relationship between climate, Fine Fuel MoistureCode, and hotspot occurrence was used to calibrate FireOccurrence Potential classes where low accounted for 3% ofthe fires from 1994 to 2000, moderate accounted for 25%,high 26%, and extreme 38%. Further problems arise whenthere are large clusters of fires burning that may consumevaluable land or produce local smoke pollution. Once theclimate was taken into account, the hotspot load (numberand size of clusters of hotspots) was related to the FireWeather Index. The relationship between climate, FireWeather Index, and hotspot load was used to calibrate FireLoad Potential classes. Low Fire Load Potential conditions(75% of an average year) corresponded with 24% of thehotspot clusters, which had an average size of 30% of thelargest cluster. In contrast, extreme Fire Load Potentialconditions (1% of an average year) corresponded with 30%of the hotspot clusters, which had an average size of 58% ofthe maximum. Both Fire Occurrence Potential and Fire LoadPotential calibrations were successfully validated with datafrom 2001. This study showed that when ground measure-ments are not available, fire statistics derived from satellitefire detection archives can be reliably used for calibration.More importantly, as a result of this work, Malaysia andIndonesia have two new sources of information to initiate fireprevention and suppression activities.
The fire problems experienced in Indonesia andMalaysia are 1) the sheer number of fires that can oc-cur at a given time, 2) that some fires escape controlmeasures and burn economically or environmentallyvaluable land or forests, and 3) smoke pollution(UNDP 1998a). A fire danger rating system can informdecisions about fire prevention, mobilization, andsuppression activities (Stocks and others 1989, Andrews
and Bradshaw 1992). Reviews of the 1997/98 fire andsmoke disaster in Southeast Asia recommended that afire danger rating system be implemented (HTTF1997, UNDP 1998b). Implementation of such a systemwas expected to provide early warning information tostimulate proactive management activities for prevent-ing the spread of fire and reducing its impacts.
The Canadian Forest Fire Danger Rating System(CFFDRS) is used for exactly that kind of proactive firemanagement in Canada. Various components of theCFFDRS combine the inputs of risk, weather, fuels, andtopography to predict fire weather, fire occurrence,and fire behavior. The core of the CFFDRS is theCanadian Forest Fire Weather Index System (CFFWIS).It is composed of three codes that rate the moisture
KEY WORDS: Fire management; Tropical forest management; Veg-etation fires; Forest fires; Land fires; Hotspots
Published online May 10, 2005.
*Author to whom correspondence should be addressed; email:
Environmental Management Vol. 35, No. 4, pp. 426–440 ª 2005 Springer Science+Business Media, Inc.
DOI: 10.1007/s00267-003-0241-9

content of the fuels and three indices that indicate therelative fire behavior (VanWagner 1987). The successof the CFFWIS provides an opportunity for SoutheastAsian countries to incorporate an existing system intotheir fire management (Stocks and others, 1989).However, to be useful, the CFFWIS must be calibratedto the local climate, fuels, and fire problems. Withoutsuch calibration, errors in the system could result inunexpected fire problems (Fogarty and others 1998).
The problem of smoke pollution has been ad-dressed by calibrating the Drought Code from theCFFWIS for use as a predictor of haze events in westernIndonesia (Field and others 2004). The Drought Codeis defined as a numeric rating of the average moisturecontent of deep, compact organic layers (Merrill andAlexander 1987). That study used the relationship be-tween the climate, the Drought Code, and ground-based visibility to calibrate four classes that each triggerdifferent fire management activities (Field and others2004).
The problem of the large number of fires that canoccur at a given time is influenced by the dryness of thefuels and the presence of an ignition source. Oneelement that we can monitor is the relative dryness offine plant litter. This is the component of the vegeta-tion biomass that is most readily flammable (Pyne1984). Within the CFFWIS, the Fine Fuel MoistureCode (FFMC) is defined as a numeric rating of themoisture content of litter and other cured fine fuels(Merrill and Alexander 1987). It is also considered agood indicator of the ease of ignition (Muraro 1975).The most direct approach to calibrating the FFMC is bytesting ignitions under many different weather condi-tions (Simard 1970, Lawson and others 1993). A moreindirect but still reliable approach is to use historicalfire occurrence data for calibration (Van Wagner1987). Fire occurrence is defined as the number offires started in a given area over a given period of time(Merrill and Alexander 1987).
The province of Alberta, Canada, performed a cali-bration study when adopting the CFFWIS (Kiil andothers 1977). Researchers found that the FFMC hadthe highest correlation to fire occurrence among fourdifferent components of the Fire Weather Index Sys-tem. A recent study in Saskatchewan, Canada, alsofound a high correlation between FFMC and fireoccurrence (Anderson and Englefield 2001). This wastrue for both people-caused and lightning-caused fires.
Other problems occur when large clusters of firesoccur in a spatial region and persist over time, possiblyburning economically or environmentally valuableland or forests. These large and persistent fires may bea consequence of deliberate land clearing of that scale,
or a result of fires that have escaped control measures.Typically, land-clearing fires are controlled by fuelbreaks (Colfer 2000). If a fire escapes beyond the fuelbreaks, control measures may include application ofwater from tanker-trucks, or digging ditches andclearing fuel breaks using shovels or excavators. Once afire has started, it may escape control for a variety ofreasons. These reasons usually include the dryness andamount of fuel that combine to create fire intensity orrates of spread that are difficult to suppress with theresources available. Within the CFFWIS, these factorsare monitored daily using the Fire Weather Index. TheFWI component is considered to be a good generalindicator of all kinds of fire activity (Van Wagner1987).
The province of British Columbia, Canada, adoptedthe Canadian Forest Fire Weather Index System in1974. As part of that implementation, the FWI com-ponent was calibrated based on fire load (BC Ministryof Forests 1983). Fire load is defined as the numberand magnitude of all fires requiring suppression actionduring a given period within a specified area (Merrilland Alexander 1987). The British Columbia calibra-tion derived a Fire Load Index by combining therelationship between the Duff Moisture Code and fireoccurrence, and the relationship between the FWI andfire size (Turner 1973). This index and interpretationwere calibrated for two different climatic regionswithin the province. Further evolution of the CFFWISin British Columbia included identifying a third cli-matic zone and relating classes of individual compo-nents to the size of all active fires, total area burned,economic costs, and fire severity (BC Ministry of For-ests 1983).
The Alberta calibration study mentioned above alsoincluded the FWI (Kiil and others 1977). In that study,the FWI was correlated to suppression difficulty. Sup-pression difficulty is defined similarly to fire load (thenumber of fires and fire size measured at discovery, atinitial attack, and when under control). The studyconcluded that FWI is a good predictor of suppressiondifficulty, but cautioned that the relationship wasinfluenced by human settlement and fire managementpatterns at the time. Furthermore, fire size is stronglyinfluenced by the seasonal condition of fuels (Kiil andothers 1977).
The Saskatchewan, British Columbia, and Albertastudies relied on ground-based measurements of firecharacteristics, such as area burned. Such fire reportsare usually not available in Indonesia and Malaysia, butsatellite fire detection (hotspot) records are readilyavailable. The hotspot records have been used as proxyof fire records in relation to biomass burning and
Calibrating the FFMC and FWI 427

emissions (Duncan and others 2003). The generalpublic, fire managers, and fire policy makers in Indo-nesia and Malaysia use these hotspots as qualitativeindicators of fire occurrence (HTTF 1997, Hiroki1999–2001). The public and managers perceive thatmore hotspots equate to more fire problems; forexample, the number of hotspots per province is re-ported on nightly news broadcasts in Indonesia. Anincreasing number of hotspots within a province couldbe due to large intentional land clearing, a large firebeing out of control, or because of a number of coor-dinated small controlled burns (Arino and Melinotte1995). If the high number of fires in a province persistsover numerous days, the perception is that fires haveescaped controls. Despite potential difficulties, themultiyear hotspot databases provide an opportunity tocharacterize the relationship between CFFWIS com-ponents and the fire problems in Indonesia andMalaysia.
The purpose of this study was to calibrate the FFMCand the FWI components of the CFFWIS to the climateand two fire problems experienced by western Indo-nesia and Malaysia. Our first objective was to describethe frequency distribution of daily FFMC and FWIvalues as a consequence of the local climate. The sec-ond objective was to measure the problem of thenumber of fires as the relative hotspot occurrence, andmeasure the problem of regions of persistent fires as
hotspot load. The third objective was to determine therelationships between FFMC and FWI values, the cli-mate, and the fire problems to calibrate classes for afire danger rating system.
Methods
Study Area
The study area lies between 6�S and 8�N latitudeand 95�E and 120�E longitude (Figure 1). The totalland area was almost 135 Mha. This area of westernIndonesia and Malaysia has consistent climate, vegeta-tion types, and cultural burning practices (Collins andothers 1991).
Data Collection
The CFFWIS is based on daily weather records.Weather surfaces of each CFFWIS component werecalculated from 1994 to 2001 daily weather data ac-quired from the National Climatic Data Center (avail-able at http://www.ncdc.noaa.gov). This center imple-ments significant quality control and archival serviceon synoptic weather data from the Global Telecom-munications System. The CFFWIS indices are usuallycalculated on 12:00 local standard time observations oftemperature, relative humidity, and wind speed. Dailymean values of these parameters were used because
96°0’0"E
96°0’0"E
100°0’0"E
100°0’0"E
104°0’0"E
104°0’0"E
108°0’0"E
108°0’0"E
112°0’0"E
112°0’0"E
116°0’0"E
116°0’0"E
6°0’0"S 6°0’0"S
2°0’0"S 2°0’0"S
2°0’0"N 2°0’0"N
6°0’0"N 6°0’0"N
Sumatra island, Indonesia
Kalimantan,Indonesia
WestMalaysia
Sarawak, Malaysia
Sabah,Malaysia
Singapore
Brunei
Thailand
0 300 600150km
Figure 1. Study area of western Indonesia and Malaysia.
428 C. C. Dymond and others

noon observations were not available in the dataset.Twenty-four-hour rainfall, totaled at 0000 UTC (0700or 0800 local time in the study area) was used in placeof rainfall totaled at noon. The year 1999 was not usedbecause rainfall data were unavailable between Januaryand October. Data from the year 2001 were used forvalidation purposes. Grids of each CFFWIS componentwere created using Spatial Fire Management Systemsoftware (Lee and others 2002) using inverse distanceweighting interpolation with adjustments to tempera-ture and relative humidity based on altitude. Therewere no modifications made to the Spatial Fire Man-agement System software or the calculations of theindices. Each grid cell was 10 · 10 km.
Fire detection data were acquired from the WorldAlong Track Scanning Radiometer (ATSR) Fire Atlas(Arino and Melinotte 1995, Arino and others 2001).The thermal 3.7-lm channel of the ATSR sensor issensitive to radiation emitted at temperatures rangingfrom 500 to 1000�K. With a 3-day revisit cycle, firedetection was carried out on nighttime data, whichprevents false detection due to solar reflection. Thisway, the detection capability ranged from fires of0.1 ha at 600�K to 0.01 ha at 800�K, for a backgroundtemperature of 300�K. The algorithm triggered a‘‘hotspot’’ if the thermal channel was greater than312�K, the saturation point for the channel. Weassumed a constant underestimation of fire activity bythe hotspots, that should not, therefore, affect theclass boundaries. These data were previously used tostudy the interseasonal variability in biomass burningand emissions (Duncan and others 2003). For eachhotspot detected, the date, time, and location inlatitude and longitude were reported for a 1 · 1 kmpixel. Based on the location of each hotspot, fireweather values were assigned from the 10 · 10 kmFFMC and FWI grids.
Data Sampling for Hotspot Occurrence
An increasing number of hotspots indicates morefire problems (HTTF 1997, UNDP 1998a, Hiroki 1999–2001). Unfortunately, for statistical analysis, the rawhotspot data could not be used to estimate hotspotoccurrence because one hotspot does not equal onefire. Each hotspot could be the result of more than onefire within a 1 · 1-km ATSR cell, or a large fire couldresult in multiple hotspots over many cells over manydays. (Fire occurrence is defined as the number of firesstarted in a given area over a given period of time[Merrill and Alexander 1987].) Furthermore, the rawhotspot data has spatial and temporal autocorrelationcharacteristics that violate the assumption of indepen-dence in most common statistical tests. For example, a
village may coordinate a number of field-clearingburns (Arino and Melinotte 1995).
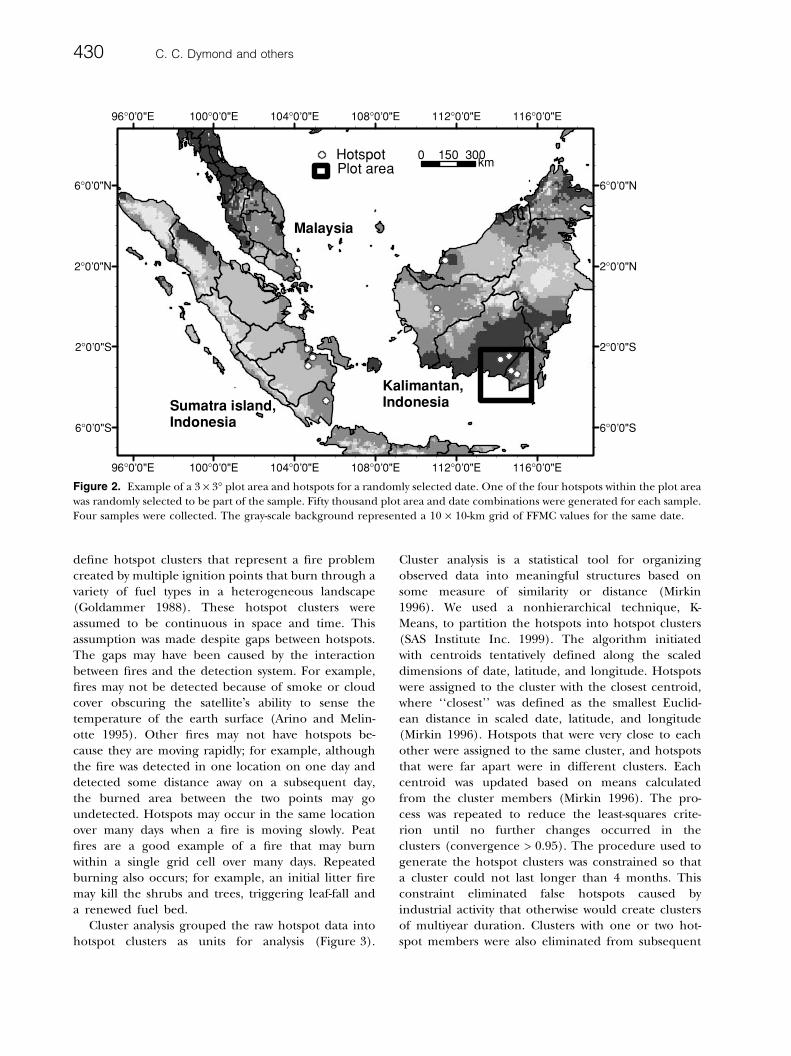
To address these autocorrelation problems, weestimated hotspot occurrence from the presence of ahotspot in a randomly sampled area on a randomlysampled date. Four samples were collected from thepopulation of hotspots available. In each sample, plotareas (3� · 3�) and dates were randomly generated50,000 times (Figure 2). If a hotspot was present in theplot area and on the generated date, it were includedin the sample. If more than one hotspot were present,one was randomly selected. The data were available for1995 to 2001. A total of 20,900 hotspots were availableand 1512 to 2763 hotspots were collected in eachsample. Since less than 10% of the population wascollected, the probability that those data points wereautocorrelated was low.
If fires are occurring independent of fuel moisture,then they are most likely to occur on days with the mostcommon FFMC values. To account for the effect ofclimate on fires, the distribution of FFMC in an averageyear was determined. The possible range of FFMCvalues is from 0 to 101 and increases as the moisturecontent of fine fuels decreases (Van Wagner 1987).The climate distribution was calculated from the sameweather data used to calculate the fire weather grids.Only records from the most reliable stations were in-cluded, specifically, those with greater than 75% rain-fall completeness, plus one additional station to ensurethat the study area was covered. The result was 31weather stations and 42,043 records. The frequency ofoccurrence of each FFMC integer at each station wascalculated on an annual basis (e.g., number of days in ayear that FFMC = 78). The annual occurrence, theaverage among the 31 weather stations, was then usedto calculate a cumulative probability.
The frequency of fires occurring in each initialFFMC class was calculated for each sample. The initialFFMC classes were based on the climate distribution, sothat each initial class accounted for 10% of the days inan average year (10 classes in total). This accounted forthe effect of climate. The null hypothesis was that themeans would be equal because the fires occurredindependent of FFMC. This hypothesis was testedusing a Tukey�s test (Sokal and Rolf 1995).
Data Clustering for Hotspot Load
More hotspots within a province indicates a wors-ening situation (HTTF 1997, Hiroki 1999–2001). Theraw hotspot data have spatial and temporal autocorre-lation characteristics that violate the assumption ofindependence in most common statistical tests. Wecapitalized on these autocorrelation characteristics to
Calibrating the FFMC and FWI 429
define hotspot clusters that represent a fire problemcreated by multiple ignition points that burn through avariety of fuel types in a heterogeneous landscape(Goldammer 1988). These hotspot clusters wereassumed to be continuous in space and time. Thisassumption was made despite gaps between hotspots.The gaps may have been caused by the interactionbetween fires and the detection system. For example,fires may not be detected because of smoke or cloudcover obscuring the satellite�s ability to sense thetemperature of the earth surface (Arino and Melin-otte 1995). Other fires may not have hotspots be-cause they are moving rapidly; for example, althoughthe fire was detected in one location on one day anddetected some distance away on a subsequent day,the burned area between the two points may goundetected. Hotspots may occur in the same locationover many days when a fire is moving slowly. Peatfires are a good example of a fire that may burnwithin a single grid cell over many days. Repeatedburning also occurs; for example, an initial litter firemay kill the shrubs and trees, triggering leaf-fall anda renewed fuel bed.
Cluster analysis grouped the raw hotspot data intohotspot clusters as units for analysis (Figure 3).
Cluster analysis is a statistical tool for organizingobserved data into meaningful structures based onsome measure of similarity or distance (Mirkin1996). We used a nonhierarchical technique, K-Means, to partition the hotspots into hotspot clusters(SAS Institute Inc. 1999). The algorithm initiatedwith centroids tentatively defined along the scaleddimensions of date, latitude, and longitude. Hotspotswere assigned to the cluster with the closest centroid,where ‘‘closest’’ was defined as the smallest Euclid-ean distance in scaled date, latitude, and longitude(Mirkin 1996). Hotspots that were very close to eachother were assigned to the same cluster, and hotspotsthat were far apart were in different clusters. Eachcentroid was updated based on means calculatedfrom the cluster members (Mirkin 1996). The pro-cess was repeated to reduce the least-squares crite-rion until no further changes occurred in theclusters (convergence > 0.95). The procedure used togenerate the hotspot clusters was constrained so thata cluster could not last longer than 4 months. Thisconstraint eliminated false hotspots caused byindustrial activity that otherwise would create clustersof multiyear duration. Clusters with one or two hot-spot members were also eliminated from subsequent
96°0’0"E
96°0’0"E
100°0’0"E
100°0’0"E
104°0’0"E
104°0’0"E
108°0’0"E
108°0’0"E
112°0’0"E
112°0’0"E
116°0’0"E
116°0’0"E
6°0’0"S 6°0’0"S
2°0’0"S 2°0’0"S
2°0’0"N 2°0’0"N
6°0’0"N 6°0’0"N
Sumatra island, Indonesia
Kalimantan,Indonesia
Malaysia
HotspotPlot area
0 300150km
Figure 2. Example of a 3 · 3� plot area and hotspots for a randomly selected date. One of the four hotspots within the plot areawas randomly selected to be part of the sample. Fifty thousand plot area and date combinations were generated for each sample.Four samples were collected. The gray-scale background represented a 10 · 10-km grid of FFMC values for the same date.
430 C. C. Dymond and others

analysis, because they were likely to be manageablecompared to the much larger clusters.
Hotspot load was estimated using the hotspot clus-ters as the unit of analysis. An increasing number ofhotspot clusters, plus their increasing size, were inter-preted as increasing hotspot load based on the previ-ous work on fire load (Kiil and others 1977, BCMinistry of Forests 1983). The size of a hotspot clusterwas determined from the maximum range of latitudeor longitude of the member hotspots. FWI classes wereassigned to each burning area based on the maximumFWI of hotspots members. This value was used to cap-ture the worst fire weather conditions contributing tothe hotspot load. The average FWI among the hotspotmembers was also tested; however, the results wereunclear, possibly due to a skewed distribution. Thedata used for calibration were from 1995 to 2000. Thetotal number of hotspots was 20,900 and resulted in454 hotspot clusters.
If high hotspot loads are independent of fuelmoisture, then they are most likely to occur on dayswith the most common FWI values. The FWI rangesfrom close to zero (rounded to zero in this study) andis unbounded on its upper end (Van Wagner 1987).Extreme fire weather conditions in Canada are associ-ated with values above 21 to above 31, depending onthe location. To determine the effect of climate onfires, the distribution of FWI in an average year wascalculated using the same method as described forFFMC.
The average hotspot load was calculated for eachFWI class. These FWI classes were based on the climatedistribution, so that the four initial classes accountedfor 75%, 10%, 10%, and 5% of the days in an averageyear. The inequality of the initial classes preventedformulation of a clear, statistically testable nullhypothesis. The number of hotspot clusters and theirsizes were compared between FWI classes to detectdifferences that could be captured by class bound-aries. The initial classes that did not have distincthotspot loads were combined to result in the cali-brated classes.
Validation
The low density of weather stations in Indonesia andMalaysia was of concern because the weather may differbetween stations, which may have created inaccuracy inthe FFMC values associated with each hotspot. Thismay have been a source of error in defining the rela-tionships between hotspot occurrence or hotspot loadand fire weather. To test for this source of error, wegraphically compared the relationship between hotspotoccurrence and FFMC for all fires, and for those within20 km of a weather station. Twenty kilometers was aconservative guideline because weather stations havebeen found to be reliable within 40 km and unreliablebeyond 160 km (Turner and Lawson 1978). Twentykilometers is also the radius that the Indonesia Mete-orological Service uses to estimate the area accuratelyrepresented by its weather stations.
102°0’0"E
102°0’0"E
103°0’0"E
103°0’0"E
104°0’0"E
104°0’0"E
105°0’0"E
105°0’0"E
106°0’0"E
106°0’0"E
6°0’0"S
5°0’0"S 5°0’0"S
4°0’0"S 4°0’0"S
3°0’0"S 3°0’0"S
2°0’0"S 2°0’0"S
0 100 20050km
Southern most provinces of Sumatra island, Indonesia
Figure 3. Example of clustering for asmall area within the study area. Each dotrepresented one hotspot. Dots near eachother and with similar color wereassigned to the same cluster. Opencircles represented hotspots that werenot members of a cluster.
Calibrating the FFMC and FWI 431

Seasonality may have also influenced the relation-ship between hotspot occurrence and FFMC. Forexample, fires may occur at lower FFMC values duringwaste removal from agricultural lands because elevatedslash fuels are drier than fuels on the ground. Welooked at how the proportion of hotspots occurrencesin each Fire Occurrence Potential class changed overthe course of a year. Monthly intervals were used tocapture known agricultural seasons.
The class boundaries defined using 1995 to 2000hotspots data were validated using independent datafrom 2001. We graphically compared the proportion ofhotspots occurring in low, moderate, high, and ex-treme Fire Occurrence Potential classes. We alsographically compared hotspot load for low, moderate,high, and extreme Fire Load Potential classes. Thevalidation dataset had 823 hotspots and 68 hotspotclusters.
Results
Calibration of the Fine Fuel Moisture Code
The climate distribution of FFMC over a five-year-average indicated that low values were unlikely(Figure 4). The most frequently occurring values werebetween 80 and 85, with the maximum observed of 89.Therefore, if hotspot occurrence was independent offuel moisture, most hotspots would have occurredwhen the FFMC was between 80 and 85. Based on theclimate distribution, FFMC values were classified sothat each class represented 10% of the days in anaverage year.
Hotspot occurrence was the lowest when FFMC wasbetween 0 and 36 (Figure 5; Tukey�s test; alpha =0.05). Hotspot occurrence was the highest when FFMCwas greater than 83 (Tukey�s test; alpha = 0.05). Ratherthan most hotspots occurring between 80 and 85, ashypothesized above, the days with an FFMC of 84 to 89had 37.6% of all hotspots, despite representing only10% of days. An increasing FFMC from 36 to 84 cor-responded to a generally increasing hotspot occur-rence, increasing faster above an FFMC of 70. Thischange in slope corresponds with the theoretical igni-tion point of fine fuels at an FFMC of 70 to 73 (Muraro1975). Therefore, we set our Fire Occurrence Potentialclasses based on the climate and hotspot occurrence as:low, 0–36; moderate, 36–69; high, 69–83; and extreme,>83.
Calibration of the Fire Weather Index
The climate distribution of FWI over an average yearindicated that low values were very common
(Figure 6). FWI values above 6 accounted for less than10% of an average year. The maximum observed was33. If hotspot load was independent of the fire weather,many days with high hotspot load would occur whenFWI was 0 or 1 and low hotspot load situations wouldoccur when FWI was greater than 6. Because of theshape of the climate distribution, we could not defineFWI classes with equal representation of the days in anaverage year, as we did with FFMC. Instead, classesrepresenting 75%, 10%, 10%, and 5% of the days in anaverage year were used to account for the possible ef-fects of the climate on the occurrence of high or lowhotspot load situations.
Figure 4. Cumulative frequency distribution of the FineFuel Moisture Code from 1994 to 1998 and 2000; 1999 wasnot available.
Figure 5. The average number of hotspot occurrences(mean ± standard error), proportional to the total, withineach climate-based class of the Fine Fuel Moisture Code.
432 C. C. Dymond and others

The clustering analysis defined hotspot clustersthat may be a single fire or multiple fires. A total of454 hotspot clusters were identified (Table 1). Thenumber of hotspots within each cluster tended to belower than 12 (mode = 3, median = 11), althoughsome were quite large (mean = 45, maximum = 469).Clearly, the number of hotspots per cluster was notnormally distributed (kurtosis = 8, skewness = 2.7).The FWI values for the hotspot clusters were also notnormally distributed (kurtosis = )0.717, skew-ness = 0.692). Despite the climate analysis showingFWI values of 0 and 1 to be most common, themedian FWI value for the hotspot clusters was 6. Thehotspot size ranged from 0.01 to 1.05� latitude orlongitude with the mean at less than 0.5�. Therefore,analysis of these hotspot clusters was not indicative ofvariation within a local area, but of general trendsacross the entire study area.
Based on the combination of number and size ofhotspot cluster, hotspot load was lowest when the FWIclass was 0–1 (Figure 7). Although this range repre-sented 75% of days in an average year, it accounted foronly 24% of the total number of hotspot clusters, andthey tended to be only one third the size of the largesthotspot clusters. The relative difference in hotspot loadcould not be tested using a Tukey�s test because thedata violated the assumption of similar variances (Sokaland Rolf 1995). Hotspot load was highest when theFWI class was greater than 6, although this class rep-resented only 5% of days in an average year. This FWIclass accounted for 49% of the total number of hotspotclusters, and they tended to average half the size of thelargest cluster. The largest single hotspot cluster alsohad an FWI class above 6. Classes 2–3 and 4–6 each
represented 10% of days in an average year. They alsoaccounted for similar proportions of the number ofhotspot clusters (14% and 12%) and had hotspotclusters more than one third the size of the largestcluster. Therefore, we set our Fire Load Potentialclasses, based on hotspot load, as: low, 0–1, moderate,1–6, high and extreme, > 6. The range of FWI from 7to 33 (the maximum observed value) represented alarge range in weather conditions and potential firebehavior. Therefore, a class boundary between highand extreme was defined using the climatology (Fig-ure 6). An FWI value of 13 or greater was rare in anormal year (probability of < 0.01), and primarily oc-curred under extreme drought conditions when ex-treme fire behavior has been observed. Therefore, weset our Fire Load Potential class of high at 6–13 andextreme at > 13.
Validation
The low density of weather stations in the study areacould create inaccurate FFMC or FWI values. To testthis, we compared the relationship between FFMC andall hotspot occurrences with the relationship betweenFFMC and hotspots occurring within 20 km of aweather station. The number of hotspots in eachsample dropped dramatically (from 1512–2763 persample to 37–62 per sample). There was generalagreement that the proportion of hotspots occurrencesincreased as the Fire Occurrence Potential increasedfrom low to extreme (Figure 8). The differences mayhave been due to local rainfall events being applied tolarge areas between weather stations, resulting in theunderestimation of the FFMC values so fires wereoverrepresented in the moderate class and underrep-resented in the extreme class. We also compared theproportion of fires that occur in each month, onaverage (Figure 9). Hotspot occurrence varied season-ally; the greatest proportion of fires occurred at theend of the dry season in August and September. De-spite this seasonal variation, almost all fires occurredunder high or extreme Fire Occurrence Potentialconditions. The smaller peak in the high conditions ofJune was unexpected.
When hotspot occurrence data from 2001 wereanalyzed, the proportion of hotspots occurring in-creased as the Fire Occurrence Potential class in-creased from low to extreme (Figure 10). Analysis ofhotspot load data from 2001 indicated an increasinghotspot load as the Fire Load Potential class increasedfrom low to extreme (Figure 11). The results from2001 were consistent with the calibration based on1994–2000 data.
Figure 6. Cumulative frequency distribution of the FireWeather Index from 1994 to 1998 and 2000; 1999 was notavailable.
Calibrating the FFMC and FWI 433

Discussion
This study found a positive relationship betweenincreasing FFMC and hotspot occurrence. This rela-tionship allowed us to define Fire Occurrence Poten-tial classes for western Indonesia and Malaysia. Thetrend of an increasing proportion of hotspots occur-ring as Fire Occurrence Potential increased was con-sistent despite the seasonal drought and the use of anindependent dataset. The seasonal pattern was consis-tent with the cultural practices. Crop rotation of her-baceous crops (e.g., rice, vegetables) generally occursin late February through March, and August throughSeptember (Collins and others 1991). Woody slashburning generally occurs in August and September(Ketterings and others 1999, Saharjo and others 1999).The interpretation of the Fire Occurrence Potentialclasses was developed from the data analysis and fromdiscussions with fire managers in Indonesia and Can-ada (Table 2). The classes and interpretations should
Figure 7. The hotspot load condition associated with eachclimate-based class of the Fire Weather Index (FWI): (a)component of the hotspot load estimated from the propor-tion of all hotspot clusters to fall within an FWI class; (b)component of hotspot load estimated from the size of hot-spot clusters in a class (mean ± standard error) proportionalto the maximum hotspot cluster size.
Table 1. Descriptive statistics for hotspot clusters
Statistic Number of hotspots per cluster Cluster size (degrees latitude or longitude) Fire Weather Index value
Mean 45.3 0.455 8.99Standard error 3.63 0.011 0.39Median 11.0 0.47 6.0Mode 3.0 0.50 0.0Standard deviation 77.5 0.236 8.3Sample variance 6004.0 0.056 68.9Kurtosis 8.0 )0.628 )0.72Skewness 2.72 )0.073 0.69Range 466.0 1.04 32.0Minimum 3.0 0.01 0.0Maximum 469.0 1.05 32.0
Figure 8. The relationship between average Fire OccurrencePotential and hotspot occurrence for all hotspots and forhotspots within 20 km of a weather station.
434 C. C. Dymond and others

be regularly reviewed and improved by experiencedusers.
Our results were consistent with studies relatingground observations of fire occurrence with FFMC inthat relative hotspot occurrence estimated from sa-tellite fire detection increased as FFMC increased.However, the Fire Occurrence Potential classboundaries were set at quite different values than areused in Canada. For example, the calibration studyfor the province of Alberta resulted in FFMC classboundaries of: low, 0–60; moderate, 61–80; high, 81–86; very high, 87–90; and extreme, 91+ (Kiil andothers 1977). One factor creating these different re-sults was the different climates. The maximum FFMCobserved in western Indonesia and Malaysia from
1997 to 2000 was 89 (Figure 4). Under the Albertacalibration, extreme conditions would never occur.However, there are anecdotal reports of extremelydry conditions and easily ignited fuels. Likewise, themoderate class boundaries of 36–69 for westernIndonesia and Malaysia may seem improbable toCanadian users. Under Canadian conditions, fires areunlikely to occur when the FFMC is less than 70(Muraro 1975). The hotspot occurrences at FFMCvalues from 36 to 69 may be an artifact of the lowdensity of weather stations, they may reflect the dif-ferent drying conditions that occur in the tropicalclimate, or they may be a consequence of theintentional nature of the burning. The differencebetween the class boundaries for Alberta and Indo-nesia and Malaysia reinforces the importance ofcompleting calibration studies.
The interpretation of Fire Occurrence Potentialclasses (Table 2) includes reference to different fuelgroups (Dymond and others 2004). Fire managersintuitively understand that some fuel types have drierlitter compared to others and are therefore more easilyflammable. This intuition is supported by study resultsin Canada (Lawson and others 1993) and Indonesia(Marjenah and Toma 1999, Nicolas and Beebe 1999,Fogarty 2002). In general, the more protection thelitter fuels have from solar radiation and wind, themore drying time is needed to reach the moisturecontent required for ignition.
Hotspot load generally increased as FWI increased.This relationship allowed us to define Fire Load Po-tential classes. About half of the hotspot clusters oc-curred under low or moderate Fire Load Potentialconditions. These fire clusters probably represent theuse of fire as a tool by knowledgeable villagers, wherethe fires are easy to control and tend to go out at thefuel breaks or at roads (Colfer 2000). However, theother half of the hotspot clusters occurred underunusually dry conditions (probability of 0.05) and overlarger areas (average size 54% of maximum). Theinterpretation of the Fire Load Potential classes wasdeveloped from our study results and from discussionswith Indonesian and Canadian fire managers (Ta-ble 3). The classes and interpretations should also beregularly reviewed.
The pattern of increasing hotspot load withincreasing FWI was validated as consistent by the 2001data. Despite 2001 being a normal year, with few daysin the extreme class, there was a greater proportion ofhotspot clusters in the extreme class compared to thehigh class. Hotspot clusters experiencing extremeconditions also tended to be the largest. Similar FWIclasses have been applied to managing open burning
Figure 10. The proportion of hotspot occurrences(mean ± standard error) within each Fire Occurrence Po-tential class during the validation year of 2001.
Figure 9. The proportion of hotspot occurrences (mean)within each Fire Occurrence Potential class on a monthlybasis.
Calibrating the FFMC and FWI 435

in the province of Prince Edward Island, Canada (PEIDepartment of Agriculture and Forestry 1999). TheFWI classes are low (0–1), moderate (2–8), high (9–15), very high (16–21), and extreme (> 22). Burningpermits are valid when the FWI is low and are never
valid when the FWI is high or extreme. Under mod-erate conditions, burning is restricted, such as, if it isnecessary to burn slash under moderate FWI condi-tions, permit holders must ensure that the surroundingground is wet.
Figure 11. The hotspot load condition associated with each Fire Load Potential class during the validation year of 2001: (a)component of the hotspot load estimated from the proportion of all clusters; (b) component of hotspot load estimated from thesize of a cluster in a class (mean) proportional to the maximum cluster size.
Table 2. Interpretation of Fire Occurrence Potential classes calibrated from the Fine Fuel Moisture Code (FFMC)for the fire danger rating systems of Indonesia and Malaysiaa
Fire OccurrencePotential class
FFMCrange
Proportion ofan average year
Proportion of firesoccurring 1994–1998 Interpretation
Low 0–36 0.20 0.025 Few fires will occurModerate 36–69 0.35 0.25 Ignitions may occur in Grassland or Slash
fuel groupsHigh 69–83 0.35 0.26 Grassland and Slash fuel groups will easily ignite,
potentially resulting in many firesExtreme >83 0.10 0.38 Open forest, Grassland, and Slash fuel groups will
easily ignite, potentially resulting in many fires
aProportions do not sum to 1 because of averaging and rounding.
Table 3. Interpretation of Fire Load Potential classes calibrated from the Fire Weather Index (FWI) for the firedanger rating systems of Indonesia and Malaysiaa
Fire LoadPotentialclass FWI
Proportionof anaverage year
Proportion ofhotspot clustersoccurring
Average of clustersize compared tomaximum size (%) Interpretation
Low 0–1 0.75 0.24 30 Fire clusters may occur, but they are relativelysmall and of short duration
Moderate 1–6 0.20 0.26 35 Fire clusters are more probable and may belarger than under low conditions
High 6–13 0.04 0.19 39 Fire clusters are probable and may be larger thanunder moderate conditions
Extreme >13 0.01 0.30 58 Severe drought conditions and dangerous burningconditions exist. Fire clusters are highly probable,and may become large
aProportions do not sum to 1 because of averaging and rounding.
436 C. C. Dymond and others
Calibrating the FFMC and FWI 437

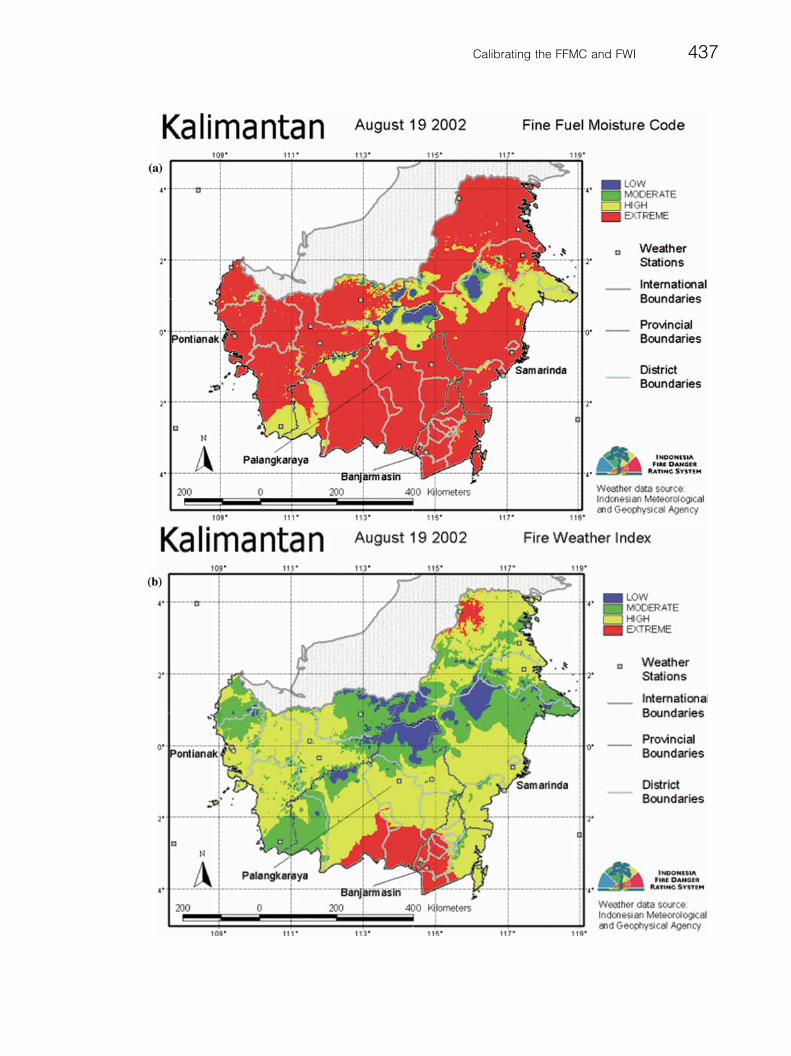
A major communication tool of the Indonesia firedanger rating system is daily maps produced by theIndonesian Bureau of Meteorology and Geophysics(www.bmg.go.id). For example, the Fire OccurrencePotential (Figure 12a) and the Fire Load Potential(Figure 12b) maps for Kalimantan provinces on Au-gust 19, 2002. A satellite image with hotspots andsmoke plumes (Figure 12c) provides fire informationfrom the same day. Although fires occur in manylocations over the landscape, the smoke plumes appearto originate within areas of high and extreme FireLoad Potential. From this comparison, the FireOccurrence Potential and Fire Load Potential mapsappear to provide a reliable and useful source to in-form fire managers.
Conclusion
The Fire Occurrence Potential classes represent theFine Fuel Moisture Code calibrated to Indonesian andMalaysian climate and hotspot occurrence. The mosthotspots (38%) occurred under extreme Fire Occur-rence Potential conditions. The Fire Load Potentialclasses represent the Fire Weather Index calibrated to
Indonesian and Malaysian climate and hotspot load.The greatest amount of hotspot activity (30% of hot-spot clusters with an average size of 58% of the maxi-mum) occurred under extreme Fire Load Potentialconditions. The Fire Load Potential and the FireOccurrence Potential, as part of the currently opera-tional fire danger rating systems for Indonesia, Malay-sia, and Southeast Asia, will provide information that isfundamental to fire prevention, mobilization, andsuppression activities. This calibration is to be used forgeneral prevention, planning, and mobilization pur-poses. The local Fire Occurrence Potential and FireLoad Potential conditions depend on many site-spe-cific factors that cannot be anticipated at the island ornational level.
References
Anderson, K., and P. Englefield. 2001. Quantile characteris-tics of forest fires in Saskatchewan, Proceedings of the 4thSymposium on Fire and Forest Meteorology, 13–15November 2001, Reno, NV.
Andrews, P. L., and L. S. Bradshaw. 1992. Use of meteoro-logical information for fire management in the UnitedStates. Proceedings of the workshop on meteorological
Figure 12. Fire information for Kalimantan provinces forAugust 19, 2002: (a) Fire Occurrence Potential classes; (b)Fire Load Potential classes; (c) satellite image from theModerate Resolution Imaging Spectroradiometer sensor(courtesy of the Earth Observatory website: earthobserva-tory.nasa.gov).
438 C. C. Dymond and others

information for forest fire management in the westernMediterranean region. World Meteorological Organiza-tion, Geneva, Switzerland, pp. 325–332.
Arino, O., and J.-M. Melinotte. 1995. Fire Index Atlas. EarthObservation Quarterly 50:11–16.
Arino, O., M. Simon, I. Piccolini, and J. M. Rosaz. 2001. TheERS-2 ATSR-2 World Fire Atlas and the ERS-2 ATSR-2World Burnt Surface Atlas projects. Proceedings of the 8thISPRS Conference on Physical Measurement and Signa-tures in Remote Sensing, 8–12 January 2001, Aussois.http://shark1.esrin.esa.it.
BC Ministry of Forests. 1983. Fire weather indices, decisionaids for forest operations in British Columbia. BritishColumbia forest protection handbook 12. ProtectionBranch, Victoria, BC, Canada.
Colfer, C. J. P. 2000. Fire in East Kalimantan: A panoply ofpractices, views and (discouraging) effects. CIFOR-ICRAFreport, Bogor, Indonesia.
Collins, N. M., J. A. Sayer, T. C. Whitmore (eds.). 1991. Theconservation atlas of tropical forests: Asia and the Pacific.IUCN, Simon and Schuster, New York.
Duncan, B. N., R. V. Martin, A. C. Staudt, R. Yevich, and J. A.Logan. 2003. Interannual and seasonal variability of bio-mass burning emissions constrained by satellite observa-tions. Journal of Geophysical Research 108(D2):4100, doi:10.1029/2002JD002378, ACH1-1–1-13.
Dymond, C. C., O. Roswintiarti, and M. Brady. 2004. Char-acterizing and mapping fuels for Malaysia and westernIndonesia. International Journal of Wildland Fire 13:323–333.
Field, R. D., Y. Wang, O. Roswinkarti, and Guswanto. 2004. Adrought-based predictor of recent haze events in westernIndonesia. Atmospheric Environment 38:1869–1878.
Fogarty, L. G. 2002. Use of fire management information tosupport decision making: Berau forest management pro-ject. Proceedings of Fire Early Warning Workshop, ASEANFire Danger Rating Group, 15 February 2002, Jakarta,Indonesia.
Fogarty, L. G., H. G. Pearce, W. R. Catchpole, and M. E.Alexander. 1998. Adoption vs. adaptation: Lessons fromapplying the Canadian Forest Fire Danger Rating System inNew Zealand. 3rd International Conference on Forest FireResearch and 14th Conference on Fire and Forest Mete-rology, 16–20 November 1998, Luso. Vol. I, pp. 1011–1028.
Goldammer, J. G. 1988. Rural land-use and wildland fires inthe tropics. Agroforestry Systems 6:235–252.
Hiroki, I. 1999–2001. Monthly hotspot review. Forest Fire Pre-vention Management Project (FFPMP) Update 1(1)–3(2).
HTTF (Haze Technical Task Force), 1997. Regional hazeaction plan. Association of Southeast Asian Nations, Ja-karta, Indonesia.
Ketterings, Q. M., T. T. Wibowo, M. Noordwijk, and E. Penot.1999. Farmer�s perspectives on slash-and-burn as a landclearing method for small-scale rubber producers in Se-punggur, Jambi province, Sumatra, Indonesia. Forest Ecologyand Management 120:157–169.
Kiil, A.D., R. S. Miyagawa, and D. Quintilio. 1977. Calibrationand performance of the Canadian Fire Weather Index in
Alberta. Information Report NOR-X-I73, Canadian ForestService, Edmonton, AB, Canada.
Lawson, B. D., O. B. Armitage, and G. N. Dalrymple. 1993.Ignition probabilities for simulated people-caused fires inBritish Columbia�s lodgepole pine and white spruce–sub-alpine fir forests. In: Proceedings of the 12th InternationalConference on Fire and Forest Meteorology, 26–29 Octo-ber 1993, Jekyll Island, Georgia, USA.
Lee, B. S., M. E. Alexander, B. C. Hawkes, T. J. Lynham, B. J.Stocks, and P. Englefield. 2002. Information systems insupport of wildland fire management decision making inCanada. Computers and Electronics in Agriculture 37:185–198.
Marjenah, and T. Toma. 1999. Effect of selective logging andforest fire on microclimate of lowland dipterocarp forest inBukit Soeharto, East Kalimantan. Pages 599–606 in H. Su-hartoyo, T. Toma (eds.), Impacts of fire and human activ-ities on forest ecosystems in the tropics. Proceedings of the3rd International Symposium on Asian Tropical ForestManagement. 20–23 September, Samarinda, Indonesia.PUSREHUT special publication no. 8.
Merrill, D. F., and M. E. Alexander. 1987. Glossary of firemanagement terms. 4 ed. Publication No. 26516, NationalResearch Council, Ottawa, ON, Canada.
Mirkin, B. 1996. Mathematical classification and clustering.Pages 110–135 in Nonconvex optimization and its appli-cations, vol. 11. Kluwer Academic Publishers, Boston.
Muraro, S. J. 1975. Prescribed fire predictor. Miscellaneouspublication, Environment Canada. Canadian Forest Ser-vice, Victoria, BC, Canada.
Nicolas, M. V. J., and G. S. Beebe. 1999. Fire management inthe logging concessions and plantation forests of Indone-sia. Forest fire prevention and control project report,Palembang, Indonesia and integrated forest fire manage-ment project report, Samarinda, Indonesia.
PEI Department of Agriculture and Forestry, 1999. Control-ling the burn. Forestry management note No. 1. Char-lottetown, PEI, Canada.
Pyne, S. J. 1984. Introduction to wildland fire. John Wiley &Sons, Toronto, ON, Canada.
Saharjo, B. H., E. A. Husaeni, Kasno, and H. Watanabe. 1999.Management of fuel and fire in preparing land for forestplantations and shifting cultivation. Fire and sustainableagriculture and forestry development in eastern Indonesiaand Northern Australia. Australian Center for Interna-tional Agriculture Research (ACIAR), Proceedings No. 91,Darwin, Australia, pp. 39–44.
Simard, A. J. 1970. Reference manual and summary of testfire, fuel moisture and weather observations made by forestfire researchers between 1931 and 1961. Information re-port FF-X-25, Canadian Forest Service, Edmonton, AB,Canada.
Sokal, R. R., and F. J. Rohlf. 1995. Biometry, 3 ed. W. H.Freeman and Co., New York.
Statistical Analysis Software. 1999. SAS OnlineDoc, version 8.SAS Institute Inc., Cary, NC.
Stocks, B. J., B. D. Lawson, M. E. Alexander, C. E. Wagner, R.S. McAlpine, T. J. Lynham, and D. E. Dube. 1989. TheCanadian Forest Fire Danger Rating System: An overview.The Forestry Chronicle 65:258–265.
Calibrating the FFMC and FWI 439

Turner, J. A. 1973. A Fire Load Index for British Columbia: Aprovisional report on the calibration of the Fire WeatherIndex for B.C. Information Report BC-X-80. CanadianForest Service, Edmonton, AB, Canada.
Turner, J. A., and B. D. Lawson. 1978. Weather in the Cana-dian Forest Fire Danger Rating System: A user guide tonational standards and practices. Information report BC-X-177. Canadian Forest Service, Edmonton, AB, Canada.
UNDP (United Nations Development Program). 1998a. For-est and land fires in Indonesia, Vol. 1: Impacts, factors and
evaluation of efforts. State Ministry for Environment, Ja-karta, Republic of Indonesia.
UNDP (United Nations Development Program). 1998b. For-est and land fires in Indonesia, Vol. 2: Plan of action for firedisaster management. State Ministry for Environment, Ja-karta, Republic of Indonesia.
Van Wagner, C. E. 1987. Development and structure of theCanadian Forest Fire Weather Index System. Technicalreport 35. Canadian Forest Service, Edmonton, AB, Can-ada.
440 C. C. Dymond and others