Using Relative Importance Index Method for Developing Risk ...
13
Jurnal Kejuruteraan 32(3) 2020: 441-453 https://doi.org/10.17576/jkukm-2020-32(3)-09 Using Relative Importance Index Method for Developing Risk Map in Oil and Gas Construction Projects Mukhtar A. Kassem 1 Programme of Civil Engineering, Faculty of Engineering and Built Environment, Universiti Kebangsaan, Bangi, Malaysia Muhamad Azry Khoiry*, 3 Noraini Hamzah Smart and Sustainable Township Research Centre, Faculty of Engineering and Built Environment Universiti Kebangsaan Malaysia, Bangi Selangor, Malaysia *Corresponding author: [email protected] Received 08 January 2020, Received in revised form 12 February 2020 Accepted 20 March 2020, Available online 30 August 2020 ABSTRACT The objective of this research is to classify risk factors and their ranking in terms of their probability and impact on construction projects in the oil and gas sector, to test the relationship between the causes and effects of risk factors and then develop the risk map to facilitate the planning of risk response strategies. To achieve this objective, researchers invited practitioners and engineers who are comprising a statistically representative sample of oil and gas sector population to joining a structured questionnaire survey. A total of fifty-one (51) factors were short-listed to be made part of the questionnaire survey. The survey was conducted with 357 participants of construction project teams as a sampling of populations from all oil and gas sectors in Yemen. The relative importance index (RII) method was applied to prioritize the project risk factors. RII data were used to develop a risk map for oil and gas construction projects. Correlation coefficient and reliability tests also carried out to know the relationship between risk factors and check the validity of the research. The reliability test of the questionnaire was 0.974 for the cause of risks and 0.81 for the effects, which considered very high value. RII analysis and risk map shown the most critical risk factors effected on project success. There is a significant contribution expected from this research, especially for companies operating in the oil and gas and other organizations that plan to invest in this field, in addition to expected benefits for the governments and researchers in this field due to lack of research in this field. Keywords: Risk map; RII; construction project; oil and gas; risk factors INTRODUCTION The developing countries such as Yemen need to develop and construct more development projects in order to increase economic growth and to generate more sophistication and job opportunities, as the projects require considerable amounts of investments. In this context, any loses (duration, resources and cost) will result in a significant financial loss, nevertheless, due to the various risk factors associated with these megaprojects, which would have a significant impact in the project’s completion time, without overruling costs (Renuka et al. 2014). As reported by Ahmad et al. (2013), Yemen’s construction projects are the 4th most prominent source of jobs in Yemen, accounting for about 9-10 per cent of the workforce and an annual average building industry growth rate of approximately 5.4 per cent that contributes effectively to Yemen’s economic growth. Like other developing countries, the Yemeni construction industry remains an essential sector of the country’s development process and an income tributary for every organization and person, including for the constructing sector, which has a substantial impact on domestic earnings and the average incomes of the individual employees. The risk can be identified in any project as an unknown occurrence or situation that has a negative or positive impact on the project objective (Rose 2013). Of example, each risk factor is the trigger or the inadequacy of this force for the tasks assigned to it by a project’s restricted qualified employees, which will have an impact or effects of additional costs or imbalances in the plan of operation or in the result of a level of execution. The risk factor is also the cause circumstances under which the project may lead to risk being classified as maladministration or negligence or dependent on external contractors to execute the project. In comparison, such risk factors are identified that have been recognized and assessed and can be prepared against unknown risks which cannot be addressed even if project managers are able to handle them
Transcript of Using Relative Importance Index Method for Developing Risk ...
Jurnal Kejuruteraan 32(3) 2020: 441-453https://doi.org/10.17576/jkukm-2020-32(3)-09
Using Relative Importance Index Method for Developing Risk Map in Oil and Gas Construction Projects
Mukhtar A. Kassem1 Programme of Civil Engineering, Faculty of Engineering and Built Environment, Universiti Kebangsaan, Bangi, Malaysia
Muhamad Azry Khoiry*, 3Noraini HamzahSmart and Sustainable Township Research Centre, Faculty of Engineering andBuilt Environment Universiti Kebangsaan Malaysia, Bangi Selangor, Malaysia
*Corresponding author: [email protected]
Received 08 January 2020, Received in revised form 12 February 2020Accepted 20 March 2020, Available online 30 August 2020
ABSTRACT
The objective of this research is to classify risk factors and their ranking in terms of their probability and impact on construction projects in the oil and gas sector, to test the relationship between the causes and effects of risk factors and then develop the risk map to facilitate the planning of risk response strategies. To achieve this objective, researchers invited practitioners and engineers who are comprising a statistically representative sample of oil and gas sector population to joining a structured questionnaire survey. A total of fifty-one (51) factors were short-listed to be made part of the questionnaire survey. The survey was conducted with 357 participants of construction project teams as a sampling of populations from all oil and gas sectors in Yemen. The relative importance index (RII) method was applied to prioritize the project risk factors. RII data were used to develop a risk map for oil and gas construction projects. Correlation coefficient and reliability tests also carried out to know the relationship between risk factors and check the validity of the research. The reliability test of the questionnaire was 0.974 for the cause of risks and 0.81 for the effects, which considered very high value. RII analysis and risk map shown the most critical risk factors effected on project success. There is a significant contribution expected from this research, especially for companies operating in the oil and gas and other organizations that plan to invest in this field, in addition to expected benefits for the governments and researchers in this field due to lack of research in this field.
Keywords: Risk map; RII; construction project; oil and gas; risk factors
INTRODUCTION
The developing countries such as Yemen need to develop and construct more development projects in order to increase economic growth and to generate more sophistication and job opportunities, as the projects require considerable amounts of investments. In this context, any loses (duration, resources and cost) will result in a significant financial loss, nevertheless, due to the various risk factors associated with these megaprojects, which would have a significant impact in the project’s completion time, without overruling costs (Renuka et al. 2014).
As reported by Ahmad et al. (2013), Yemen’s construction projects are the 4th most prominent source of jobs in Yemen, accounting for about 9-10 per cent of the workforce and an annual average building industry growth rate of approximately 5.4 per cent that contributes effectively to Yemen’s economic growth. Like other developing countries, the Yemeni construction industry
remains an essential sector of the country’s development process and an income tributary for every organization and person, including for the constructing sector, which has a substantial impact on domestic earnings and the average incomes of the individual employees.
The risk can be identified in any project as an unknown occurrence or situation that has a negative or positive impact on the project objective (Rose 2013). Of example, each risk factor is the trigger or the inadequacy of this force for the tasks assigned to it by a project’s restricted qualified employees, which will have an impact or effects of additional costs or imbalances in the plan of operation or in the result of a level of execution. The risk factor is also the cause circumstances under which the project may lead to risk being classified as maladministration or negligence or dependent on external contractors to execute the project. In comparison, such risk factors are identified that have been recognized and assessed and can be prepared against unknown risks which cannot be addressed even if project managers are able to handle them
442
by way of general contingency plans. Contingency plans are based on past experience gained by past projects. A profound effect is considered for some of the risk factors that threatens the project’s success, but is accepted when balanced with the respective result. The vulnerability is a significant factor throughout the project life cycle and may be known to be one of the most significant obstacles and the driving force behind project progress is risk management.
Salazar-Aramayo et al. (2013), confirmed, a project can achieve, when it fulfils the requirements of the key stakeholders within the target timeline, budget and quality standard. Furthermore, the work has been adopted in identifying and classifying the risk factors in construction projects in the petroleum and natural gas sector as well as their effect on the main components of the project, i.e. costs, project timelines and execution efficiency. Oils and Gas companies need more detailed risk assessments to support in preparing and budgeting and project scheduling so that risk factors are defined, and the final cost or execution timeline cannot be achieved without the experience of classifying and assessing risks that could delay the project and therefore establish appropriate project response plans. The loss of most projects occurs through incompetence in the implementation of risk management plans, by preventing or shifting threats and by managing risk with stakeholders and reducing their consequences. All of this cannot be accomplished if they are not assessed and rated according to their impact on the project.
In order to determine the relative value of the different causes and effects of threats, the relative importance index is used. In this report, different groups (such as consultants, project managers, owner and site supervisor) shall adopt the same approach. Every single factor is considered to be a fifth-point scale from 1 (very low-grade effect) to 5 (extremely high-grade effect). This is generally used for the estimation of factor impact in construction management studies. (Al-Sabah, Menassa and Hanna 2014; Haupt et al. 2015; Alaghbari, Al-Sakkaf and Sultan 2017).
LITERATURE REVIEW
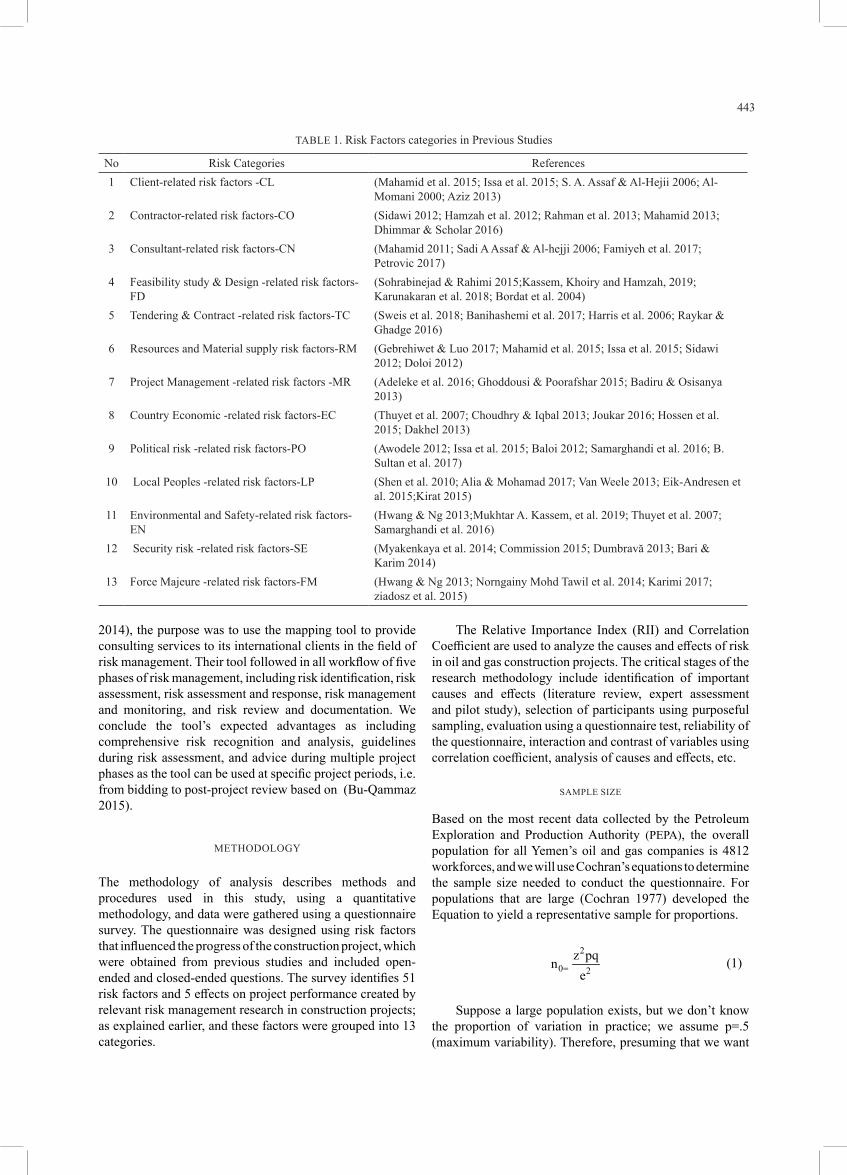
The study relied on many previous studies (books, articles or research papers) to identify risk factors for construction projects in the oil and gas industry and to investigate for the abstract and concluding criteria, and then to select studies on the risks in construction projects, and to concentrate on oil and gas-related research. The risk factor list has been developed and includes a literature review of 51 risk factors (Mukhtar et al. 2018). The risk sources in Table 1, therefore, present all the risk-factor groups from various sources, which are classified into thirteen main groups by source and impact on oil and gas construction projects success, are provided by the sources of construction risk factors and a questionnaire was prepared based on the probability and impact of the risk factors. The questionnaire was then prepared.
As examples of previous studies, (Enshassi & Abu Mosa 2008) listed the following nine significant groups were more detailed and ultimately categorized: (a) Physical; (b) Environmental; (c) Design; (d) Logistics; (e) Financial;(f) Legal; (g) Building, (h) Policy; and I Risk management.The researchers proposed that contractor companies shouldcontinuously assess the expense of quota loss and determinethe length of the deal and evaluate risk factors. Education and further education programs should be provided to engineersand project managers on how to handle, control and mitigaterisks in construction projects. Employers should also try,through control of reliable cash flows and elimination ofbank loans used to fund projects, for preventing financialfailures and losses. Based on experience, professional riskmanagement staff or subcontractors, contractors wouldlearn how to organize and transfer other risks.
While, after an analysis of the data obtained in field registrars by companies and contractors in Saudi Arabia, the impact of risk factors on construction delays was analyzed according to duration, extent and significance (Sadi A. Assaf & Al-Hejji 2006). 76% of contractors surveyed reported that the time overrun was between 10% and 30% of the original period and 56% defined the same amount. In fact, 25% of the contractors indicated that the average time for the project was from 30% to 50%. The investigator also found the delay in construction as the overall result of many of the cases explored in this field to be the most significant risk (Sadi A Assaf & Al-hejji 2006).
Risk analysis is to define and assess the risk using the appropriate method, thereby providing a suitable solution which removes or reduces the risk. In other words, the project’s performance is improved with minimal risk from the cost, time and requirements viewpoint. Furthermore, in the methodology used in many previous studies, we will use the relative significance approach to identify risk factors in oilfield construction projects (Tawil et al. 2013; Aziz and Abdel-Hakam 2016; Khair et al. 2016; Ali, Zhu, and Hussain 2018).
The relative importance index RII is a statistical method to determine the ranking of different factors (Hossen et al. 2015).
Tools and techniques for qualitative risk assessment include risk quality assessment, risk likelihood and impact assessment, probability and impact matrix risk map, urgent risk assessment, and risk categorization. (El-Shehaby, Nosair and Sanad 2014). According to Dziadosz & Rejment (2015), the most common approaches for project risk analysis are methods that define and preliminarily assess risks such as (risk matrix or sometimes Ishikawa diagram, risk map) and those methods that help decision-making in project assessment and selection.
The best available information should be used to assess the source of awareness as tools for risk mapping. This paper will incorporate an information-based risk analysis method that uses the best available knowledge of the organization and helps decision-makers set the risk management structure for global oil and gas construction projects (Yildiz et al.
443
2014), the purpose was to use the mapping tool to provide consulting services to its international clients in the field of risk management. Their tool followed in all workflow of five phases of risk management, including risk identification, risk assessment, risk assessment and response, risk management and monitoring, and risk review and documentation. We conclude the tool’s expected advantages as including comprehensive risk recognition and analysis, guidelines during risk assessment, and advice during multiple project phases as the tool can be used at specific project periods, i.e. from bidding to post-project review based on (Bu-Qammaz 2015).
METHODOLOGY
The methodology of analysis describes methods and procedures used in this study, using a quantitative methodology, and data were gathered using a questionnaire survey. The questionnaire was designed using risk factors that influenced the progress of the construction project, which were obtained from previous studies and included open-ended and closed-ended questions. The survey identifies 51 risk factors and 5 effects on project performance created by relevant risk management research in construction projects; as explained earlier, and these factors were grouped into 13 categories.
The Relative Importance Index (RII) and Correlation Coefficient are used to analyze the causes and effects of risk in oil and gas construction projects. The critical stages of the research methodology include identification of important causes and effects (literature review, expert assessment and pilot study), selection of participants using purposeful sampling, evaluation using a questionnaire test, reliability of the questionnaire, interaction and contrast of variables using correlation coefficient, analysis of causes and effects, etc.
SAMPLE SIZE
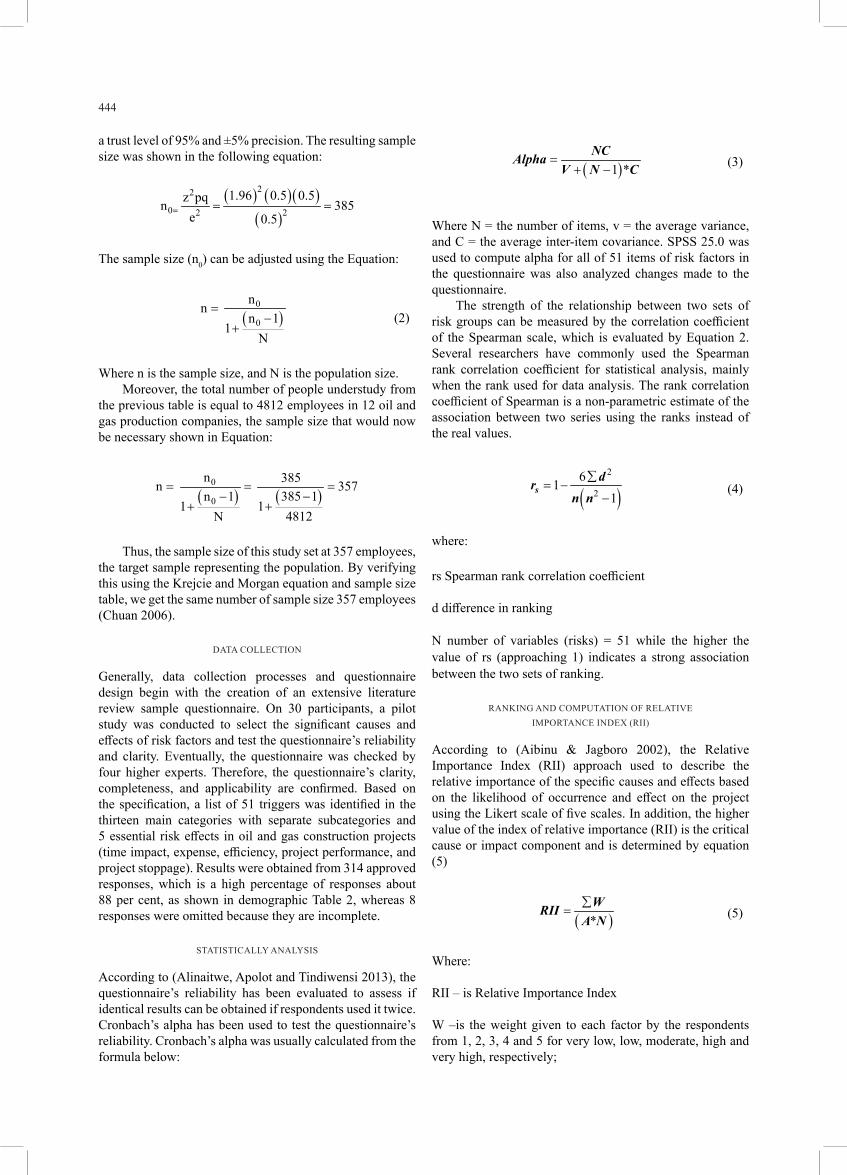
Based on the most recent data collected by the Petroleum Exploration and Production Authority (PEPA), the overall population for all Yemen’s oil and gas companies is 4812 workforces, and we will use Cochran’s equations to determine the sample size needed to conduct the questionnaire. For populations that are large (Cochran 1977) developed the Equation to yield a representative sample for proportions.
2
0 2z pqne= (1)
Suppose a large population exists, but we don’t know the proportion of variation in practice; we assume p=.5 (maximum variability). Therefore, presuming that we want
TABLE 1. Risk Factors categories in Previous Studies
No Risk Categories References1 Client-related risk factors -CL (Mahamid et al. 2015; Issa et al. 2015; S. A. Assaf & Al-Hejii 2006; Al-
Momani 2000; Aziz 2013)2 Contractor-related risk factors-CO (Sidawi 2012; Hamzah et al. 2012; Rahman et al. 2013; Mahamid 2013;
Dhimmar & Scholar 2016)3 Consultant-related risk factors-CN (Mahamid 2011; Sadi A Assaf & Al-hejji 2006; Famiyeh et al. 2017;
Petrovic 2017)4 Feasibility study & Design -related risk factors-
FD(Sohrabinejad & Rahimi 2015;Kassem, Khoiry and Hamzah, 2019; Karunakaran et al. 2018; Bordat et al. 2004)
5 Tendering & Contract -related risk factors-TC (Sweis et al. 2018; Banihashemi et al. 2017; Harris et al. 2006; Raykar & Ghadge 2016)
6 Resources and Material supply risk factors-RM (Gebrehiwet & Luo 2017; Mahamid et al. 2015; Issa et al. 2015; Sidawi 2012; Doloi 2012)
7 Project Management -related risk factors -MR (Adeleke et al. 2016; Ghoddousi & Poorafshar 2015; Badiru & Osisanya 2013)
8 Country Economic -related risk factors-EC (Thuyet et al. 2007; Choudhry & Iqbal 2013; Joukar 2016; Hossen et al. 2015; Dakhel 2013)
9 Political risk -related risk factors-PO (Awodele 2012; Issa et al. 2015; Baloi 2012; Samarghandi et al. 2016; B. Sultan et al. 2017)
10 Local Peoples -related risk factors-LP (Shen et al. 2010; Alia & Mohamad 2017; Van Weele 2013; Eik-Andresen et al. 2015;Kirat 2015)
11 Environmental and Safety-related risk factors-EN
(Hwang & Ng 2013;Mukhtar A. Kassem, et al. 2019; Thuyet et al. 2007; Samarghandi et al. 2016)
12 Security risk -related risk factors-SE (Myakenkaya et al. 2014; Commission 2015; Dumbravă 2013; Bari & Karim 2014)
13 Force Majeure -related risk factors-FM (Hwang & Ng 2013; Norngainy Mohd Tawil et al. 2014; Karimi 2017; ziadosz et al. 2015)
444
a trust level of 95% and ±5% precision. The resulting sample size was shown in the following equation:
( ) ( )( )( )
22
0 2 2
1.96 0.5 0.5z pqn 385e 0.5
= = =
The sample size (n0) can be adjusted using the Equation:
( )0
0
nn
n 11
N
=−
+(2)
Where n is the sample size, and N is the population size.Moreover, the total number of people understudy from
the previous table is equal to 4812 employees in 12 oil and gas production companies, the sample size that would now be necessary shown in Equation:
( ) ( )0
0
n 385n 357385 1n 1
114812N
= = =−−
++
Thus, the sample size of this study set at 357 employees, the target sample representing the population. By verifying this using the Krejcie and Morgan equation and sample size table, we get the same number of sample size 357 employees (Chuan 2006).
DATA COLLECTION
Generally, data collection processes and questionnaire design begin with the creation of an extensive literature review sample questionnaire. On 30 participants, a pilot study was conducted to select the significant causes and effects of risk factors and test the questionnaire’s reliability and clarity. Eventually, the questionnaire was checked by four higher experts. Therefore, the questionnaire’s clarity, completeness, and applicability are confirmed. Based on the specification, a list of 51 triggers was identified in the thirteen main categories with separate subcategories and 5 essential risk effects in oil and gas construction projects (time impact, expense, efficiency, project performance, and project stoppage). Results were obtained from 314 approved responses, which is a high percentage of responses about 88 per cent, as shown in demographic Table 2, whereas 8 responses were omitted because they are incomplete.
STATISTICALLY ANALYSIS
According to (Alinaitwe, Apolot and Tindiwensi 2013), the questionnaire’s reliability has been evaluated to assess if identical results can be obtained if respondents used it twice. Cronbach’s alpha has been used to test the questionnaire’s reliability. Cronbach’s alpha was usually calculated from the formula below:
( )1 *=
+ −NCAlpha
V N C (3)
Where N = the number of items, v = the average variance, and C = the average inter-item covariance. SPSS 25.0 was used to compute alpha for all of 51 items of risk factors in the questionnaire was also analyzed changes made to the questionnaire.
The strength of the relationship between two sets of risk groups can be measured by the correlation coefficient of the Spearman scale, which is evaluated by Equation 2. Several researchers have commonly used the Spearman rank correlation coefficient for statistical analysis, mainly when the rank used for data analysis. The rank correlation coefficient of Spearman is a non-parametric estimate of the association between two series using the ranks instead of the real values.
( )2
2
611
∑= −
−s
drn n
(4)
where:
rs Spearman rank correlation coefficient
d difference in ranking
N number of variables (risks) = 51 while the higher the value of rs (approaching 1) indicates a strong association between the two sets of ranking.
RANKING AND COMPUTATION OF RELATIVEIMPORTANCE INDEX (RII)
According to (Aibinu & Jagboro 2002), the Relative Importance Index (RII) approach used to describe the relative importance of the specific causes and effects based on the likelihood of occurrence and effect on the project using the Likert scale of five scales. In addition, the higher value of the index of relative importance (RII) is the critical cause or impact component and is determined by equation (5)
( )*∑
=WRII
A N (5)
Where:
RII – is Relative Importance Index
W –is the weight given to each factor by the respondents from 1, 2, 3, 4 and 5 for very low, low, moderate, high and very high, respectively;
445
A – is the highest weight (i.e., 5 in this case), and;N – is the total number of respondents.
RISK MAP
The standard risk map, which is used to determine the risk zone for each identified risk factor. The matrix is 5 X 5, with the impact ranging from VL to VH on the horizontal axis and probability (with the same range) on the vertical axis. Three colour zones are present in the map (Dumbravă 2013).
RESULTS AND DISCUSSION
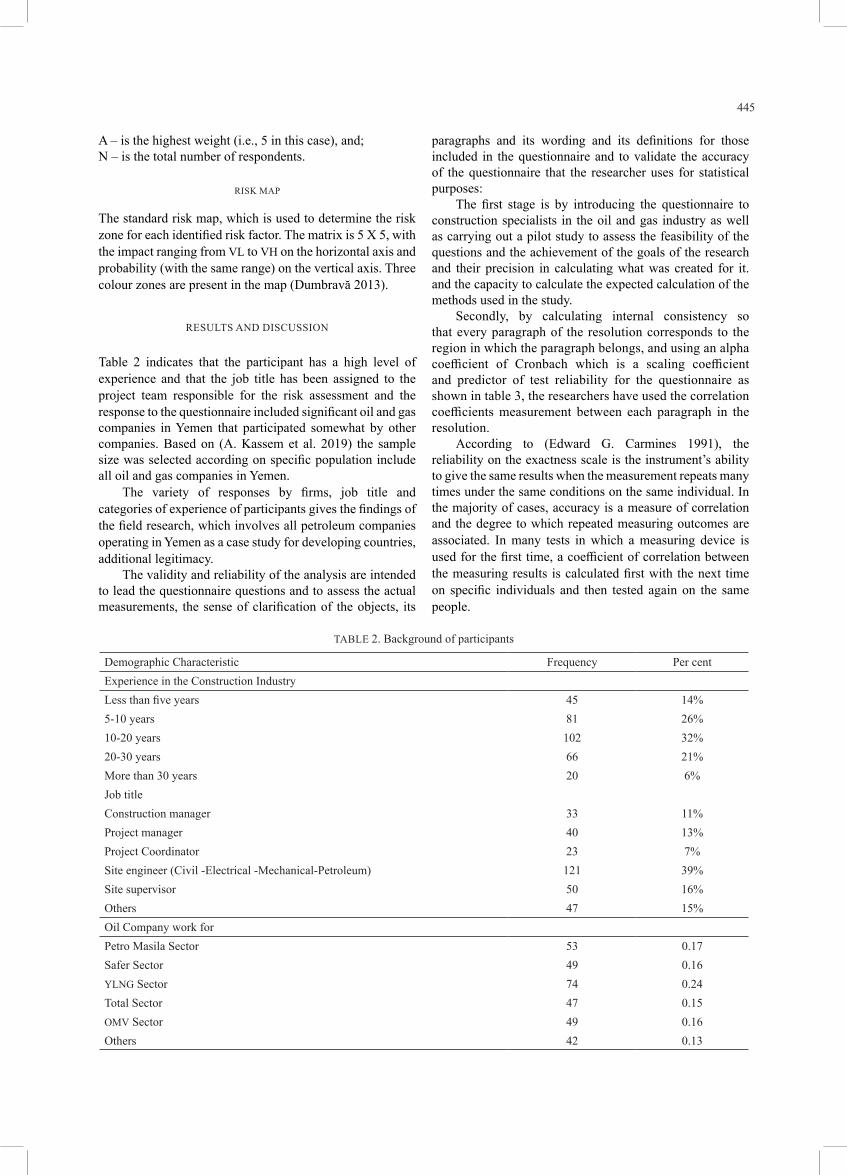
Table 2 indicates that the participant has a high level of experience and that the job title has been assigned to the project team responsible for the risk assessment and the response to the questionnaire included significant oil and gas companies in Yemen that participated somewhat by other companies. Based on (A. Kassem et al. 2019) the sample size was selected according on specific population include all oil and gas companies in Yemen.
The variety of responses by firms, job title and categories of experience of participants gives the findings of the field research, which involves all petroleum companies operating in Yemen as a case study for developing countries, additional legitimacy.
The validity and reliability of the analysis are intended to lead the questionnaire questions and to assess the actual measurements, the sense of clarification of the objects, its
paragraphs and its wording and its definitions for those included in the questionnaire and to validate the accuracy of the questionnaire that the researcher uses for statistical purposes:
The first stage is by introducing the questionnaire to construction specialists in the oil and gas industry as well as carrying out a pilot study to assess the feasibility of the questions and the achievement of the goals of the research and their precision in calculating what was created for it. and the capacity to calculate the expected calculation of the methods used in the study.
Secondly, by calculating internal consistency so that every paragraph of the resolution corresponds to the region in which the paragraph belongs, and using an alpha coefficient of Cronbach which is a scaling coefficient and predictor of test reliability for the questionnaire as shown in table 3, the researchers have used the correlation coefficients measurement between each paragraph in the resolution.
According to (Edward G. Carmines 1991), the reliability on the exactness scale is the instrument’s ability to give the same results when the measurement repeats many times under the same conditions on the same individual. In the majority of cases, accuracy is a measure of correlation and the degree to which repeated measuring outcomes are associated. In many tests in which a measuring device is used for the first time, a coefficient of correlation between the measuring results is calculated first with the next time on specific individuals and then tested again on the same people.
TABLE 2. Background of participants
Demographic Characteristic Frequency Per centExperience in the Construction IndustryLess than five years 45 14%5-10 years 81 26%10-20 years 102 32%20-30 years 66 21%More than 30 years 20 6%Job titleConstruction manager 33 11%Project manager 40 13%Project Coordinator 23 7%Site engineer (Civil -Electrical -Mechanical-Petroleum) 121 39%Site supervisor 50 16%Others 47 15%Oil Company work forPetro Masila Sector 53 0.17Safer Sector 49 0.16YLNG Sector 74 0.24Total Sector 47 0.15OMV Sector 49 0.16Others 42 0.13

446
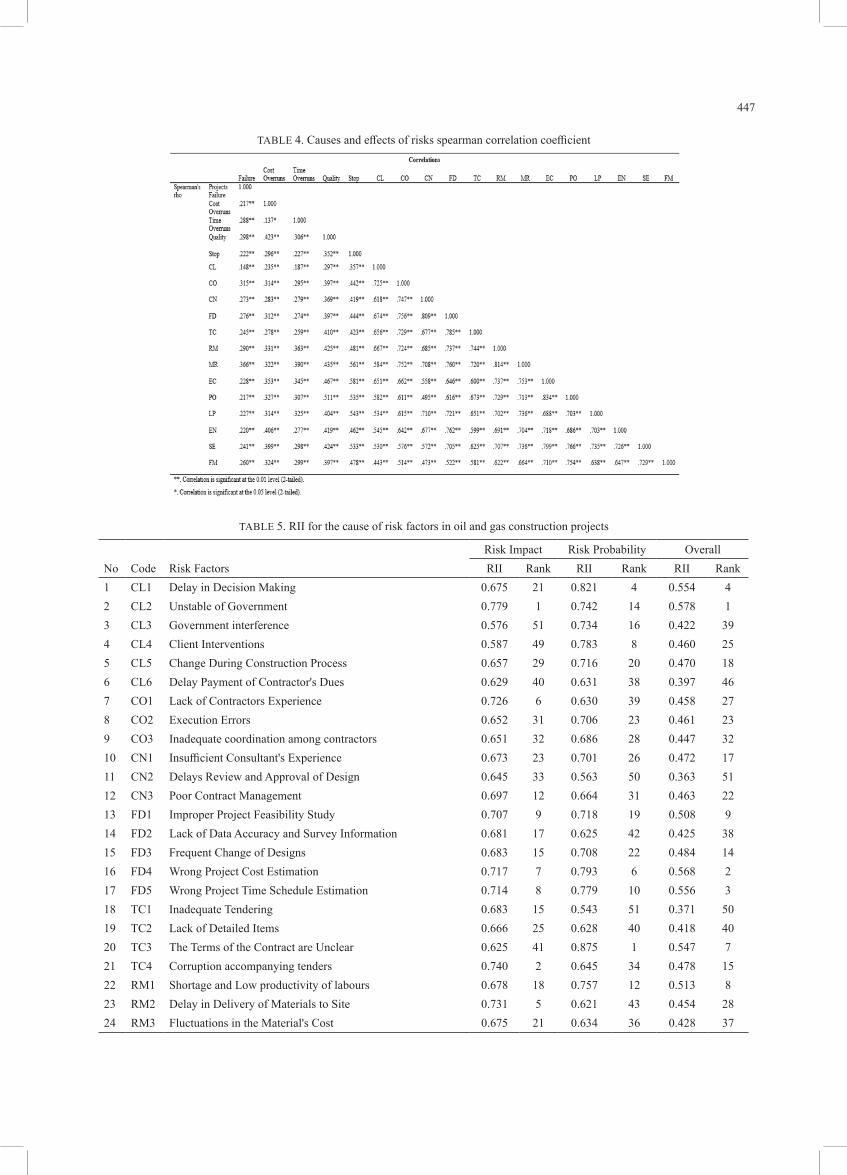
According to (George & Mallery 2016) the Spearman correlation coefficient is a coefficient that measures the correlation between different phenomena or two or more variables to see if one or a group of them is associated with the other, for example, this research aims to see if there is a correlation between the causes of risk and the effects of risks on the success Construction project in the oil and gas sector in Yemen. Table 4 present the correlation between the cause and effects of risk factors in oil and gas construction projects.
Spearman test analysis in table 4 shows high correlation between cause and effect of risk factors on oil and gas construction projects which indicates to the value of this research for risk management team, engineers and project planning management in taking risk factors and their impact into account during the preparation of the cost and schedule of the project as well as monitoring and controlling of the risk factors affecting during the life cycle of the construction project.
The Table 5 shows the ranking of the risk factors according to the relative importance index and depends on the probability of occurrence and the effect of the factor to obtain a balanced result of the risks effect that can be relied upon; accordingly, the risk cannot be analyzed by the probability of occurrence only without putting the risk factors impact into account and vice versa
The overall RII analysis shows the (unstable of Government) is the most risk factors effects in oil and gas projects with RII=0.578, followed by (Wrong Project Cost Estimation) with RII=0.568, the third-factor cause risk in projects is (Wrong Project Time Schedule Estimation) which has RII=0.556, while the (Delay in Decision Making) is the fourth factor with RII=0.554. Thus, the ranking of factors is determined according to their relative importance to the success of the project. It is not possible to develop a single response plan for all the risk factors and give them the same attention, time, effort and cost but by the table below the risk management team can divide them into categories and arrange the appropriate strategies according to the priority and the rankings in influencing the success of the projects.
Figure 1 shows the risk factors according to their impact and probability of occurrence during the life cycle of the construction project and presents the overall relative importance of each factor. The degree of impact and probability of risk varies, and through this, the level of risk impact on the success of construction projects can be determined, and as a result, these risks can be classified.
Table 6 shows the relative importance index RII analysis for the critical effects of risk factors on the project success, the most effective of risk is time overruns with RII=0.783 and followed by failure to achieve the project objectives with RII= 0.737 , while the cost overruns come to the third effect with RII=0.690.
Table 7 illustrates the scale used to determine the impact of each factor and its probability of occurrence (Hossen, Kang, and Kim, 2015). The RII for responses to each factor is calculated to find out its impact level and its probability of occurrence, which used to develop risk factors map in construction projects, as shown in Figure 2.
The risk map is mainly based on the probability and impact matrix, but in this case, we use the results of the analysis resulting from the analysis of the relative importance index, which is considered more accurate because all the responses of the participants are taken into account during the analysis, unlike the probability and impact matrix, which focuses on the most selective responses among the participants. Figure 2 shows the distribution of risk factors on the risk map base on the probability and impact of these factors.
It is easy to observe how the risk map concludes that most risks are located in the red zone as high risk and should be taken into consideration and to develop appropriate strategies to avoid or transfer these risks to others such as insurance or other contractors. Other factors in the yellow zone are the least influential risk factors that can be mitigated or share with other stakeholders in the project.
According to (Smith et al. 2006), the risks in construction projects are assigned as follows: owner to the contractor and designer; the contractor to the subcontractor; insurer’s client, architect, contractor, and subcontractor; and insurer’s
TABLE 3. Cronbach’s alpha test of risk factors and effects
447
TABLE 4. Causes and effects of risks spearman correlation coefficient
TABLE 5. RII for the cause of risk factors in oil and gas construction projects
Risk Impact Risk Probability OverallNo Code Risk Factors RII Rank RII Rank RII Rank1 CL1 Delay in Decision Making 0.675 21 0.821 4 0.554 42 CL2 Unstable of Government 0.779 1 0.742 14 0.578 13 CL3 Government interference 0.576 51 0.734 16 0.422 394 CL4 Client Interventions 0.587 49 0.783 8 0.460 255 CL5 Change During Construction Process 0.657 29 0.716 20 0.470 186 CL6 Delay Payment of Contractor's Dues 0.629 40 0.631 38 0.397 467 CO1 Lack of Contractors Experience 0.726 6 0.630 39 0.458 278 CO2 Execution Errors 0.652 31 0.706 23 0.461 239 CO3 Inadequate coordination among contractors 0.651 32 0.686 28 0.447 3210 CN1 Insufficient Consultant's Experience 0.673 23 0.701 26 0.472 1711 CN2 Delays Review and Approval of Design 0.645 33 0.563 50 0.363 5112 CN3 Poor Contract Management 0.697 12 0.664 31 0.463 2213 FD1 Improper Project Feasibility Study 0.707 9 0.718 19 0.508 914 FD2 Lack of Data Accuracy and Survey Information 0.681 17 0.625 42 0.425 3815 FD3 Frequent Change of Designs 0.683 15 0.708 22 0.484 1416 FD4 Wrong Project Cost Estimation 0.717 7 0.793 6 0.568 217 FD5 Wrong Project Time Schedule Estimation 0.714 8 0.779 10 0.556 318 TC1 Inadequate Tendering 0.683 15 0.543 51 0.371 5019 TC2 Lack of Detailed Items 0.666 25 0.628 40 0.418 4020 TC3 The Terms of the Contract are Unclear 0.625 41 0.875 1 0.547 721 TC4 Corruption accompanying tenders 0.740 2 0.645 34 0.478 1522 RM1 Shortage and Low productivity of labours 0.678 18 0.757 12 0.513 823 RM2 Delay in Delivery of Materials to Site 0.731 5 0.621 43 0.454 2824 RM3 Fluctuations in the Material's Cost 0.675 21 0.634 36 0.428 37

448
25 RM4 Poor Quality of Construction Materials 0.687 14 0.668 30 0.458 2626 RM5 Shortage of Modern Equipment's 0.660 28 0.632 37 0.417 4227 MR1 Inappropriate Organizational Structure 0.670 24 0.673 29 0.451 3028 MR2 Ineffective Management 0.732 4 0.618 45 0.453 2929 MR3 Poor Planning and controlling for Scheduling, and Budgeting 0.736 3 0.634 35 0.467 2030 MR4 Lack of Effective Communication and Coordination 0.692 13 0.603 47 0.418 4131 MR5 lack of effective quality control management 0.703 10 0.621 43 0.437 3532 EC1 Economic and Financial Crisis 0.634 38 0.796 5 0.504 1033 EC2 Foreign Currency Fluctuation 0.616 45 0.747 13 0.460 2434 EC3 Higher Insurance and Transport prices to Yemen 0.618 44 0.728 17 0.450 3135 EC4 Lack of infrastructure projects 0.636 37 0.774 11 0.492 1236 PO1 Political Instability 0.656 30 0.836 3 0.549 537 PO2 Change Regulations and Low 0.678 18 0.609 46 0.413 4338 PO3 Country Conditions During Construction 0.630 39 0.737 15 0.464 2139 PO4 Illegal support and nepotism 0.599 48 0.718 18 0.431 3640 LP1 Responsibility Towards Society 0.587 50 0.703 25 0.413 4441 LP2 Recruitment of Local Peoples 0.701 11 0.697 27 0.489 1342 LP3 Different language and culture with the local community 0.641 35 0.583 48 0.374 4943 EN1 Environmental Protection Pressure of their Groups 0.676 20 0.659 32 0.446 3344 EN2 Health and Safety 0.662 26 0.710 21 0.470 1945 EN3 Waste Treatment 0.604 47 0.627 41 0.379 4746 SE1 Length of Oil Sector Border 0.625 41 0.706 24 0.441 3447 SE2 The Threat of Armed Groups 0.607 46 0.780 9 0.474 1648 SE3 Unsafe Transportation Routes 0.639 36 0.785 7 0.502 1149 FM1 Inclement Weather, Flood, Fire, Landslip 0.661 27 0.568 49 0.375 4850 FM2 Unforeseen Circumstances 0.620 43 0.653 33 0.405 4551 FM3 War in Country 0.645 33 0.850 2 0.548 6
FIGURE 1. Relative Importance Index Diagram
TABLE 6. RII for the effect of risk on project success
No Effect of Risk on Project Success Weight RII RANK
1 Time overruns 1230 0.783 12 Cost overruns 1083 0.690 33 Poor quality 1074 0.684 44 Failure to achieve project objectives 1157 0.737 25 Stop the project 1046 0.666 5

449
contractor and subcontractor. The above allocations are a consequence of standard practices in the construction sector which do not depend on rational risk analysis, while the owners usually pass the risk to the contractor due to lack of a risk allocation framework. El-Sayegh (2008) has confirmed that contractors were reacting to these threats by increasing their contingencies margin, which would inevitably raise the owner’s contract price. A risk management framework must, therefore, be implemented to assign risks among the parties involved in the project accurately.
(Berg 2010) explained that it is not advisable to place the threats to contractors. This leads entrepreneurs to refuse to offer future projects, thereby reducing the number of bidders. As a result of the large contingency amount included in the plan, the transfer of the risk to the contractor will increase the cost of the project. According to (Dey 2010) risk map helps very objectively analyze risk severity in both work package and activity levels.
Through Figure 2, the risk map we find that the Green Zone is devoid of any risk factor, which gives an indication that the factors under study have been carefully selected from the literature review and examined by pilot study as well as the experts judgment in the field of construction
projects for the oil and gas sector, so a framework has been developed comprising 51 of risk factors that affect the cost, time and quality of the construction project as well as those that are expected to lead to the project’s failure to achieve its objectives or completely stop the project.
CONCLUSION
This research considered one of the first to study the risks challenging construction projects in the oil and gas sector in Yemen as well as there is a lack of resources in this field at the level of developing countries, moreover the results of the study help to enhance the chances of success of projects by defining the causes of risk and its impact, which helps companies and governments involved in this matter are taking precautions and strategies to reduce the impact of risk, which enhances the economic growth of countries because the oil and gas industry is one of the most important sources of national income for these countries.
The field study was conducted in all the oil and gas sectors in Yemen and involved the project team on risk study from the project manager to the construction site
TABLE 7. Scale used to identify factor’s impact and a probability of occurrence
FIGURE 2. Risk factors Map

450
supervisors. The study included all risks during the project lifecycle from the beginning of the feasibility study to the project delivery phase and several tests for the selection of risk factors related to the impact on the success of the construction project in the oil and gas sector, which included several previous studies and a pilot study of the sample of 30 participants, and then the results have been presented to experts working in this field for more than 20 years, so we see the approaching factors risks of diagnosing a problem research and identify the causes of the risks that affect the success of construction projects in the oil and gas sector and therefore expect that this research is useful for companies operating the oil sectors as well as a directory of companies engaged in these projects and research helps governments to develop a strategy to respond to risks to mitigate their effects and avoid losses, this research will also be useful for researchers in this field due to the lack of sources in the subject of risks in construction projects for the oil and gas sector.
The overall RII analysis shows the (unstable of Government) under client risks is the most risk factors effects in oil and gas projects with RII=0.578, followed by (Wrong Project Cost Estimation) with RII=0.568, the third factor cause risk in projects is (Wrong Project Time Schedule Estimation) which has RII=0.556, while the (Delay in Decision Making) is the fourth factor with RII=0.554. Thus, the ranking of factors is determined according to their relative importance to the success of the project. It is not possible to develop a single response plan for all the risk factors and give them the same attention, time, effort and cost but by the table below the risk management team can divide them into categories and arrange the appropriate strategies according to the priority and the rankings in influencing the success of the projects.
The result of the reliability test of the questionnaire was very high which gives high reliability of the results; also the correlation coefficient between the causes of risk and its effects was high at level 0.01 which indicates that there is a need to study this relationship and perform a more in-depth analysis to explain this issue. The significant relationship between risk factors and their impact on the success of the construction project, as shown in the Spearman test earlier, makes it imperative for companies and project staff to take the risk issue more seriously and to continually improve risk response plans as well as monitoring and control over the life cycle of the project, and those responsible for preparing the studies, the cost and the schedule of the project should take into account the risk factors and their potential impacts. It is also useful to raise awareness among the project team and to train specialized staff in risk assessment and the development of response strategies.
To improve risk response plan, risk factors identify and ranking should be done first to recognize which response strategy should followed, the objectives of this research was satisfied by using relative importance index method which gives ranking of risk factors and effect depending on probability and impact of these factors, by using RII
analysis data we develop risk map can be used as guide to know which risk factor is more effect on project success than other factors.
The study contributes to three areas: academia, governments/authorities, and the Oil and Gas sector. This research contributes to the academic sector by setting out the practical advantages and disadvantages of each risk factors faced in the Oil and Gas sector. It also identifies the most commonly-used strategy (response) and has identified and grouped risk factors to enable focus on the most influential risk groups (stakeholders, communication, project management, economic, political and security). Moreover, study will help future academic researchers to look at other groups and analyze how these factors and groups influence other sectors. Clearer definitions of risk map, and of the current problems facing the oil and gas industry will help future researchers to move forward from this report, and find solutions to these problems.
Furthermore, this study will help governments and authorities to set up guidelines and policies to improve stakeholder collaboration and integration during the project life cycle. The authorities can also help oil companies by developing more infrastructure and road projects in the oil production areas and coordinating to facilitate the flow of materials to and from the company site without hindrance.
DECLARATION OF COMPETING INTEREST
None.
ACKNOWLEDGEMENT
Authors are grateful to Universiti Kebangsaan Malaysia and UKM Research Grants GGPM-2017-058 for supporting this research and providing research facilities, as well as wish to express they’re thanks to Oil and gas employees’ participants for their contribution in providing comprehensive and vital information.
REFERENCES
A. Kassem, M., Khoiry, M.A. & Hamzah, N. 2019. Usingprobability impact matrix (PIM) in analyzing risk factorsaffecting the success of oil and gas construction projects inYemen. International Journal of Energy Sector Management(ahead-of-print). https://www.emeraldinsight.com/doi/10.1108/IJESM-03-2019-0011.
Adeleke, A.Q., Bahaudin, A.Y. & Kamaruddeen, A.M. 2016. Moderating effect of regulations on organizational factors and construction risk management : A proposed framework. International Journal of Economics and Financial 6(2004): 92–97.
Ahmad, S.A., Issa, U.H., Farag, M.A. & Abdelhafez, L.M. 2013. Evaluation of risk factors affecting time and cost of construction projects in Yemen. International Journal of Management (Ijm) 4(5): 168–178.
451
Aibinu, A.A. & Jagboro, G.O. 2002. The effects of construction delays on project delivery in Nigerian construction industry. International Journal of Project Management 20(8): 593–599.
Al-Momani, A.H. 2000. Construction delay: A quantitative analysis. International Journal of Project Management 18: 51–59.
Al-Sabah, R., Menassa, C.C. & Hanna, A. 2014. Evaluating impact of construction risks in the Arabian Gulf Region from perspective of multinational architecture, engineering and construction firms. Construction Management and Economics 32(4): 382–402.
Alaghbari, W., Al-Sakkaf, A.A. & Sultan, B. 2017. Factors affecting construction labour productivity in Yemen. International Journal of Construction Management 3599(October): 1–13. http://dx.doi.org/10.1080/15623599.2017.1382091.
Ali, Z., Zhu, F. & Hussain, S. 2018. Identification and Assessment of Uncertainty Factors that Influence the Transaction Cost in Public Sector Construction Projects in Pakistan. Buildings 8(11): 157. http://www.mdpi.com/2075-5309/8/11/157.
Alia, A. & Mohamad, B. 2017. Green - Oriented Procurement for Building Projects : A Case of the Malaysian Construction Industry. Brisbane: Queensland University of Technology.
Alinaitwe, H., Apolot, R. & Tindiwensi, D. 2013. Investigation into the causes of delays and cost overruns in Uganda’s public sector construction projects. Journal of Construction in Developing Countries 18(2): 33–47.
Assaf, S. A. & Al-Hejii, S. 2006. Causes of delay in construction. Journal of Project Management 24(4): 349–357.
Assaf, Sadi A. & Al-Hejji, S. 2006. Causes of delay in large construction projects. International Journal of Project Management 24(4): 349–357.
Assaf, Sadi A & Al-hejji, S. 2006. PROJECT Causes of delay in large construction projects 24: 349–357.
Awodele, O.A. 2012. Framework for Managing Risk in Privately Financed Market Projects in Nigeria 385.
Aziz, Remon F. & Abdel-Hakam, A.A. 2016. Exploring delay causes of road construction projects in Egypt. Alexandria Engineering Journal.
Aziz, Remon Fayek. 2013. Ranking of delay factors in construction projects after Egyptian revolution. Alexandria Engineering Journal 52(3).
Badiru, A. & Osisanya, S. 2013. Project Management for the Oil and Gas Industry 20131057. http://www.crcnetbase.com/doi/book/10.1201/b13755.
Baloi, D. 2012. Risk Analysis Techniques in Construction Engineering Projects. Journal of Risk Analysis and Crisis Response 2(2): 115–123.
Banihashemi, S., Hosseini, M.R., Golizadeh, H. & Sankaran, S. 2017. Critical success factors (CSFs) for integration ofsustainability into construction project management practicesin developing countries. International Journal of ProjectManagement 35(6): 1103–1119. http://dx.doi.org/10.1016/j.ijproman.2017.01.014.
Bari, S. & Karim, A.B.D. 2015. The Development of an Empirical-Based Framework for Project Risk Management Approved Electronically Generated Cover-Page. The University of
Manchester 381. https://www.escholar.manchester.ac.uk/uk-ac-man-scw:246250.
Berg, H.-P. 2010. Risk management: procedures, methods and experiences. Reliability: Theory & Applications 5(2 (17)). https://cyberleninka.ru/article/n/risk-management-procedures-methods-and-experiences. Accessed on: 14 March 2019.
Bordat, C., McCullouch, B.G., Labi, S. & Sinha, K. 2004. An analysis of cost overruns and time delays of INDOT projects. Transportation Research (December): 193. http://docs.lib.purdue.edu/jtrp/11.
Bu-Qammaz, A.S.A.S. 2015. Risk Management Model for International Public Construction Joint Venture Projects in Kuwait http://rave.ohiolink.edu/etdc/view?acc_num=osu1426073042. Accessed on: 7 October 2019.
Choudhry, R. & Iqbal, K. 2013. Identification of risk management system in construction industry in Pakistan. Journal of Management in Engineering 29(1): 42–49. http://ascelibrary.org/doi/pdf/10.1061/(ASCE)ME.1943-5479.0000122.
Chuan, C.L. 2006. Sample Size Estimation Using Krejcie and Morgan and Cohen Statistical Power Analysis: a Comparison. Research Journal IPBL 7: 78–86.
Cochran, W.G. 1977. Sampling Techniques. 3rd edition.New York: Wiley. http://agris.fao.org/agris-search/search.do?recordID=XF2015028634 Accessed on: 20 February 2019.
Commission, E. 2015. Evaluation of EU Cooperation with Yemen 2002. European Commission 1(March).
Dakhel, A. 2013. The contribution of the construction industry to economic development in Libya. A thesis submitted in fulfilment of the requirements of Liverpool John Moores University for the degree of Doctor of Philosophy October 2013 ABSTRACT (October). http://researchonline.ljmu.ac.uk/4454/1/157472_2013Amelphd.pdf -2.pdf.
Dey, P.K. 2010. Managing project risk using combined analytic hierarchy process and risk map. Applied Soft Computing Journal 10(4): 990–1000.
Dhimmar, V.N. & Scholar, M.E. 2016. Evaluation of factors influencing change management for construction 1(5): 361–364.
Doloi, H. 2012. Understanding impacts of time and cost related construction risks on operational performance of PPP projects. International Journal of Strategic Property Management.
Dumbravă, V. 2013. Using probability – Impact matrix in analysis and risk assessment projects. Journal of Knowledge Management, Economics and Information Technology 42(December): 76–96. http://www.scientificpapers.org/wp-content /f i les/07_Dumbrava_Iacob-USING_PROBABILITY__IMPACT_MATRIX_IN__ANALYSIS_AND_RISK_ASSESSMENT_PROJECTS.pdf.
Dziadosz, A. & Rejment, M. 2015. Risk analysis in construction project - Chosen methods. Procedia Engineering 122(December): 258–265. http://dx.doi.org/10.1016/j.proeng.2015.10.034.
Dziadosz, A., Tomczyk, A. & Kapliński, O. 2015. Financial risk estimation in construction contracts. In Procedia Engineering. Vol. 122.
Edward G. Carmines, R.A.Z. 1991. Reliability and Validity Assessment - Edward G. Carmines, Richard A. Zeller - Google
452
Books https://books.google.com.my/books?hl=en&lr=&id= o5x1AwAAQBAJ&oi=fnd&pg=PA5&dq=Carmines,+E.+G.+%26+Zeller,+R.A.+(1991).+Reliability+and+validity+assessment&ots=2K6FjqFJC1&sig=AsLmeZvvfmtg-820YAv-46MVHb3Q&redir_esc=y#v=onepage&q&f=false [11 March 2019].
Eik-Andresen, P., Landmark, A.D. & Johansen, A. 2015. Managing cost and time in a large portfolio of projects. Procedia Economics and Finance 21(2212): 502–509. h t tp : / /www.sc ienced i rec t . com/sc ience /a r t i c le /p i i /S2212567115002051.
El-Sayegh, S.M. 2008. Risk assessment and allocation in the UAE construction industry. International Journal of Project Management 26(4): 431–438.
El-Shehaby, M., Nosair, I. & Sanad, A.E.-M. 2014. Risk assessment and analysis for the construction of off shore oil & gas projects. Int’l J.Scientific Res. Ed. 2(02): 317.
Enshassi, A. & Abu Mosa, J. 2008. Risk management in building projects: Owners’ perspective. The Islamic University Journal 16(1): 95–123.
Famiyeh, S., Amoatey, C.T., Adaku, E. & Agbenohevi, C.S. 2017. Major causes of construction time and cost overruns: A case of selected educational sector projects in Ghana. Journal of Engineering, Design and Technology 15(2): 181–198.
Gebrehiwet, T. & Luo, H. 2017. Analysis of delay impact on construction project based on RII and correlation coefficient: Empirical study. Procedia Engineering 196(June): 366–374. http://dx.doi.org/10.1016/j.proeng.2017.07.212.
George, D. & Mallery, P. 2016. IBM SPSS Statistics 23 Step by Step.
Ghoddousi, P.; & Poorafshar, O. 2015. Labour productivity in Iranian construction projects: Perceptions of chief executive officers. Journal of Management Development 34(8): 1019–1030.
Hamzah, N., Khoiry, M. a, Arshad, I., Badaruzzaman, W.H.W. & Tawil, N.M. 2012. Identification of the causes of construction delay in Malaysia. World Academy of Science, Engineering and Technology 6(12): 1063–1068.
Harris, A., F.C., S., Authors, F., Fugar, F.D.K., Agyakwah-baah, A.B., Faridi, A.S., El-Sayegh, S.M., Fallahnejad, M.H., Luu,V.T., Kim, S., Tuan, N. Van, Ogunlana, S.O., Sweis, G.,Sweis, R., Abu Hammad, A. & Shboul, A. 2006. Causes ofdelays in the construction industry in Lebanon. InternationalJournal of Project Management 26(1): 665–674. http://dx.doi.org/10.1016/j.ijproman.2008.03.003.
Haupt, A.M.J.T.C., Jarkas, A.M., Haupt, T.C. & Haupt, A.M.J.T.C. 2015. Major construction risk factors considered by general contractors in Qatar. European Journal of Marketing 24(5): 41–49.
Hossen, M.M., Kang, S. & Kim, J. 2015. Construction schedule delay risk assessment by using combined AHP-RII methodology for an international NPP project. Nuclear Engineering and Technology 47(3): 362–379. http://dx.doi.org/10.1016/j.net.2014.12.019.
Hwang, B.-G. & Ng, W.J. 2013. Project management knowledge and skills for green construction: Overcoming challenges.
International Journal of Project Management 31(2): 272–284. http://www.sciencedirect.com/science/article/pii/S0263786312000658.
Issa, U.H., Farag, M.A., Abdelhafez, L.M. & Ahmed, S., A. 2015. A Risk Allocation Model for Construction Projects in Yemen. Civil and Environmental Research 7(3): 78–89.
Joukar, A. 2016. Analysis and Management of the Price Volatility in the Construction Industry (May).
Karimi, H. 2017. Quantitative Analysis of the Impact of Craft Labor Availability on Construction Project Performance.
Karunakaran, P., Abdullah, A.H., Nagapan, S., Sohu, S. & Kasvar, K.K. 2018. Categorization of potential project cost overrun factors in construction industry. IOP Conference Series: Earth and Environmental Science 140(1).
Kassem, M.A., Khoiry, A. & Hamzah, N. 2019. Evaluation of Risk Factors Affecting on Oil and Gas Construction Projects in Yemen. Report No. . International Journal of Engineering & Technology. www.sciencepubco.com/index.php/IJET.
Khair, K., Farouk, H., Mohamed, Z. & Mohammad, R. 2016. Causes and Effects of Delay Factors in Road Construction Projects in Sudan. International Journal of Applied Engineering Research ISSN 11(18): 973–4562. http://www.ripublication.com.
Kirat, M. 2015. Corporate social responsibility in the oil and gas industry in Qatar perceptions and practices. Public Relations Review 41(4): 438–446. http://dx.doi.org/10.1016/j.pubrev.2015.07.001.
Mahamid, I. 2011. Risk matrix for factors affecting time delay in road construction projects: Owners’ perspective. Engineering, Construction and Architectural Management 18(6): 609–617.
Mahamid, I. 2013. Principal Factors Impacting Labor Productivity of Public Construction Projects in Palestine: Contractors’ Perspective. International Journal of Architecture, Engineering and Construction 2(3): 194–202. http://www.iasdm.org/journals/index.php/ijaec/article/view/148.
Mahamid, I., Al-Ghonamy, A. & Aichouni, M. 2015. Risk matrix for delay causes in construction projects in Saudi Arabia. Research Journal of Applied Sciences, Engineering and Technology 9(8): 665–670.
Mukhtar A. Kassem, Muhamad Azry Khoiry*, N.H. 2018. Evaluation of Risk Factors Affecting Time and Cost of Construction Projects in Yemen. International Journal of Engineering & Technology 8(5): 168–178.
Mukhtar A. Kassem, Muhamad Azry Khoiry, N.H., A. Kassem, M., Khoiry, M.A. & Hamzah, N. 2019. Risk factors in oil and gas construction projects in developing countries: A case study. International Journal of Energy Sector Management https://www.emeraldinsight.com/doi/10.1108/IJESM-11-2018-0002 [17 March 2019].
Myakenkaya, G., Chubisov, I. & Chubissova, A. 2014. Similarities and differences of the war and projects. Winning strategies. Procedia - Social and Behavioral Sciences 119: 314–320. http://linkinghub.elsevier.com/retrieve/pii/S1877042814021272.
Petrovic, D. 2017. Risk Management in Construction Projects - A Knowledge Management Perspective from Swedish Contractors. Real Estate and Construction Management 63. http://kth.diva-portal.org/smash/record.jsf?pid=diva2%3A1150372&dswid=-2684.

453
Rahman, I.A., Memon, A.H. & Karim, A.T.A. 2013. Significant factors causing cost overruns in large construction projects in Malaysia. Journal of Applied Sciences 13(2): 286–293.
Raykar, P. & Ghadge, A.N. 2016. Analyzing the critical factors influencing the time overrun and cost overrun in construction project 6890(5): 21–25.
Renuka, S.M.M., Umarani, C. & Kamal, S. 2014. A review on critical risk factors in the life cycle of construction projects. Journal of Civil Engineering Research 4(2A): 31–36. http://article.sapub.org/10.5923.c.jce.201401.07.html.
Rose, K.H. 2013. A Guide to the Project Management Body of Knowledge (PMBOK® Guide)-Fifth Edition. Project Management Journal 44(3): e1–e1. http://doi.wiley.com/10.1002/pmj.21345 [11 September 2018].
Salazar-Aramayo, J.L., Rodrigues-da-Silveira, R., Rodrigues-de-Almeida, M. & De Castro-Dantas, T.N. 2013. A conceptual model for project management of exploration and production in the oil and gas industry: The case of a Brazilian company. International Journal of Project Management 31(4): 589–601. http://dx.doi.org/10.1016/j.ijproman.2012.09.016.
Samarghandi, H., Tabatabaei, S.M.M., Taabayan, P., Hashemi, A.M. & Willoughby, K. 2016. Studying the reasons for delayand cost overrun in construction projects: The case of Iran.Journal of Construction in Developing Countries 21(1): 51–84.
Shen, L., Tam, V.W.Y., Tam, L. & Ji, Y. 2010. Project feasibility study: the key to successful implementation of sustainable and socially responsible construction management practice. Journal of Cleaner Production 18(3): 254–259. http://dx.doi.org/10.1016/j.jclepro.2009.10.014.
Sidawi, B. 2012. Management problems of remote construction projects and potential IT solutions: The case of Kingdom of Saudi Arabia. Electronic Journal of Information Technology in Construction 17(2007): 103–120.
Smith, N., Merna, T. & Jobling, P. 2006. Managing risk in construction projects.
Sohrabinejad, A. & Rahimi, M. 2015. Risk Determination, Prioritization, and Classifying in Construction Project Case Study: Gharb Tehran Commercial-Administrative Complex. Journal of Construction Engineering 2015: 1–10. http://www.hindawi.com/journals/jcen/2015/203468/.
Sultan, B., Security, N. & Security, N. 2017. Priorities for Sustainable Construction Industry Development in Yemen 12(6): 886–893.
Sweis, R., Moarefi, A., Amiri, M.H., Moarefi, S. & Saleh, R. 2018. Causes of delay in Iranian oil and gas projects: a root cause analysis. International Journal of Energy Sector Management IJESM-04-2018-0014. https://www.emeraldinsight.com/doi/10.1108/IJESM-04-2018-0014 [3 November 2018].
Tawil, N. M., Khoiry, M.A., Arshad, I., Hamzah, N., Jasri, M.F. & Badaruzzaman, W.H.W. 2013. Factors contribute to delay project construction in higher learning education case study UKM. Research Journal of Applied Sciences, Engineering and Technology 5(11): 3112–3116.
Tawil, Norngainy Mohd, Khoiry, M.A., Hamzah, N., Arshad, I. & Wan Badaruzzaman, W.H. 2014. A Pilot Survey on Causes of Delay in Malaysian Construction Project. MATEC Web of Conferences 15: 01010. http://www.matec-conferences.org/10.1051/matecconf/20141501010.
Thuyet, N. V., Ogunlana, S.O. & Dey, P.K. 2007. Risk management in oil and gas construction projects in Vietnam. International Journal of Energy Sector Management 1(2): 175–194. http://www.emeraldinsight.com/journals.htm?articleid=1611329&show=abstract.
Van Weele, A. 2013. International Contracting : Contract Management in Complex Construction Projects. International Contracting.
Yildiz, A.E., Dikmen, I., Birgonul, M.T., Ercoskun, K. & Alten, S. 2014. A knowledge-based risk mapping tool for costestimation of international construction projects. Automationin Construction 43: 144–155. http://dx.doi.org/10.1016/j.autcon.2014.03.010.