
Using Metrics & SCE Systems to Drive Performance …cdn.promatshow.com › seminars › assets-2013...
45
Using Metrics & SCE Systems to Drive Performance Improvement Sponsored by: Presented by: John M. Hill The St. Onge Company 2013 MHI™ Copyright claimed as to audiovisual works of seminar sessions and sound recordings of seminar sessions. All rights reserved.
Transcript of Using Metrics & SCE Systems to Drive Performance …cdn.promatshow.com › seminars › assets-2013...
Using Metrics & SCE Systems to Drive Performance Improvement
Presented by:
John M. Hill The St. Onge Company
Sponsored by: Presented by:
John M. HillThe St. Onge Company
2013 MHI™ Copyright claimed as to audiovisual works of seminar sessions and sound recordings of seminar sessions. All rights reserved.
2013 MHI™ Copyright claimed as to audiovisual works of seminar sessions and sound recordings of seminar sessions. All rights reserved.
2013 MHI™ Copyright claimed as to audiovisual works of seminar sessions and sound recordings of seminar sessions. All rights reserved.
2
Supply Chain Execution Systems & Technologies Group Members
Cubiscan/Quantronix, Inc.
DC Velocity Magazine
Fox IV Technologies, Inc.
HighJump Software
Intelligrated, Inc.
Kardex Remstar, LLC
RedPrairie
Rockwell Automation Controls Systems
Sapient Automation
Softeon
St. Onge Company
TECSYSInc.
TranSystems

TAMING THE SUPPLY CHAIN
JUNGLE

4
WHERE DO WE START?
5
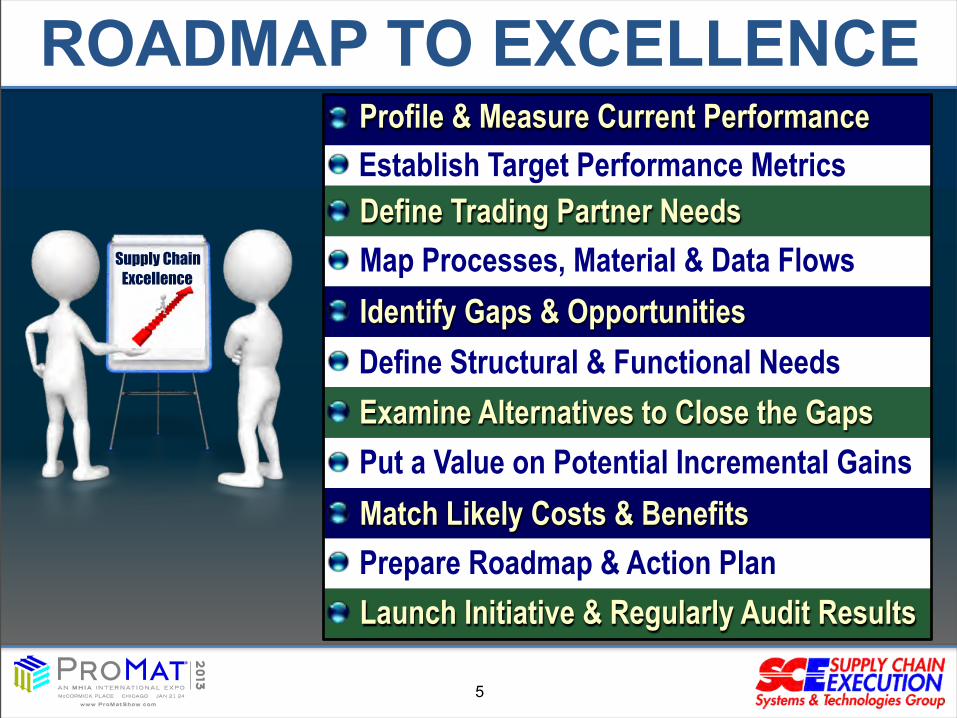
ROADMAP TO EXCELLENCE
ExcellenceSupply Chain
Establish Target Performance MetricsProfile & Measure Current Performance
Map Processes, Material & Data Flows Define Trading Partner Needs
Identify Gaps & Opportunities
Launch Initiative & Regularly Audit ResultsPrepare Roadmap & Action PlanMatch Likely Costs & BenefitsPut a Value on Potential Incremental Gains
Define Structural & Functional NeedsExamine Alternatives to Close the Gaps
HORSES FOR COURSESIt is critical that you take the time to describe the track & define performance requirements before picking the horses to run your SC race.
6
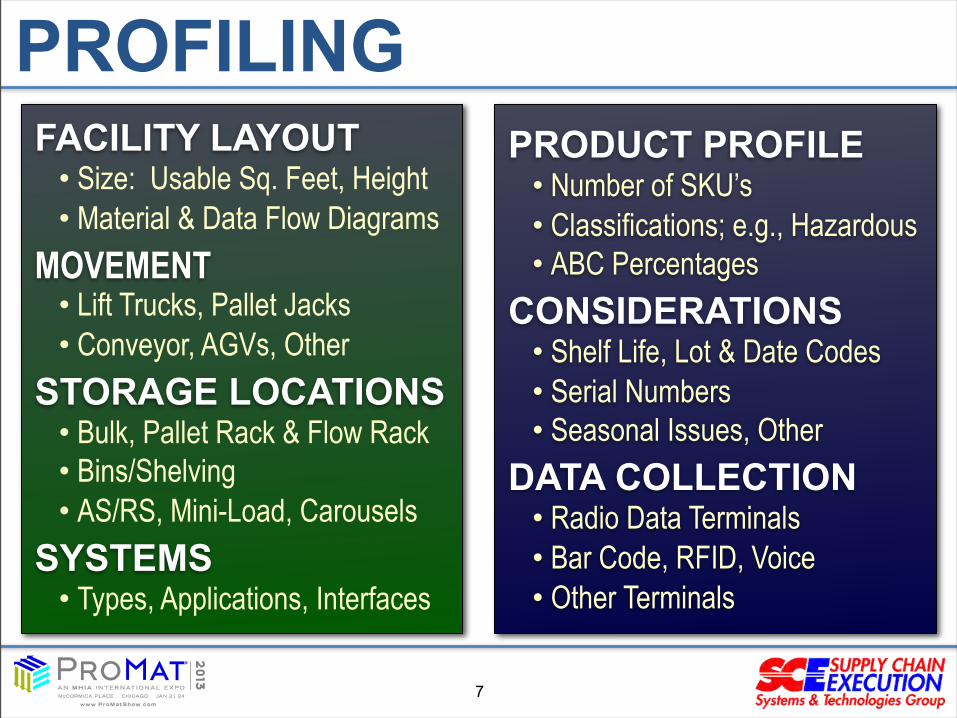
PROFILINGFACILITY LAYOUT
• Size: Usable Sq. Feet, Height• Material & Data Flow Diagrams
MOVEMENT• Lift Trucks, Pallet Jacks• Conveyor, AGVs, Other
STORAGE LOCATIONS• Bulk, Pallet Rack & Flow Rack• Bins/Shelving• AS/RS, Mini-Load, Carousels
SYSTEMS• Types, Applications, Interfaces
PRODUCT PROFILE• Number of SKU’s• Classifications; e.g., Hazardous• ABC Percentages
CONSIDERATIONS• Shelf Life, Lot & Date Codes • Serial Numbers• Seasonal Issues, Other
DATA COLLECTION• Radio Data Terminals• Bar Code, RFID, Voice• Other Terminals
7
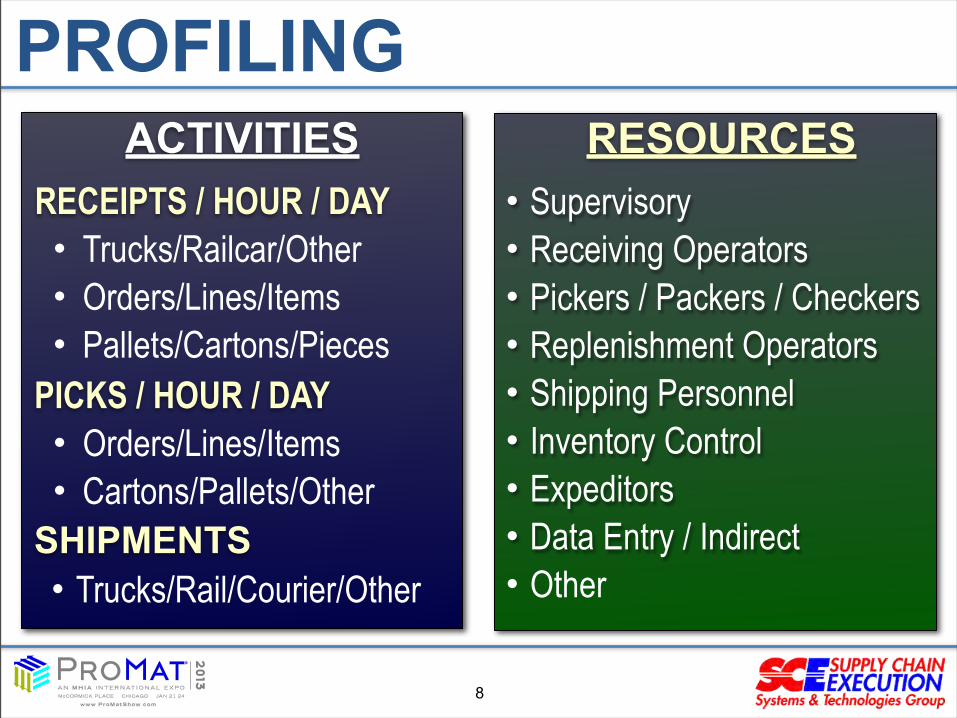
ACTIVITIESRECEIPTS / HOUR / DAY• Trucks/Railcar/Other• Orders/Lines/Items• Pallets/Cartons/Pieces
PICKS / HOUR / DAY• Orders/Lines/Items• Cartons/Pallets/Other
SHIPMENTS• Trucks/Rail/Courier/Other
RESOURCES• Supervisory• Receiving Operators• Pickers / Packers / Checkers• Replenishment Operators• Shipping Personnel• Inventory Control• Expeditors• Data Entry / Indirect• Other
PROFILING
8
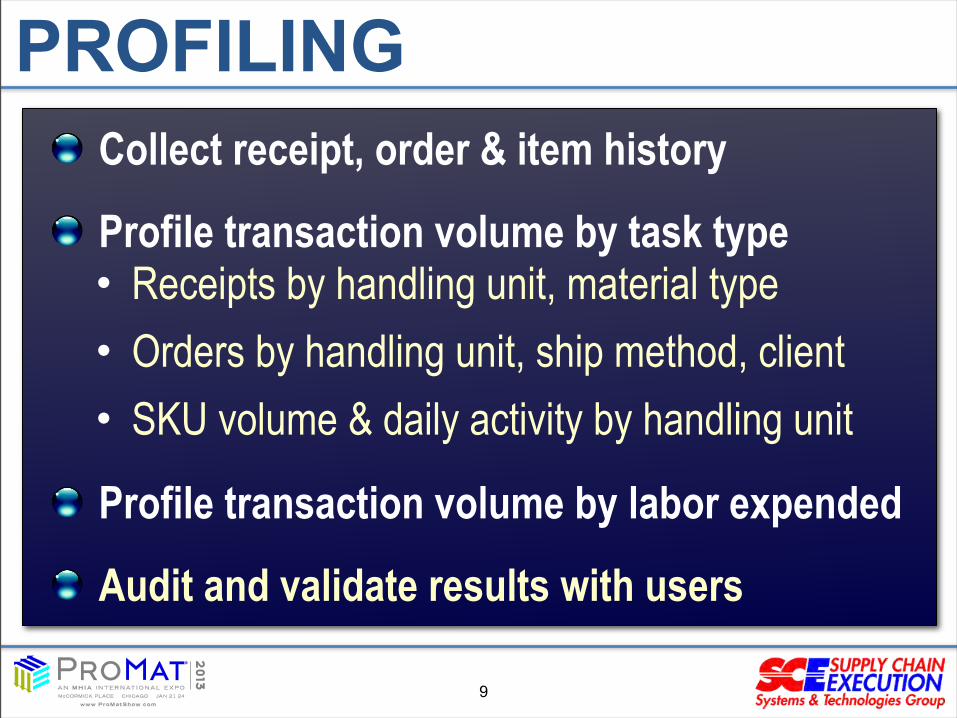
Collect receipt, order & item history
Profile transaction volume by task type• Receipts by handling unit, material type• Orders by handling unit, ship method, client• SKU volume & daily activity by handling unit
Profile transaction volume by labor expended
Audit and validate results with users
PROFILING
9
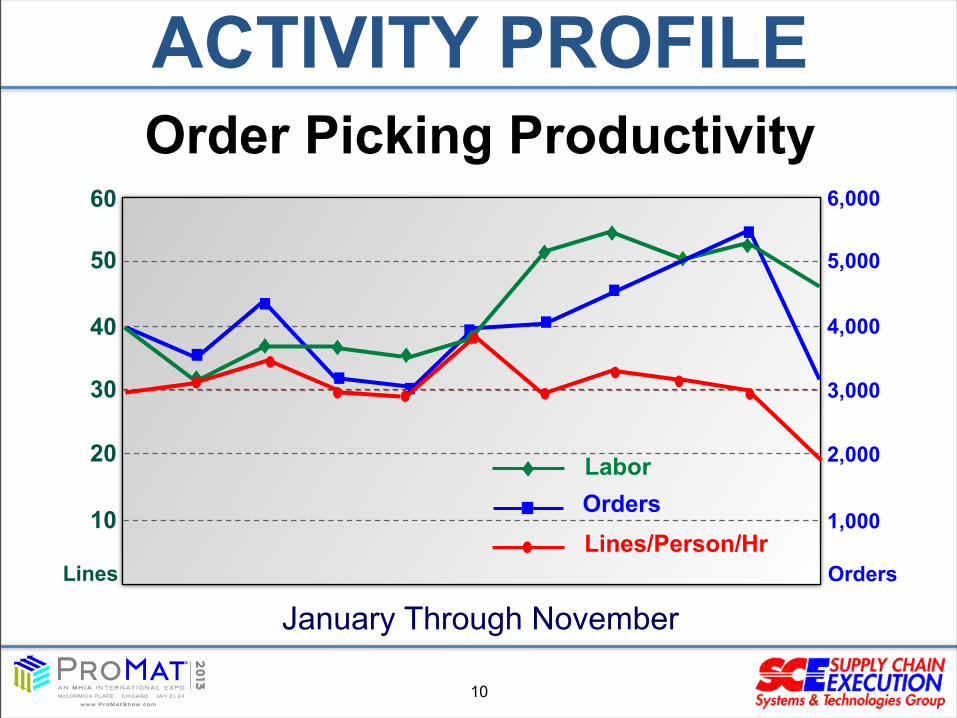
Order Picking Productivity
January Through November
10
20
30
40
50
60
1,000
2,000
3,000
4,000
5,000
6,000
LaborOrders
Lines/Person/HrOrdersLines
ACTIVITY PROFILE
10
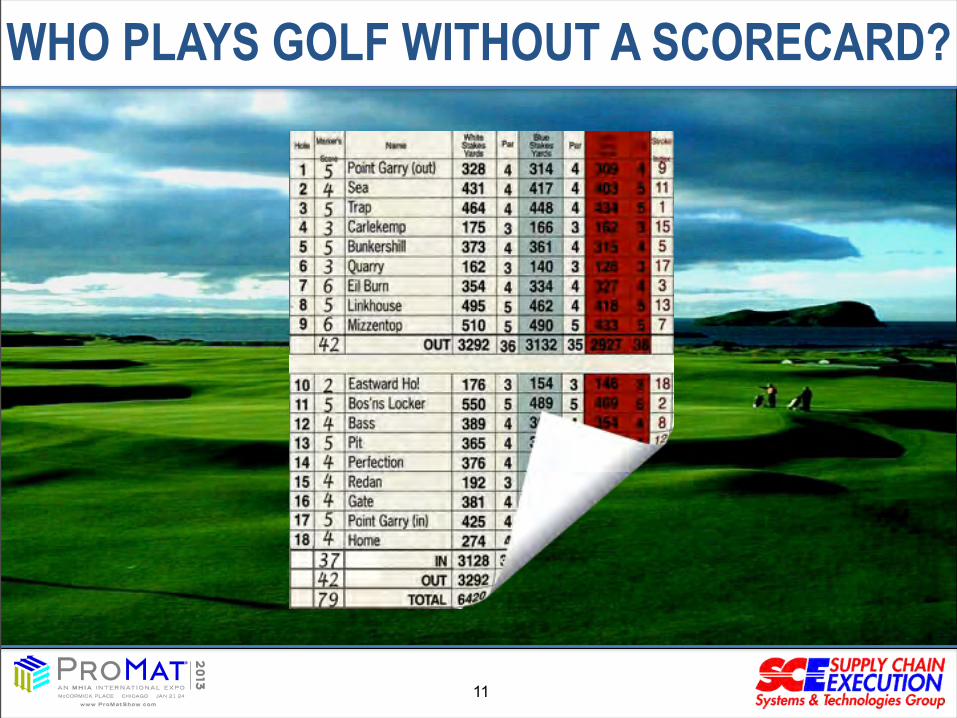
WHO PLAYS GOLF WITHOUT A SCORECARD?
11
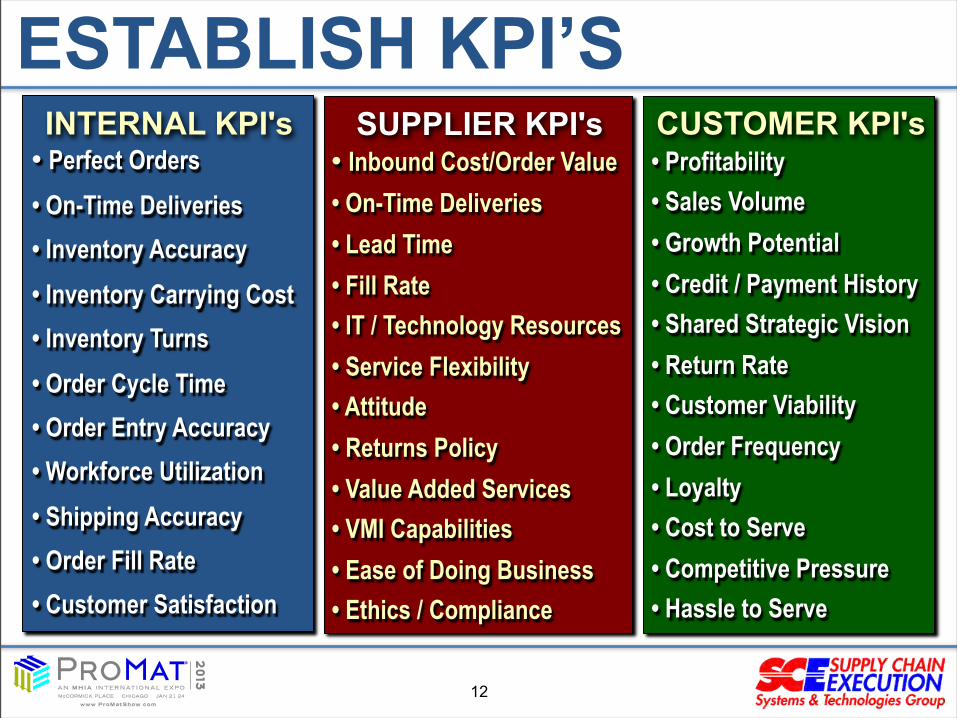
ESTABLISH KPI’S• Perfect Orders• On-Time Deliveries• Inventory Accuracy• Inventory Carrying Cost• Inventory Turns• Order Cycle Time• Order Entry Accuracy• Workforce Utilization• Shipping Accuracy• Order Fill Rate• Customer Satisfaction
INTERNAL KPI's CUSTOMER KPI's • Profitability• Sales Volume• Growth Potential• Credit / Payment History• Shared Strategic Vision• Return Rate• Customer Viability• Order Frequency• Loyalty• Cost to Serve• Competitive Pressure• Hassle to Serve
• Inbound Cost/Order Value• On-Time Deliveries• Lead Time• Fill Rate• IT / Technology Resources• Service Flexibility• Attitude• Returns Policy• Value Added Services• VMI Capabilities• Ease of Doing Business• Ethics / Compliance
SUPPLIER KPI's
12
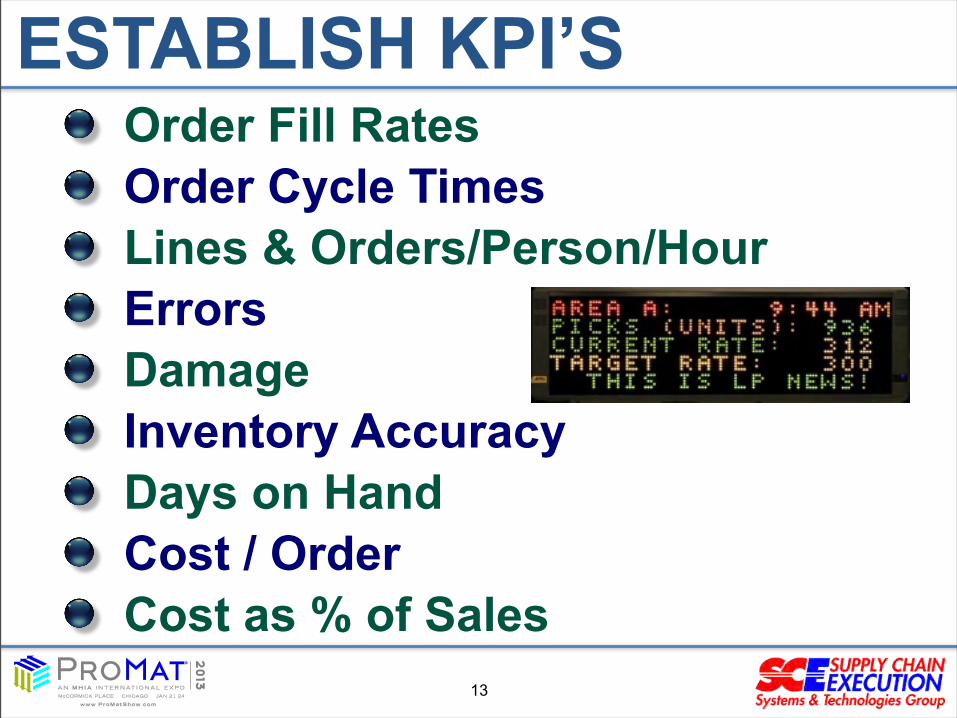
Order Fill RatesOrder Cycle TimesLines & Orders/Person/HourErrorsDamageInventory AccuracyDays on HandCost / OrderCost as % of Sales
ESTABLISH KPI’S
13
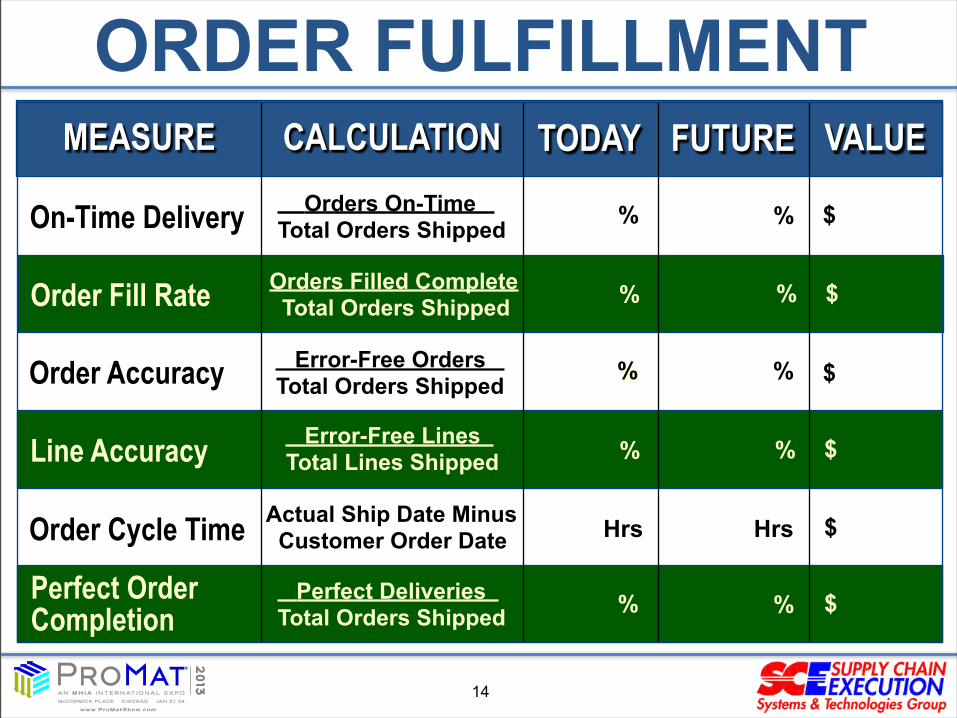
ORDER FULFILLMENT
14
On-Time Delivery Orders On-Time Total Orders Shipped % % $
Error-Free Orders Total Orders ShippedOrder Accuracy % % $
Actual Ship Date Minus Customer Order DateOrder Cycle Time Hrs Hrs $
MEASURE CALCULATION TODAY FUTURE VALUE
Orders Filled Complete Total Orders ShippedOrder Fill Rate % % $
Perfect Deliveries Total Orders Shipped
Perfect Order Completion % % $
Error-Free Lines Total Lines ShippedLine Accuracy % % $
%
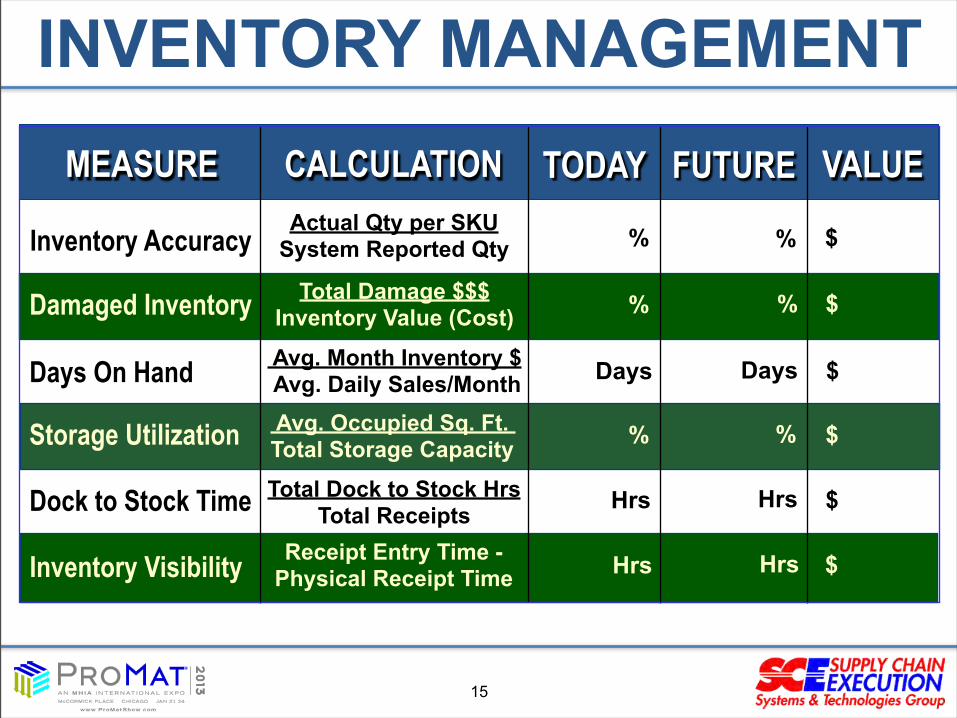
INVENTORY MANAGEMENT
Inventory Accuracy Actual Qty per SKUSystem Reported Qty % % $
Total Damage $$$Inventory Value (Cost)Damaged Inventory % % $
Avg. Occupied Sq. Ft. Total Storage CapacityStorage Utilization % % $
Total Dock to Stock HrsTotal ReceiptsDock to Stock Time Hrs Hrs $
Receipt Entry Time -Physical Receipt TimeInventory Visibility Hrs Hrs $
Avg. Month Inventory $ Avg. Daily Sales/MonthDays On Hand Days Days $
MEASURE CALCULATION TODAY FUTURE VALUE
15
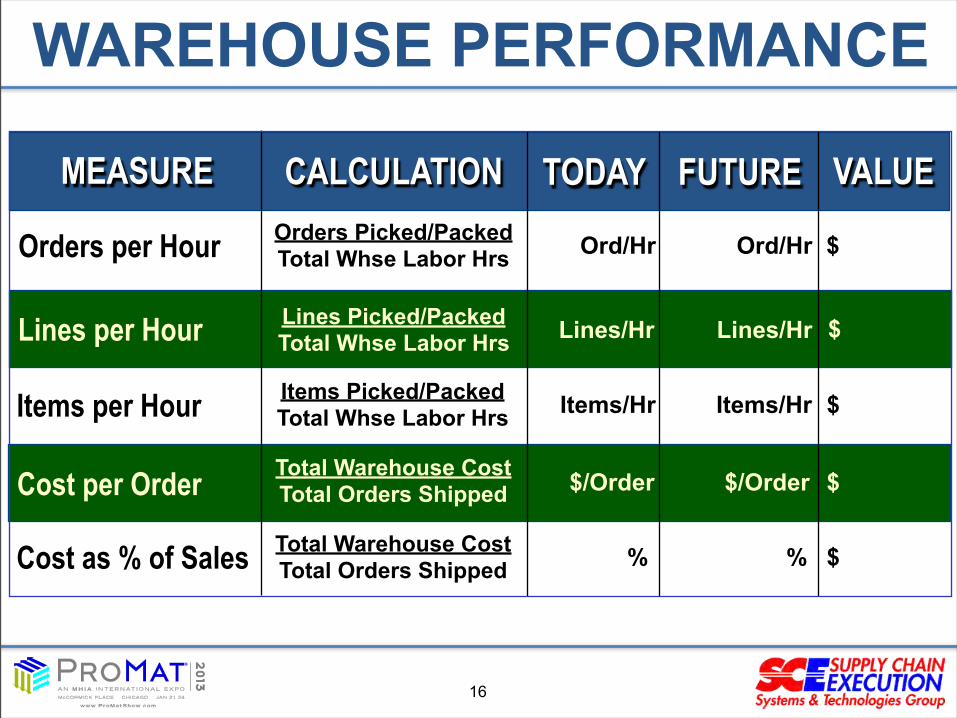
WAREHOUSE PERFORMANCE
Orders per Hour Orders Picked/PackedTotal Whse Labor Hrs
Total Warehouse CostTotal Orders Shipped
Lines per Hour
Items per Hour
Cost per Order
Cost as % of Sales
Ord/Hr
$/Order
% %
$
$
$
$
$
Ord/Hr
Lines/Hr
Items/HrItems/Hr
Lines/HrLines Picked/PackedTotal Whse Labor Hrs
Items Picked/PackedTotal Whse Labor Hrs
Total Warehouse CostTotal Orders Shipped
$/Order
MEASURE CALCULATION TODAY FUTURE VALUE
16
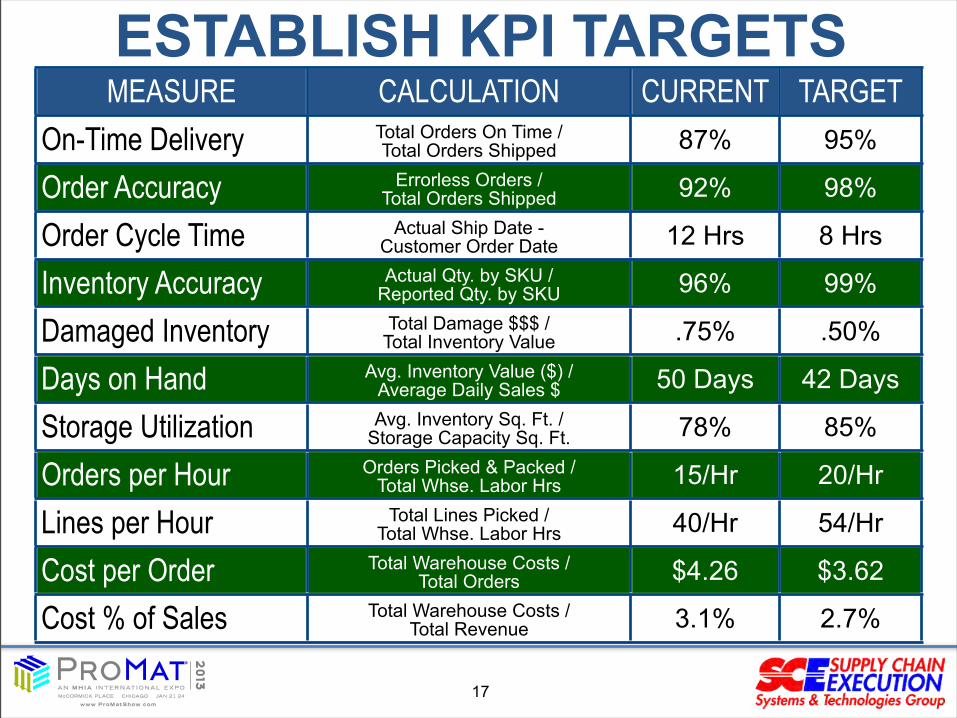
MEASURE CALCULATION CURRENT TARGETOn-Time Delivery Total Orders On Time /
Total Orders Shipped 87% 95%
Order Accuracy Errorless Orders /Total Orders Shipped 92% 98%
Order Cycle Time Actual Ship Date -Customer Order Date 12 Hrs 8 Hrs
Inventory Accuracy Actual Qty. by SKU /Reported Qty. by SKU 96% 99%
Damaged Inventory Total Damage $$$ / Total Inventory Value .75% .50%
Days on Hand Avg. Inventory Value ($) /Average Daily Sales $ 50 Days 42 Days
Storage Utilization Avg. Inventory Sq. Ft. /Storage Capacity Sq. Ft. 78% 85%
Orders per Hour Orders Picked & Packed /Total Whse. Labor Hrs 15/Hr 20/Hr
Lines per Hour Total Lines Picked /Total Whse. Labor Hrs 40/Hr 54/Hr
Cost per Order Total Warehouse Costs / Total Orders $4.26 $3.62
Cost % of Sales Total Warehouse Costs / Total Revenue 3.1% 2.7%
ESTABLISH KPI TARGETS
17
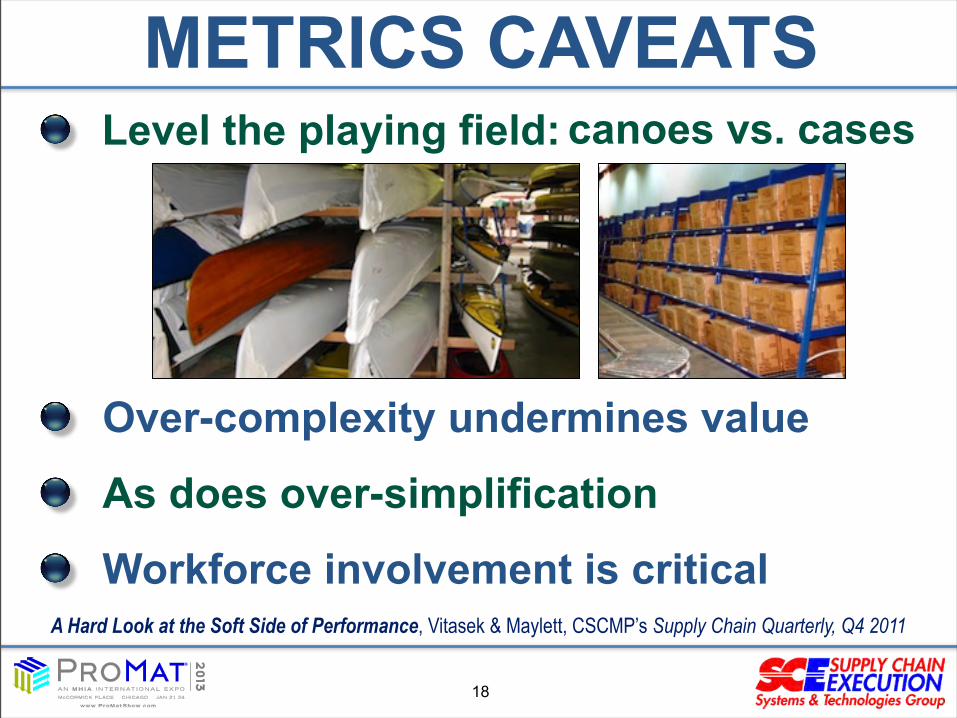
Level the playing field:
METRICS CAVEATScanoes vs. cases
A Hard Look at the Soft Side of Performance, Vitasek & Maylett, CSCMP’s Supply Chain Quarterly, Q4 2011
18
Over-complexity undermines value
As does over-simplification
Workforce involvement is critical
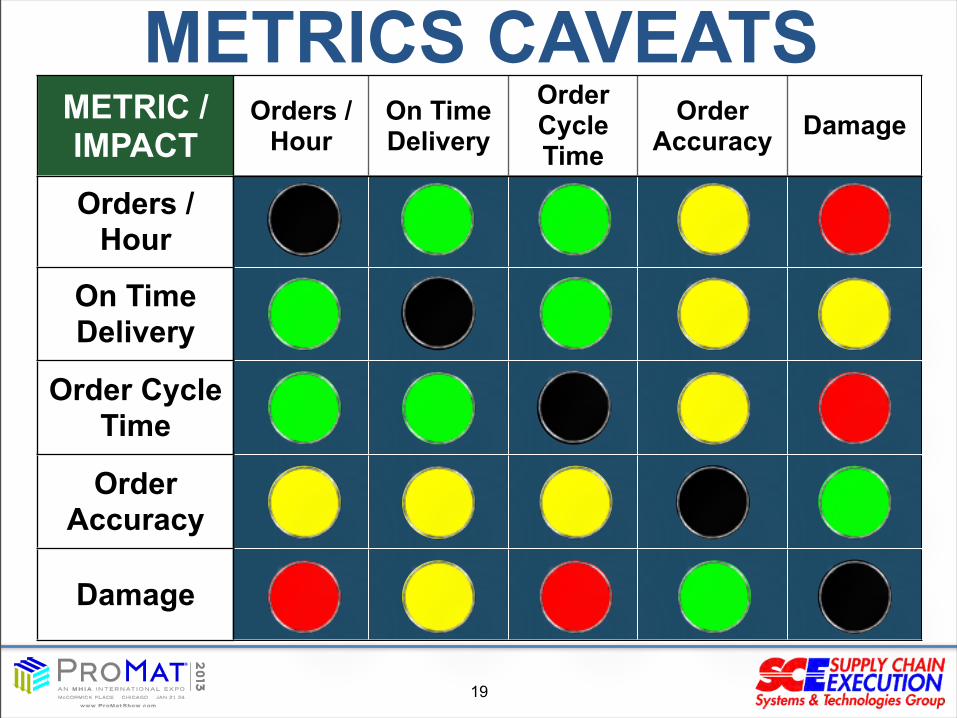
METRIC / IMPACT
Orders /Hour
On Time Delivery
Order Cycle Time
Order Accuracy Damage
Orders / Hour
On Time Delivery
Order Cycle Time
Order Accuracy
Damage
METRICS CAVEATS
19

20
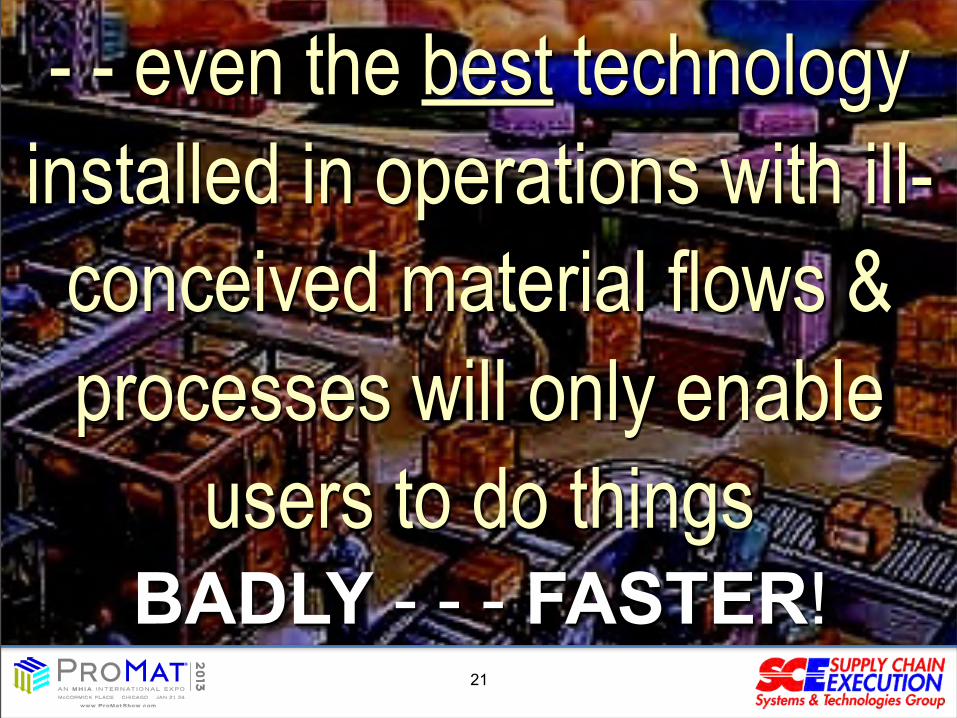
IT’S TOUGH PLAYING GOLF WITH A BASEBALL BAT! AND, - -
21
- - even the best technology installed in operations with ill-
conceived material flows & processes will only enable
users to do thingsBADLY - - - FASTER!
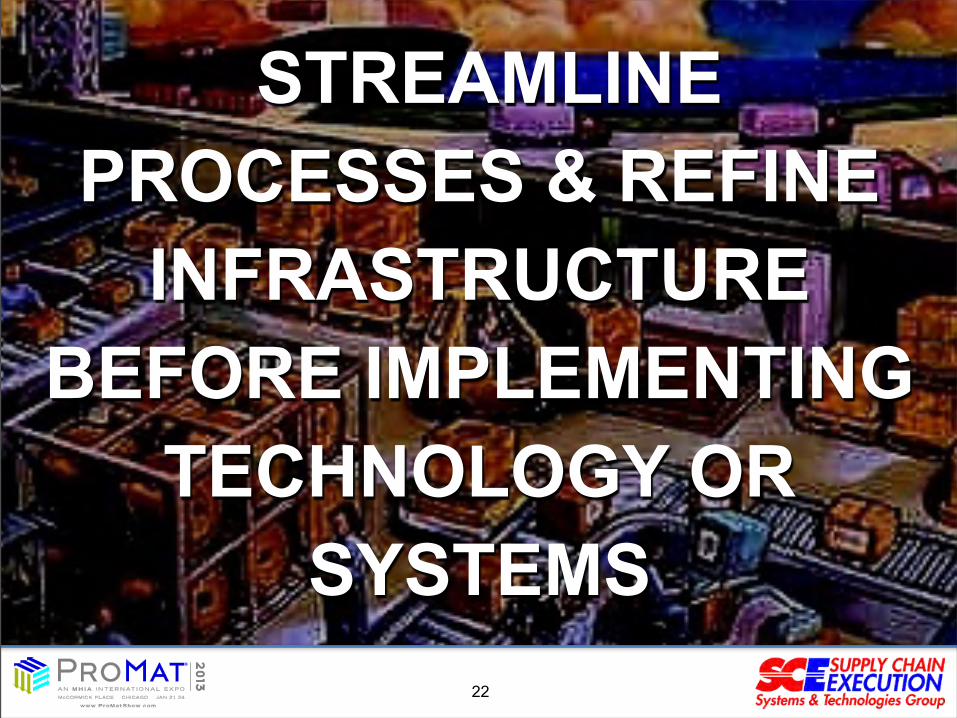
STREAMLINE PROCESSES & REFINE
INFRASTRUCTURE BEFORE IMPLEMENTING
TECHNOLOGY OR SYSTEMS
22

WHAT WOULD MOM SAY
ABOUT YOUR WAREHOUSE?
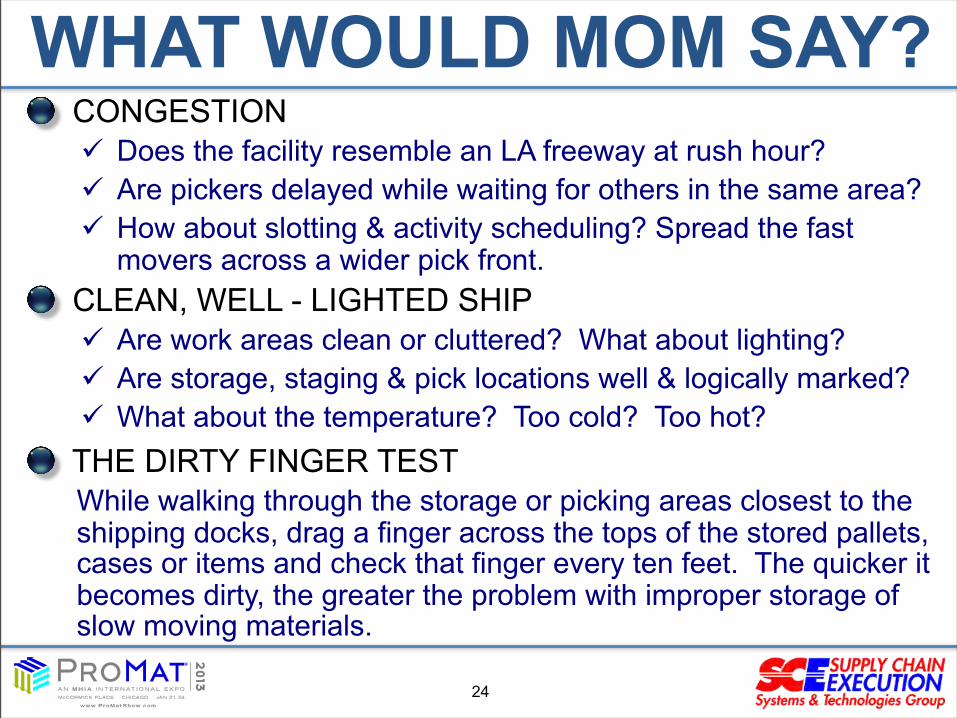
CONGESTIONü Does the facility resemble an LA freeway at rush hour? ü Are pickers delayed while waiting for others in the same area? ü How about slotting & activity scheduling? Spread the fast
movers across a wider pick front. CLEAN, WELL - LIGHTED SHIPü Are work areas clean or cluttered? What about lighting?ü Are storage, staging & pick locations well & logically marked? ü What about the temperature? Too cold? Too hot?
THE DIRTY FINGER TEST While walking through the storage or picking areas closest to the shipping docks, drag a finger across the tops of the stored pallets, cases or items and check that finger every ten feet. The quicker it becomes dirty, the greater the problem with improper storage of slow moving materials.
WHAT WOULD MOM SAY?
24

GOLDEN ZONINGü Are pick locations positioned at or near picker waist height? ü SKU profiling can help with deployment of fast movers in the
“golden zone”. DOCKSü Do you use proper dock plates, levelers, trailer wheel chocks &
restraints that engage the impact guard on trailers to prevent movement?
ü When lift trucks fall from docks, injuries can be serious & sometimes fatal. Don’t skimp on the busiest & most dangerous part of the warehouse!
PEOPLEü What’s the mood? Do managers know team members by name
& greet them accordingly?ü Do workers receive regular feedback on targets & actual results?
WHAT WOULD MOM SAY?
25

26
FORGING YOUR SUPPLY CHAIN
27
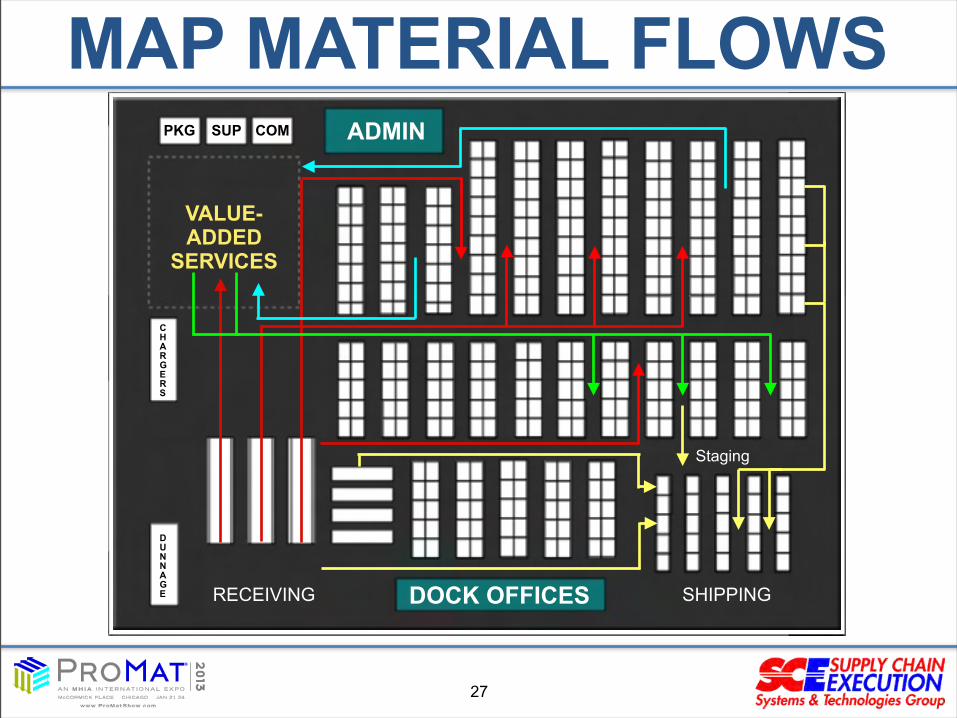
MAP MATERIAL FLOWS
DOCK OFFICES
ADMIN
VALUE- ADDED
SERVICES
CHARGERS
DUNNAGE RECEIVING SHIPPING
PKG COMSUP
Staging
28
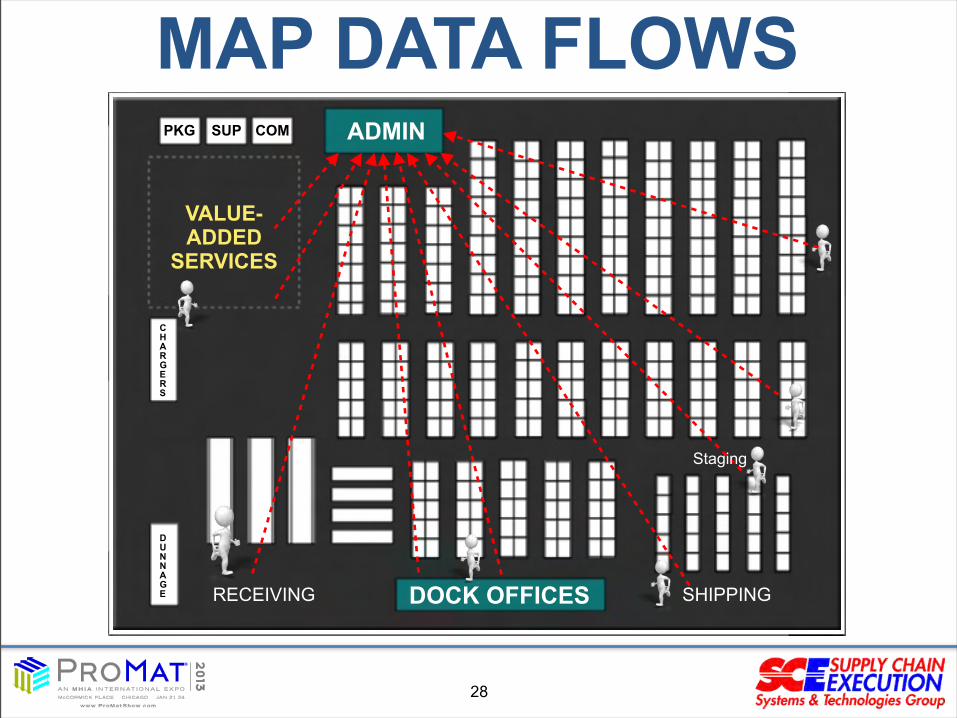
DOCK OFFICES
ADMIN
VALUE- ADDED
SERVICES
CHARGERS
DUNNAGE RECEIVING SHIPPING
PKG COMSUP
MAP DATA FLOWS
Staging
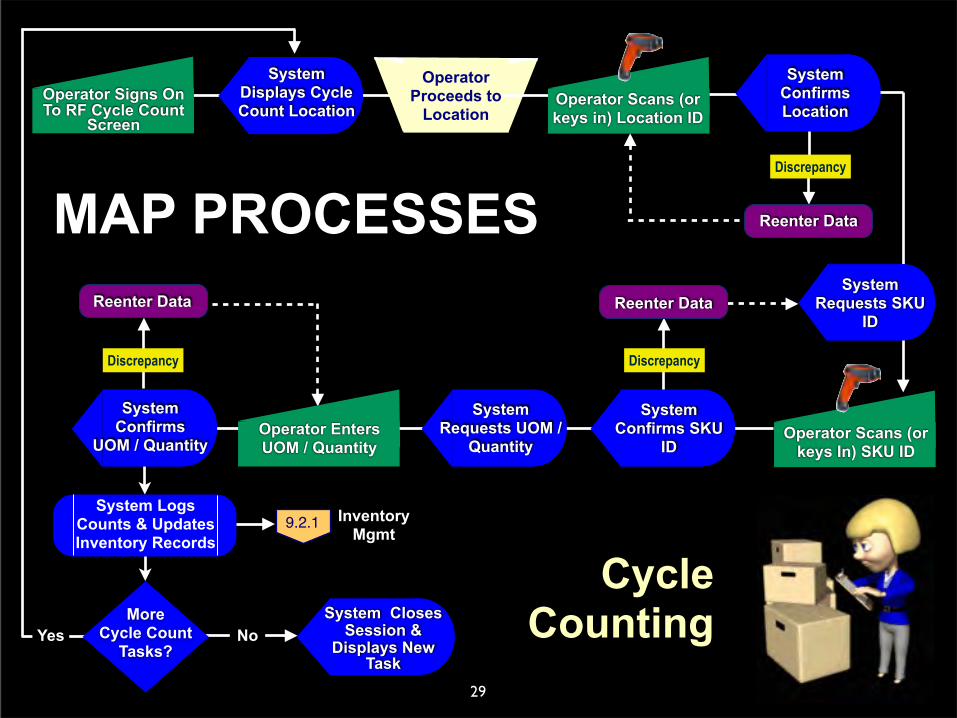
System Confirms Location
Operator Signs On To RF Cycle Count
Screen
System Displays Cycle Count Location
Operator Proceeds to
Location
Reenter Data
Discrepancy
System Confirms
UOM / Quantity
DiscrepancyDiscrepancy
Reenter Data
Operator Enters UOM / Quantity
System Requests UOM /
Quantity
System Confirms SKU
ID
Reenter Data
NoSystem Closes
Session & Displays New
Task
MAP PROCESSES
Yes
Cycle CountingMore
Cycle Count Tasks?
System Logs Counts & Updates Inventory Records
System Requests SKU
ID
Operator Scans (or keys in) Location ID
Operator Scans (or keys In) SKU ID
29
9.2.1 Inventory Mgmt
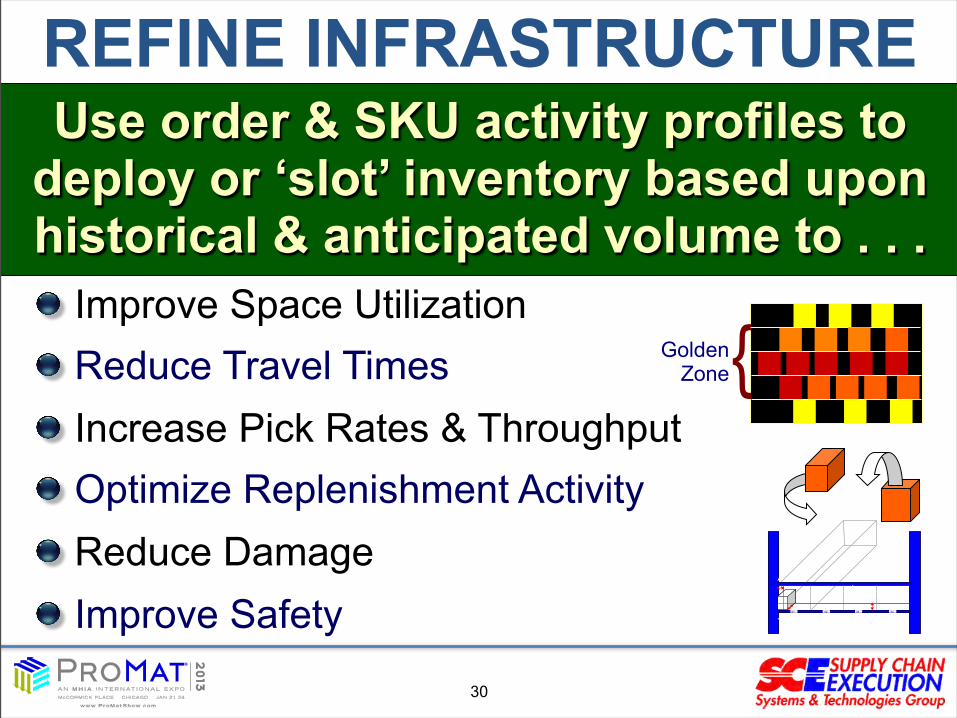
Improve Space UtilizationReduce Travel TimesIncrease Pick Rates & ThroughputOptimize Replenishment ActivityReduce DamageImprove Safety
Use order & SKU activity profiles to deploy or ‘slot’ inventory based upon historical & anticipated volume to . . .
01 0402 0301 0402 03
REFINE INFRASTRUCTURE
{GoldenZone
30
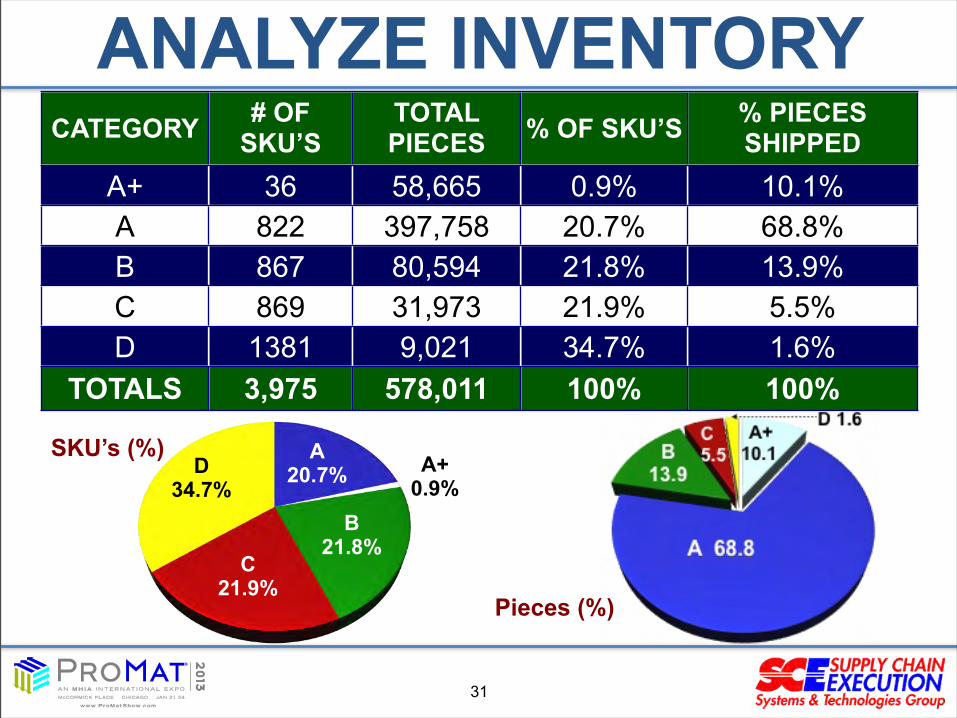
ANALYZE INVENTORYCATEGORY # OF
SKU’STOTAL PIECES % OF SKU’S % PIECES
SHIPPEDA+ 36 58,665 0.9% 10.1%A 822 397,758 20.7% 68.8%B 867 80,594 21.8% 13.9%C 869 31,973 21.9% 5.5%D 1381 9,021 34.7% 1.6%
TOTALS 3,975 578,011 100% 100%
A20.7% A+
0.9%B
21.8%C
21.9%
D34.7%
SKU’s (%)
Pieces (%)
31
0%
10%
20%
30%
40%
50%
60%
70%
80%
90%
100%
0% 5% 11% 16% 21% 27% 32% 37% 43% 48% 53% 59% 64% 69% 75% 80% 85% 91% 96%
% o
f Pie
ces
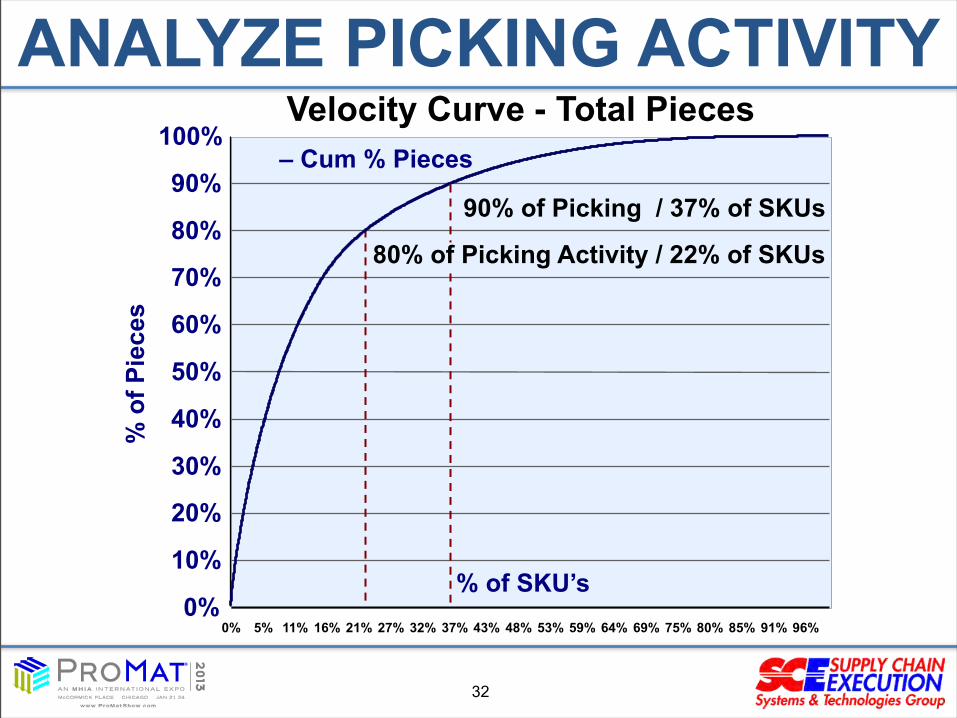
– Cum % Pieces
90% of Picking / 37% of SKUs
80% of Picking Activity / 22% of SKUs
% of SKU’s
Velocity Curve - Total PiecesANALYZE PICKING ACTIVITY
32
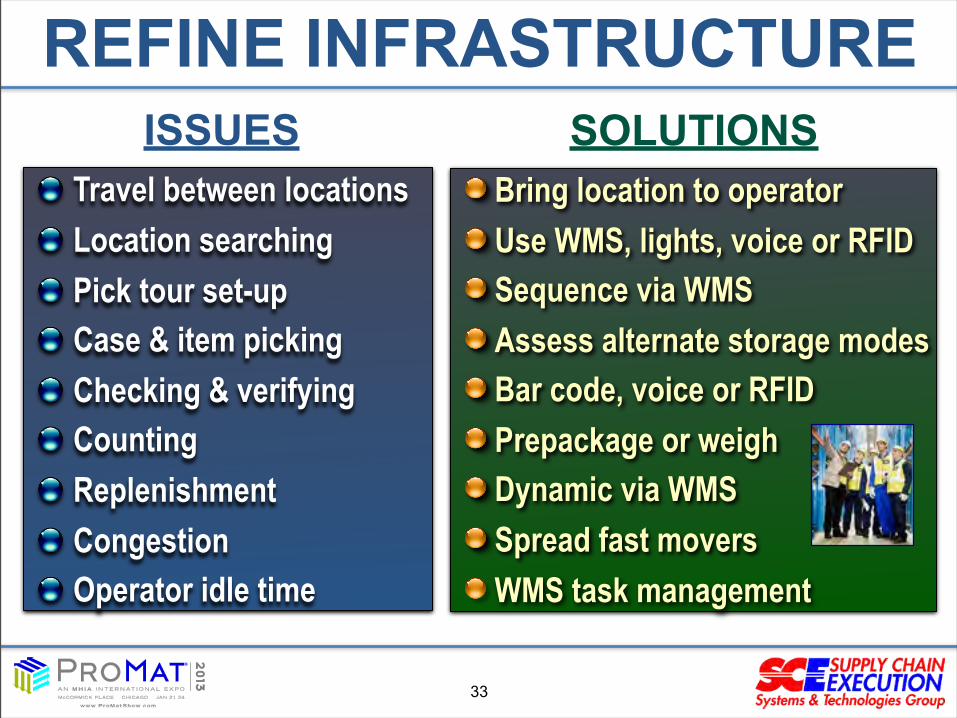
ISSUESTravel between locationsLocation searchingPick tour set-upCase & item pickingChecking & verifyingCountingReplenishmentCongestionOperator idle time
SOLUTIONSBring location to operatorUse WMS, lights, voice or RFIDSequence via WMSAssess alternate storage modesBar code, voice or RFIDPrepackage or weighDynamic via WMSSpread fast moversWMS task management
REFINE INFRASTRUCTURE
33
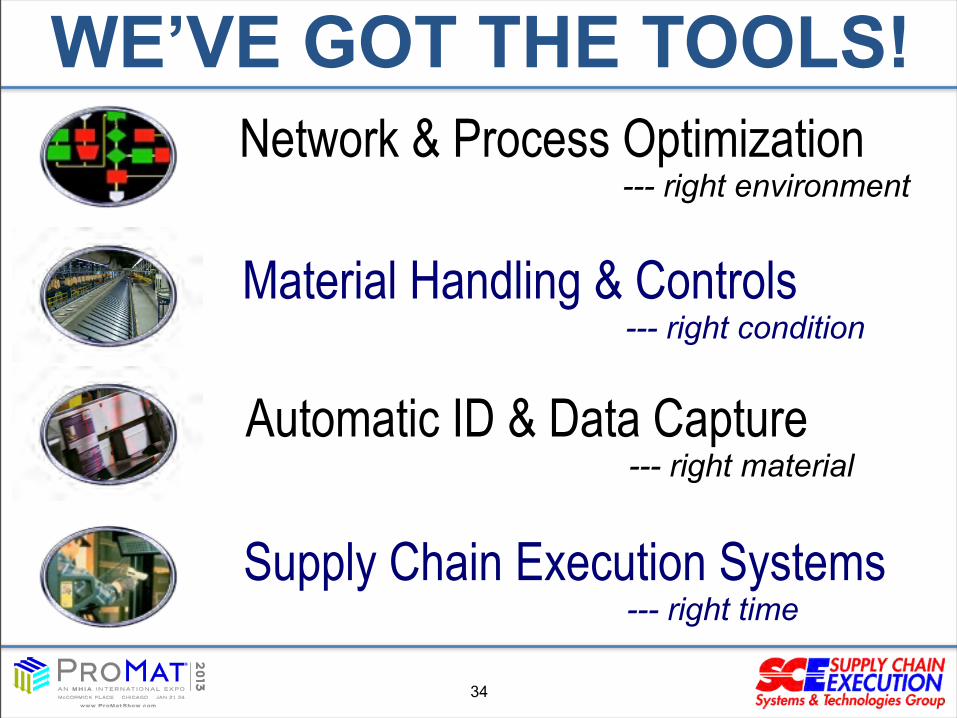
WE’VE GOT THE TOOLS!Network & Process Optimization --- right environment
34
Automatic ID & Data Capture --- right material
Material Handling & Controls --- right condition
Supply Chain Execution Systems --- right time
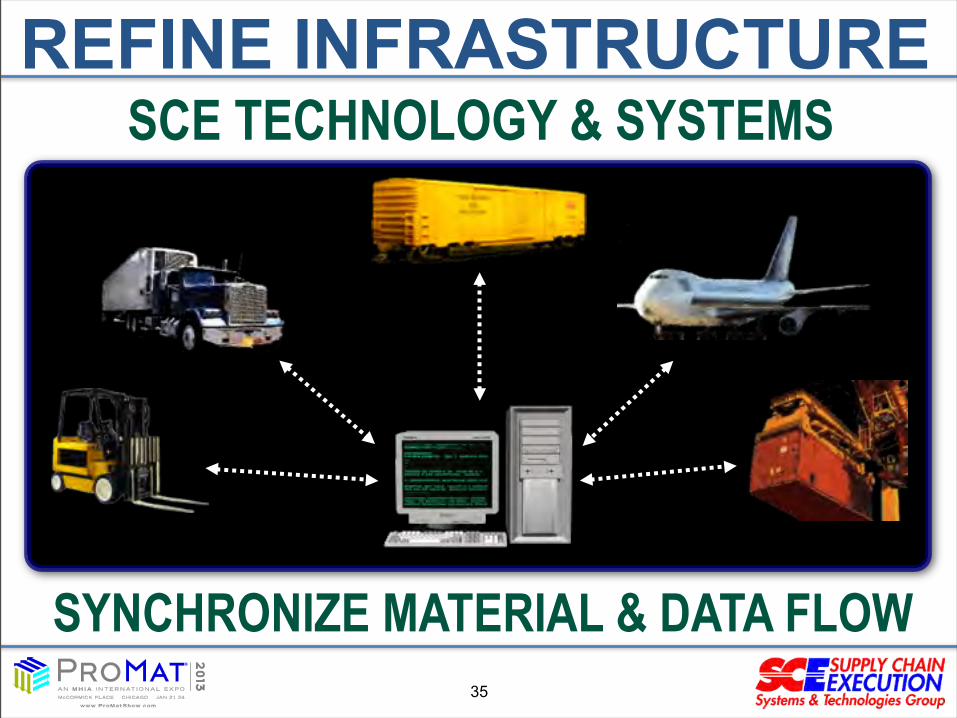
SCE TECHNOLOGY & SYSTEMSREFINE INFRASTRUCTURE
SYNCHRONIZE MATERIAL & DATA FLOW35
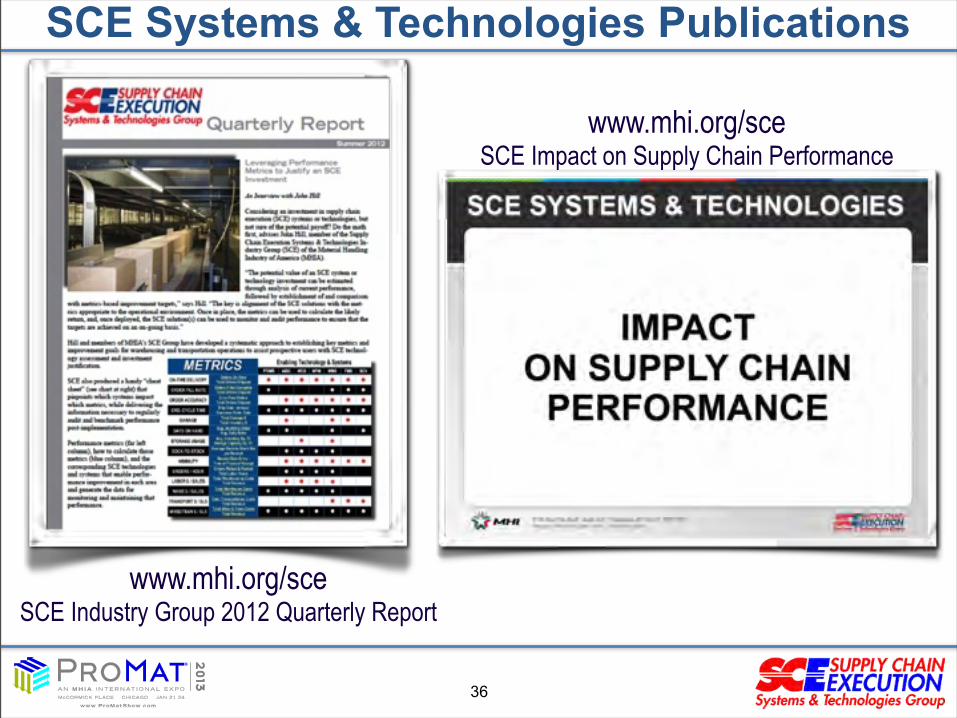
www.mhi.org/sceSCE Industry Group 2012 Quarterly Report
SCE Systems & Technologies Publications
36
www.mhi.org/sceSCE Impact on Supply Chain Performance
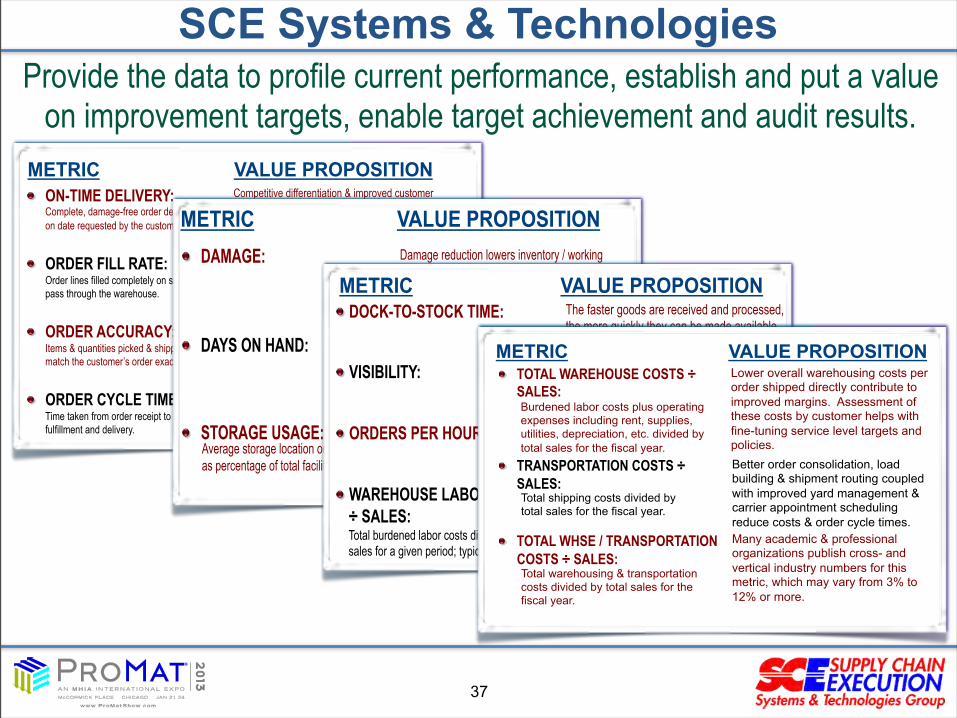
SCE Systems & TechnologiesProvide the data to profile current performance, establish and put a value
on improvement targets, enable target achievement and audit results.METRIC VALUE PROPOSITION ! ON-TIME DELIVERY:
Complete, damage-free order delivery on date requested by the customer.
! ORDER FILL RATE: Order lines filled completely on single pass through the warehouse.
! ORDER ACCURACY: Items & quantities picked & shipped match the customer’s order exactly.
! ORDER CYCLE TIME: Time taken from order receipt to fulfillment and delivery.
Competitive differentiation & improved customer retention through high service levels & quality. Reduced penalties, charge-backs, refused shipments, reprocessing costs & lost sales.
Increased throughput, lower warehouse costs per order, faster order cycle times & reduced or eliminated backorder processing costs. Improved capacity utilization.
Elimination of picking, packing & expedited shipping costs incurred to correct errors & omissions. Reduction of returns processing costs. Improved customer retention.
Reduced warehouse and expedited shipping costs per order. Improved inventory turns. See On-Time Delivery benefits, above.
METRIC VALUE PROPOSITION
Reducing the number of days on hand cuts working capital & warehouse space requirements, obsolescence & write-offs. Balance this value against customer service level objectives.
! DAMAGE:
! DAYS ON HAND:
! STORAGE USAGE: Average storage location occupancy as percentage of total facility capacity.
Damage reduction lowers inventory / working capital requirements & replacement costs. It also directly improves cycle times & customer service.
Better use of capacity allows for growth without having to add outside storage or new facilities, thereby reducing capital requirements and costs for inter-facility transfers.
! DOCK-TO-STOCK TIME: ! VISIBILITY:
! ORDERS PER HOUR:
! WAREHOUSE LABOR COSTS
÷ SALES:
METRIC VALUE PROPOSITION
Total burdened labor costs divided by total sales for a given period; typically a fiscal year.
Lower labor cost per order shipped through improved workforce utilization directly contributes to higher margins.
The faster goods are received and processed, the more quickly they can be made available for order filling and shipment.
Visibility from manufacturing to the warehouse and in-transit to the customer enables better planning, exception handling and service.
Improved error- and damage-free order throughput enhances inventory turn & service levels and cuts labor costs per item shipped.
METRIC VALUE PROPOSITION ! TOTAL WAREHOUSE COSTS ÷
SALES:
! TRANSPORTATION COSTS ÷ SALES:
! TOTAL WHSE / TRANSPORTATION
COSTS ÷ SALES: Total warehousing & transportation costs divided by total sales for the fiscal year.
Burdened labor costs plus operating expenses including rent, supplies, utilities, depreciation, etc. divided by total sales for the fiscal year.
Total shipping costs divided by total sales for the fiscal year.
Lower overall warehousing costs per order shipped directly contribute to improved margins. Assessment of these costs by customer helps with fine-tuning service level targets and policies.
Better order consolidation, load building & shipment routing coupled with improved yard management & carrier appointment scheduling reduce costs & order cycle times. Many academic & professional organizations publish cross- and vertical industry numbers for this metric, which may vary from 3% to 12% or more.
37
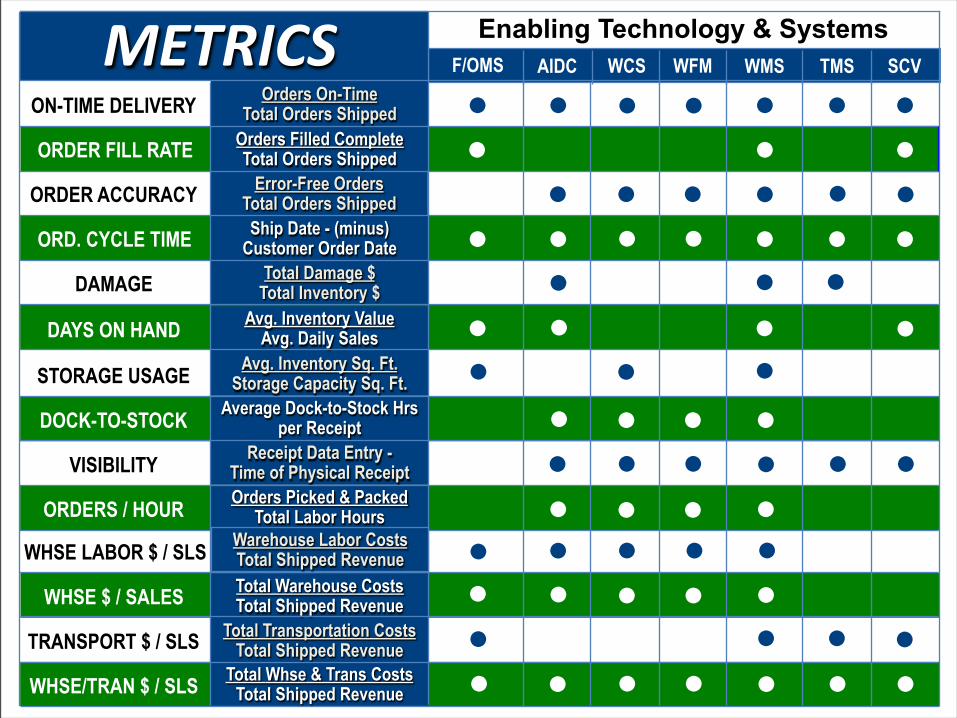
Total Whse & Trans Costs Total Shipped Revenue
Total Transportation Costs Total Shipped Revenue
Orders Picked & Packed Total Labor Hours
Total Warehouse Costs Total Shipped Revenue
Receipt Data Entry - Time of Physical Receipt
Average Dock-to-Stock Hrs per Receipt
Avg. Inventory Sq. Ft. Storage Capacity Sq. Ft.
Avg. Inventory Value Avg. Daily Sales
Total Damage $ Total Inventory $
Ship Date - (minus) Customer Order Date
Error-Free Orders Total Orders Shipped
Orders Filled Complete Total Orders Shipped
Orders On-Time Total Orders Shipped
F/OMS AIDC WCS WMS
TRANSPORT $ / SLS
WHSE $ / SALES
ORDERS / HOUR
VISIBILITY
DOCK-TO-STOCK
STORAGE USAGE
DAYS ON HAND
DAMAGE
ORD. CYCLE TIME
ORDER ACCURACY
ORDER FILL RATE
ON-TIME DELIVERY
WFM Enabling Technology & Systems
TMS
WHSE LABOR $ / SLS Warehouse Labor Costs Total Shipped Revenue
SCV
WHSE/TRAN $ / SLS
METRICS(
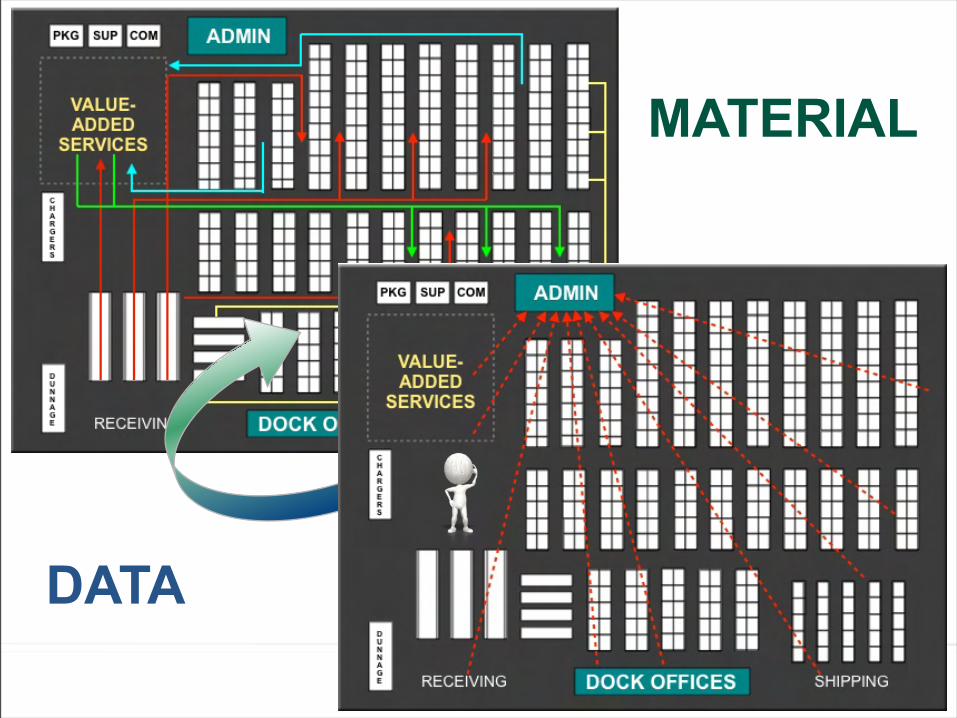
MATERIAL
39
DATA
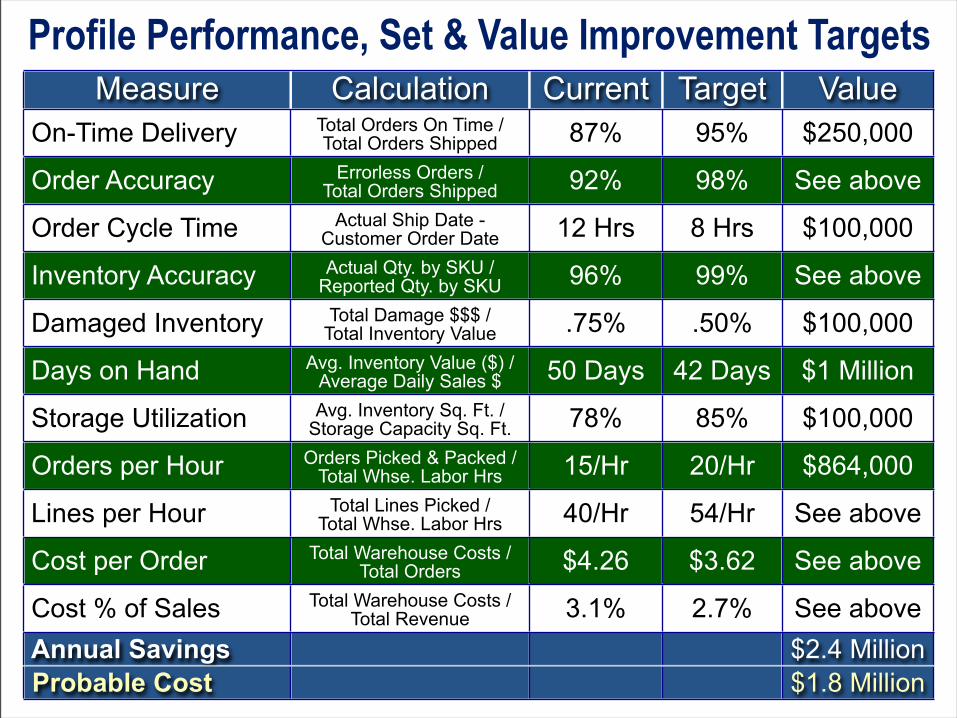
Measure Calculation Current Target ValueOn-Time Delivery Total Orders On Time /
Total Orders Shipped 87% 95% $250,000
Order Accuracy Errorless Orders /Total Orders Shipped 92% 98% See above
Order Cycle Time Actual Ship Date -Customer Order Date 12 Hrs 8 Hrs $100,000
Inventory Accuracy Actual Qty. by SKU /Reported Qty. by SKU 96% 99% See above
Damaged Inventory Total Damage $$$ / Total Inventory Value .75% .50% $100,000
Days on Hand Avg. Inventory Value ($) /Average Daily Sales $ 50 Days 42 Days $1 Million
Storage Utilization Avg. Inventory Sq. Ft. /Storage Capacity Sq. Ft. 78% 85% $100,000
Orders per Hour Orders Picked & Packed /Total Whse. Labor Hrs 15/Hr 20/Hr $864,000
Lines per Hour Total Lines Picked /Total Whse. Labor Hrs 40/Hr 54/Hr See above
Cost per Order Total Warehouse Costs / Total Orders $4.26 $3.62 See above
Cost % of Sales Total Warehouse Costs / Total Revenue 3.1% 2.7% See above
Annual Savings $2.4 Million Probable Cost $1.8 Million
Profile Performance, Set & Value Improvement Targets
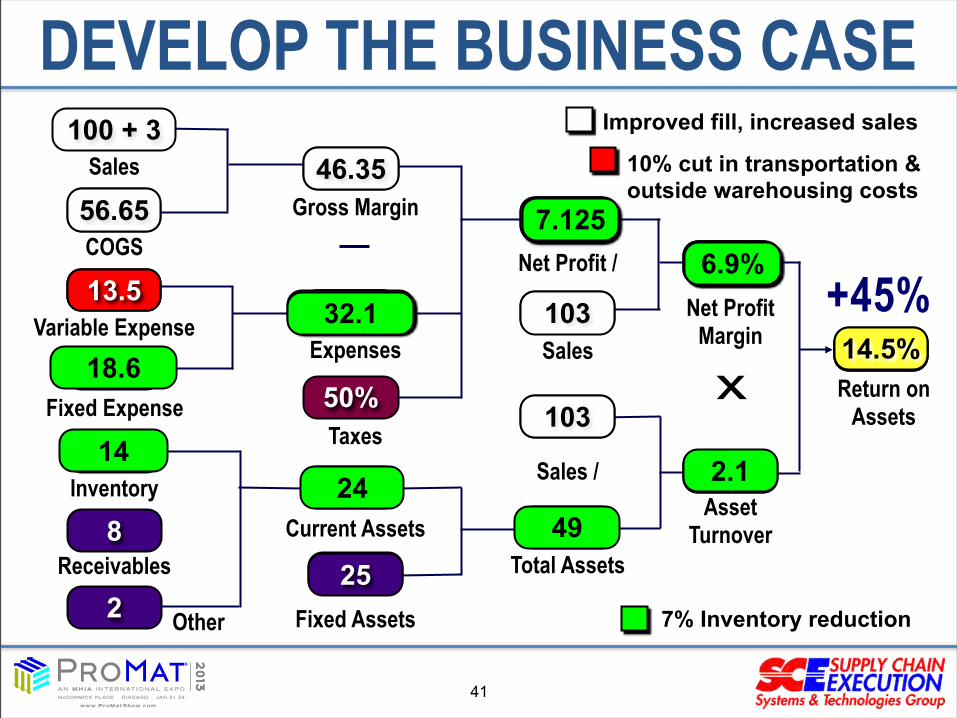
DEVELOP THE BUSINESS CASE
35
45100
15
20
15
8
2
25
55 5
100
100
50
5%
2
10%
25
Return onAssets
Sales
COGS
Variable Expense
Fixed Expense
Inventory
Receivables
Other
50%
25
Gross Margin
Expenses
Taxes
Current Assets
Fixed Assets
Net Profit /
Sales
Sales /
Total Assets
Asset Turnover
Net ProfitMargin
X
Improved fill, increased sales
10% cut in transportation & outside warehousing costs
7% Inventory reduction
46.35100 + 3
56.65
103
103
5.6755.5%
11.3%
2.06
3515 +45%33.5
13.5
6.425
12.8%
6.24%
14.5%
7.16.9%
18.6
1424
33.5
49
2.1
6.43
32.1
7.1256.9%
41
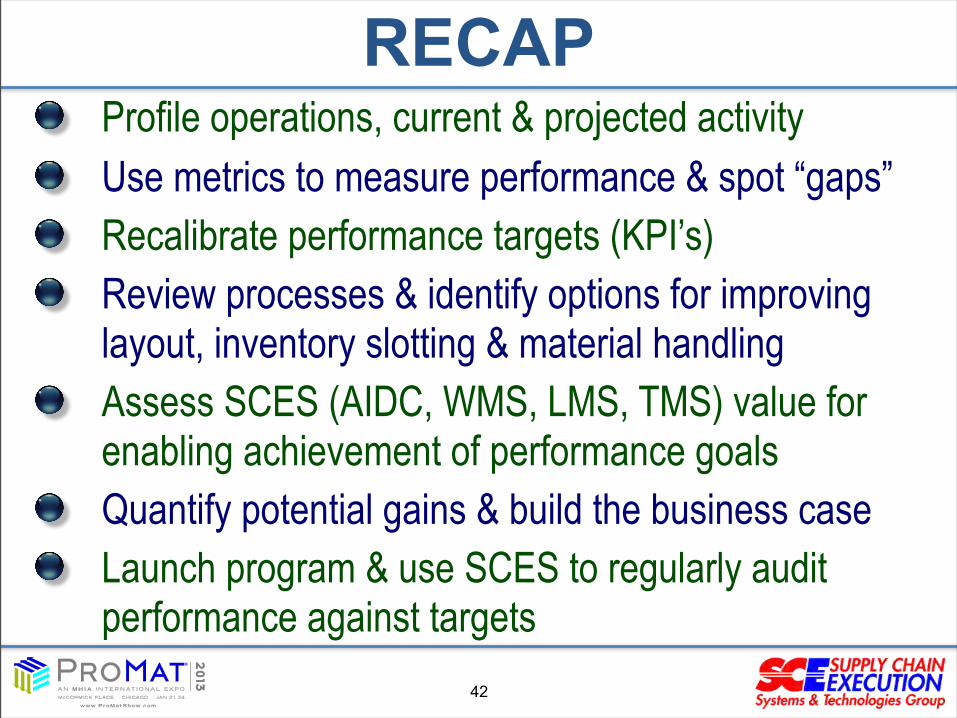
Profile operations, current & projected activityUse metrics to measure performance & spot “gaps”Recalibrate performance targets (KPI’s)Review processes & identify options for improving layout, inventory slotting & material handlingAssess SCES (AIDC, WMS, LMS, TMS) value for enabling achievement of performance goals Quantify potential gains & build the business caseLaunch program & use SCES to regularly audit performance against targets
RECAP
42

QUESTIONS?
43

Warehousing is like riding a bicycle –
Ts g !

For More Information:
Gary Forger, MHI Managing [email protected]/SCE
704-676-1190
2013 MHI™ Copyright claimed as to audiovisual works of seminar sessions and sound recordings of seminar sessions. All rights reserved.
2013 MHI™ Copyright claimed as to audiovisual works of seminar sessions and sound recordings of seminar sessions. All rights reserved.