Using Innovations Surveys for Econometric Analysis · Using Innovations Surveys for Econometric...
41
NBER WORKING PAPER SERIES USING INNOVATIONS SURVEYS FOR ECONOMETRIC ANALYSIS Jacques Mairesse Pierre Mohnen Working Paper 15857 http://www.nber.org/papers/w15857 NATIONAL BUREAU OF ECONOMIC RESEARCH 1050 Massachusetts Avenue Cambridge, MA 02138 April 2010 Chapter prepared for the Handbook of the Economics of Innovation, B. H. Hall and N. Rosenberg (editors). We are especially grateful to Bronwyn H.Hall for numerous comments, as well as encouragements and editorial help. The views expressed herein are those of the authors and do not necessarily reflect the views of the National Bureau of Economic Research. NBER working papers are circulated for discussion and comment purposes. They have not been peer- reviewed or been subject to the review by the NBER Board of Directors that accompanies official NBER publications. © 2010 by Jacques Mairesse and Pierre Mohnen. All rights reserved. Short sections of text, not to exceed two paragraphs, may be quoted without explicit permission provided that full credit, including © notice, is given to the source.
Transcript of Using Innovations Surveys for Econometric Analysis · Using Innovations Surveys for Econometric...

NBER WORKING PAPER SERIES
USING INNOVATIONS SURVEYS FOR ECONOMETRIC ANALYSIS
Jacques MairessePierre Mohnen
Working Paper 15857http://www.nber.org/papers/w15857
NATIONAL BUREAU OF ECONOMIC RESEARCH1050 Massachusetts Avenue
Cambridge, MA 02138April 2010
Chapter prepared for the Handbook of the Economics of Innovation, B. H. Hall and N. Rosenberg(editors). We are especially grateful to Bronwyn H.Hall for numerous comments, as well as encouragementsand editorial help. The views expressed herein are those of the authors and do not necessarily reflectthe views of the National Bureau of Economic Research.
NBER working papers are circulated for discussion and comment purposes. They have not been peer-reviewed or been subject to the review by the NBER Board of Directors that accompanies officialNBER publications.
© 2010 by Jacques Mairesse and Pierre Mohnen. All rights reserved. Short sections of text, not toexceed two paragraphs, may be quoted without explicit permission provided that full credit, including© notice, is given to the source.
Using Innovations Surveys for Econometric AnalysisJacques Mairesse and Pierre MohnenNBER Working Paper No. 15857April 2010JEL No. C35,C81,O30,O50
ABSTRACT
After presenting the history, the evolution and the content of innovation surveys, we discuss the characteristicsof the data they contain and the challenge they pose to the analyst and the econometrician. We documentthe two uses that have been made of these data: the construction of scoreboards for monitoring innovationand the scholarly analysis of various issue related to innovation. In particular we review the questionsexamined and the results obtained regarding the determinants, the effects, the complementarities, andthe dynamics of innovation. We conclude by suggesting ways to improve the data collection and theireconometric analysis.
Jacques MairesseCREST-INSEE15, Boulevard Gabriel PERI92245 MALAKOFF CEDEXFRANCEand [email protected]
Pierre MohnenUNU-MERITMaastricht UniversityP.O. Box 6166200 MD [email protected]

2
1 Introduction
The traditional measures of innovation are R&D expenditures and patents. Following the
recommendations of the Frascati Manual (OECD, 2002), R&D expenditures have been regularly
collected, usually on an annual basis, in R&D surveys since the 1950s in many countries. Patent
data stretch much further back in time, to the 19th century, the development of intellectual
property rights and the institution of national patent offices, and they are nowadays easily
available electronically. However, R&D measures only an input in the innovation process,
although it is a major one, and patents only cover innovations that are sufficiently new and
deemed worth to be patented by the patent applicant, and that may never be introduced on the
market. A third source of innovation indicators that has become widely used are those from
innovation surveys. They provide qualitative and quantitative data on innovation activities and
on the successful introduction of different types of innovation on the market. They are
extensively taken into consideration by statisticians and policy observers to benchmark and
monitor innovation performance, as well as by economists and econometricians to explore and
analyze the determinants and the effects of innovation and a variety of other related topics. In
this paper we describe the innovation surveys, we review how useful they may be for
constructing indicators and scoreboards to inform innovation policy, and also, and this is our
main focus here, for making progress in econometric analyses of innovation; and finally we
make a few general suggestions on what could be done to improve these surveys and their
usefulness in the future.
The first such surveys were conducted in the 1950s in Britain by Carter and Williams (1958) for
the Science and Industry Committee of the British Association for the Advancement of Science,
in the 1960s in the United States by Arthur D. Little, E. Mansfield and S. Myers for the National
Science Foundation, in the 1970s at the Science and Policy Research Unit (SPRU) in Brighton
under the impulse of Keith Pavitt (Pavitt, 1984, Robson et al., 1988) and in the 1980s at the
German Ifo Institute for Economic Research at the University of Munich. Pilot projects were
then conducted in a certain number of countries, namely Canada, France, Germany, Italy,
Luxembourg, the Netherlands, Norway, Sweden, Uruguay and the United States. Through a joint

3
effort by the OECD and Eurostat these innovation surveys were formalized and standardized in
the Oslo Manual, the first version of which appeared in 1992 and subsequent revisions in 1996
and 2005. The Oslo Manual (OECD, 1992, 1996, 2005) defines what is meant by an innovation,
the different ways in which an enterprise can innovate, ways of quantitatively measuring
innovation on the input and on the output side, various degrees of novelty of innovation, and
various questions regarding the sources, the effects, the obstacles and the modalities of
innovation.1
Today a large majority of countries throughout the world conduct innovation surveys. In Europe
they are known as the Community Innovation Surveys (CIS) and are conducted at regular
intervals. Up to the third revision of the Oslo Manual, they were conducted every four years, i.e.
in 1993, 1997, 2001, and 2005 for respectively CIS 1 (1990-1992), CIS 2 (1994-1996), CIS 3
(1998-2000) and CIS 4 (2002-2004). From 2007 on, they are run at two-year intervals and are
named by the last year that they cover (e.g. CIS2006 and CIS2008).2 The surveys still cover a
three year time span. CIS1 was generally restricted to manufacturing enterprises, from CIS2
onwards surveys have been extended to services. Special surveys have been conducted for
specific industries: for example, in the Netherlands farm level data were collected by the
Agricultural Economics Research Institute (see Diederen, van Meijl and Wolters, 2002),
Statistics Canada organized a unique innovation survey for the construction industry3 (see
Anderson, 2003) and included the natural resource sector in its 1999 Survey of Innovation (see
Schaan, 2003). In 2001 a Latin American complement to the Oslo Manual was published, the
Bogotá Manual, a complement to the Oslo Manual with more emphasis on absorption capacity,
technological capabilities, and innovation efforts (Jaramillo et al, 2001). The CIS surveys are
now conducted in all EU member states, sometimes even at a regional level. Innovation surveys
exist under different acronyms in many other OECD countries, but also in emerging economies,
transition countries and developing countries. By and large the surveys have the same structure
1 For a history of the innovation surveys see Mytelka et al. (2004), Debresson (1996, pp. 8-10), Archibugi et al. (1994), and Godin (2002). 2 In Germany, the Federal Ministry for Education and Research has commissioned yearly innovation surveys since 1993, which are an integral part of the CIS surveys mandated by the European Union. The Dutch Central Bureau of Statistics has run biannual surveys since 1999 (starting with CIS2.5). 3 Statistics Canada, 1999 Survey of Innovation, Advanced Technologies and Practices in the Construction and Related Industries.

4
and the same questions regarding innovation, but there are some differences across countries -
even in the CIS - regarding the content, formulation and ordering of the questions.4 5
These survey data should be distinguished from other more specific surveys that are
complementary but different from the innovation surveys, such as the Statistics Canada Survey
on the Commercialization of Innovation, 2007 and repeated Surveys of Advanced Technologies
in Manufacturing, the French surveys on organizational changes and on intellectual property
rights, the Yale Survey on Industrial Research and Development and Carnegie Mellon University
R&D Survey in the United States. Those surveys are not based on the Oslo Manual and focus on
particular aspects of innovation. Other surveys, such as the Spanish annual “Encuesta Sobre
Estrategias Empresariales” (ESEE), which exists since 1990, the Spanish DIRNOVA database
provided by the Valencian Institute of Medium and Small Enterprises, the Italian “Indagine sulle
Imprese Manufatturiere” from the Mediocredito Centrale, the World Bank administered
Investment Climate Survey, or the Chinese National Bureau of Statistics annual survey on large
and medium size enterprises, contain some questions encountered in the innovation surveys but
also information on many other variables. Maybe the closest relative of the innovation surveys
are the literature-based counts of innovation like the one commissioned in 1982 by the US Small
Business Administration.
We confine ourselves here to a presentation of the innovation surveys that follows the general
guidelines of the Oslo Manual, and to a review of econometric studies that use the data from
these surveys, excluding those that are based exclusively on R&D data, patents, literature based
indicators, bibliometric and other innovation indicators from other types of more specific
surveys. From now on when we shall refer to innovation surveys we shall mean the majority of
surveys based on the Oslo Manual recommendations or directly inspired by them. These surveys
are certainly among the most exploited statistical surveys by economists in the many countries
where they are regularly performed and made widely available through various types of 4 Besides the 27 EU countries, they are Canada, Norway, Switzerland, Russia, Turkey, Australia, New Zealand, Argentina, Brazil, Chile, Colombia, Mexico, Peru, Uruguay, Venezuela, South Korea, Taiwan, Singapore, Malaysia, Thailand, Japan, China, Vietnam, Indonesia, South Africa and Tunisia. India and the majority of the 20 African countries of NEPAD (The New Partnership for African Development) are presently launching their innovation surveys. 5 For a history of innovation surveys in Latin America, see Crespi and Peirano (2007).

5
confidentiality agreements.6 It is impossible in the large and burgeoning literature taking
advantage of the innovation survey data to do justice to all the existing studies. Our purpose is
thus not to try to cover the whole literature but to illustrate the use that can be made of these data
to deepen our understanding of innovation, and to suggest improvements in the data collection
and analysis. Inevitably we will mention only a very small fraction of the literature to illustrate
some of the points that we want to bring to the reader’s attention. If we tend to refer to our own
papers more often than to others, it is not because we consider them better or more
representative, but simply because we know them best. Similarly, if we mostly cite studies based
on the European innovation surveys CIS, it is not only because they have given rise to an
especially great number of studies, but also because our own experience is largely based on using
them.7
In the following sections, we shall first present the general structure and contents of the
innovation surveys and comment on the characteristics of the data they provide (section 2 and 3).
We shall then consider briefly their direct use for constructing innovation indicators and
scoreboards, which is de facto their main purpose (section 4). We shall next consider
econometric studies which take advantage of the innovation data. We shall review those more at
length, but still without going into details, distinguishing among them three broad, often
overlapping, categories: studies on the determinants of innovation, studies on the effects of
innovation, and studies on specific topics, such as mainly complementarities and persistence in
innovation (sections, 5, 6 and 7). Before concluding we shall also make a few remarks on how to
make progress both on the design and implementation of the innovation surveys themselves, and
on their appropriate and relevant use for the purpose of econometric analysis (section 8).
6Some of the possible ways of accessing micro data in the respect of the confidentiality agreements are the on-site access at the statistical office, the exclusive remote access in a secure environment, the establishment of a secrecy committee, and the access only to micro aggregated data. 7 For a previous survey of the literature using innovation survey data, the reader is referred to Arundel and Bordoy (2005). For a review of studies using innovation surveys in developing countries, see Bogliacino et al. (2009).

6
2 Structure and content of innovation surveys
The Oslo Manual started and evolved out of a concern to complement patents and bibliometric
indicators and R&D surveys and to directly characterize firms’ innovation process. It thus
basically provides:
- a) indicators of innovation output, such as the introduction of new products and processes,
organizational changes and marketing innovations, the percentage of sales due to products new
to the firm or new to the market, and the share of products at various stages of the product life-
cycle;
- b) a wider range of innovation expenditures or activities than R&D expenditures, such as the
acquisition of patents and licenses, product design, personnel training, trial production, and
market analysis;
- c) information about the way innovation proceeds, such as the sources of knowledge, the
reasons for innovating, the perceived obstacles to innovation, the perceived strength of various
appropriability mechanisms, and the partners of research cooperation.
The innovation surveys assemble data on innovators and non-innovators, where “innovators” are
defined as enterprises that over a given period of time, most generally the last three years, have
introduced a new product or a new process, or have at least tried to or are still in the process of
doing so, where “new” is defined as substantially improved or completely new, and “new
product” can be new only to the firm or also new to the market. In these surveys, firms are asked
to give information about the inputs, the outputs and the behavioral and organizational
dimensions of their innovative activities.
Table 1 gives an overview of the typical list of questions based on the Oslo Manual guidelines,
as implemented in the series of Community Innovation surveys (CIS). Many of these questions
have been modified or introduced, or have disappeared in the various waves of the CIS (CIS1,
CIS2, CIS3, CIS 4, CIS2006 and CIS2008). “Old” questions considered as less relevant or
informative make space for new questions. For example, questions on the relative importance
and effectiveness of different appropriation mechanisms, initially borrowed from the Yale
survey, were progressively abandoned after CIS 2, whereas questions regarding environmental
innovations have recently made their appearance. Many questions in the CIS are also not fully

7
harmonized across European countries.8 While the core CIS questionnaire is nearly the same in
all countries, almost every country has its own peculiarities, be it additional questions,
differences in the sequence of the questions or somewhat different formulations of the same
questions.9
INSERT TABLE 1 ABOUT HERE
The typical innovation survey asks first some general questions regarding the responding
enterprise (category I), then some questions to determine whether the enterprise was in some
way an innovator (category II). If at least one question of category II is answered positively, then
the respondent has to fill out the rest of the questionnaire to give some detail regarding the
innovation, regrouped into categorical (III), dichotomous (IV), or continuous (V) data. The
questionnaire ends with a number of questions that every respondent needs to answer (VI).
Since its 2005 revision, the Oslo Manual distinguishes four types of innovations: product
innovations (new goods or services or significant improvements of existing ones), process
innovations (changes in production or delivery methods), organizational innovations (changes in
business practices, in workplace organizations or in the firm’s external relations) and marketing
innovations (changes in product design, packaging, placement, promotion or pricing).
The Oslo Manual opted for the subject approach, i.e. for collecting data at the firm level,
including all its innovation outputs and activities. This implies that we do not have data about
particular innovation projects. The object approach in contrast would make the individual
innovation the unit of analysis, as is the case for literature-based innovation counts. One
important advantage of the subject approach is that the innovation surveys collect comprehensive
data at the decision making level of the firm, which is also the level of available accounting and
financial data that can be merged with the innovation data for richer analyses and that can be
easily related with industry statistics and national accounts. It also naturally covers innovators
8 They are even less harmonized if we consider the innovation surveys done in countries outside the European Community. 9 For more details about the differences in the content of the CIS questionnaire over time, see Arundel and Bordoy (2005).

8
and non-innovators, generators and users of innovation. In spite of its difficulties, the subject
approach is on the whole less demanding than the object approach, which raises specific
difficulties to identify, compare and assess individual innovations. The drawback with the
subject approach is that it takes as a whole all the innovation projects of a firm, some being
highly successful, some less and others not at all. Analyses at the individual innovation project
level, whenever possible, can be of course extremely instructive and useful to complement and
enlighten analyses performed at the overall level of firms.
3 Characteristics of innovation survey data
Most of the data collected in innovation surveys are qualitative, subjective and censored. They
are taken from stratified samples (where the strata are generally defined in terms of size and
industry, and sometimes regions). They come in waves of cross-sectional data, where the same
firms are not necessarily sampled wave after wave. Moreover there are significant differences
between waves over time and between countries in the innovation surveys regarding content of
the questionnaire, response rates, and sampling. All these features of the data create specific
difficulties and require particularly careful handling for the construction of indicators and the
implementation of econometric analyses, and for their proper interpretation and use. We consider
them here in turn indicating briefly how they can be dealt with as satisfactorily as possible.
Qualitative variables: As shown in Table 1, most of the data from the innovation surveys are
qualitative, i.e. discrete: dichotomous (binary), ordered categorical (such as the importance of
obstacles on a five-point Likert scale) or unordered categorical (e.g. different sources of
information for innovation). Qualitative data are less informative than quantitative data but less
affected by measurement errors (for example, whether the share of sales due to new products is
15 or 20 per cent, whether the relevant enterprise is an innovator). Appropriate econometric
techniques have been developed to handle these kinds of data: binomial, multinomial and
ordered logit and probit models, which are described in major econometric textbooks. Parametric
estimation of categorically ordered (including dichotomous) variables hinges on the
distributional assumption of a latent variable, whereas semi-parametric models are more flexible,
but often much harder to identify.
9
Censored variables and selectivity issues: A number of variables are censored (i.e. collected only
for a subset of the firms in the overall sample). Those are, for instance, the variables related to
innovation expenditures and innovation output. Only “innovating” firms as defined in the
questions of category (II) of the innovation survey questionnaire (in Table 1 above), have to
answer the questions in categories II to V. In a number of cases, the value for the censored
variable can safely be put equal to zero, such as the share of sales due to new products. In other
cases, however, it has no meaning when censored, e.g. the nature of partners for non cooperating
firms. The censoring should be corrected for to avoid potential selection biases. This can be done
using sample selection models comprising a regression for the censored variable together with a
selection equation. When implementing such a method, it should be clear from the questionnaire
in Table 1 that we have little information regarding non-innovating firms and hence, in the
absence of additional information about these firms obtained by merging the innovation survey
data with other firm data, we do not have not much room to discriminate between innovators and
non-innovators and to correct adequately for potential selectivity biases.
Subjective data: Many of the variables, qualitative and quantitative as well, are of a subjective
nature, being largely based on the personal appreciation and judgment of the respondents.One of
the most interesting variables and that is relatively well known, the share in total sales due to
new products, has, for example, values that tend to be rounded (10%, 15%, 20%, …), attesting to
its subjective nature and suggesting that perhaps we should treat it as a categorical variable and
not make too much out of its continuous variations. What exactly is defined as a new or
improved product is not always clear anyway, certainly not to the respondents. There are some
examples given in the Oslo Manual, which are themselves more or less debatable and are not
always reproduced in the questionnaires.10 The distinction between “new to the firm” and “new
to the market” is also subject to a great deal of subjective judgment. To give a correct answer to
this question presupposes a very good knowledge of one’s market.
Quality of variables and errors in variables: The quality of subjective answers to questions
posed in innovation surveys can be very different depending on the judgment and knowledge of 10 For example, the Oslo Manual defines the introduction of a new season’s anorak as not innovative if there is no change in the quality of the clothing but only a change in fashion design, and yet not providing the latest style of anorak will make the enterprise less competitive.

10
the respondents. Even when the answers are based largely on accounting or internal report
information, firms generally do not keep this information in a form that enables them to giv
precise answers. The quality of the data is thus necessarily uneven and random errors of
classification and measurement in qualitative and quantitative variables are inevitable. In the
case of innovation surveys, experience has shown that the share of sales due to new products can
be relatively accurate, even though it is often rounded to the nearest 5%. The reason is that most
firms do actually track their sales by type of product, so that they can recover this information
when asked, at least conditional on a correct classification of their products as “new or
substantially improved”, as explained in the innovation survey questionnaire. In contrast, the
innovation expenditure variable, which is another interesting quantitative variable that extends
the notion of R&D spending (as defined in the Frascati Manual), is often of rather low quality or
not even answered, at least until recently. Innovation expenditures are intended by the Oslo
Manual to be the sum of R&D spending plus worker training, capital expenditures, marketing
and engineering expense that is associated with new processes and products. Except for R&D
spending, which many firms are used to reporting, these expenditures are often not separately
tracked from those related to older products and processes, making reporting difficult. Another
potentially interesting quantitative variable, which could be the counterpart of the share of sales
due to new products, is the relative reduction in production costs due to process innovation.
However, this variable has not been considered in the CIS innovation surveys, except in
Germany, since a question asking innovating firms to provide such a measure is deemed as being
too difficult to answer with sufficient reliability.
Cross-sectional data and endogeneity issues: Basically innovation survey data are of a cross-
sectional nature, and it is always problematical to address econometric endogeneity issues and
make statements about directions of causality with cross-sectional data. Many of the variables in
the innovation surveys concern strategic decisions of the enterprise: doing R&D and innovating,
applying for financial support and intellectual property protection, cooperating in innovation.
These decisions are largely determined simultaneously and are jointly dependent on third factors,
which we do not know or do not observe and for which we have very few exogenous or
environmental variables that can serve as relevant and valid instruments. A proper analysis of
causality with innovation survey data would require structural modeling in a dynamic setting and

11
hence the availability of panel data. It is, however, very difficult to construct panel data samples
by merging consecutive innovation surveys because they are performed every four years in most
countries and every two years in only a few of them, and since moreover they are based on a
stratified sampling design and have low response rates in the countries where they are not
mandatory.11 It is also the case that the innovation surveys refer to a three-year period for most of
the qualitative variables, and to the last year of that period for the quantitative variables. For
instance, an enterprise may declare that they have introduced a new product on the market in the
last three years, but its success and performance in doing so, as measured by the percentage of
total sales attributed to the products introduced in the last three years, is assessed in the last year
of that time-span. Most of the natural candidates as explanatory variables for such innovation
performance in an econometric model, such as firm size and R&D intensity, are also only
available in this last year. When a panel, even if short, can be constructed and lagged variables
can be introduced as explanatory variables, then lags refer to a four-year or a two-year period
depending on the frequency of the surveys.12
4 Indicators and scoreboards
The main purpose of innovation surveys and the leading reason why they are performed
regularly in an increasing number of countries are certainly to inform the research and innovation
policies of these countries by helping them to benchmark and monitor their innovation
performance on the basis of appropriate indicators and scoreboards. It is not primarily to provide
data for econometric analyses of innovation and a better understanding of its process, and thus
also contribute, but indirectly and progressively, to improved evidence-based policy
recommendations. Policy makers want to be able to compare simply and rapidly their country’s
relative performance on a certain number of individual indicators like R&D, success in product
innovations, importance of collaborations, etc. A country may fare comparatively well in
comparison to others in its R&D expenditures in percentage of GDP but come up with a lower
share of new products. This may suggest that this country has special difficulties to be
11 An extreme example is that of Germany where the innovation survey is performed every year but is not mandatory. For CIS2008 the response rate in Germany was 37% (Aschoff et al., 2009). 12 When the surveys are bi-annual and refer to a three-year period to define the share of sales due to new products, there is a one-year overlap between these two consecutive measures, with the consequence that the persistence of innovation may be overestimated in the absence of appropriate corrections.

12
considered in converting its investment in R&D into sales of innovative products. Or if many
enterprises in a country receive a significant government support for R&D and innovation and
yet few of them innovate in new products with a sizeable share of sales, then at least a
reconsideration of the effectiveness of such measure of support is called for. A simple
confrontation of some descriptive statistics drawn from the innovation surveys can thus help in
identifying situations calling for some type of policy evaluation and intervention. Of course, as
policy makers are well aware of, proximate causes may not reveal fundamental causes and
knowing causes is one step, albeit a crucial one, to finding and implementing solutions.
Individual innovation indicators can also be many and not easy to grasp as a whole. To reduce
their number they are often aggregated to construct composite innovation indexes such as the
ones of the European Innovation Scoreboard (EIS) or the Global Summary Innovation Index (see
Sajeva et al., 2005 and Arundel and Hollanders, 2008).13 For instance, the EIS 2006 has included
as an indicator of knowledge creation the percentage of enterprises receiving government support
for innovation, as indicators of entrepreneurship the percentage of SMEs with innovative
activities, the percentage of them cooperating with others and the ratio of innovation
expenditures over total sales, and as indicators of innovation output the percentage of SMEs with
organizational innovation and the share in total turnover of new-to-firm or new-to-market
products. All these variables were sourced from the innovation surveys.
Innovation scoreboards have been used for instance by the directorates of the European Union
Commission to check whether there is an innovation gap between the European Union (EU) and
some other parts of the world, a convergence in innovation between old and new EU member
states, and an improvement in the overall European innovation performance as promoted by the
Lisbon strategy. The Global Summary Innovation Index 2005 showed for instance that the EU
with a composite index value of 0.5 was lagging behind the average innovation performance of
countries like Singapore, Israel, the Republic of Korea, Canada, Japan and the United States.
Comparing that same composite index over time reveals that there has been a process of
convergence in innovation performance since the launching of the Lisbon agenda, with old
13 See also the set of innovation indicators produced by the Deutsche Institut fur Wirtschaftsforschung (DIW, von Hirschhausen and Schmidt-Ehmcke 2009).

13
member states like France and Germany showing a decline in their index and many of the new
member states improving their performance while catching-up. The gap in innovation
performance of the EU could be due to various causes: a lack of innovation activities, failure to
transform innovation inputs into innovation outputs, or simply variations in industrial
composition (because innovation intensities vary across sectors). Further descriptive analysis can
help to assess the relative importance of such explanations.
Aggregating various individual indicators into a global composite innovation indicator, as part of
a scoreboard can be instructive, but it is also highly debatable, especially when used, explicitly or
implicitly, to rank country overall innovation performance. The inclusion or exclusion of
particular innovation indicators and the choices of the specific weights attributed to those
included may be viewed as more or less arbitrary, giving rise sometimes to delicate, and possibly
controversial, arbitrage between different options. Actually the choice of indicators entering the
construction of a composite index is largely dependent on the availability of data. The EIS 2002
was based on 17 indicators, the EIS 2006 on 26 indicators. At each new wave of CIS additional
questions are asked to include new dimensions of innovation (like questions on knowledge
management in CIS3 or marketing innovations in CIS4). Some components might be highly
correlated giving undue weight to certain dimensions, although this can be dealt with using
principal component analysis. The interaction among indicators, precisely the idea behind the
notion of complementarity or optimal policy mix (to which we shall return), is often ignored. It is
even more difficult to aggregate qualitative data unless there is an underlying latent variable
model or a constructed latent variable from a factor or principal component analysis (see
Hollenstein, 1996). Moreover, it is heroic to make international comparisons when the
questionnaires differ in their content, the order of the questions and their formulations, and when
the sampling of respondents differs across countries. In countries with non mandatory surveys,
there may be an endogenous selection of respondents that have a tendency to respond in a certain
way.14
14 For a recent assessment of some of the strengths and weaknesses of the EIS, see Schibany and Streicher (2008).

14
5 Determinants of innovation
The innovation surveys have also been used to identify the determinants of innovation or certain
of its modalities, the effects of innovation, the interrelationships between various innovation
indicators and some dynamic elements of innovation. The exact definition of innovation may
vary across studies. The Oslo Manual (OECD, 2005) distinguishes four types of innovations:
product innovations (new goods or services or significant improvements in existing ones),
process innovations (changes in production or delivery methods), organizational innovations
(changes in business practices, in workplace organizations or in the firm’s external relations) and
marketing innovations (changes in product design, packaging, placement, promotion or pricing).
An innovative firm can be defined as one that had successfully introduced one of these types of
innovations in the period under consideration, but it could also be enlarged to firms that had not
yet introduced the innovation, but had unsuccessfully tried to innovate or were still in the process
of implementing the innovation. Product innovations have moreover been distinguished by their
degree of novelty (new to the firm, region-first, country-first, or world-first). As an alternative,
being innovative could be measured on the input side by the fact of having pursued innovation
activities, such as R&D, acquisition of external knowledge, training for new products and
processes and their introduction on the market.
Some researchers have tried to explain why a firm is innovative or not, i.e. by explaining a
dichotomous measure of innovation (pertaining to a particular type of innovation output or
innovation activity, or to the occurrence of any of them). Others have gone one step further and
investigated the factors that explain the intensity of innovation, i.e. the number of innovations or
the share of total sales due to new products, which could be considered as the weighted sum of
innovations, with weights equal to the share in total sales accounted for by the respective product
or service innovations. In a way, the share of innovative sales amounts to weighing each
innovation by its degree of success in total turnover. The innovation count or weighted sum of
innovations has sometimes been restricted to patented products. A continuous measure of
innovation activities would be the R&D expenditures, or more generally the innovation
expenditures, often expressed in percentages of overall sales.

15
The list of explanatory variables introduced depends to a large extent on the variables that are
included in the innovation surveys because most studies do not have access to other data that
could be merged with the innovation surveys. The number of variables that can be included in
the explanation of the propensity to innovate is very limited. All we know about non-innovators
is their turnover, export and number of employees, in levels and growth rates, the main industry
they belong to, and their potential affiliation to a group (see Table 1). Additional variables are
available to explain the intensity of innovation conditional on innovating, but the correction for
possible selection bias must rely on the few variables available to explain the propensity to
innovate. Nevertheless the innovation survey data have allowed revisiting the Schumpeter
hypotheses of size and monopoly power, the demand pull versus technology push debate, the
influence of foreign ownership, and the importance of R&D efforts to explain innovation in its
various dimensions.15
A common finding is that size explains the propensity to innovate, but does not affect or then
decrease the share in total sales due to new or improved products. In other words, large firms are
more likely to innovate, but their innovation output increases less then proportionately with total
sales. Few countries (France is an exception) include in their questionnaire explicit questions
regarding the demand pull and technology push hypotheses, respectively attributed to
Schmookler and Schumpeter. Generally technological opportunity is captured by industry
dummies. In the absence of direct measures, proxies have been constructed for these two
variables using the objective of increasing or maintaining the market share as a proxy for
demand pull and the importance of universities and government labs as sources of information
for innovation as a proxy for technology push. Both show up with a positive marginal effect but
demand pull is more often significant than technology push (see for example Arvanitis, 2008).
The evidence regarding a Schumpeterian effect associated to monopoly power is mixed. Crépon,
Duguet and Kabla (1996) find no significant advantage due to market power. Blundell et al.
(1999) using innovation count data for the UK (from the SPRU innovation surveys) find that the
dominant firms innovate more, not because they have cash on hand to finance the innovation, but
because they have more to lose than newcomers by not innovating. Indeed, incumbents risk
15 For a collection of studies based on innovation survey data, see Baldwin and Hanel (2003), Kleinknecht and Mohnen (2002) and van Beers et al. (2008).

16
losing their monopoly position by not innovating. The most often reported significant
explanation of innovation output is R&D effort, especially the fact of performing R&D on a
continuous basis. This variable is significant and positive for innovation in almost all studies
(Brouwer and Kleinkecht, 1996); Crépon et al., 1998; Mohnen and Dagenais, 2002; Raymond et
al., 2006).
Although the innovation survey data reveal interesting information on the determinants of
innovation output, our understanding of the innovation process is still far from perfect. Mairesse
and Mohnen (2001, 2002, 2005) and Mohnen, Mairesse and Dagenais (2006) propose an
accounting framework to compare innovation performance across regions, industries or
countries, similar to the growth accounting productivity decomposition. By linearly
approximating the innovation performance function around a reference region, industry or
country, it is possible to attribute cross-sectional differences in innovation performance (be it the
propensity or the intensity) to differences in its determinants. In their cross-sectional study of 7
European countries using the CIS1 data, they find that the unexplained residual, i.e. the measure
of our ignorance in matters of innovation, is larger than the explained part of the share of total
sales due to new products, even more in high-tech than in low-tech sectors.16 Of all the
explanatory variables, the R&D variables explain around 20% of the predicted mean share of
sales due to new products in high-tech industries and 30% in low-tech industries. Therrien and
Mohnen (2003) and Mohnen and Therrien (2003) compare Canada and four European countries.
They also conclude that a great deal of the difference in innovative performance remains
unexplained, and that the relative scores on innovation performance may depend on the indicator
of innovation that is adopted.
The innovation surveys contain qualitative information about whether firms receive government
support for innovation. This information allows the testing of the additionality versus crowding
out hypothesis, i.e. whether government support for innovation leads to more innovation than the
amount of public funding received or whether it actually leads to a substitution of private
funding for public funding. Since the recipients of innovation support are likely to have some
16 The magnitude of the residual in cross-country comparisons may not be unrelated to differences in the voluntary/mandatory nature of the survey, calling for more attention to the sampling issue, as mentioned earlier.

17
characteristics that distinguish them from the other firms, the proper way to estimate the effect of
government support is to treat it as an endogenous variable. It may also be that some firms are
not always recipients of government support during the sample period, which can lead to
downward biased estimates. It is thus also important to account for selectivity. This analysis can
be done either by examining the effect of the presence of government support on innovation, by
modeling at the same time the determinants of government support, or, as it is most often done,
by comparing the difference in innovation performance between matched pairs of supported and
non-supported firms. For this evaluation of government support to lead to sensible results,
enough observations must be available to either identify the determinants of government support
for innovation, or to find good matches among the non-supported firms for all the firms that
receive government support. Most studies conclude that government R&D support leads to
additional private R&D, innovation expenditures or innovation outputs and not to crowding-out
of private R&D by public R&D support (Busom, 2000; Almus and Czarnitzki, 2003; González,
Jaumandreu and Pazó, 2005; Czarnitzki and Licht, 2006; Czarnitzki, Ebersberger and Fier, 2006;
Hall and Maffioli, 2008; Aerts and Schmidt, 2008; Bérubé and Mohnen, 2009).17
Cooperation in R&D or more generally in innovation activities is often pursued by enterprises to
share knowledge, to benefit from complementarities, to reduce risk or to save on costs.
Collaborations with universities are actually promoted by the public authorities and industrial
collaborations are authorized as long as they do not reduce competition in the product market.
Innovation surveys contain information on cooperation with different innovation partners. They
also contain data on the sources of information for innovation that can be interpreted as sources
of knowledge spillovers. In both cases, the cooperation and the sources of spillover links relate to
universities, public laboratories, customers, competitors, and other enterprises within the group.
A large number of studies have examined the determinants of cooperation in general and with
different partners in particular. Size, incoming spillovers and appropriability are some of the
explanatory variables that have been considered. Many authors find that cooperating firms spend
more on R&D (Kaiser, 2002; Tether, 2002; Miotti and Sachwald, 2002; Belderbos et al., 2004a).
17 See Arundel et al. (2008) for a summary and a discussion of the findings regarding government support for innovation from innovation surveys.

18
However, Kleinknecht and Reijnen (1992) report that cooperation is found as much among small
firms as among large firms, and López (2008) reports that size ceases to be significant once it is
treated as endogenous. Both studies emphasize the importance of cost and risk sharing in
determining R&D cooperation. Cassiman and Veugelers (2002) report that incoming spillovers
increase cooperation with universities, but not with suppliers and customers, and that on the
contrary appropriability influences vertical collaboration but not collaboration with non-
industrial partners. These results are confirmed by Leiponen (2002), who concludes that
innovation and R&D cooperation depend on the technological regime: low appropriability
discourages collaboration with suppliers, demand pull increases the probability of collaborating
with customers, supply-dominated firms are less likely to innovate and collaborate, and science-
based regimes are associated with R&D, innovation and collaboration with universities.
Belderbos et al. (2004) conclude that incoming spillovers from universities stimulate any kind of
collaboration probably because of its generic nature, and that spillovers from competitors have
little effect on horizontal collaboration. L’huillery and Pfister (2009) find that the variables
explaining cooperation also explain the risk of cooperation failures.
Some studies have contrasted the importance of knowledge spillovers and formal cooperation
with various partners. Monjon and Waelbroeck (2003) find that incremental innovators benefit
from intra-industry knowledge spillovers and close proximity to universities but that radical
innovators (those who come up with products new to the market) collaborate with universities,
even with foreign universities. Belderbos, Lokshin, Carree (2004) confirm that collaborations
with customers and suppliers focus on incremental innovations whereas collaborations with
universities are instrumental in producing radical innovations. Mohnen and Hoareau (2003),
however, report that radical innovators source knowledge from universities but do not cooperate
with them directly.
When obstacles to innovation are introduced as determinants of innovation, their marginal
effects often turn out to be positive. However, once they are treated as endogenous, their effect
can become negative as one would expect them to be (see Savignac, 2008; Tiwari et al., 2008) as
examples in the case of financial constraints).

19
6 Innovation outcomes
Most of the work on the effects of innovation concern productivity (the level of productivity
rather than its growth rate, due to lack of panel data, and labor productivity rather than total
factor productivity, due to lack of data on capital and other inputs). The other effects investigated
are on exports, profits, and employment.
Crépon, Duguet and Mairesse (1998) (CDM) proposed a model composed of three equations: an
equation explaining the amount of R&D, an innovation output equation, where R&D appears as
an input, and a productivity equation, in which innovation output appears as an explanatory
variable.18 This model corrects for the endogeneity of R&D and innovation output as well as for
the selectivity of R&D performing or innovating firms. It has been estimated with a common
specification on various country data to compare their respective R&D and innovation
performance in terms of productivity. Some examples are Janz et al. (2004) for Germany and
Sweden, Lööf and Heshmati (2006) for the Scandinavian countries (Norway, Sweden and
Finland), Griffith et al. (2006) for France, Germany, Spain and the UK, and Raffo et al. (2008)
for Latin-American and European countries. A larger project coordinated by the OECD extends
the cross-country comparison to 18 OECD countries (OECD 2009). It has also been estimated
for developing or transition countries (Chudnovsky et al., 2006, for Argentina, Benavente, 2006,
for Chile, and Masso and Vather, 2008, for Estonia).
Within this framework the R&D-productivity relationship, in other words the estimation of the
rate of return on R&D, has been revisited using the information on the outputs and the modalities
of innovation contained in the innovation surveys. Indeed the data contained in the innovation
surveys make it possible to estimate a more structural and more informative model explaining
the link between R&D and productivity than the simple extended Cobb-Douglas production
function that includes R&D inputs. As Mairesse et al. (2005) report using French data, the results
on the magnitude of the rates of return to R&D found in the early studies of the 80s and 90s are
confirmed by the CDM model, as long as proper account is taken of selectivity and endogeneity
in R&D and innovation output. The estimates are also robust to various measures of product
18 The original CDM paper by Crépon et al (1998), estimated on French data, had two alternative measures of innovation output: the number of patents and categorical data on the share of innovative sales.

20
innovation, in particular qualitative and quantitative measures, and new-to-firm versus new-to-
market product, process and patent-protected innovations. The analysis reveals, however, that the
innovation output statistics are much noisier than R&D statistics (probably because they are
subjective measures) and need to be instrumented to correct for errors in variables. The
endogeneity of innovation outputs in the production function are due to errors of measurement
rather than to simultaneity.
The CDM framework has been extended in various directions: the use of profitability rather than
productivity as the measure of economic performance (Jefferson et al., 2006; Lööf and Heshmati,
2006), the use of innovation expenditures rather than the more restricted R&D expenditures
(Lööf and Heshmati, 2006; Janz et al., 2004), the inclusion of a demand shifting effect of
innovation output (van Leeuwen and Klomp, 2006), the distinction between new-to-firm versus
new-to-market innovations (Duguet, 2006), the distinction between different types of innovation
outputs (Griffith et al., 2006; Parisi et al., 2006; Roper et al., 2008; Polder et al., 2009), the use of
other determinants than R&D as innovation inputs (ICT in Polder et al., 2009, and physical
capital investment for process innovation in Parisi et al., 2006, and Hall et al., 2009), and a
feedback effect from productivity to innovation (Klomp and van Leeuwen, 2001).
Duguet (2006) finds that only radical innovations contribute to total factor productivity growth.
On the importance of product versus process innovations, results vary across countries. Both are
significant in France, as reported in Mairesse et al. (2005). Actually Mairesse et al. (2005) find
that process innovations yield higher returns than product innovations. Indeed, we expect process
innovation to affect directly the average cost of production, whereas product innovations can
displace existing products and therefore have mixed effects on total sales and take more time to
show up in the productivity statistics. Moreover, product innovations may contain quality
improvements that are improperly included in the measurement of output. But this is not always
the case in other countries as reported in the international comparison study by Griffith et al.
(2006): process innovation is insignificant in Spain, Germany and the UK, whereas product
innovation has a positive significant effect in all countries but Germany. Roper et al. (2008) for
Ireland find no significant effect of both types of innovation on productivity when using the
binary specification and even a significant negative effect for product innovation when using the

21
continuous measure of innovation success. Parisi et al. (2006) for Italy find a positive effect for
process innovation but not for product innovation. With respect to the role of ICT, Crespi et al.
(2007) for the UK find a positive effect on firm performance of the interaction between IT and
organizational innovation, but not for them individually. Polder et al. (2009) for the Netherlands,
find that ICT affects productivity indirectly via innovation in services, but not in manufacturing,
and that product and process innovations affect productivity only if accompanied by
organizational innovation, in both services and manufacturing.
Harrison et al. (2008) relate innovation output to productivity growth and then decompose the
employment growth into the fraction due to the growth in old products, the sales due to new
products and the effects due to process innovation in Germany, France, Spain and the UK. They
report that process innovation displaces employment in manufacturing but less in services, but
that in any case the compensation effect dominates, and that product innovations are also job-
creating. Hall et al. (2008) apply the same model to Italian firms and find similar results.
Two other variables that are mutually correlated with innovation are patents and exports. Duguet
and Lelarge (2006) conclude that the value of patent rights increases the incentives to innovate in
products, but not in processes, and that the value of product (not process) innovations increases
the incentives to patent. Brouwer and Kleinknecht (1999) find that R&D collaborators are more
likely to patent. Van Ophem et al. (2002) find that patents Granger cause R&D and not the
opposite. Regarding exports and innovation, Sterlacchini (1999) concludes that innovation
affects export performance, whereas Kleinknecht and Oostendorp (2002) obtain causal links in
both directions. Lachenmaier and Woessmann (2006) find that innovation causes exports. The
interrelationship between innovation and exports is particularly important in developing
countries (see de Negri et al. 2006)).
7 Complementarities and dynamics
Innovators often appear to adopt a number of strategies simultaneously: they perform R&D,
purchase technologies, innovate in products, innovate in processes, patent, collaborate, and so
on. This coexistence of various innovation strategies suggests the presence of various
complementarities in the sense of Edgeworth: “doing more of one thing increases the return of
22
doing another thing”. In other words, there is complementarity between innovation strategies
when two strategies tend to be adopted together because their joint adoption leads to a higher
performance than the sum of the performances from their individual adoptions.
Many studies have tested the existence of complementarity between different innovation
strategies using the data from the innovation surveys. Firms tend to innovate in both products
and processes (Cabagnols and Le Bas, 2002; Martínez-Ros and Labeaga, 2002; Miravete and
Pernías, 2006), although this complementarity may be specific to certain sectors of the economy.
For instance, Polder et al. (2009) conclude for the Netherlands complementarity between product
and process innovations in manufacturing, between process and organizational innovation in
services, and between product and organizational innovations in both sectors. Firms tend to
produce their own knowledge while also acquiring knowledge from outside the enterprise, be it
only to build up their own capacity to be able to absorb outside knowledge (Veugelers, 1997;
Cassiman and Veugelers, 2006; Lokshin, Belderbos, and Carree, 2008). They tend to cooperate
with different partners simultaneously (Belderbos, Carree, Lokshin, 2006), although that depends
on the pair of partners and the size of the firm. Leiponen (2005) finds that technical skills are
complementary with R&D cooperation, product and process innovation.
Innovation surveys have also been used to examine whether there is complementarity between
innovation policies. The perceived obstacles to innovation can be regarded as mirror images of
failures in innovation policy. If an obstacle is perceived to be high by a respondent, it means that
somewhere there is a deficiency in innovation policy. An analysis of complementarity of the
obstacles shows whether one or more policies should be adopted simultaneously to improve
innovation. In other words, should there be a policy mix or not? If two obstacles are
complements, they reinforce each other. Removing one will attenuate the other one. There might
be less of a reason to remove both at the same time. If two obstacles are substitutes, however, the
presence of one obstacle relieves the pressure from the other one. In that case removing one
obstacle will exacerbate the other one. Both should be removed jointly. The results from Mohnen
and Röller (2005) suggest that governments should adopt a mix of policies to foster innovation,
for instance by easing access to finance, allowing firms to cooperate with other firms and
technological institutions, increasing the amount of skilled personnel and reducing the regulatory

23
burden. Complementarity between obstacles to innovation has also been investigated for Canada
(Mohnen and Rosa, 2002) and for France (Galia and Legros, 2004).
In the analysis of innovative behavior and complementarity, it is often important to account, if
possible, for unobserved heterogeneity. Using the DIRNOVA panel data stretching from 1988 to
1992, Miravete and Pernías (2006) have found that not accounting for unobserved heterogeneity
can lead to the false conclusion of complementarity between product and process innovations,
because the joint occurrence of the two types of innovation might actually be attributable to
unobserved individual heterogeneity. Most of the empirical work using innovation surveys has
exploited cross-sectional data. As data from a few successive waves of the innovation surveys
become available in many countries, with a sufficient amount of overlap of sampling across
successive waves, it is possible to control for individual effects and to estimate dynamic
relationships based on panel data and in this way to address research questions such as the time
lag between innovation and its effects on productivity, the persistence of innovation, and the
direction of causality between innovation and other economic or innovation indicators.
One hypothesis that has recently been tested in a number of studies is that of the persistence of
innovation. Does success breed success? Lagged innovation is introduced as an explanatory
variable to test whether firms tend to innovate conditional on past innovation. A couple of
studies based on patent data have concluded that there is no persistence in patenting (Geroski,
van Reenen and Walters, 1997; Malerba and Orsenigo, 1999). Cefis (2003) finds that persistence
in innovation is characteristic of major innovators. Parisi et al. (2006) find persistence for
product innovation but not for process innovation. Obviously this question is difficult to analyze,
given the possibility of left out heterogeneity. The following two studies control for individual
heterogeneity that is correlated with the mean values of the regressors and the initial conditions
so as to identify a true and not just a spurious persistence. Peters (2009) finds persistence in
innovation activities, i.e. on the input side. Raymond et al. (2010) find persistence in innovation
output, both in the appearance of new products and/or processes and the actual share in total
sales due to new products, but only in enterprises that belong to the high-tech industries.19
19 Identifying state dependence (past innovation increases current innovation) separately from heterogeneity (some firms are simply more innovative than others) is a complex econometric problem, one that has been studied

24
Little work has been done more generally on the dynamics of innovation in the sense of
capturing the time lags of the effects of innovation on economic performance. One example is
due to Huergo and Jaumandreu (2004), who estimated that process innovation has a positive
impact on productivity that persists for about three years, using semi-parametric methods and
data on Spanish firms.
8 How to make progress?
We end this short review of the innovation surveys with a focus on their use in econometric
analyses by making suggestions to improve their quality and relevance and hence their specific
usefulness. We stress some recommendations concerning the design and implementation of the
innovation surveys that could be useful for the major purpose of providing good information in
the form of descriptive statistics, indicators and scoreboards and for better econometric analyses.
Above all we advocate an active and continuous collaboration of the economists in universities
and other organizations use the innovation survey data for econometric studies, with the
statisticians that are mainly in charge of the realization of the innovation surveys, their basic
exploitation, and the first reports on descriptive statistics, indicators and scoreboards. There is in
fact no absolute or clear-cut separation, but a range of interrelations, which could be stronger and
tighter, between different types of exploratory data analyses, descriptive statistical analyses and
econometric investigations. A pro-active, broader and more stable collaboration than currently,
both on the part of the economists and on the part of the statisticians would be a major factor of
progress of the quality and usefulness of innovation surveys.
Harmonize strictly across countries and across waves a core of basic questions in the
innovation surveys:
Although there will certainly be country specific issues worth investigating and for which data
needs to be collected (e.g. regional aspects of innovation or the importance of FDI in developing
countries), it is strongly advisable for the purpose of cross-country comparability to have a core
thoroughly in the literature on unemployment. See Heckman and Singer (1984a, 1984b) for a thorough discussion of this topic.
25
of basic questions asked, in the same way, with the same definitions, and in the same order in
different countries. This core of basic questions should also remain unchanged across waves so
that evolutions over time could be assessed and analyzed. More specifically, we recommend the
questionnaire to be split into three parts: a) the core permanent part, which might be relatively
short but should be as strictly stable over time and identical across countries as possible; b) a part
carefully harmonized across countries but possibly varying from one survey to another to
analyze specific or new aspects; c) an optional part in response to country special interests (such
as in the case of developing countries).
As much as possible the sampling procedure should be identical across countries. If this is not
possible, information about the sampling should be provided in order to correct for possible
biases when comparing performances across countries. It will also be useful to conduct
experiments about the sensitivity of the survey responses to the wording of questions and the
order in which they are asked, as well as to the functional role of the respondents within an
enterprise. All these features can indeed influence significantly the responses to some
questions.20 More generally, it is possible and will be worthwhile to look rigorously into such
issues by distributing questionnaires with questions presented with slightly different formulations
and in a different order to randomly chosen firms.
Ease access to innovation data:
Access to the innovation survey data, as with access to other individual firm data, can be
problematic for researchers who do not work for a ministry or the official statistical institute
custodian of the data. At stake is the dilemma between the confidentiality of the firm individual
information disclosed in the survey, which statistical offices are required to guarantee by law,
and a broader use of these data for general purposes and econometric analyses by economists in
particular. Improvements have been made by granting secure remote access to the raw data or by
providing micro-aggregated or otherwise noise-contaminated data that hide the firms’ identity.
20 For a discussion about the international comparability and the differences in the implementation of innovation surveys (regarding content of the questionnaire, target population, sampling techniques, response rates, sectoral coverage, mandatory versus voluntary nature of the survey, institute responsible for the survey), see Archibugi et al. (1994), Therrien and Mohnen (2003) and UNU-INTECH (2004).

26
These methods should be generalized to allow researchers to access data from various countries
and do international comparisons. Achieving this goal would require several international
statistical agencies to cooperate with each other on providing access. It might be also possible to
extend a system currently used in France, which allows selected researchers in academic
institutions to have access to the individual information in the surveys for a specific research
project, a limited time and with strict confidentiality obligations. The point could also be made
that the information in the innovation surveys stricto sensu is mostly qualitative and in fact not
very confidential, and thus could simply be made public after some years (e.g. four years after
the year of the surveys).
Merge innovation survey data with other data:
In order to explain the choice of innovating or not, or to correct for potential selectivity in
explaining the intensity of innovation, little can be done with the innovation survey data alone,
because few variables are usually collected for all firms (including non-innovators) in the
innovation surveys. One solution would be to collect more data about non-innovators in the
surveys themselves. Another one would be to merge the innovation survey data with census data,
accounting data, or data from other surveys. This will of course help not only in improving the
treatment of potential selectivity, but will also offer a larger choice of instruments to correct for
endogeneity and measurement errors; and more generally it will provide more explanatory
variables to consider in the models and thus contribute to their relevance and explanatory power.
Create longitudinal datasets:
If a panel of firms could be constructed that was followed over at least a few years, it would be
possible to study the dynamics of innovation, i.e., the time lags in the determinants and the
effects of innovation, and to correct for firm-specific effects, i.e., individual unobserved
heterogeneity. As we pointed out it is hard to infer strong conclusions regarding causality using
only cross-sectional data. As we have also noted in the case of complementarity, accounting for
individual heterogeneity may reverse the conclusions of some analyses. Having a panel should
also help in addressing the difficulties arising from the fact that firms over time enter and exit,

27
and can radically change shape over time by mergers, acquisitions and rationalizations. As we
have stressed, however, analyzing a panel built on the basis of innovations surveys that are
performed every four or even two years raises specific problems.
Collect data on groups and especially on multinationals:
It may be argued that innovation possibilities, constraints and objectives are determined at the
group level. If this is so, then the group should be the appropriate level of analysis. In particular,
a great part of R&D and innovation activities are performed in groups of multinational firms, but
innovation surveys only record data from activities executed and performances achieved
domestically. If R&D and innovation are planned on a global scale, which is more and more the
case for multinational firms, limiting the analysis to domestic data is likely to influence the
results and conclusions. A concerted effort by statistical agencies should be made to collect data
from subsidiaries of multinationals in different countries.
Adapt surveys for developing countries
For the purpose of international comparisons of innovation it is necessary to have harmonized
surveys. If, however, we want to go deeper in understanding and encouraging innovation in
developing countries, there are good reasons to put more weight on questions that address
innovation issues that concern them more specifically. Capacity building, informal sectors,
incremental innovations, acquisition of technologies, technology diffusion are more central
dimensions of innovation for these countries than first-to-market product innovations or the use
of intellectual property rights.
Organize a close collaboration between statisticians and economists
The elaboration and appropriate implementation of all the above recommendations will greatly
benefit from an active and organized collaboration between official between economists working
on research and innovation issues and statisticians responsible of the innovation surveys. Such
collaborations tend to exist in all the countries, but often in a rather limited and occasional way

28
in the form of participation in committees of users before the final decisions on the contents and
the launching of the surveys. The collaboration should be much stronger and stable to be really
productive. Based on some country’s experience of having different organizations execute the
innovation surveys and exploit their first statistical results, one could even think of collaboration
in the framework of shared responsibilities. Following the distinction of three different groups of
questions in innovation surveys (as suggested in our first recommendation above), statistical
offices and professional statisticians would be in charge of the core component of the innovation
surveys, which should be mandatory in all countries; they could also be responsible for the
country harmonized component, or could decide to entrust research institutes with this task on a
long term basis. The third optional (and usually changing) component that responds to a
country’s specific interest might be delegated to a research group, or the professional or private
organization best capable of realizing it well. Such an organization should be more efficient
overall, alleviating some of the various costs involved in doing and making use of the innovation
surveys, while contributing to increase their overall usefulness. By lessening the distance and
differences between the statisticians and civil servants, whose first task is to perform the surveys
and inform innovation policy, and researchers (mostly academic), whose interest is more focused
in understanding innovation, the collaboration and sharing of responsibilities ensures that the
needs of both will be considered and good decisions will be taken if compromises cannot be
avoided. This might also help learning from experience and prevent mistakes, such as changing
the formulation of questions without real evidence that they will be improved, or suppressing
valuable questions to make space for more fashionable ones.
9 Conclusion
Since their relatively recent take off and expansion, the innovation surveys are certainly among
the surveys which have been most utilized by economists and other analysts besides the official
statisticians in charge of them. At present the United States is one of the few developed and mid-
level developing countries which do not conduct a regular innovation survey that follows the
general guidelines of the Oslo Manual. It is to be hoped that they will decide to join the other
countries in doing so in the near future.21
21 The United States is not only the first country in many fields of economic research, it is also a good example of a country where academic economists care really about good statistics and are willing to work, and indeed work

29
Statisticians and economists have already learned much from the innovation survey information.
They have learned about facts on the basis of indicators, cross tabulations and other descriptive
statistics as concerns the occurrence and intensity of innovation, the reasons why firms innovate,
the obstacles in the process of innovating, the sources of information for innovation, the
cooperation in innovation, the importance of intellectual property rights. They have made
progress in assessing, interpreting and understanding such factual evidence on the basis of
econometric studies of firm behavior with respect to its many facets: the effects of innovation on
productivity and other outcomes, its various determinants whether demand, technology or
competition driven, whether its contextual factors are favorable or not, and so forth.
Certainly much more progress should be achieved in terms of relevance and quality of analyses,
but hopefully further promising developments are ahead. As longitudinal data on innovation
becomes available, it will be possible to better control for unobserved heterogeneity. With more
encompassing surveys and possibly larger samples, it will become safer to estimate models
separately for different industries as well as for small, medium and large firms. Innovation can
have a different meaning in firms of different size and it can take a different shape in low-tech
and high-tech industries, or in the natural resources, the manufacturing and the services sectors.
By coordinating as much as possible the contents of the questionnaire, not just within the
European Union but also in other OECD and non-OECD countries, it becomes possible to
compare to some extent the innovation performances in different parts of the world.
Most variables in the innovation surveys at a particular date are codetermined and jointly
influenced by other variables. Few studies, apart from those that adopt the CDM framework, take
the mutual dependence and the dependence on third factors explicitly into account. This is partly
because of the lack of long time series and partly because of the lack of other variables than
those collected in the innovation surveys. As more waves of innovation surveys become
available and as the innovation survey data can be merged with other firm datasets, it will
closely, with official statisticians who are themselves looking for their advices and ready to take their specific needs seriously. One could thus expect from a decision of the United States to launch regular innovation surveys (for example in association with the annual R&D surveys) that it will be a strong boost for the innovation surveys, leading to more rapid improvements to their design and statistical utilization, as well as to the overall quality of the econometric studies taking advantage of them.

30
become easier to build structural dynamic models of innovation, to find exogenous variables that
allow to better handle the severe errors in variables problems and better address other
endogeneity issues, and assess the direction of causalities.
Innovation surveys were not conceived to evaluate and guide innovation policy but mainly to
inform such policy by measuring and benchmarking innovation performance across countries. In
the future innovation surveys could possibly be adapted to allow for some form of policy
evaluations. One should, of course, be well aware that the gap will remain wide between even
more improved innovation survey data and analyses and the needs of policy and policy makers.

31
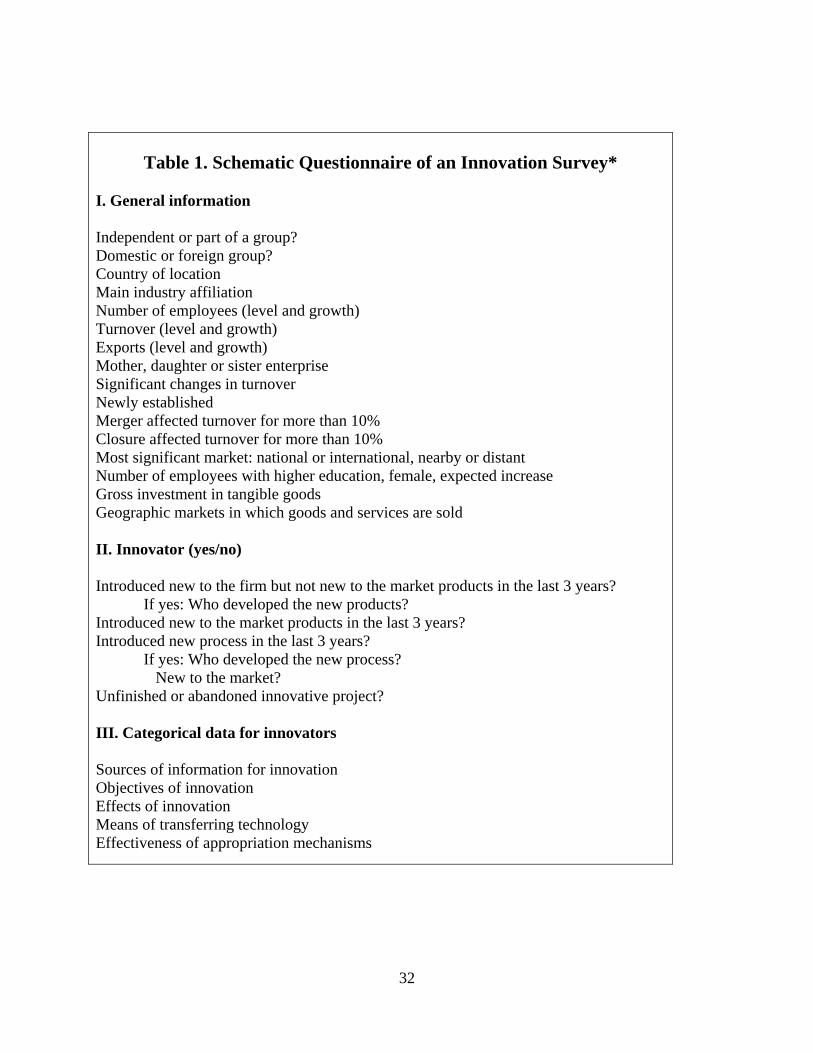
32
Table 1. Schematic Questionnaire of an Innovation Survey*
I. General information Independent or part of a group? Domestic or foreign group? Country of location Main industry affiliation Number of employees (level and growth) Turnover (level and growth) Exports (level and growth) Mother, daughter or sister enterprise Significant changes in turnover Newly established Merger affected turnover for more than 10% Closure affected turnover for more than 10% Most significant market: national or international, nearby or distant Number of employees with higher education, female, expected increase Gross investment in tangible goods Geographic markets in which goods and services are sold II. Innovator (yes/no) Introduced new to the firm but not new to the market products in the last 3 years?
If yes: Who developed the new products? Introduced new to the market products in the last 3 years? Introduced new process in the last 3 years?
If yes: Who developed the new process? New to the market?
Unfinished or abandoned innovative project? III. Categorical data for innovators Sources of information for innovation Objectives of innovation Effects of innovation Means of transferring technology Effectiveness of appropriation mechanisms

33
Table 1 (continued) IV. Dichotomous data for innovators R&D R&D continuously R&D cooperation with partners Most valuable cooperation partner Government support for innovation from various sources Applied for a patent? V. Continuous data for innovators R&D expenditures (intra- & extramural) R&D personnel Innovation expenditures (+ sub-items) Estimated share of products in different phases of life-cycle Share in total sales of products new to the enterprise but not new to the market Share in total sales of products new to the market VI. Data on all firms (innovators or not) Factors hampering innovations Possession of valid patents if yes: the number of valid patents The share of patent protected sales Strategic and organizational changes Use of various IP protection methods? Introduction of organizational innovations Importance of organizational innovations Introduction of marketing innovations Importance of marketing innovations Introduction of any innovation with environmental benefits Determinants of environmental innovations Procedures in place to identify and reduce environmental impacts ----------------------------------------------------------------------------------------------------------- *List of questions based on the Oslo Manual guidelines, as implemented in the series of Community Innovation surveys (CIS).

34
References Aerts, K. and T. Schmidt (2008), “Two for the Price of One? On Additionality Effects of R&D Subsidies: A Comparison between Flanders and Germany”, Research Policy, 37(5), 806-822.
Almus, M. and D. Czarnitzki (2003), “The Effects of Public R&D on Firm’s Innovation Activities: The Case of Eastern Germany”, Journal of Business and Economic Statistics, 12(2), 226-236.
Anderson, F. (2003), “The Flow of Innovative Products from Manufacturing Industries to Construction Industries,” in Understanding Innovation in Canadian Industry, F. Gault (ed.), School of Policy Studies, McGill-Queen’s University Press, 367-384.
Archibugi, D., P. Cohendet, A. Kristensen, and K.-A. Schäffer (1994) Evaluation of the Community Innovation Survey (CIS) Phase I. EIMS publication no. 11, IKE Group, Department of Business Studies, Aalborg, Denmark.
Arora, A., M. Ceccagnoli M.and W.M. Cohen (2003), “R&D and the Patent Premium,” NBER working paper 9431, National Bureau of Economic Research, Cambridge, Mass.
Arundel, A. and C. Bordoy (2005), “The 4th Community Innovation Survey: Final Questionnaire, Supporting Documentation, and the State of the Art for the Design of the CIS”, Final Report to Eurostat for the project “Preparation of the Fourth Community Innovation Survey”.
Arundel, A., C. Bordoy., P. Mohnen and K. Smith (2008), “Innovation Surveys and Policy: Lessons from the CIS”, in Innovation Policy in Europe: Measurement and Strategy (C. Nauwelaers and R. Wintjes, eds.), Edward Elgar, 3-28.
Arundel, A. and H. Hollanders (2008), “Innovation Scoreboards: Indicators and Policy Use”, in Innovation Policy in Europe: Measurement and Strategy (C. Nauwelaers and R. Wintjes, eds.), Edward Elgar, 29-52.
Arvanitis, S. (2008), “Explaining Innovative Activity in Service Industries: Micro Data Evidence for Switzerland”, Economics of Innovation and New Technologies, 17(3), 209-225.
Aschhoff, B., T. Doherr, C. Köhler, B. Peters, C. Rammer, T. Schubert and F. Schwiebacher (2009), Innovationsverhalten der deutschen Wirtschaft. Indikatorenbericht zur Innovationserhebung von 2008, ZEW, Mannheim.
Baldwin, J. R. and P. Hanel (2003), Innovation and Knowledge Creation in an Open Economy. Cambridge University Press, Cambridge.
Belderbos, R., M. Carree, B. Diederen, B. Lokshin and R. Veugelers (2004a), “Heterogeneity in R&D Cooperation Strategies”, International Journal of Industrial Organization, 22, 1237-1263.
Belderbos, R., M. Carree and B. Lokshin (2004b), “Cooperative R&D and Firm Performance”, Research Policy, 33(10): 1477-92.
Belderbos, R., M. Carree and B. Lokshin (2006), “Complementarities in R&D Cooperation Strategies”, Review of Industrial Organization, 28, 401-426.
Benavente, J. M. (2006), “The Role of Research and Innovation in Promoting Productivity in Chile”, Economics of Innovation and New Technology, 15(4-5), 301-315.

35
Bérubé, C. and P. Mohnen (2009), “Are Firms that Received R&D Subsidies More Innovative?”, Canadian Journal of Economics, 42(1), 206-225.
Blundell, R., R. Griffith and J. van Reenen (1995), “Market Share, Market Value and Innovation in a Panel of British Manufacturing Firms”, Review of Economic Studies, 66, 529-554.
Bogliacino, F., G. Perani, M. Pianta and S. Supino (2009), “Innovation in Developing Countries. The Evidence from Innovation Surveys”, paper prepared for the FIRB conference Research and Entrepreneurship in the Knowledge-based Economy, Milano: Universita L. Bocconi.
Brouwer, E. and A. Kleinknecht (1996), “Determinants of Innovation: A Micro Econometric Analysis of Three Alternative Innovative Output Indicators”, in Determinants of Innovation, the Message from New Indicators, A.H. Kleinknecht (ed.), Macmillan Press, London, 99-124.
Brouwer, E. and A. Kleinknecht (1999), “Innovative Output, and a Firm’s Propensity to Patent. An Exploration of CIS Micro Data”, Research Policy, 28, 615-624.
Busom, I. (2000), “An Empirical Evaluation of the Effects of R&D Subsidies”, Economics of Innovation and New Technology, 9(2), 111-148.
Cabagnols, A. and C. Le Bas (2002), “Differences in the Determinants of Product and Process Innovations: The French Case”, in Innovation and Firm Performance. Econometric Explorations of Survey Data (A. Kleinknecht and P. Mohnen, eds.). Palgrave, Hampshire and New York, 112-149.
Carter, C.F, and B.R. Williams (1958), Investment in Innovation. London: Oxford University Press.
Cassiman, B. and R. Veugelers (2002), “R&D Cooperation and Spillovers: Some Empirical Evidence from Belgium”, American Economic Review, 92(4), 1169-1184.
Cassiman, B. and R. Veugelers (2006), “In Search of Complementarity in Innovation Strategy: Internal R&D and External Knowledge Acquisition”, Management Science, 52(1), 68-82).
Cefis, E. (2003), “Is There Any Persistence in Innovative Activities?”, International Journal of Industrial Organization, 21(4), 489-515.
Cespri, G. and F. Peirano (2007), “Measuring Innovation in Latin America: What We did, Where We are and What We Want to Do”, Paper prepared for the MEIDE conference, Maastricht.
Chudnovsky, D., A. López, G. Pupato (2006), “Innovation and Productivity in Developing Countries: A Study of Argentine Manufacturing Firms Behavior (1992-2001)”, Research Policy, 35, 266-288.
Cohen, W.M. (1995), "Empirical Studies of Innovative Activity," in Handbook of the Economics of Innovation and Technical Change, P. Stoneman (ed.), Basil Blackwell, Oxford.
Crépon, B., E. Duguet and I. Kabla (1996), “Schumpeterian Conjectures: A Moderate Support from Various Innovation Measures”, in Determinants of Innovation. The Message from New Indicators, A. Kleinknecht (ed.). Macmillan Press, London, 63-98.
Crépon, B., E. Duguet and J. Mairesse (1998), “”Research, Innovation and Productivity: An Econometric Analysis at the Firm Level”, Economics of Innovation and New Technology, 7, 115-158.

36
Crespi, G., C. Criscuolo, and J. Haskel (2007), ‘Information Technology, Organisational Change and Productivity Growth: Evidence from UK Firms’, CEPR Discussion Paper no. 783.
Czarnitzki, D., B. Ebersberger and A. Fier (2006), “The Relationship Between R&D Collaboration, Subsidies and Patenting Activity: Empirical Evidence from Finland and Germany”, Journal of Applied Econometrics, 22 (7), 1347-1366.
Czarnitzki, D. and G. Licht (2006), “Additionality of Public R&D Grants in a Transition Economy: The case of Eastern Germany”, Economics of Transition, 14(1), 101-131.
Debresson, C. et al. (1996), Economic Interdependence and Innovative Activity. Edward Elgar, Cheltenham U.K.
De Negri, J., F. De Negri and F.Freitas (2006), "Does Technological Innovation leads to Export in Brazil and Argentina?", IPEA Mimeo.
Diederen, P., H. van Meijl and A. Wolters (2002), “Innovation and Farm performance: The Case of Dutch Agriculture”, in Kleinknecht, A. and P. Mohnen (eds.), op. cit.
Duguet, E. (2006), “Innovation Height, Spillovers and TFP Growth at the Firm Level: Evidence from French Manufacturing”, Economics of Innovation and New Technology, 15(4-5), pp. 415-442.
Duguet, E. and C. Lelarge (2006), “Does Patenting Increase the Private Incentives to Innovate? A Microeconometric Analysis”, CREST working paper 2006-09.
Galia, F. and D. Legros (2004), “Complementarities Between Obstacles to Innovation: Evidence from France”, Research Policy, 33, 1185-1199.
Geroski, P., J. Van Reenen and C. Walters (1997), “How Persistently Do Firms Innovate?“, Research Policy, 26, 33-48.
Godin, B. (2002), “The Rise of Innovation Survey: Measuring a Fuzzy Concept”, Canadian Science and Innovation Indicators Consortium, Project on the History and Sociology of S&T Statistics, Paper No. 16 (http://www.csiic.ca/PDF/Godin_16.pdf)
González, X., J. Jaumandreu and C. Pazó (2005), “Barriers to Innovation and Subsidy Effectiveness”, Rand Journal of Economics, 36(4), 930-950.
Griffith, R., E. Huergo, J. Mairesse and B. Peters (2006), “Innovation and Productivity Across Four European countries”, Oxford Review of Economic Policy, 22(4), 483-498.
Hall, B. H. and J. Mairesse (2006) "Empirical Studies of Innovation in the Knowledge Driven Economy", Introduction to a special issue of Economics of Innovation and New Technology, eds. B. Hall and J. Mairesse, 15(4/5), 289-299.
Hall, B. H., F. Lotti and J. Mairesse (2008), “Employment, Innovation and Productivity: Evidence from Italian Micro Data”, Industrial and Corporate Change, 17 (4), 813-839.
Hall, B. H., F. Lotti and J. Mairesse (2009), “Innovation and Productivity in SMEs: Empirical Evidence for Italy”, Small Business Economics, 33, 13-33.
Hall, B. H. and A. Maffioli (2008), “Evaluating the Impact of Technology Development Funds in Emerging Economies: Evidence from Latin America”, European Journal of Development Research, 20(2), 172-198.

37
Harrison, R., J. Jaumandreu, J. Mairesse and B. Peters (2008), “Does Innovation Stimulate Employment? A Firm Level Analysis Using Comparable Micro Data from Four European Countries”, NBER working paper 14206.
Heckman, J. and B. Singer (1984a), “The Identifiability of the Proportional Hazard Model,” Review of Economic Studies, 51(2), 231-241.
Heckman, J. and B. Singer (1984b), “Econometric duration analysis,” Journal of Econometrics, 24(1-2), 63-132.
Hollenstein, H. (1996), "A Composite Indicator of a Firm's Innovativeness. An Empirical Analysis Based on Survey Data for Swiss Manufacturing", Research Policy, 25, 633-645.
Huergo, E. and J. Jaumandreu (2004), “Firms’ Age, Process Innovation and Productivity Growth”, International Journal of Industrial Organization, 22(4), 541-560.
Janz, N., H. Lööf, and B. Peters (2004), “Firm level Innovation and Productivity – Is There a Common Story across Countries”, Problems and Perspectives in Management, 2, 184-204.
Jaramillo, H., G. Lugones and M. Salazar (2001), Standardization of Indicators of Technological Innovation in Latin American and Carribean Countries. Bogotá Manual, RICYT/OAS/CYTED/COLCIENCIAS/OCYT.
Jefferson, G., B. Huamao, G. Xioajing and Y. Xiaoyun (2006), “R&D Performance in Chinese Industry”, Economics of Innovation and New Technologies, 15(4/5), 345-366.
Kaiser, U. (2002), “An Empirical Test of Models Explaining Research Expenditures and Research Cooperation: Evidence from the German Service Sector”, International Journal of Industrial Organisation, 20, 747-774.
Kleinknecht, A. and P. Mohnen (2002), Innovation and Firm Performance. Econometric Explorations of Survey Data. Palgrave, New York.
Kleinknecht, A. and R. Oostendorp (2002), “R&D and Export Performance”, in Innovation and Firm Performance. Econometric Explorations of Survey Data, Kleinknecht A. and P. Mohnen, (eds.). Palgrave, New York.
Klomp, L. and G. van Leeuwen (2001), “Linking Innovation and Firm Performance: A New Approach”, International Journal of the Economics of Business, 8(3), 343-364.
Lachenmaier S. and L. Wößmann (2006), "Does Innovation Cause Exports? Evidence from Exogenous Innovation Impulses and Obstacles Using German Micro Data," Oxford Economic Papers, 58(2), 317-35.
Leiponen, A. (2002), “Why Do Firms Not Collaborate? The Role of Competencies and Technological Regimes”, in Innovation and Firm Performance. Econometric Explorations of Survey Data, Kleinknecht A. and P. Mohnen, (eds.). Palgrave, New York.
Leiponen, A. (2005), “Skills and Innovation”, International Journal of Industrial Organization, 23 (5-6), 303-323.
L’huillery, S. and E. Pfister (2009), “R&D Cooperation and Failures in Innovation Projects: Empirical Evidence from French CIS data”, Research Policy, 38, 45-57.

38
Lokshin, B., R. Belderbos and M. Carree (2008), “The Productivity Effects of Internal and External R&D: Evidence from a Dynamic Panel Data Model”, Oxford Bulletin of Economics and Statistics, 70(3): 399-413.
Lööf, H., A. Heshmati, R. Apslund and S.O. Nås (2003), “Innovation and Performance in Manufacturing Firms: A Comparison of the Nordic Countries”, International Journal of Management Research, 2, 5-36.
Lööf, H. and A. Heshmati (2006), “On the Relationship between Innovation and Performance: A Sensitivity Analysis”, Economics of Innovation and New Technology, 15(4/5), 317-344.
López, A. (2008), “Determinants of R&D cooperation: Evidence from Spanish Manufacturing Firms”, International Journal of Industrial Organization, 26, 113-136.
Mairesse, J. and P. Mohnen (2001), “To Be or Not to Be Innovative: An Exercise in Measurement”, Science-Technology Industry Review, Paris, OCDE, 27, 103-127.
Mairesse, J. and P. Mohnen (2002), “Accounting for Innovation and Measuring Innovativeness : An Illustrative Framework and an Application”, American Economic Review, Papers and Proceedings, 92(2), 226-230.
Mairesse, J. and P. Mohnen (2004), “Intellectual Property in Services: What Do We Learn from Innovation Surveys?”, in Patents, Innovation, and Economic Performance, OECD Conference Proceedings, OECD, Paris, 227-245.
Mairesse, J. and P. Mohnen (2005), “The Importance of R&D for Innovation: A Reassessment Using French survey data”, Journal of Technology Transfer, 30(1-2), 183-197.
Mairesse, J., P. Mohnen and E. Kremp (2005), “The Importance of R&D and Innovation for Productivity: A Reexamination in Light of the 2000 French Innovation Survey”, Annales d’Économie et de Statistique, 79/80, 489-529.
Malerba, F. and L. Orsenigo (1999), “Technological Entry, Exit and Survival: An Empirical Analysis of Patent Data”, Research Policy, 28, 643-660.
Martínez-Ros, E. and J. M. Labeaga (2002), “Modelling Innovation Activities Using Discrete Choice Panel Data Models”, in Innovation and Firm Performance. Econometric Explorations of Survey Data, A. Kleinknecht and P. Mohnen (eds.), Palgrave, New York, 150-171.
Masso, J. and P. Vather (2008), “Technological Innovation and Productivity in Late-Transition Estonia: Econometric Evidence from Innovation Surveys”, European Journal of Development Research, 20(2), 240-261.
Miotti, L. and F. Sachwald (2003), “Cooperative R&D: Why and With Whom? An Integrated Framework of Analysis”, Research Policy, 32, 1481-1499.
Miravete, E. and J. Pernías (2006), “Innovation Complementarity and Scale of Production”, Journal of Industrial Economics, 54, 1-29.
Mohnen, P. and M. Dagenais (2002), “Towards an Innovation Intensity Index. The Case of CIS-I in Denmark and Ireland,” in Innovation and Firm Performance. Econometric Explorations of Survey Data, A. Kleinknecht and P. Mohnen (eds.), Palgrave, New York, 3-30.

39
Mohnen, P. and C. Hoareau (2003), “What Type of Enterprise Forges Close Links with Universities and Government Labs? Evidence from CIS 2”, Managerial and Decision Economics, 24(2-3), 133-145.
Mohnen, P., J. Mairesse and M. Dagenais (2006), « Innovativity: A Comparison across Seven European countries”, Economics of Innovation and New Technologies, 15(4/5), 391-413.
Mohnen, P. and L.-H. Röller (2005), “Complementarities in Innovation Policy”, European Economic Review, 49(6), 1431-1450.
Mohnen, P. and J. Rosa (2002), “Barriers to Innovation in Service Industries in Canada,” in Institutions and Systems in the Geography of Innovation, M. Feldman and N. Massard (eds.), Kluwer Academic Publishers, Boston, 231-250.
Mohnen, P. and P. Therrien (2003), “Comparing the Innovation Performance of Manufacturing Firms in Canada and in Selected European Countries: an Econometric Analysis”, in Understanding Innovation in Canadian Industry, F. Gault (ed.), School of Policy Studies, Queen’s University, Kingston and Montreal: McGill-Queen’s University Press, 313-339.
Monjon, Stephanie & Waelbroeck, Patrick, 2003. "Assessing Spillovers from Universities to Firms: Evidence from French Firm-Level Data," International Journal of Industrial Organization, 21(9), 1255-1270.
Mytelka, L., M. Goedhuys, A. Arundel and G. Gachino (2004), Designing a Policy-Relevant Innovation Survey for NEPAD, A Study prepared for The Development Bank of Southern Africa Limited. United Nations University for New Technologies (UNU-INTECH).
Organization for Economic Co-operation and Development (1992, 1996, 2005), Oslo Manual, Paris, 1st, 2nd, 3rd edition.
Organization for Economic Co-operation and Development (1999), Science, Technology and Industry Scoreboard. Benchmarking Knowledge-based Economies. Paris.
Organization for Economic Co-operation and Development (2002), The Measurement of Scientific Technical Activities. Frascati Manual 2002. Proposed Standard Practice for Surveys of Research and Experimental Development, Paris.
Organization for Economic Co-operation and Development (2009), Innovation in Firms. A Microeconomic Perspective. Paris.
Parisi, M.L., F. Schiantarelli, and A. Sembenelli (2006), “Productivity, Innovation Creation and Absorption, and R&D: Micro Evidence for Italy”, European Economic Review, 50, 2037-2061.
Pavitt, K. (1984), “Sectoral Patterns of Technical Change: Towards a Taxonomy and a Theory”, Research Policy, 13, 343-373.
Peters, B. (2009), “Persistence of Innovation: Stylized Facts and Panel Data Evidence”, Journal of Technology Transfer, 34, 226-243.
Polder, M., G. van Leeuwen, P. Mohnen and W. Raymond (2009), “Productivity Effects of Innovation Modes”, Amsterdam: Statistics Netherlands Working Paper 09033.
Raffo, Julio, Stéphane L’huillery and Luis Miotti (2008), “Northern and Southern Innovativity: a Comparison across European and Latin American Countries”, European Journal of Development Research, 20(2), 219-239.

40
Raymond, W., P. Mohnen, F. Palm and S. Schim van der Loeff (2006), “An Empirically-Based Taxonomy of Dutch Manufacturing: Innovation Policy Implications,” De Economist, 154(1), 85-105.
Raymond, W., P. Mohnen, F. Palm, and S. Schim van der Loeff (2010), “Persistence of Innovation in Dutch Manufacturing: Is it Spurious?”, Review of Economics and Statistics, forthcoming.
Robson, M., J. Townsend and K. Pavitt (1988), “Sectoral Patterns of Production and Use of Innovations in the UK: 1945-1983”, Research Policy, 17, 1-14.
Roper, S., J. Du, J.H. Love (2008), ‘Modelling the Innovation Value Chain’, Research Policy, 37, 961-977.
Savignac F. (2008) "Impact of Financial Constraints on Innovation: What Can Be Learned from a Direct Measure”, Economics of Innovation and New Technologies, 17(6), 553-569.
Schaan, S. (2003), “An Innovation System for the Forest Sector” in Understanding Innovation in Canadian Industry, F. Gault (ed.), School of Policy Studies, McGill-Queen’s University Press, 345-366
Schibany A. and G. Streicher (2008), “The European Innovation Scoreboard:Drowning by Numbers?”, Science and Public Policy, 35 (10), 717-732.
Sterlacchini, A. (1999), "Do Innovative Activities Matter to Small Firms in Non-R&D-Intensive Industries? An Application to Export Performance," Research Policy, 28(8) 819-832,
Tether, B. (2002), “Who Co-operates for Innovation and Why? An Empirical Analysis”, Research Policy, 31, 947-967.
Therrien, P. and P. Mohnen (2003), “How Innovative are Canadian Firms Compared to Some European Firms? A comparative look at innovation surveys,” Technovation, 23(4), 359-369.
Tiwari, A., P. Mohnen, F. Palm, Sybrand Schim van der Loeff (2008), “Financial Constraint and R&D Investment: Evidence from CIS”, in Determinants of Innovative Behaviour. A Firm’s Internal Practices and its External Environment, C. van Beers, A. Kleinknecht, R. Ortt and R. Verburg (eds.), Palgrave Macmillan, Hampshire, 217-242.
van Beers, C., A. Kleinknecht, R. Ortt and R. Verburg (2008), “Determinants of Innovative Behaviour. A firm's Internal Practices and its External Environment”. Palgrave, New York, N.Y.
van Leeuwen, G. and L. Klomp (2006), “On the Contribution of Innovation to Multi-Factor Productivity Growth”, Economics of Innovation and New Technologies, 15(4/5), 67-390.
van Ophem, H., E. Brouwer, A. Kleinknecht and P. Mohnen (2002), “The Mutual Relation between Patents and R&D,” in Innovation and Firm Performance. Econometric Explorations of Survey Data, A. Kleinknecht and P. Mohnen (eds.), Palgrave, New York, 56-72.
Veugelers, R. (1997), “Internal R&D Expenditures and External Technology Sourcing”, Research Policy, 26, 303-315.
von Hirschhausen, C. and J. Schmidt-Ehmcke (2009), The DIW Innovation Indicator: An Integrated Approach. Presentation, Berlin: DIW, at http://www.diw.de .