Spatial Econometric Approaches to Estimating Hedonic...
50
Draft (Do not quote) Spatial Econometric Approaches to Estimating Hedonic Property Value Models Li Wang 1 and Richard C. Ready 2 Selected Paper prepared for presentation at the American Agricultural Economics Association Annual Meeting, Providence, Rhode Island, July 24-27, 2005 Copyright 2005 by Li Wang and Richard C. Ready. All rights reserved. Readers may make verbatim copies of this document for non-commercial purposes by any means, provided that this copyright notice appears on such copies. 1 Graduate Student, the Pennsylvania State University, Department of Agricultural Economics and Rural Sociology, 312 Armsby Building, University Park, USA 16802, [email protected] 2 Assistant Professor, the Pennsylvania State University, Department of Agricultural Economics and Rural Sociology, 112-A Armsby Building, University Park, USA 16802, [email protected]
-
Upload
dangkhuong -
Category
Documents
-
view
237 -
download
0
Transcript of Spatial Econometric Approaches to Estimating Hedonic...

Draft (Do not quote)
Spatial Econometric Approaches to Estimating
Hedonic Property Value Models
Li Wang1 and Richard C. Ready2
Selected Paper prepared for presentation at the American Agricultural Economics Association Annual Meeting, Providence, Rhode Island,
July 24-27, 2005
Copyright 2005 by Li Wang and Richard C. Ready. All rights reserved. Readers may make verbatim copies of this document for non-commercial purposes by any means, provided that this copyright notice appears on such copies.
1 Graduate Student, the Pennsylvania State University, Department of Agricultural Economics and Rural Sociology, 312 Armsby Building, University Park, USA 16802, [email protected] 2 Assistant Professor, the Pennsylvania State University, Department of Agricultural Economics and Rural Sociology, 112-A Armsby Building, University Park, USA 16802, [email protected]

Spatial Econometric Approaches to Estimating Hedonic Property Value Models
Li Wang and Richard C. Ready
Abstract: The inclusion of spatial correlation of house price in hedonic pricing model
may produce better marginal implicit price estimate(s) of the environmental variable(s) of
interest. Most applications where a spatial econometric model is applied to the estimation
of a hedonic property value model have used either a spatial lag model or a spatial
autoregressive (SAR) error model. Incorrect spatial specification may produce even
worse estimate outcome than OLS. Three issues regarding the specification of a spatial
hedonic pricing model are considered. First, we question the “convention” of row-
standardizing the spatial weights matrix. Second, we argue that the spatial error
components (SEC) model is more theoretically intuitive and appealing for modeling
house price. Third, we explore whether the choice of spatial model is important,
empirically, using a large house sale dataset that includes measures of proximity to
landfills. With one exception, estimated marginal implicit prices are fairly robust across
all models.
Keywords: row-standardization, spatial econometrics, SEC model, SAR error model,
spatial lag model, hedonic pricing, landfill, house price
1. Introduction
In real estate economics, hedonic pricing models are commonly used to estimate the
negative externalities generated by undesirable land uses such as landfills, toxic waste
1

sites, incinerators, etc, on house prices. These models rely on spatial variation in house
price, and typically measure the gradient in house price as distance to the undesirable
land use increases. However, spatial dependence of house prices is widely observed in
real estate data (high-valued houses tend to cluster together as do low-valued houses).
One prominent example follows the conventional “wisdom” among real estate
professionals that the cheapest house on the block appreciates faster than more expensive
neighbors. The spatial correlation of house price may result from a herd behavior around
neighboring house prices where price expectations are formed based on neighboring
values. The price setting process by using “comparables” (selling prices of neighboring
houses) fits to this story. Price (amenity) externality also contributes to the spatial
correlation as people receive positive utility from living close to nicer (high-valued)
houses with the result that surrounding high-priced houses push your house price up. The
herd effect and price externality lead to the spatial lag model where a spatially lagged
dependent variable (spatially weighted neighboring prices) helps to explain the
determination of house prices. Different from the intuitive interpretation, there are other
two most cited “technical” sources of spatially correlated house prices: common omitted
explanatory variable(s) and measurement error(s). An omitted variable or measurement
error that affects nearby properties will result in spatially correlated errors in a similar
way. Both of them lead to the specification of spatial error model.
The traditional hedonic model does not explicitly take the spatial dimension of housing
price data into account, even though the OLS model is “spatial” in the sense that it
measures characteristics that vary spatially, e.g., the distance to central business district
2

or distance to an undesirable land use. If house prices are spatially correlated, either in
their levels or in the errors, then simple OLS regression can give spurious results. This is
important since the significant marginal implicit price (MIP) estimate of, say, proximity
to a landfill, may be due to spatial correlation of house price. Houses with correlated
selling price could happen to locate near a landfill that has no significant externality.
Without accounting for the spatial correlation of nearby house prices, its effect would be
manifest through an erroneously significant MIP estimate of the landfill. Even if the
landfill does depress nearby house prices, its negative effect spills across houses and may
get entangled with the spatial correlation of nearby house prices, resulting in an imprecise
MIP estimate. Spatial econometrics explicitly accounts for the influence of space in real
estate, urban and regional models.
Recent years have seen many applications of spatial econometric approaches in hedonic
pricing studies (Pace and Gilley 1997, Basu and Thibodeau 1998, Durbin, Pace and
Thibodeau 1999, Paterson and Boyle 2002, Wilhelmsson 2002, Kim et al 2003,
Goldsmith 2004, etc). The two most frequently used models in the spatial hedonic pricing
literature are the spatial lag model and the spatial autoregressive (SAR) error model 1.
One reason for their popularity is that computer packages, e.g., the Spatial Econometrics
Toolbox for Matlab by LeSage and GeoDa by Anselin, contain programming to estimate
these two models. While some authors have explored which of these two models might
provide a better fit to a particular dataset, there has been less exploration of the sensitivity
of externality estimates to the choice of spatial model, and even less reflection on which
models might be theoretically more appropriate for hedonic models.
3

Another often ignored point in practice is the “conventional” use of row-standardized
spatial weights matrices. Row-standardization is appealing in part because the associated
spatial parameter has a clear interpretation as a measure of spatial dependence
(autocorrelation). This makes the spatial parameter comparable between models.
However, as Bell and Bockstael (2000) argue, row-standardization changes the assumed
spatial structure of the sample data and so the intended “economic” relationship among
observations.
This paper simultaneously explores both spatial model selection and row-standardization
of the spatial weights matrix, as these two concerns are interdependent. We argue that,
based on theoretical grounds, the spatial error components (SEC) model suggested by
Kelijian and Robinson provides a better model for house price data than the spatial lag
model and the SAR error model. We also claim that, for house price, a row-standardized
spatial weights matrix is more appropriate for the spatial lag model and may better fit the
SEC model than a non-standardized weights matrix; by contrast, there is no strong a
priori reason to favor using a row-standardized spatial weights matrix in the SAR error
model. To illustrate, we use the hedonic price model to estimate the impacts that three
different landfills have on nearby house prices. We estimate the implicit price function
using a spatial lag model, the SAR error model and the SEC model with both row-
standardized and non-standardized weights matrices. Our claims are supported by the
large-sample empirical evidence.
4

The remainder of this paper is organized as follows. In section 2, we first review several
popular spatial model specifications with focus on their theoretical implications. In
section 3, we briefly analyze the consequences of row-standardizing spatial weights
matrices and relate it to different spatial models. In section 4, a review of protocols for
spatial model selection is given, including the LM test, the Bayes factor method and a
pseudo-R2 goodness-of-fit criterion. Section 5 describes the data, the landfills and the
study area. In section 6, the estimation results and tests are presented and discussed in
more detail, with emphasis on model selection. The comparisons of the estimation results
including the OLS estimate are also given. Section 7 concludes the paper. More detail is
available in technical appendices.
2. Review on spatial regression models: theoretical implications
In essence, each spatial model specifies a spatial process under which the observations
are generated. Different beliefs on spatial relationship (spatial dependence and spatial
heterogeneity) are established by selecting different spatial models. The applications of
the spatial lag model, the SAR error model and the SEC model to house price represent
three distinct spatial data generating processes (DGP) of house price. De Graaff et al
(2001) list three reasons for handling spatial dependence and spatial heterogeneity jointly;
we will just focus on spatial dependence of house price in our analysis.
2.1 Spatial lag model
Anselin (2002) discusses two main motivations for including spatial effects in regression
models from a theory-driven as well as from a data-driven perspective. A theory-driven
5

framework follows from the formal specification of spatial interaction (interacting agents,
social interaction) in an economic model, where an explicit interest in the spatial
interaction of a particular variable prevails and a theoretical ground generates the model
specification. In other words, dependence of spatial process of the particular variable is
substantive, compared with the so-called “nuisance” correlation of spatial error processes.
If we believe that the selling price of a house at a location acts as a signal that guides the
selling prices of its neighboring houses, or a herd behavior exists, spatial dependence of
house prices can be modeled directly as including a spatially lagged dependent variable
into the hedonic pricing model. This model captures the intuitive idea that a house
surrounded by expensive houses is worth more than a house surrounded by inexpensive
houses. Then, the neighboring house prices act as an explanatory variable of the house
price at a particular location.
As a result, the spatial lag model takes the form
),0(~ 2nIN
XWyyσε
εβρ ++= (1)
where is a vector of house prices, W is the pre-specified y 1×n nn× matrix of spatial
weights, ρ is a spatial autocorrelation coefficient (when W is row-standardized), X is a
matrix of explanatory variables including house structural characteristics, location
characteristics and environmental attributes of interest,
kn×
β is a 1×k vector of parameters to
be estimated, and ε is a vector of errors. The assumption of normality for1×n ε is
6

necessary for ML estimation; however, the IV/2SLS estimation does not depend on it
(Anselin, 1988, Chap 7).
Bell and Bockstael (2000) argue that there is less reason to expect a spatial lag structure
for house price. It would occur only when the selling price reacts directly to selling prices
of neighboring houses and not just to characteristics of neighboring houses. Furthermore,
this relationship would only be one-way, namely, the first sold house would affect
subsequent sales but not vice versa. This is an important observation as the observed
spatial dependence (correlation) of house prices may not be the result of this “price-
bidding” process; its existence could be purely statistical. Nevertheless, the one-way
relationship is valid only if it is due to a herd effect. If the price externality is the main
reason of spatial correlation, the price of sold house will also be affected by the (expected)
prices of incoming houses in the neighborhood, resulting in interacted neighboring house
prices. Therefore, the relationship between neighboring house prices needs not to be one-
way.
We can rewrite the lag model as . Conditioning onερβρ 11 )()( −− −+−= WIXWIy X ,
the covariance structure of takes the form of .
Since is a full matrix with
y 112 )'()( −− −− WIWI ρρσ
1)( −− WI ρ 0≠ρ , a first implication is that the house prices are
globally correlated since each location is correlated with every other location in the
system, although in a fashion that decays with order of neighbors. More importantly, it
says that house price at one location depends on the characteristics ( X ) of all other
houses in the sample and the errors of all other observations, which does not make much
7

sense. This outcome can be easily seen when W is row-standardized. Footnote 8 of
Kelijian and Prucha (1998) allows for the “Leontief expansion” of
...)( 33221 ++++=− − WWWIWI ρρρρ , then we have
ερρ+ρβρρρ ...)(...)( 33223322 ++++++++= WWWIXWWWIy
(2) ...... 2222 +++++++= ερερεβρβρβ WWXWWXX
The spatial lag specification of house price is justified under the real-estate appraisal
process using comparable sale prices or by house price externality. This may not work. It
is also the reason why more empirical studies favor the SAR error process over the lag
structure.
2.2 SAR error model
The theory-driven perspective motivating spatial correlation in house prices is appealing.
However, in practice, the motivation for applying a spatial econometric model is usually
not driven by formal theoretical concerns, but a result of “peculiarities” of the available
spatial data. This framework considers outcomes in neighboring places to be related to
one another because of unobserved components that are spatially correlated. The interest
is to obtain efficient coefficient estimates in hedonic model and make correct inference.
Most spatial hedonic pricing models fall into this data-driven framework in the sense of
the way to specifying the spatially correlated error structure in hedonic regression.
The spatial dependence among regression errors results from two sources: (erroneously)
omitted spatially-correlated variable(s) and measurement error or misspecification of the
8

functional form. The location of a house influences its selling price and nearby houses
will be affected by the same location factors. Since the inclusion of all relevant attributes
is seldom fulfilled and the effects of all omitted variables are subsumed into the error
term, if the omitted variables are spatially correlated, so are the regression errors.
Measurement error may occur when the spatial unit of observation does not coincide with
the spatial extent of the economic behavior, and then systematically relates to location.
Durbin (1998) provides two main reasons to suspect that neighbor effects are measured
with errors: use of proxy variable to some unobservable attributes, e.g., crime rate and
socioeconomic characteristics of residents, and mismatch between neighborhood
boundaries and the data gathering boundaries.
The error term can take different forms of spatial structure. The spatial autoregressive
(SAR) process is the most popular one 2. It is similar to the counterpart in a time-series
context, although more complex. The SAR error model takes the form
),0(~ 2nINu
uWXy
σ
ελεεβ+=+=
(3)
whereλ is a spatial parameter similar to ρ in (1) and all other notations are as previously
defined.
This specification says that the error for house depends on the average of the errors in
neighboring observations and its idiosyncratic component , implying that the
unobserved errors
i
iu
ε are entirely predictable from neighboring error εW . Solving for ε
as , we have , which is a full matrix uWI 1)( −−= λε 112 )'()()'( −− −−= WIWIE λλσεε
9

with 0≠λ . Thus, every house’s error is correlated with other house’s error in the system,
showing the global correlation of errorε . Each error depends on the idiosyncratic errors
of all other places including higher-order neighbors through a distance decay effect. This
can also be seen by applying “Leontief expansion” to if W is row-standardized.
As a result, a shock in the idiosyncratic error at any location will be transmitted to all
other locations following a spatial multiplier . As in the spatial lag model,
conditional on house characteristics, the house prices are globally correlated.
1)( −− WI λ
u
1)( −− WI λ
2.3 Spatial error components (SEC) model
In both the lag model and the SAR error model, any error that affects one house’s price
must also affect neighboring house prices. This is particularly problematic if we consider
errors in the explanatory variables. Suppose, for example, that square footage is mis-
measured for one house, and that recorded square footage is less than actual square
footage (due, possibly, to an addition that was not reported to the assessor’s office). That
house will sell for more than predicted by the hedonic model, and will have a positive
estimated error. Obviously, the measurement error of square footage for one particular
house is house-specific, the resulting positive estimated error will not spillover to its
neighbors. However, both the spatial lag model and the SAR error model force
neighboring house prices to adjust because of that positive estimated error. The SEC
model, in contrast, does not.
The spatial error components model was originally proposed by Kelijian and Robinson
(1993, 1995) to avoid the singularity problem associated with the SAR process of the
10
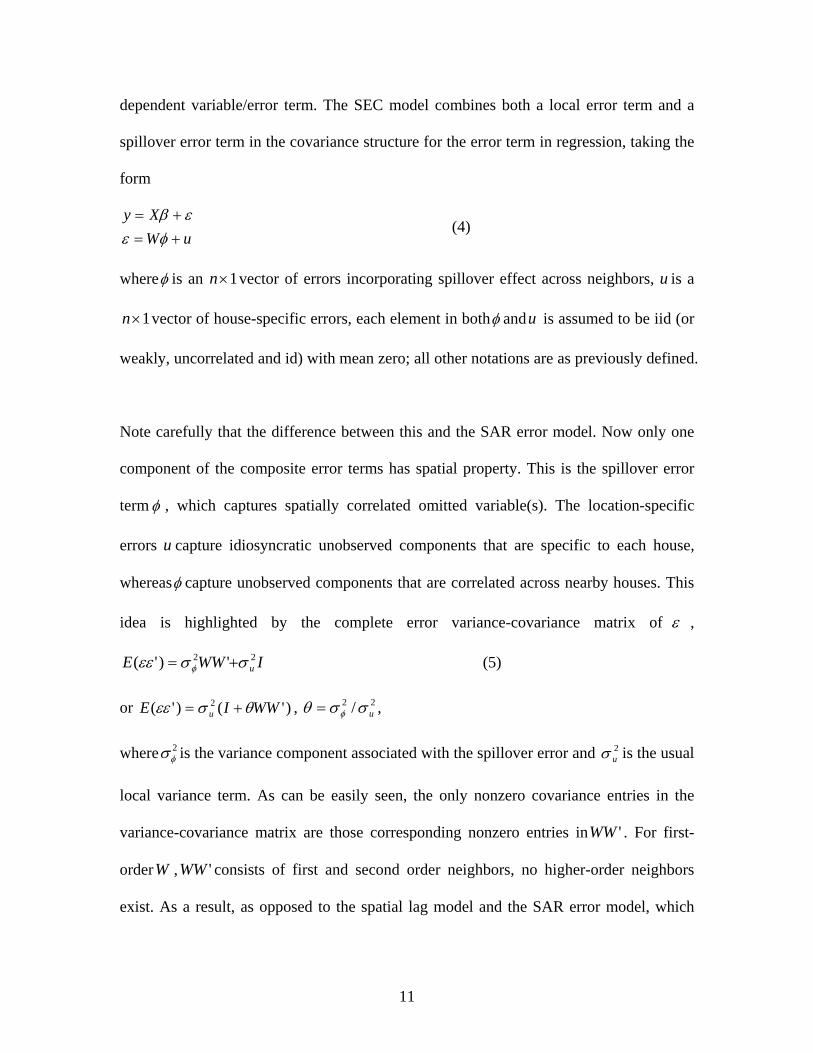
dependent variable/error term. The SEC model combines both a local error term and a
spillover error term in the covariance structure for the error term in regression, taking the
form
uWXy
+=+=
φεεβ
(4)
whereφ is an vector of errors incorporating spillover effect across neighbors, u is a
vector of house-specific errors, each element in both
1×n
1×n φ and is assumed to be iid (or
weakly, uncorrelated and id) with mean zero; all other notations are as previously defined.
u
Note carefully that the difference between this and the SAR error model. Now only one
component of the composite error terms has spatial property. This is the spillover error
term φ , which captures spatially correlated omitted variable(s). The location-specific
errors u capture idiosyncratic unobserved components that are specific to each house,
whereasφ capture unobserved components that are correlated across nearby houses. This
idea is highlighted by the complete error variance-covariance matrix of ε ,
(5) IWWE u22 ') ='( σσεε φ +
or , , )'()'( 2 WWIE u θσεε += 22 / uσσθ φ=
where is the variance component associated with the spillover error and is the usual
local variance term. As can be easily seen, the only nonzero covariance entries in the
variance-covariance matrix are those corresponding nonzero entries in 'WW . For first-
orderW , consists of first and second order neighbors, no higher-order neighbors
exist. As a result, as opposed to the spatial lag model and the SAR error model, which
2φσ
2uσ
'WW
11
induce global spatial correlation, the SEC model yields zero covariance beyond the
second-order neighbor and can be considered as a model for local spatial correlation 3.
We find that the SEC model better captures our intuition about the process that drives
spatial correlation in house prices. A spatial moving average component captures the
common unmeasured factors that affect neighboring house prices, while each house has a
second error component that captures house-specific unobserved errors. The SEC model
explicitly considers the two sources of the variation in house price given observed house
characteristics. Some errors are “contagious” such that neighboring house prices are
observed to be correlated. These errors spill over to neighboring houses via the spatial
structure denoted by weights matrix. Some errors are purely local in the sense that they
will not be transmitted and so have no influence on neighboring houses.
3. Row-standardization of spatial weights matrix
The spatial weights matrix (W ) is used to relate an observation at one location to the
observations in other spatial units in the system by specifying a neighborhood for each
observation. There are two basic types of spatial weights matrices. The first type is called
contiguity-based, which establishes a contiguity relationship based on shared borders or
vertices of a lattice. The second type is called distance-based, which establishes a spatial
relationship based on the distance between observations and is more pertinent to our
house sale dataset, where locations of houses are specified as points in space.
12

When considering a weighted sum of neighboring observations on dependent variable
( ), we create a spatial lag term Wy weighted by neighbors’ proximities to each
observation; when considering a weighted sum of neighboring errors (
y
ε ), we create a
proximity-weighted error term εW . If we model Wy as an explanatory variable of y in
addition to other explanatory variables ( X ), a spatial lag model is resulted. If we try to
model a spatial error process by including the weighted error εW , we end up with a
spatial error model. (For detailed descriptions, see section 3.) Then, the spatial weights
matrix represents prior knowledge or beliefs about the underlying spatial structure of the
variable of interest ( ) or associated error term (y ε ). If the specification is a good
approximation to the reality, it would “correctly” describe the dependence among all
neighbors of any given observation.
Spatial weights matrix is row-standardized to have row-sums of unity in most empirical
studies, producing a spatially weighted average term Wy of dependent variable in spatial
lag model or εW in spatial error model. The spatial parameter associated then has an
intuitive interpretation as spatial autocorrelation coefficient 4; it also facilitates the
maximum likelihood (ML) estimation of spatial models. As a result, row-standardization
has become a convention in practice without further exploration. However, it may not be
appropriate in some situations.
3.1 Number effect and distance effect
As the number and density of neighbors for each spatial observation are generally not the
same, row-standardization rescales each row of the weights matrix by different factors.
13

For a given observation, although not changing the relative dependence among all
neighbors, row-standardization does change the total impact of neighbors across
observations. It is equivalent to assuming that the total effect of neighbors keeps
unchanged across all observations no matter how many neighbors an observation has.
This is what we label the “number effect” of row-standardization.
For a contiguity-based weights matrix, where each neighbor is assigned the same weight
of unity, the influence of any one neighbor for a given observation is inversely
proportional to the number of total neighbors after row-standardization. While for a
distance-based weights matrix, where the interdependence of spatial observations can be
assumed to decline with distance, this practice rescales the weights based on the absolute
distance to neighbors for each row. In the situation in which some spatial units have
many close neighbors and others have no close neighbors or only remote ones, because
row-standardization compels the total influence of neighbors across observations to be
the same, remote neighbors will be given larger weights than close ones for different
spatial observations (even though the close neighbors still get larger weights than remote
ones for the same observation). In this case, Tobler’s first law of geography is violated:
remote neighbors are more correlated than closer neighbors! This is what we call the
“distance effect”. For both matrices, row-standardization tends to alter the assumed
spatial structure; nevertheless, the “distortion” of distance effect is much worse for
distanced-based weights matrix than contiguity-based one, since distance matters in the
former case. A by-product of this practice is that the resulting spatial weights matrix is no
longer symmetric, which may complicate the test procedure of spatial models.
14

Among others, Bell and Bockstael (2000) find far greater sensitivity of parameter
estimates to the specification of the spatial weights matrix than the choice of estimation
technique. They also point out that this sensitivity and the concern over the change in
spatial structure by row-standardization are related each other. Consequently, more
caution need to be paid when row-standardizing spatial weights matrix.
3.2 Row-standardization within spatial models
In this subsection, we try to answer the question of whether the spatial weights matrix
should be row-standardized for different spatial models in section 2. We analyze the
number effect and distance effect of row-standardization for each model. We’ll see that,
although the distance effect is argued against row-standardization, the number effect is
appreciated in some case but not favored in other cases. Our conclusion is made upon
which effect dominates.
Given the spatial lag model for house price, non-standardization keeps the assumed
spatial structure where house prices are positively correlated with declining distance (in
most cases); however, it also implies that a house with more neighbors in the dataset will
attract more of a price premium than one with fewer neighbors, even if all houses share
the same structural and location characteristics. So the number of neighboring houses
matters in determining house price. This does not make sense in housing markets. The
positive impact of high-priced neighbors may increase with more neighbors as the
number of signals increases, but there is some limit to this process. Further, the number
of neighbors in a dataset is as much a result of when sales occur as it is a result of spatial
15

distribution of houses. In contrast, a spatial lag model with row-standardized spatial
weights matrix is not plagued by this problem since the total effect of neighbors is
normalized to be the same for each house (the number effect), although with the price of
changing the assumed spatial structure. There exists a tradeoff between the two “bads”, 1)
pseudo-importance of number of neighboring houses (for non-standardized weights
matrix) and 2) over-importance of distant houses when few near neighbors exist (for row-
standardized weights matrix). We view the negative impact of number of neighbors as a
more serious problem and favor the number effect of row-standardization. Therefore, we
keep the “conventional” use of row-standardized weights matrix in spatial lag model for
house price.
Unlike the lag model in which a house attracts more of a price premium when surrounded
by more (expensive) neighboring houses, in the SAR error model, each error could be
positive or negative, more neighbors do not necessarily add to the magnitude of the error
at a particular location. Furthermore, large number of neighboring errors may provide
more information about what the error of my house price might be. There is not much
reason to limit the total effect of neighboring errors on each error to be the same. We’ll
not expect row-standardization to work well by its number effect and therefore do not
have a strong a priori reason to favor using a row-standardized weights matrix.
Compared with the SAR error model, where the errorε for each observation is a linear
combination of all idiosyncratic errorsu , including its own, the spillover error component
of the SEC model does not go beyond the second-order neighbors for first-orderW ,
16

resulting in a much more abrupt distance decay effect. The potential “bad” of changing
the assumed spatial structure by row-standardization may not be that prominent. On the
other hand, it is reasonable to assume that the total spillover effect on price is stable
across all houses, which fits to the number effect of row-standardization. As a result, the
row-standardized spatial weights matrix might be more suitable for the SEC model.
4. Spatial regression model selection
Test statistics based on the Lagrange Multiplier (LM) principle have been developed for
detecting the existence of spatial dependence in the regression error and spatially lagged
dependent variable (Anselin 1988, Anselin et al 1996, Anselin and Bera 1998, Anselin
2001). These LM tests are also helpful for spatial model selection. Anselin (2005, p198-
200) provides a decision rule using the results of LM tests and their robust forms that can
guide the choice between the spatial lag model and the SAR error model. The basic idea
is as follows, if only one of the LM-Lag and LM-Error test statistics is significant, choose
the model rejecting the null hypothesis of no spatial correlation; if both are significant,
consider their robust forms. If only one robust LM statistic is significant, that model
should be chosen; if both robust LM tests are highly significant, the model with the larger
test statistic value is favored. This routine is followed by many empirical studies (e.g.,
Kim et al, 2003).
Strictly speaking, this decision rule is not theoretically justified, although it may have
some power against the worst spatial regression specification. For LM tests where the
null hypothesis is no spatial correlation of the OLS residuals, the model selection is made
17

between the OLS and spatial lag model/SAR error model. In their robust forms, the null
hypotheses are 0:0 =ρH in the local presence of λ for the spatial lag model and
0:0 =λH in the local presence of ρ for the SAR error model. Again, neither test is
derived for the direct comparison between the lag model and the SAR error model,
although they are robust to possible local misspecification of the alternative, and so more
powerful than the non-robust counterparts. If we want to differentiate these two spatial
models, the null hypothesis should be the lag model (SAR error model) and the
corresponding alternative hypothesis is the SAR error model (lag model). Unfortunately,
no such test has been developed 5.
Anselin and Moreno (2003) develop a LM test for the SEC model along with a GMM-
based test and two variants of the Kelijian-Robinson test. The LM-SEC statistic performs
well in terms of power against the null hypothesis of no spatial correlation in Monte
Carlo experiments, even in the non-normality situations. There is no test to distinguish
the SEC model from the lag model or the SAR error model.
As the LM test also depends on the specification of the spatial weights matrix, it may
provide us a way to select between row-standardized and non-standardized weights
matrices for a given spatial regression specification. The weights matrix with the (most)
significant LM statistic is preferred.
Though used much less frequently, Bayesian methodology also provides statistics useful
in spatial regression model selection. Hepple (2004) develops the formulae for
18

calculating Bayes factors for a family of spatial regression models including the spatial
lag model, the SAR error model, the SMA error model, etc. By assuming equal prior
probabilities to each model, we can compute the magnitude of the Bayes factor for any
two spatial models to select the more probable model. Hepple provides a decision rule for
choosing among models, illustrated in two small-sample examples ( and .
However, in large sample cases, the Bayes factor method is subject to numerical
problems, which will be discussed in section 6.3.
25=n )49=n
Finally, we propose a third approach to model selection, based on predictive goodness of
fit. For each model, we calculate the predicted value for each observation in the dataset
(as if the observation does not exist) by taking into account the specified spatial structure.
The ratio of the sample variance of the squared predicted values divided by the sample
variance of the dependent variable measures the goodness of fit for each model. We call
this statistic the model’s pseudo-R2. It is necessary to be careful about how it is derived
for each spatial model such that different spatial models are comparable (see appendix for
technical details).
None of the model selection methods described above is decisive. Each may incur some
sources of misspecifications, e.g., functional form, non-normality. We consider all three
approaches to see if they provide consistent guidance.
19

5. Empirical Analysis: data description and variable selection
The empirical application is conducted using a dataset on house sales near three landfills.
Whether and how a landfill depresses nearby property values is of interest for many
reasons. Several studies have estimated empirical relationships between residential
property values and proximity to a landfill or set of landfills using the hedonic pricing
technique. Many of these studies have found the existence of a negative externality from
a landfill on nearby house prices. Hite et al (2001) combine an urban location choice
model with hedonic pricing model to incorporating some spatial effects of disamenity in
estimating the impact of landfill on nearby property values. Ready and Abdalla (2005)
estimate the house price impact from landfills, among other local disamenities. Although
some of the spatial aspects have been included in their studies, the spatial correlation of
house prices is not explicitly accounted for. Using the data from the same study area as in
Ready and Abdalla, we estimate the implicit price functions for three landfills using the
spatial lag model, SAR error model and SEC model with both row-standardized and non-
standardized weights matrices and focus on model test and selection.
The data set under study consists of 7493 arm-length house sales between 1998 and 2002
in Berks County, Pennsylvania. Three landfills exist in the study area. Among the three
landfills, Pioneer Crossing Landfill (PCL) is prominent on the landscape and directly
visible from many nearby residential neighborhoods. Rolling Hills Landfill (RHL) is the
largest and visible from at least some vantage points, although surrounding topology
shields it from view from most directions. Western Berks Landfill (WBL) is the smallest
and is physically isolated from residential areas and difficult to see from off property.
20

The small size and isolation of WBL may prevent it from affecting nearby house price,
while the more prominent landfills are expected to have larger house price impacts. For
more details on the data acquisition, variable definition and landfill description, see
Ready (2004).
Houses included in the dataset are located within 10km of one of the three landfills. Data
on sale price (natural log of real house price in 2002 real dollar), sale year, township,
location and structural characteristics of the house are obtained. The structural
characteristics of the house included in the spatial hedonic regressions are living area,
living area squared, lot size, lot size squared, number of bedrooms, number of full
bathrooms, number of half bathrooms, dummy variables for existence of a basement,
stone exterior, brick exterior, masonry exterior, central air conditioning, whether the
property is a single family detached house (as opposed to a duplex, etc), an index of
physical condition, age of the structure at the time of sale, and age squared. The location-
specific variables consist of distance to commuting waypoints to Allentown and
Philadelphia, average slope within 100m of house, elevation, the difference between
elevation at the house site and average elevation within 800m of house, average PSSA
standardized school test scores, percentage of land within 400m of the house in industrial
use, percentage of land between 400m and 800m from the house in industrial use.
To control for regional differences in the housing market, a dummy variable was defined
for each landfill equal to 1 if the house is located within 10 km of the landfill, and 0
21

otherwise. Based on a preliminary analysis using dummy variables to identify con-central
rings around each landfill by Ready (2004), three proximity indices are defined as,
⎩⎨⎧
=2
PCLmi2 PCLd
wod PCL
/2< ,
⎩⎨⎧
=2
WBLmi2 WBLd
wodWBL
/2<
and
⎩⎨⎧
=3
RHLmi3 RHLd
wod RHL
/3< ,
where , and are the distance measures (in miles) of the house from the PCL,
WBL and RHL, respectively; the 2-mile represents the spatial limits of PCL’s and
WBL’s impacts on nearby house prices, the 3-mile represents the spatial limit of RHL’s
impact on nearby house prices. These limits were determined by running an auxiliary
OLS regression of house price on three dummy variables of concentric rings of width 1
mile around each landfill (totally 9 such dummy variables) and finding the significant
dummy “farthest away” from each landfill. This idea is also used to determine the spatial
limit of any impact from industrial land use. By including a measure of industrial land
use near the house, the impact of landfill on house price can be estimated separately from
that of industrial land. If a landfill does depress nearby house prices, a significantly
positive marginal implicit price of that landfill is expected by using these distance
measures.
PCLd WBLd RHLd
All house price effects are therefore estimated relative to the average house price within
10 km of the landfill. Although the time period is short, it may contain price fluctuations.
22

Four sale year dummy variables are therefore included to capture temporal variation. In
addition, the township dummy variables are included to represent different levels of
public service that would affect house price; they may also capture some spatial aspects
of the data.
We want to evaluate people’s willingness to pay for living away from the landfills
through their purchase decisions. Because of the existence of spatial dependence of house
prices, the negative effect of landfills on house price may be hidden by the clusters of
similar-valued houses. Alternatively, if similarly-valued houses are clustered near a
landfill, a spurious coefficient on landfill proximity could be obtained in an OLS
regression. Explicitly adding the spatial ingredient into hedonic model is expected to help
recover people’s “true” evaluation on the effect of landfill on house price.
6. Empirical Analysis: model estimation, test and selection
6.1 Spatial weights matrix
For each residential parcel sold in the data set, the location of the house is determined as
the centroid of the residential parcel with recorded x-coordinate and y-coordinate. A
spatial weights matrix is constructed based on the distances between these centroids.
It is common to use inverse distance as weights. One consequence is that weights are
nonzero even for very remote neighbor. We prefer to choose a distance cutoff beyond
which the neighborhood effect is set to be zero 6. This practice facilitates the use of
sparse matrix algorithms in Matlab 7 which provide a computationally efficient approach
23

to solving for estimates and test statistics in models involving a large number of
observations. With a distance cutoff, the constructed spatial weights matrix would
contain a large proportion of zeros, as most houses are excluded from the neighborhood.
The choice of boundary for the definition of a neighborhood is not clear –cut. Two
distance cutoffs (400m and 1600m) are tested. A cutoff distance of 400m yields many
“islands” or observations with no neighbors, making the analysis of spatial correlation
irrelevant for those houses. A 1600m cutoff produces much more neighbors for each
house (average 320 neighbors per house) and just one “island” which is dropped from the
sample. Ready and Abadalla (2005) found that nearby land use impacted house prices out
to 1600m. We use 1600m as the cutoff distance for construction of the spatial weights
matrix, but recognize that this choice is somewhat ad hoc, and could have important
implications.
Similar to the linear proximity index in Ready and Abadalla (2005, p317), the weights
take the form 8
⎩⎨⎧ −
=0
/1 LdW ij
ij (6) jiLd
Ld
ij
ij
=≥
<
&
where is the distance between house and house , and ijd i j L is the distance cutoff
(1600m).
24

6.2 LM tests 9
The procedure of using LM test statistics for the spatial lag model and the SAR error
model follows the decision rule of Anselin (2005). Based on OLS regression errors, LM-
Lag test statistics for a spatially lagged dependent variable and for SAR errors were
calculated using both row-standardized and non-standardized weights matrices. All four
tests show highly significant results and lead to reject the null hypothesis of no spatial
correlation in each case (Table 1). The LM-SEC test for the SEC model is also highly
significant for both weights matrices 10. For completeness, the Moran’s I test is also
included.
Since both LM tests for lag and SAR error structures reject the null hypothesis, we need
to consider their robust forms. Before proceeding to next step, a brief look at Table 1
shows LM-Lag LM-Lag and LM-Error LM-Error , which says
that the lag structure with row-standardized weights matrix is more significant while the
error structure with non-standardized weights matrix is more significant. These results are
consistent with our previous claims that a row-standardized weights matrix is more
appropriate for the lag model and a non-standardized weights matrix may be more
suitable for the SAR error model. We also have LM-SEC LM-SEC , so for
our data set, a row-standardized weights matrix appears to better represent the spatial
error component structure. However, we cannot compare these test statistics from
different spatial models to select the most “significant” one. For model comparison, we
use robust LM statistics.
>)( sW )( nW >)( nW )( sW
>)( sW )( nW
25

The robust LM test involves two weights matrices, one for the lag structure and the other
for the SAR error. There exist four combinations of the two matrices. Referring to Table
2, all the eight robust test statistics are highly significant (some are much greater than the
non-robust tests). Furthermore, we find Robust LM-Lag Robust LM-
Lag and Robust LM-Lag Robust LM-Lag , which imply that,
in the presence of possible locally misspecified SAR error structure, the lag structure with
a row-standardized weights matrix is more significant than that with a non–standardized
weights matrix. We also find that Robust LM-Error Robust LM-
Error and Robust LM-Error Robust LM-Error , which imply
that, in the presence of a possible locally misspecified lag structure, the SAR error
structure with a non-standardized weights matrix is more significant than that with a
row–standardized weights matrix. As in the non-robust tests, these robust LM tests
support our previous claims that a row–standardized weights matrix better captures any
lag structure, while a non-standardized weights matrix better captures any SAR error
structure.
>),( ns WW
),( nn WW >),( ss WW ),( sn WW
>),( nn WW
),( sn WW >),( ns WW ),( ss WW
Next, we compare the Robust LM-Lag with the Robust LM-Error , with
the favored weights matrices for each of the spatial structures. The latter (1556.50) is
much greater than the former (166.56), indicating that, of these two models, the non-
standardized SAR error model best models the spatial structure in our data. As the robust
form of LM-SEC in the local misspecification of spatial lag structure is not available, we
cannot compare the SEC model with the preferred SAR error model using a LM test.
),( ns WW ),( ns WW
26

6.3 Bayes factor method
Given the spatial models to be selected, we want to find the posterior probability of each
model being the “true” model conditional on the data, and choose the model with the
largest posterior probability. The extent to which the data support one model over another
can be measured by the posterior odds of the one model against the other, i.e., the ratio of
their posterior probabilities. Since posterior odds = Bayes factor × prior odds, if we
assume equal prior probability for all candidate models, we only need to find the Bayes
factor for any two candidate models, which is the ratio of their marginal likelihoods.
Under the assumptions of normal regression error, non-informative and uniform priors
for β and , and a uniform distribution with the range 2σ minmax /1/1 kkD −= for the spatial
parameter (where and are the largest and smallest eigenvalues of the spatial
weights matrix), Hepple (2004) derives the marginal likelihoods for each of a family of
spatial regression models, from which the Bayes factor can be computed for any pair of
candidate models. Some decision rule, e.g., Jeffery’s “weight of evidence” or Raftery’s
“grade of evidence”, is then used to decide whether the magnitudes of these Bayes factors
provide evidence that a model is favored. One advantage of this method is that a
comparison between row-standardized and non-standardized weights matrices can be
made for a given spatial model, as the weights matrix is involved in determining the
marginal likelihood. As the marginal likelihood for SEC model is not included in
Hepple’s analysis, we derive that formula following the same procedure
maxk mink
11. Note that the
derived marginal likelihood for each spatial model has two common terms, which can be
omitted from the calculation of the Bayes factor.
27

As in the case of the LM statistics, the Bayes factors are very large for our large
microlevel sample. Because numerical integration is involved in the calculation of
marginal likelihood and the integrant over the whole integration range is close to zero, a
numerical “problem” arises. Take the SAR error model for example, the marginal
likelihood with the two common terms omitted is
∫ −=
D knSAR dsXX
PD
Mdatap λ2)(221*'* )*(||
||1)|( (7)
where WIP λ−= , XPX ** = , , yPy ** = denotes determinant, is the residual
sum of squares of the regression of on
2s
*y *X , is the sample size and is the number of
explanatory variables (including the intercept term).
n k
For the row-standardized weights matrix, the integration interval is )1,1(− , reaches its
maximum of 1 at
|| P
0=λ . 21*'* || XX is decreasing over )1,1(− and reaches its minimum of
at47103643.3 × 1=λ . The minimum of is 151.52, then2s ∞→− ))min(( 2)(2 kns
with and . For the non-standardized weights matrix, the integration
interval is 12
7493=n 69=k
)0046.0,2602.0(− , reaches its maximum of 1 at|| P 0=λ . 21*'* || XX reaches
its minimum of at78107317.6 × 0046.0=λ . As the minimum of is 156.92, 2s
∞→− ))min(( 2)(2 kns .In both cases, the values of integrants are really close to zero but
one numerically dominates the other. The similar situation exists for the lag model and
SEC model. As a result, the magnitudes of the calculated Bayes factors are extremely
large and far beyond the “common” value 13, showing very strong evidence of favoring a
model or one weight matrix.
28

For our purpose, first we derive the Bayes factors of both row-standardized and non-
standardized weights matrices for the lag model and the SAR error model. All calculated
Bayes factors are presented in Table 3. Following Raftery’s “grade of evidence” in which
the Bayes factor greater than 150 for model 1 against model 2 indicates strong evidence
in favor of model 1, the spatial lag model with row-standardized weights matrix is
favored over the one with a non-standardized weights matrix as expected. But the SAR
error model also favors a row-standardized weights matrix, the opposite result from the
LM test.
Next we calculate the Bayes factor for the SAR error model against the lag model with
the same row-standardized weights matrix, resulting in a strong preference for the SAR
error model. Last, the comparison between the SEC model and the SAR error model with
same row-standardized weights matrix is made, showing that the SEC model is strongly
preferred.
6.4 Pseudo-R2 criterion
The third model selection criterion is the pseudo-R2 goodness-of-fit. Notice that the
Bayes factor method is essentially a model selection criterion based on model goodness-
of-fit, but adjusted according to some prior knowledge or information on the distributions
of model parameters. As a contrast, the pseudo-R2 criterion only relies on information
from the data. Table 4 shows the pseudo-R2 values of the SAR error model with types of
weights matrices, the SEC model and lag model with row-standardized weights matrices
only.
29
The pseudo-R2 of the spatial lag model with row-standardized weights matrix is
calculated from formula (2). Since the “Leontief expansion” does not apply for
where is non-standardized, an infeasibility of calculating the inverse of a
matrix makes the pseudo-R
1)( −− nWI ρ nW
74937493× 2 value unavailable for the non-standardized
weights matrix. The SEC model and the SAR error model share the same dependent and
explanatory variables (they only differ in the spatial error structure specification), their
pseudo-R2 values are comparable. However, the explanatory variables of the lag model
are or , so its pseudo-RXWI 1)( −− ρ ,...,, 2 XWWXX 2 value can not be compared with
those of the SEC model and the SAR error models. The pseudo-R2 for the SEC model is
about 6.5% greater than that of the SAR error model, showing that the SEC model
outperforms the SAR error model at prediction.
6.5 Summary of spatial model selection results
Even though the Bayes factor method yields surprisingly large statistics, all three model
selection criteria results support our favor of the SEC model over the lag model and SAR
error model and the use of a row-standardized weights matrix for the lag model and the
SEC model. Nevertheless, the choice of whether to use a non-standardized weights
matrix for the SAR error model is ambiguous.
The LM tests and their robust forms are widely used in selecting among spatial models.
The Bayes factor method, as an updated goodness-of-fit criterion, is potentially useful but
suffers from numerical precision in dealing with large-sample problem. Advances in this
direction, e.g., alternative prior specifications on model parameters, estimation of the
30

marginal likelihood by Markov Chain Monte Carlo (MCMC) technique, are expected.
The pseudo-R-square criterion is more suitable for achieving a better spatial prediction
and useful when spatial interpolation is needed to expand a (small) spatial sample.
6.6 OLS estimation
Without accounting for the spatial correlation of house price, the simple OLS regression
still gives “reasonable” MIP estimates for all house structural and location characteristics
and the five environmental variables of our interest (Table 5). For the externalities of
landfill on nearby house prices, we find that property values are depressed within 2 miles
and 3 miles of two prominent and visible landfills, but not affected by the less-prominent
landfill. Further, the significantly negative MIP estimate of Pind400 and negative but
insignificant MIP estimate of Pind400800 show that, house price declines with the
percentage measure of industrial land use within 400m of the house, but that impact
decreases with distance.
Even though the three landfill MIP estimates and two industrial land use MIP estimates
are consistent with our expectation, the OLS estimates are biased if the spatial lag model
is the “correct” specification or inefficient if a spatial error model is more appropriate.
The LM tests and Moran’s I test showed that there is some sort of spatial structure to
prices and/or errors. In the next section, we explore how robust the MIP estimates are to
the choice of spatial model.
31

6.7 Spatial model estimation
Spatial regression models are not easy to estimate because large microlevel data and
corresponding high-dimensional spatial weights matrix are often involved. The maximum
likelihood (ML) estimation under the assumption of normal errors is popular in part
because estimation routines such as LeSage’s are avaiable for the lag model and the SAR
error model. These routines require a row-standardized weights matrix. Since we have
strong evidence in favor of the row-standardized weights matrix in the spatial lag model,
only the estimation result for row-standardized lag model is presented 14. To compare the
row-standardized and non-standardized weights matrices for the SAR error model, we
need an estimation method that accommodates both weights matrices. The generalized
moments (GM) method suggested by Kelijian and Prucha (1999) is adopted to estimate
the spatial parameter (λ ), followed by a Cochran-Orcutt-type transformation to account
for the estimated error structure for the SAR error model 15. For the SEC model, a
generalized method of moments (GMM) estimator for the two variance components is
first obtained 16, followed by the same feasible GLS procedure as the SAR error model
through Cholesky factorization.
Table 5 shows the estimation results for the SAR error model with both types of weights
matrix, and the SEC model and the spatial lag model with row-standardized weights
matrix. For comparison, the OLS estimate is also included. Only the parameter estimates
of three landfill proximity indices and two percentage measures of industrial land use of
our interest are presented here. Estimated MIPs for all other house characteristics are
similar across models.
32

Since the dependent variable is the natural log of house prices, the estimated MIP
measures the percentage change of house price from a one-unit change in a house
attribute, e.g., the parameter estimate of PCLmi2 represents the percentage increase of the
expected selling price of a house if the house is 1 mile further away from PCL up to 2
miles. Note that, for the spatial lag model, the MIPs (marginal benefits) of house
attribute i for all houses are , which is different from that (1)( −− WIi ρβ iβ ) of a spatial
error model and traditional linear hedonic model because the lag model includes the
induced effects of the characteristic change of all the houses (see Kim et al 2003, p35-36
for details). Theβ generally underestimate the MIPs of the lag model. “True” MIP for the
lag model needs to be derived.
Kim et al (2003) show that the “true” MIP of house attribute isiρ
β−1
i for row-
standardized weights matrix if a unit change were induced at every location. However,
this story does not fit our situation so well. In their paper where the focus is on measuring
the benefits of air quality improvement, a uniform change of air quality at all locations is
possible. By contrast, such a uniform change of a landfill proximity index is impractical
and is not of interest. Instead, we use an iterative method to find the average MIP
estimate of the lag model. We first derive the predicted house prices that would occur if a
landfill did not exist. Then we compute the difference between the predicted prices with
the landfill and the predicted prices without the landfill. These differences are then
regressed on distance to the landfill. The estimated slope serves as an estimate of the
average MIP for the landfill (see technical appendices for details). For PCL, the MIP
33

estimate derived in this way is 0.05, which is greater than PCLβ)
(0.0436) but less than
ρβ
)
)
−1PCL (0.0561). Note that this estimate is smaller than the estimated MIP from the
favored SEC model (0.0674), the non-standardized SAR error model (0.0682) and the
simple OLS (0.0983). The same calculation procedure can be used to find the “true” MIP
estimate for the RHL. For WBL, the lag model produces a significantly negative estimate,
for which we don’t have a good explanation, indicating possible model misspecification.
The two estimates of for the SAR error model are not comparable because row-
standardization changes the assumed spatial structure of original weights matrix. While
the estimate ofλ (0.6803) for SAR error ( ) has an intuitive interpretation as the spatial
correlation coefficient, it’s hard to give an interpretation to the estimate (0.0040) for non-
standardized weights matrix. The same argument holds for the spatial parameter
sW
ρ of the
lag model. We see some differences in the parameter estimate in the SAR error model
between the two weights matrices. For PCL, row-standardized weights matrix gives
positive but insignificant estimate, while non-standardized weights matrix produces
positive and significant estimate. For RHL, both weights matrices give positive and
significant estimates, but the estimate from the non-standardized matrix is 21% smaller
than that from row-standardized matrix.
The SEC model has similar estimate results (both in sign and in size) as the non-
standardized SAR error model. They both show that PCL and RHL depress nearby house
prices and WBL does not. This outcome is consistent with our expectation, as PCL and
34

RHL are prominent and visible while WBL is small and not perceptible by many nearby
residents. Specifically, the significantly positive MIP estimates of PCL and RHL from the
SEC model show that a house 1 mile further away will increase its expected selling price
by 6.74% and 8.07% respectively, while the negative estimated MIP for WBL is not
significant. For surrounding land use, the house price declines 3.02% with 1% industrial
land use increase within 400m of the house, but the negative effect disappears out of this
limit.
Interestingly, the naïve use of OLS regression provides parameter estimates that are same
in sign for the three landfills and two industrial land use measures as the SEC model and
the non-standardized SAR error models.
For the two percentage measures of industrial land use, all spatial models yield
significantly negative estimates for Pind400, and negative but insignificant estimates for
Pind400800. By contrast, the parameter estimates of three landfill proximity indices for
different spatial models show a changing pattern. The underlying reason lies that houses
close to industrial land are less spatially correlated than houses close to landfill. This less
prominent spatial relationship makes the specification of spatial model not as critical in
estimating the impact of industrial land on nearby house prices.
7. Summary and Conclusions
This paper examines some important problems of applying spatial econometrics to
hedonic modeling of house price. Spatial autocorrelation of house prices may be partly
35

addressed in a traditional hedonic model by including some location and neighborhood
variables, but it is far from enough and an explicit consideration of this spatial
relationship is needed. In all cases, statistical tests reject OLS in favor of a model with
spatial structure. The spatial lag model and the SAR error model are the most popular
models used in spatial hedonic pricing estimation. We reflect on the theoretical
implications of how house prices form and relate to one another under these two spatial
specifications. Recognizing their inabilities in distinguishing two types of errors that
contribute to the variation of house price differently, we prefer a spatial error components
(SEC) model. We believe that the SEC model intuitively captures the process that drives
spatial correlation of house prices by specifying two error sources of the variation, a
spillover component for “contagious” error and a local component for “non-contagious”
error.
We also question the “convention” of row-standardizing weights matrix in practice
without furthering exploring its implication and consequence on model estimation and
inference. By extending the arguments of Bell and Bockstael, we argue that spatial
specification of the spatial weights matrix is as important as the choice of the spatial
model. For our landfill dataset, a row-standardized weights matrix is more appropriate for
the spatial lag model and fits to the SEC model, while a non-standardized weights matrix
might be more appropriate for the SAR error model.
Although the simple OLS is believed to give spurious MIP estimates because it ignores
the spatial correlation of house price, incorrect spatial specification may produce even
36
worse estimate outcomes than OLS. For the data in this study, where a spatial error
model appears to be more appropriate than a lag model, the OLS estimates are consistent
(although inefficient) and have the same signs and significance as those of the SEC
model, which is the preferred spatial model.
37

Footnotes:
1. There are some differences in how these models are labeled, e.g., Lesage (1999) uses
spatial autoregressive (SAR) model to label the spatial lag model and spatial error model
(SEM) to label the SAR error model we employ here.
2. Another popular specification is spatial moving average (SMA) process. The model
with SMA error sees rare applications although corresponding LM test has been
developed. One reason lies that it introduces extra difficulties in ML estimation (Sneek
and Rietveld, 1997) and no other widely accepted estimation method is proposed yet, to
the best of our knowledge.
3. The model with SMA error uWu += γε is also considered as model for local spatial
correlation. This can be seen from its error covariance structure
]')'([)'( 22 WWWWIE u γγσεε +++= , in which the spatial covariance is zero for
neighbors higher than second-order and so similar to the SEC model. Their subtle
difference is that in SMA model, the location-specific error component is considered to
be same as those that are spatially correlated. These two specifications are non-nested.
u
4. See Kelijian and Robinson (1995, p76-77) for discussion about this point.
5. An exception is the two LM tests suggested by Mur (1999) and Trivezg and Mur (2004)
to differentiating SMA error process and SAR error process. The second test requires
calculating the eigenvalues and eigenvectors of the spatial weights matrix, which is
38

difficult or impossible for very large sample size (also see Kelijian and Prucha, 1999,
p513-14). The first LM test does not require calculating the eigenvalues (although they
show up in the formula of test statistic) but involves highly computation-intensive
manipulation of matrices. Neither of the two tests is feasible for large sample problem.
6. Goldsmith (2004) argues that a distance-based weights matrix is not feasible for rural
studies as lot size may vary greatly in rural areas, resulting in an uneven number of
neighbors from rural clusters or a small number of neighbors for larger lots. The area
under our study is a mixture of rural and suburban areas, and the houses located on lots
larger than 5 acres are excluded, showing a small variation in lot size, the distance-based
weights matrix here therefore does not suffer from this problem.
7. LeSage (1999, p35-42) provides a good introduction and application of sparse matrix
algorithm under the context of spatial econometrics.
8. This weight differs from the linear proximity index just by a factor . Another
specification of bi-square weights produces similar estimation and test results for all
spatial models considered. As have been shown in some studies, the estimation outcomes
are not sensitive to the specification of weight function form.
ijd
9. LeSage’s Spatial Econometrics Toolbox includes the routines of LM-Lag, LM-Error
and Moran’s I tests for row-standardized weights matrix. However, these routines are not
feasible (or at least inefficient) for large-sample problem, as in our case, in that they
39

require many manipulations of matrices, e.g., the inverse. Using Matlab, the authors
develop own routines for all LM tests used in this section, which are feasible and efficient
for large-sample problem. These routines are available from the authors upon request.
10. The very large test statistic values may come from the large sample size. It can be
reasonably inferred that, if we split evenly our sample into 10 sub-samples and build
corresponding weights matrix, the LM tests for both the lag and error structures are
expected to be significant, say, at 5% level. Consider the way similar to the Bonferroni
correction of multivariate analysis, then, the “joint” significance level for the whole
sample would be approximately 10)05.0( .
11. The theoretical integration interval for SEC model is ),0( ∞∈θ , which is not
operational for our purpose. As we will not expect a very large ratio (θ ) of spillover error
variance over local error variance ( 014.3=θ)
in our case) and it can be shown that the
marginal likelihood of SEC model is increasing with θ , we just pick 20max =θ for
calculation purpose. Largerθ value will yield stronger evidence in favor of the SEC
model.
12. This interval is derived the same way as the row-standardized weights matrix, where
0.0046 corresponds to (max/1 k 667.219max =k ) and -0.2602 corresponds to
( ).
min/1 k
844.3min −=k
40

13. There are two possible reasons. One is the unavoidable rounding error in numerical
integration; more importantly, the other one attributes the result to the large sample size,
which is similar to our explanation of some very large LM test statistics.
14. The IV/2SLS estimation, in which WX acts as an instrument for to avoid the
introduced endogeneity problem, can be adopted for the lag model with both row-
standardized and non-standardized weights matrices. For our landfill dataset, the ML
estimates for the row-standardized lag model are very close to the IV/2SLS estimates.
The IV/2SLS estimates of the non-standardized lag model are not favored as expected,
i.e., the MIP estimate of PCLmi2 (0.1201) is much larger than those from other models.
In addition, compared with the ML estimation, the IV/2SLS method allows for a 2SLS-
robust estimation by correcting possible heteroskedasticity.
Wy
15. Of the five environmental variables of our interest, the ML estimates and GM
estimates are different in sign for PCLmi2 and WBLmi2 for the row-standardized SAR
error model.
16. See Anselin and Moreno (2003, p600) for details
41

Reference
Anselin L. 1988. Spatial Econometrics: Methods and Models. Dordretcht: Kluwer.
Anselin L. 2001. Rao’s score test in spatial econometrics. Journal of Statistical Planning
and Inference, 97: 113-139.
Anselin L. 2002. Under the hood: Issue in the specification and interpretation of spatial
regression models. Agricultural Economics, 17: 247-267.
Anselin, L. 2005. Exploring Spatial Data with GeoDa: A Workbook. in
https://www.geoda.uiuc.edu/documentation.php#manuals
Anselin L. and Bera A.K. 1998. Spatial dependence in linear regression models with an
introduction to spatial econometrics. in Ullah A. and Giles D. (eds.) Handbook of Applied
Economic Statistics, Marcel Dekker, New York, NY, 237-289.
Anselin L. and Moreno R. 2003. Properties of tests for spatial error components.
Regional Science and Urban Economics, 33: 595-618.
Anselin L., Bera A.K., Florax R.J.G.M. and Yoon M.J. 1996. Simple diagnostic tests for
spatial dependence. Regional Science and Urban Economics, 26: 77-104.
42

Basu, S. and Thibodeau, T.G. 1998. Analysis of spatial autocorrelation in house prices.
Journal of Real Estate Finance and Economics, 17: 61-86.
Bell K.P. and Bockstael N.E. 2000. Applying the generalized moments estimation
approach to spatial problems involving microlevel data. The Review of Economics and
Statistics, 82: 72-82.
Durbin R.A. 1998. Spatial autocorrelation: A Primer. Journal of Housing Economics, 7,
304-327
Durbin R.A., Pace R.K. and Thibodeau, T.G. 1999. Spatial autoregressive techniques for
real estate data. Journal of Real Estate Literature, 7:79-95
Goldsmith P.D. 2004. Using spatial econometrics to access the impact of swine
production on residential property values. A submission to the American Journal of
Agricultural Economics, July 2004
Graaff T., Florax R.J.G.M. and Wijkamp P. 2001. A general misspecification test for
spatial regression models: dependence, heterogeneity and nonlinearity. Journal of
Regional Science, 41(2): 255-276
43

Hepple .L.W. 2004. Bayesian model choice in spatial econometrics, in Lesage, J.P. and
Pace, R.K. (eds) Spatial and Spatiotemporal Econometrics, Advances in Spatial
Econometrics, Vol.18. Elsevier, 101-126
Hite, D., Chern W., Hitzusen F., and Randall A. 2001. Property-Value Impacts of an
Environmental Disamenity: The Case of Landfills. Journal of Real Estate Finance and
Economics, 22(2/3), 185-202.
Kelejian H.H. and Prucha I.R. 1998. A generalized spatial two stage least squares
procedure for estimating a spatial autoregressive model with autoregressive disturbances.
Journal of Real Estate Finance and Economics, 17: 99-121.
Kelejian H.H. and Prucha I.R. 1999. A generalized moments estimator for the
autoregressive parameter in a spatial model. International Economics Review, 40: 509-
533.
Kelejian H.H. and Robinson D.P. 1993. A suggested method of estimation method for
spatial interdependent model with autocorrelatted errors, and an application to a county
expenditure model. Papers in Regional Science, 72: 297-312.
Kelijian and Robinson 1995. Spatial correlation: a suggested alternative to the
autoregressive model. in Anselin L. and Florax R.J.G.M. (eds) New Directions in Spatial
Econometrics, Spring-Verlag Germany, p75-96
44

Kim C.W., Phipps T.T. and Anselin L. 2003. Measure the benefits of air quality
improvement: A spatial hedonic approach, Journal of Environmental Economics and
Management, 45: 24-39.
Mur J. 1999. Testing for spatial autocorrelation: Moving average versus autoregressive
processes. Environment and Planning A, 31:137-1382.
LeSage J.P. 1999. The Theory and Practice of Spatial Econometrics. Unpublished
manuscript available at: http://www.spatial-econometrics.com.
Pace R.K. and Gilley O. 1997. Using the spatial configuration of the data to improve
estimation, Journal of Real Estate Finance and Economics, 14: 333-340.
Paterson R.W. and Boyle K.J. 2002. Out of sight, out of mind? Using GIS to incorporate
visibility in hedonic property value models. Land Economics, 78:417-425
Ready R.C. 2004. Do landfills always depress nearby property values? Working paper,
Dept. of Agricultural Economics and Rural Sociology, The Pennsylvania State University
Ready R.C. and Abdalla C.W. 2005. The amenity and disamenity impacts of agriculture:
Estimates from a hedonic pricing model. American Journal of Agricultural Economics
87(2):314-326
45

Sneek J.M. and Rietveld P. 1997. On the estimation of the spatial moving average model.
Tinbergen Institute Discussion Paper, 97-049/4.
Trivezg F.J. and Mur J. 2004. Some proposals for discriminating between spatial process,
in Getis A., Mur J. and Zoller H.G. (eds) Spatial Econometrics and Spatial Statistics,
Palgrave MacMillan, 150-175
Wilhelmsson M. 2002. Spatial models in real estate economics. Housing, Theory and
Society, 19:92-101
46

Table 1: LM and Moran’s I tests for spatial lag model, SAR error model and SEC model
Spatial Weights Matrices Test Statistics
sW b
nW c
LM-Lag 314.37 (0.0000)
27.00 (0.0000)
LM-Error 825.08 (0.0000)
1704.30 (0.0000)
LM-SEC 734.49 (0.0000)
452.50 (0.0000)
Moran’s I 37.48 (0.0000)
72.47 (0.0000)
Notes: a. Values shows are test statistics with p-values in parentheses; b. denotes row-standardized weights matrix; sW c. denotes non-standardized weights matrix. nW Table 2: Robust LM tests for spatial lag model, SAR error model and SEC model with all possible combinations of row-standardized and non-standardized weights matrices
Spatial Weights Matrix Combination bTest Statistics
),( ss WW ) ),( nn WW,( ns WW ),( sn WW
Robust LM-Lag 133.64 (0.0000)
166.56 (0.0000)
27.48 (0.0000)
28.96 (0.0000)
Robust LM-Error 644.36 (0.0000)
1556.50 (0.0000)
825.70 (0.0000)
1706.00 (0.0000)
Note: a. Values shows are test statistics with p-values in parentheses; b. The first spatial weights matrix is for lag structure and the second one for SAR
error structure, e.g., for , the row-standardized weights matrix corresponds to the lag term, the non-standardized weights matrix corresponds to the SAR error process.
),( ns WW
47

Table 3: Bayes factors of spatial regression models Bayes factor Value
Lag ( ) / Lag ( ) sW nW 25105145.1 ×
SAR ( ) / Lag ( ) sW nW 59108269.7 × SAR ( ) / Lag ( ) sW sW 53101027.1 × SEC ( ) / SAR ( ) sW sW 124104117.3 × Note: The calculation of SEC ( ) / SAR ( ) based onsW sW 20max =θ for SEC ( ). sW Table 4: Pseudo-R2 values for spatial regression models
Spatial Weights Matrices Model
sW nW
Spatial Lag a 0.876
SAR Error b 0.812 0.817
SEC c 0.843
Notes: a. R2 value based on ML estimation; b. R2 values based on GM estimation; c. R2 value based on GMM estimation; negative variance estimate of spillover
error ( ) for suggests the unsuitability of non-standardized weights matrix for our data, also see footnote 12 of Anselin and Moreno (2003).
2φσ nW
48

Table 5: Estimation results of the OLS and spatial regression models
Variable a OLS b Lag c( ) sW SAR( ) sW SAR( ) nW SEC( ) sW
PCLmi2 0.0983 (6.8542)
0.0436 (3.0267)
0.0257 (0.9617)
0.0682 (3.8390)
0.0674 (3.3339)
WBLmi2 -0.0156 (-1.0313)
-0.0459 (-3.0809)
-0.0076 (-0.3245)
-0.0011 (-0.0625)
-0.0254 (-1.2789)
RHLmi3 0.0716 (3.9384)
0.0618 (3.4782)
0.0908 (2.6634)
0.0715 (3.9581)
0.0807 (3.0780)
Pind400 -0.2979 (-6.8373)
-0.2508 (-5.8813)
-0.3001 (-6.8210)
-0.3038 (-6.9113)
-0.3019 (-6.9438)
Pind400800 -0.118 (-2.8636)
-0.0573 (-1.4192)
-0.0494 (-1.0616)
-0.0707 (-1.6140)
-0.0824 (-1.8850)
ρ 0.2230 (16.7950)
λ d 0.6803 0.0040 2φσ 0.0639
(6.5147)
2uσ 0.0212
(44.0090)
Jarque-Bera e 476.5424 Notes: a.All other estimates for intercept, township dummies, topology variables,
structural and location characteristics of house are omitted and available from the authors; t-statistics in parentheses;
b. A White-heteroskedasticity-corrected estimation fails because of resulting short-rank of transformed design matrix X ;
c. Estimates are based on ML method and very close to the IV/2SLS estimates; for the same reason above, a 2SLS-Robust estimation by correcting for White-heteroskedasticity is not available either;
d. The GM estimation for SAR error model does not produce the variance estimate of spatial parameter;
e. Jarque-Bera test against the null hypothesis of error normality is rejected with high probability.
49