Using Data in the Goal-Setting Process Webinar September 30, 2015.
46
Using Data in the Goal-Setting Process Webinar September 30, 2015
-
Upload
horatio-hicks -
Category
Documents
-
view
219 -
download
0
Transcript of Using Data in the Goal-Setting Process Webinar September 30, 2015.

Using Data in the Goal-Setting Process
WebinarSeptember 30, 2015

2
Presenter
• Shanna Ricketts, Ph.D.– Data Strategist, Teacher & Leader
Effectiveness Unit– [email protected]

3
Student Improvement Component
• Measure A – State Assessment for reading and mathematics (for information only in 2015-16)
• Measure B – Bank of Pre-Post Assessments
• Measure C – Bank of DOE-approved growth goals
4
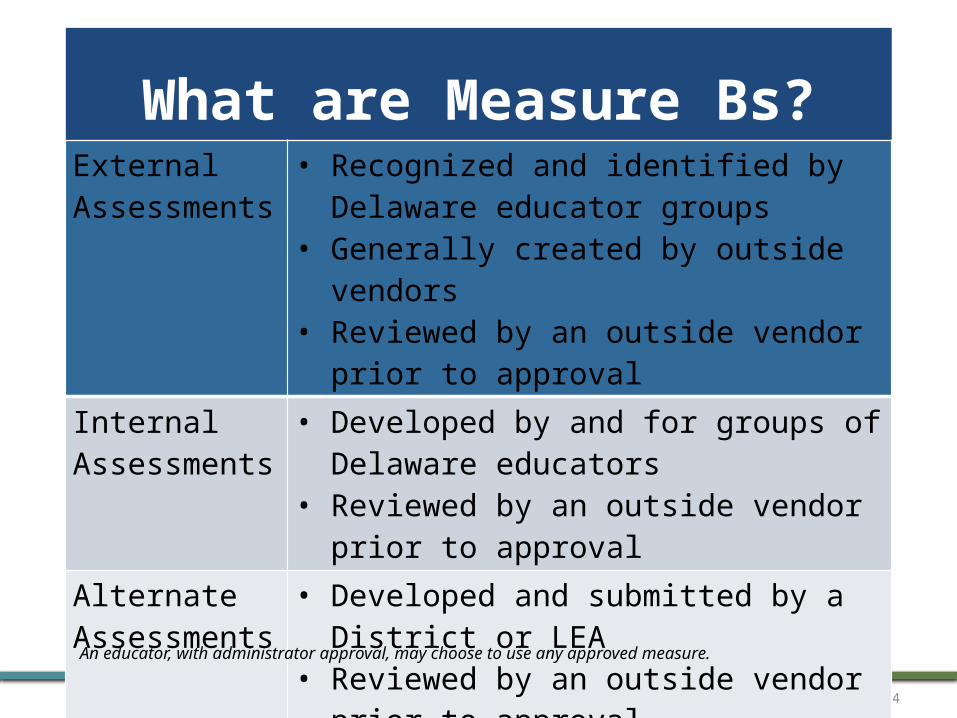
What are Measure Bs?External Assessments
• Recognized and identified by Delaware educator groups
• Generally created by outside vendors
• Reviewed by an outside vendor prior to approval
Internal Assessments
• Developed by and for groups of Delaware educators
• Reviewed by an outside vendor prior to approval
Alternate Assessments
• Developed and submitted by a District or LEA
• Reviewed by an outside vendor prior to approvalAn educator, with administrator approval, may choose to use any approved measure.

Internal Measure B Assessments
• DOE maintains a bank of 240+ pre/post assessments used as one of multiple measures for educator evaluation in the student improvement component.
5

6
Internal Measure B Assessments
• Analyses of internal Measure B assessment data (reliability, validity, & item-level analyses)
• Ongoing refinement cycle • Alternative Measure B assessments
and grants • Goal-setting support

7
Ongoing Refinement: Proposed Refinement Cycle
• Four-year cycle for refinement of Measure Bs and Cs• Led by DDOE staff, with support from educators/content experts in the field• Assessments vetted for rigor, format by outside vendor
Subject Refinement Year
Roll-OutYear
SS & Arts 14-15 15-16
CTE 15-16 16-17
Math & ELA 16-17 17-18
Languages & Other
17-18 18-19

NEW RESOURCES

9
www.tinyurl.com/ddoe-gs-suite
10
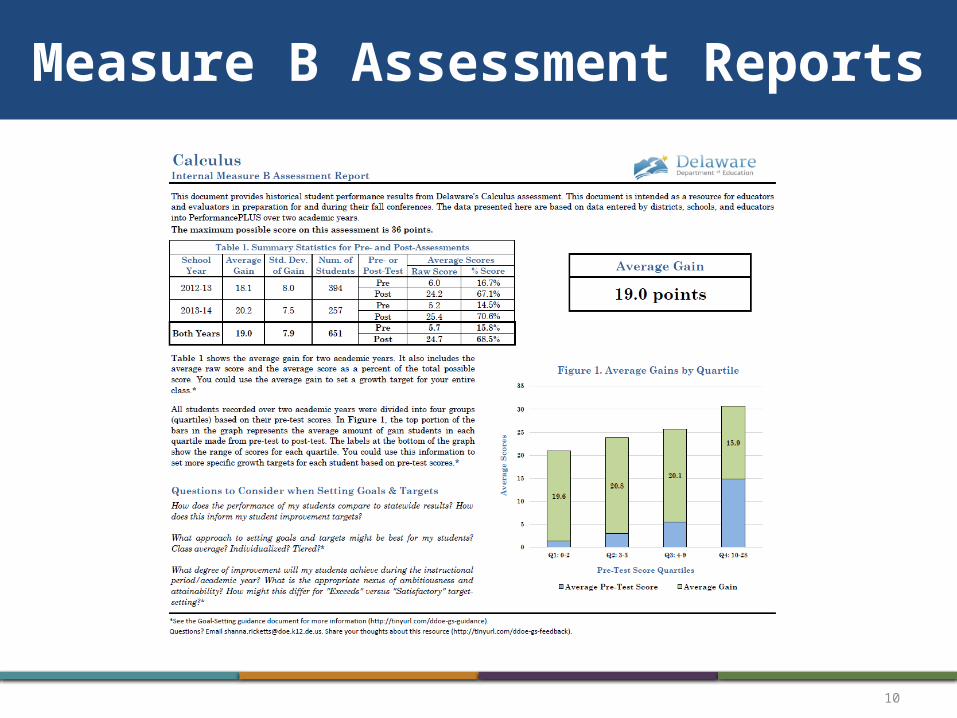
Measure B Assessment Reports

11
Goal-Setting Guidance Document

12
Goal-Setting Excel TemplatesClass Average Approach

13
Goal-Setting Excel TemplatesIndividualized Approach

14
Goal-Setting Excel TemplatesTiered Approach

GOAL-SETTING WITH
MEASURE B DATA
15

16
STUDENT IMPROVEMENT COMPONENT (2015-16)
• Group 1 Educators– 2 data points within Measure B
• Group 2 Educators– 2 Measure Bs
OR
– 1 Measure B and 1 Measure C
• Group 3 Educators– 2 Measure Cs
See the DPAS-II Guide Revised for Teachers, Updated August 2015http://www.doe.k12.de.us/cms/lib09/DE01922744/Centricity/Domain/375/DPAS_II_Guide_for_Teachers_2015-16.pdf

17
How do you set goals?

18
Steps in Goal-Setting
Step 1: Gather and analyze base dataStep 2: Using available data, set ambitious targetsStep 3: Calculate post-test results and determine rating

19
Step 1: Gather and analyze baseline data

20
PerformancePLUS Reports
The following reports are available for Internal Measure B assessments:
– Assessment Scores Reports– Item Analysis by Question– Item Analysis by Student– Item Analysis by Incorrect Responses

21
Assessment Scores Report
• Displays performance by section of the assessment (if assessment is set up with sections) with various sorting capabilities
• The check boxes on the far left side allows you to build focus/intervention groups on the fly
• The boxes include the raw score and percentage score

22
Assessment Scores Report Options
• Options include – showing the students code, building, grade, teacher, class, race, and student group. Choose to show scores, default levels, scores and default levels, assessment specific levels, or to show scores and assessment specific levels.

23
Item Analysis by Question Report
• Displays results question by question on a particular assessment• Shows how many students answered each possible response• Click on the colored bar to see which students answered each possible
response• Click on a students name to see how they performed on the whole
assessment• Options include the ability to compare results to the overall district and
state

24
Item Analysis by Student Report
• View each student’s answer and sortable by column• Color blocks indicate proficiency level• The RED boxes indicate INCORRECT answers

25
Item Analysis by Student Report Options
• Options include – showing the students code, building, grade, teacher, class, race, and student group. Limit questions by question type. Choose to see the scores by percentage or raw score. Display all answers or just incorrect answers.

26
Item Analysis by Incorrect Responses Report
• Displays each item and lists the students who answered incorrectly and what option they chose.
• You can easily see the correct answer and the standard that was addressed.
• Only for multiple choice questions.• No options for this report.

27
Step 2: Using available data, set high-quality targets
• How will you set targets?– Based on the class average?– Based on the percentage of students
that meet a specific goal?• Are the targets unique to each student?• Are the targets unique to groups of
students?
– Does the amount of growth represent significant learning over the school year?

28
Step 2: Using available data, set high-quality targets
• How will you record progress, and determine whether the targets were met at the end of the school year?–Which students will be
included/excluded?–Will you record data in a spreadsheet?– Is it clear to both you and your
administrator how it will be determined whether you met your targets?

29
Sample Goal Setting Approaches
1. Class average approach: Using the class average
2. Individualized approach: Setting individual targets for each student with students scoring above some threshold (e.g. 85%) staying above that threshold
3. Tiered approach: Setting targets for different groups of students based on their performance on the pre-test

30
Mathematics Grade 4Class Average Approach
• Class average approach:– Class Pre-Test Average: 8 points out of
26 points

31
Measure B Assessment Reports
32
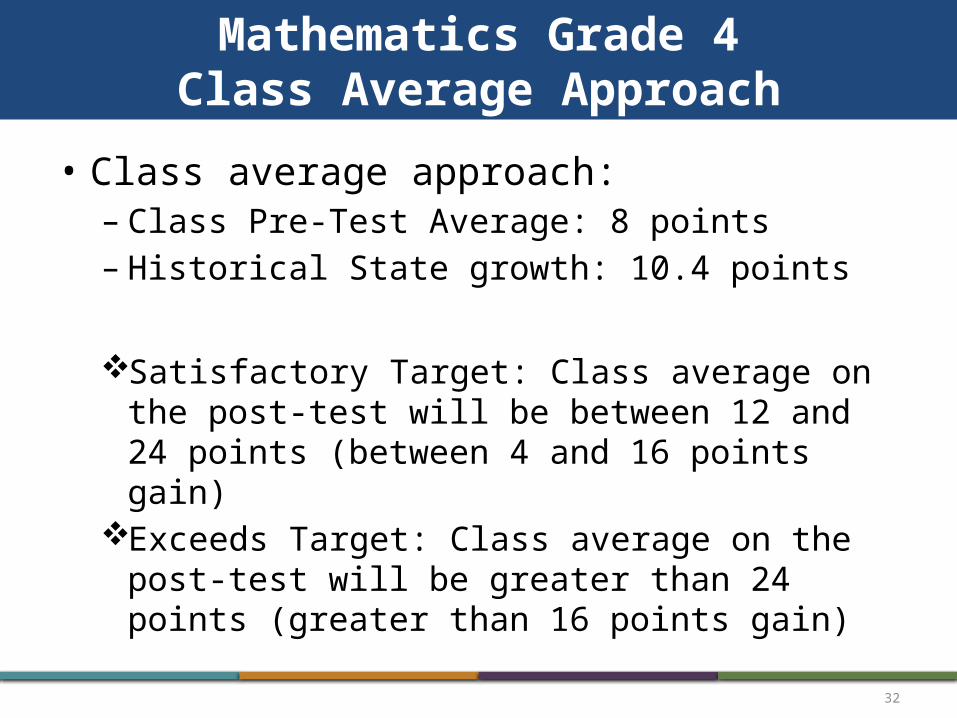
Mathematics Grade 4Class Average Approach
• Class average approach:– Class Pre-Test Average: 8 points– Historical State growth: 10.4 points
Satisfactory Target: Class average on the post-test will be between 12 and 24 points (between 4 and 16 points gain)
Exceeds Target: Class average on the post-test will be greater than 24 points (greater than 16 points gain)
33
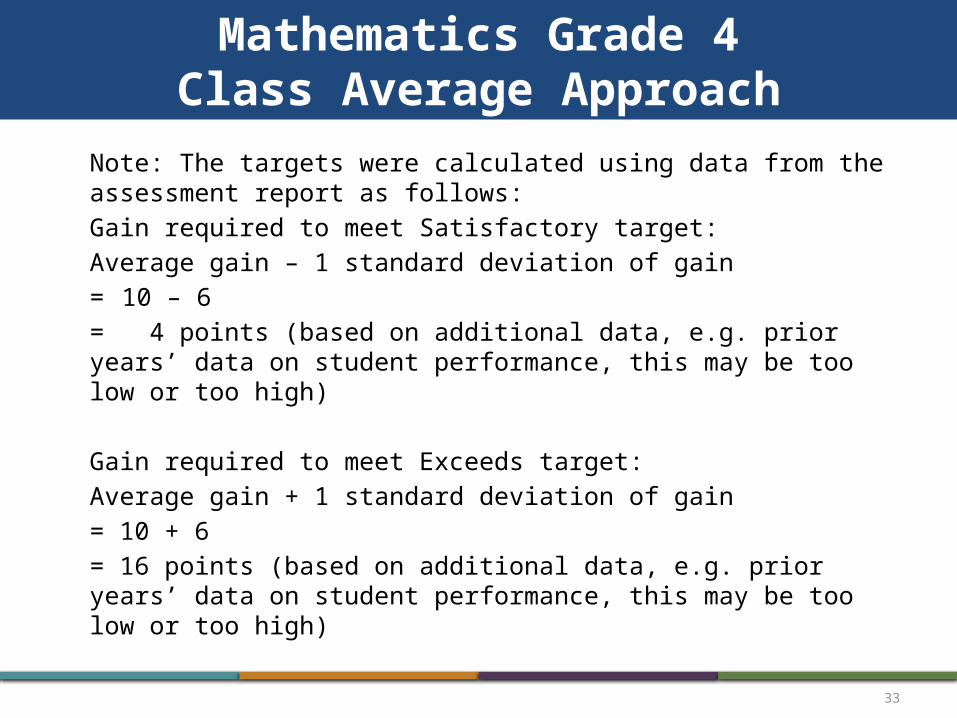
Mathematics Grade 4Class Average Approach
Note: The targets were calculated using data from the assessment report as follows:
Gain required to meet Satisfactory target: Average gain – 1 standard deviation of gain
= 10 – 6 = 4 points (based on additional data, e.g. prior years’ data on student performance, this may be too low or too high)
Gain required to meet Exceeds target:Average gain + 1 standard deviation of gain
= 10 + 6= 16 points (based on additional data, e.g. prior years’ data on student performance, this may be too low or too high)

34
Mathematics Grade 4Class Average Approach
• Class average approach:– Class Pre-Test Average: 8 points– Historical State growth: 10.4 points
Satisfactory Target: Class average on the post-test will be between 12 and 24 points (between 4 and 16 points gain)
Exceeds Target: Class average on the post-test will be greater than 24 points (greater than 16 points gain)

35
Mathematics Grade 4Class Average Approach
36
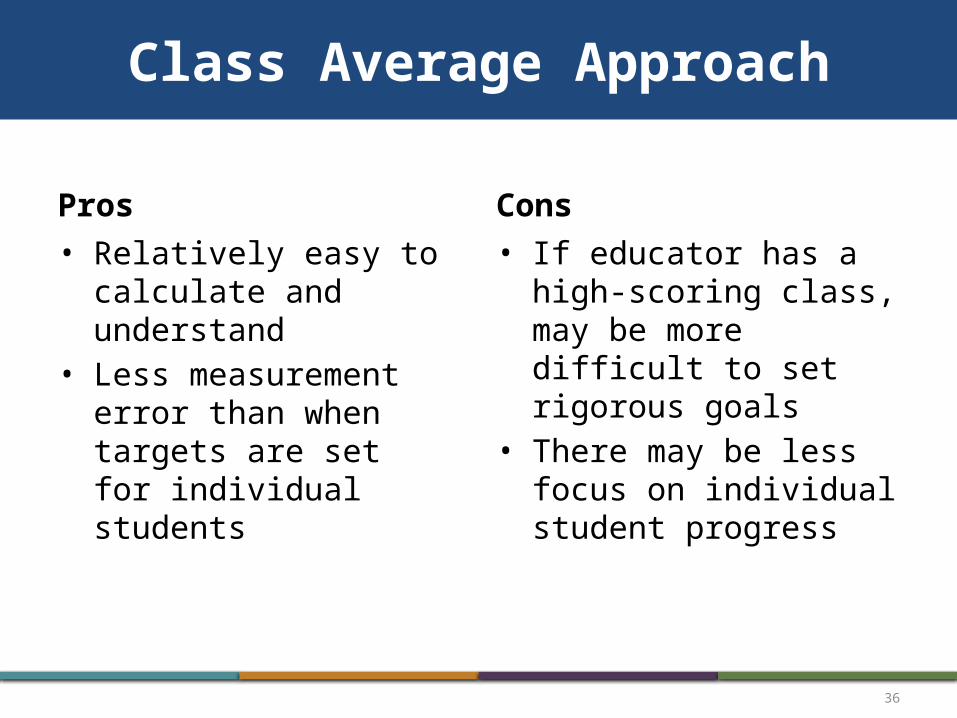
Class Average Approach
Pros• Relatively easy to
calculate and understand
• Less measurement error than when targets are set for individual students
Cons• If educator has a high-
scoring class, may be more difficult to set rigorous goals
• There may be less focus on individual student progress

37
Mathematics Grade 4Individualized Approach
• Individualized approach:
Goal: Each student gains 10 points or reaches a score of 85% or better
Satisfactory Target: 50%- 69% of students meet target
Exceeds Target: 70% or more of students meet target

38
Mathematics Grade 4Individualized Approach

39
Individualized Approach
Pros• More focused on
individual student
Cons• Some students may
not have much room to grow on the assessment
• More calculation needed
• More measurement error around test score for each individual student

40
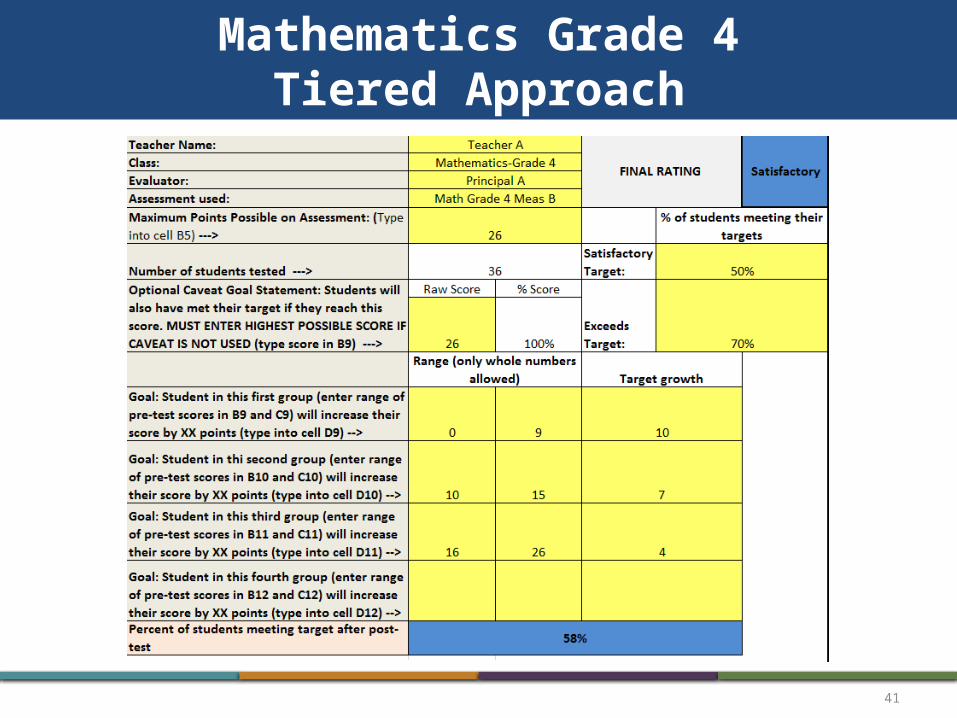
Mathematics Grade 4Tiered Approach
• Tiered Approach– Pre-Test Scores
• Group 1: students with scores below 10 points• Group 2: students with scores of 10-15 points• Group 3: students with scores greater than 15 points
Goal: Students in Group 1 gain 10 points; Students in Group 2 gain 7 points; Students in Group 3 gain 4 points
Satisfactory Target: 50% - 69% of students meet target
Exceeds Target: 70% or more of students meet target
41
Mathematics Grade 4Tiered Approach
42
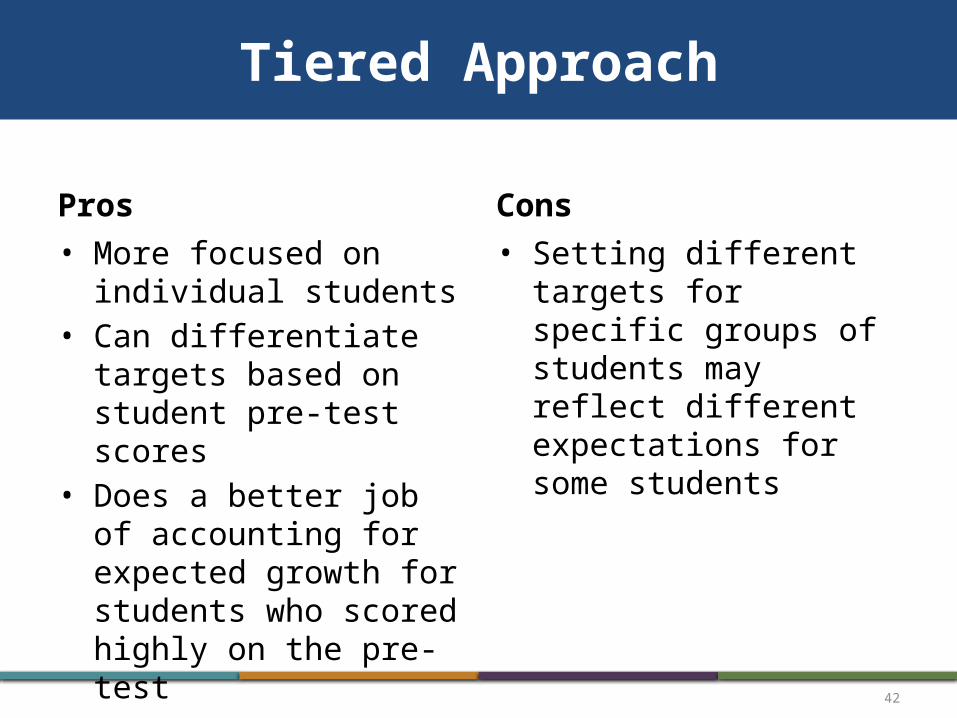
Tiered Approach
Pros• More focused on
individual students• Can differentiate
targets based on student pre-test scores
• Does a better job of accounting for expected growth for students who scored highly on the pre-test
Cons• Setting different
targets for specific groups of students may reflect different expectations for some students

43
Step 3: Calculate Post-Test Results & Determine Rating

44
Assessment Scores Report
• Run the report with multiple assessments to compare pre and post scores
• Use filters to exclude inactive students, only students who have taken both assessments, select sub groups
• Export to excel to run calculations• Use the export function at the bottom of the screen for a clean export

45
From each report you can…

46
Questions?
• Questions email:– Shanna Ricketts– [email protected]
• Questions about PerformancePLUS email:– Brenda Dorrell– [email protected]