Using a Regression Discontinuity Design to Estimate the ...
31
1 Using a Regression Discontinuity Design to Estimate the Impact of Placement Decisions in Developmental Math Introduction A large proportion of the high school graduates who attend a postsecondary institution take at least one developmental, remedial, or basic skills course in either mathematics or English. 1 Recent evidence suggests that nationwide approximately 60 percent of all incoming freshmen enroll in at least one developmental education course (NCPPHE & SREB, 2010). The rationale behind placing students in developmental courses is based on the premise that such coursework prepares students for higher-level coursework (Boylan, Bliss, & Bonham, 1994; 1997; Lazarick, 1997). However there are significant costs associated with developmental education. Current estimates indicate that the annual cost of remedial education ranges between $2 billion (Strong American Schools, 2008) and almost $4 billion (Schneider & Yin, 2011). And these estimates are not taking into account the opportunity costs for students of being enrolled in developmental education (Author, 2008). Therefore understanding the effectiveness of placement decisions in developmental education is important. There is considerable debate on the effects and benefits of remediation in college. Results from rigorous studies present contradictory findings (Bettinger & Long, 2009; Boatman & Long, 2010; Lesik, 2006; Calcagno & Long; 2008; Martorell & McFarlin, 2011; Moss & Yeaton, 2006; Scott-Clayton & Rodriguez, 2012). Most of these studies evaluated the impact of taking a remedial course versus a college level course (i.e., they did not differentiate the impact of different courses within the developmental math sequence), and 1 The terms basic skills, developmental, remedial and preparatory math education are frequently used interchangeably though they have different conceptual origins, imply differing educational strategies and carry some political baggage. Our preferred terms are either developmental or preparatory math.
Transcript of Using a Regression Discontinuity Design to Estimate the ...
1
Using a Regression Discontinuity Design to Estimate the Impact of Placement
Decisions in Developmental Math
Introduction
A large proportion of the high school graduates who attend a postsecondary
institution take at least one developmental, remedial, or basic skills course in either
mathematics or English.1 Recent evidence suggests that nationwide approximately 60
percent of all incoming freshmen enroll in at least one developmental education course
(NCPPHE & SREB, 2010). The rationale behind placing students in developmental courses
is based on the premise that such coursework prepares students for higher-level coursework
(Boylan, Bliss, & Bonham, 1994; 1997; Lazarick, 1997). However there are significant costs
associated with developmental education. Current estimates indicate that the annual cost of
remedial education ranges between $2 billion (Strong American Schools, 2008) and almost
$4 billion (Schneider & Yin, 2011). And these estimates are not taking into account the
opportunity costs for students of being enrolled in developmental education (Author, 2008).
Therefore understanding the effectiveness of placement decisions in developmental
education is important.
There is considerable debate on the effects and benefits of remediation in college.
Results from rigorous studies present contradictory findings (Bettinger & Long, 2009;
Boatman & Long, 2010; Lesik, 2006; Calcagno & Long; 2008; Martorell & McFarlin, 2011;
Moss & Yeaton, 2006; Scott-Clayton & Rodriguez, 2012). Most of these studies evaluated
the impact of taking a remedial course versus a college level course (i.e., they did not
differentiate the impact of different courses within the developmental math sequence), and
1 The terms basic skills, developmental, remedial and preparatory math education are frequently used interchangeably though they have different conceptual origins, imply differing educational strategies and carry some political baggage. Our preferred terms are either developmental or preparatory math.
2
focused on long-term outcomes that are not always relevant to students enrolled in these
courses because they may not align with their objectives and they may occur too far in the
future to be observable (e.g., total numbers of credits completed, degree attained, and
transfer to a four-year college) (Bettinger & Long, 2009; Calcagno & Long; 2008; Martorell
& McFarlin, 2011; Scott-Clayton & Rodriguez, 2012). It is easy to misinterpret the results of
these studies, either by not considering the differing learning objectives with which students
enter post-secondary institutions or by overgeneralizing results that apply only to students at
the cusp of needing developmental education. The latter problem is especially common with
studies that use a regression-discontinuity design, which we discuss in detail below. In
response to disappointing results in many of these studies, a number of policy makers
around the U.S. have used this evidence to advocate for reducing the funding for
developmental education, or eliminating developmental education altogether. Although
reducing or eliminating access to developmental education would reduce the number of
students who receive such education and do not achieve their educational objectives, doing
so may create a different problem given that enrolling under-prepared students in college-
level courses could further decrease their success rates and increase already high dropout
rates and could adversely affect the experiences of students who are not under-prepared.
We argue that given that colleges have long and varied sequences of math courses,
only some of which are considered remedial or developmental, the most relevant policy
question is not whether remediation is effective or productive, but instead what the impact is
of the individual decisions and procedures inherent in the student placement process. These
impacts are a good focal point for researchers and policymakers aiming to improve students’
community college experiences and outcomes because (a) the initial placement decisions are
the primary determinant of a student’s community college trajectory, and (b) the data and
3
research methods produce valid impact estimates right at the cut points between different
college placement levels.
The findings presented in this paper examine mathematics placement decisions and
student outcomes in a very large community college district, where students were initially
placed into one of four distinct math levels: arithmetic, pre-algebra, elementary algebra, or
intermediate algebra. For different colleges we present the effects of being placed below the
placement cut point between each of these levels. That is, we present how student outcomes
are affected by being placed in arithmetic instead of pre-algebra, in pre-algebra instead of
elementary algebra, or in elementary algebra instead of intermediate algebra. Measured at the
cut points, these impact estimates evaluate the quality of the placement decisions themselves.
Our study estimates the impact of placement decisions in the preparatory math
sequence over time by using a discrete-time survival model (Singer & Willett, 2003) within a
regression discontinuity design (RDD) framework (Lesik, 2006). The relevant question (at
least the one that can be answered rigorously) is whether placement decisions are effective. If
they are, students at the margin do similarly well regardless of which course they are placed
into. If they are not, this is either because students are placed below or above their level of
expertise or because the courses they are placed into are poorly taught or otherwise
ineffective for them. It is impossible to conclusively disentangle these different possibilities.
Thus, our analyses estimate the impact of placements, which do not necessarily generalize to
the coursework and services associated with those placements.
Our outcomes of interest all relate to the students’ educational attainment: (i)
whether they passed the next course of the sequence (i.e., the higher-level course above the
cut point), (ii) whether they accumulated over 30 credits in degree applicable courses, and
(iii) whether they accumulated over 30 credits in transfer level courses. We use data from the
4
Los Angeles Community College District (LACCD), which is the largest community college
district in California and one of the largest in the U.S., serving a very diverse population of
students.
Two specific research questions guide the study: 1) for a student at the margin, does
a longer road to success produce better results? and 2) is greater likelihood of success worth
the extra time and effort? We chose a discrete-time survival model within an RDD
framework to address these questions. We use RDD because this is a technique that enables
the researcher to make causal inferences when randomization is not feasible. The general
idea is that, controlling for the score on their placement test, students at the margin are
essentially “assigned” at random to one of two placements (the one above and the one
below the cut point), provided that they do not know what their score is relative to the cut
point as they are taking the test and provided that their score is not manipulated afterwards.
We estimated our RDD models within the context of discrete-time survival models to allow
the impacts to vary over time. Descriptive evidence suggests that community college
students delay enrollment in developmental math courses (Bailey, Jeong & Cho, 2010;
Author, 2013c), and that these students spend a substantial amount of time (five years on
average) enrolled before attaining a degree or certificate or transferring to a four-year college
(Author, 2008). The latter finding may reflect the fact that many community college students
attend college part-time. The methodological strategy we used enabled us to get precise
estimates of the effects of different placements on educational outcomes over time,
including the additional time that certain placements may add to a student’s achievement of
those outcomes.
Results of our study suggest that there is variation in the effectiveness of the
placement decisions both by math level (i.e., students might benefit from being placed into
5
pre-algebra first rather than moving straight into elementary algebra but they might not
benefit from being placed into arithmetic before moving into pre-algebra) and by college (i.e.,
students might benefit from being placed into arithmetic in college A but not in college B).
In terms of the short-term outcomes (e.g., passing the following course in the sequence), we
found that in some colleges the initial “penalty” of being placed in a lower level math course
(i.e., a lower initial likelihood of passing the higher-level course in the sequence) disappears
over time. This was not the case in other colleges where such a “penalty” remained even
after five years. These findings suggest that studies that focus on a limited set of outcomes
and do not follow students long enough may produce erroneous conclusions regarding the
effectiveness of developmental education.
We argue that RDD is a technique that can be used by individual colleges and large
community college systems to determine whether the cut scores for the placement exams
were set correctly. Under a well-designed placement policy one would expect that the results
of the RDD models would yield placement coefficients close to zero (Robinson, 2011).
When the coefficients are negative, the results suggest that the students at the margin are not
benefiting from being placed in a remedial class and therefore that the cut-scores should be
lowered so these students are placed directly in the higher-level course. Similarly, when the
coefficients are large and positive, the results suggest that the students at the margin are
benefiting substantially from the developmental preparation, and that the cut scores should
increase so that students who score just above the margin are also placed in the
developmental math course.
The structure of this paper is as follows: in the next section we present a review of
the literature followed by a brief description of the current assessment and placement
policies in math at the LACCD. The following methods section includes a description of the
6
data, the sample, and the models estimated. This is followed by a results section, which in
turn is followed by conclusions and policy implications.
Math Assessment and Placement Policies in the Los Angeles Community College
District
Because California community college districts operate under a decentralized
governance structure, districts are granted a significant amount of discretion over how they
place students in course sequences and when students are placed in developmental math or
English. Unlike other districts in California, the LACCD further decentralizes decision-
making about developmental education placement to each individual college (Author, 2013a;
Author, 2013b. As a result, LACCD colleges have autonomy in three key areas in terms of
who is assigned to developmental education: selecting a placement instrument, setting cut
scores, and selecting so-called “multiple measures”, which represent a legally mandated
alternative route through which students can challenge their test score-indicated placements.2
Placement instrument: Colleges can use a wide variety of placement instruments
to assign students to developmental education. These instruments include standardized tests,
student interviews, academic transcripts, and attitude surveys (CCCCO, 2011). Colleges
using standardized tests have the choice of selecting a state-approved instrument or
developing their own, which, however, requires the college to prove its validity. State-
approved instruments in California include: College Board’s ACCUPLACER, ACT’s
COMPASS, UC/CSU’s MDTP, and the CASAS (Comprehensive Adult Student Assessment
Systems). All nine LACCD colleges use standardized tests to determine developmental
education placement. This decision reflects faculty perceptions that a standardized test is the
most efficient and effective instrument to capture a student’s math knowledge and ability. 2 Multiple measures are used infrequently but may cause a significant percentage of students to be placed in a higher-level course than their placement test score would have supported (Author, 2013d).
7
Cut scores: After selecting an assessment, college faculty and administrators have
the freedom to select cut scores to sort students into different courses, including
developmental courses. In their research on the math placement process in LACCD,
Kosiewicz et al. (2013) found that this score-setting process usually involved a deliberate
trial-and-error calibration effort by math faculty, who tried to avoid placing students in
classes for which they were not academically ready. Because student characteristics and
course offerings varied by college, the cut points between placement levels varied
considerably across the colleges as well.
The colleges reported using several procedures to calibrate their cut scores
(Kosiewicz et al., 2013). Most common was for several math faculty members to take the
tests themselves and then come to an agreement about what scores would indicate a
student’s readiness for each course in the sequence. The test vendors’ recommendations
would also have been considered when a new instrument was first adopted. In earlier years,
the state required period re-evaluation of placement procedures, but during our study period
those re-evaluations were done less frequently, usually prompted by dissatisfaction of faculty
with the preparation level of the students enrolled in their particular courses. Some of the
colleges in our study compared the academic success of students placed into a given level via
a placement test with that of those who progressed to that level from preceding courses and
used the resulting information to calibrate placement scores.
Notably, the calibration processes we encountered were largely informed by faculty
perceptions and satisfaction with the level of student preparation for each course and on
student performance in that particular course. Neither state regulations for the validation of
cut points nor the procedures we observed included information linking initial placements
with subsequent success in the course sequence. Though state accountability measures have
8
more recently focused on student movement from the initial level to success in at least one
subsequent level, that information has not been systematically used to calibrate or improve
placement procedures.
Multiple Measures: Title 5 of the California Code of Regulations requires
community colleges to consider information other than a student’s assessment score to make
placement decisions. Known as “Multiple measures”, these measures are intended to give
emphasis to other cognitive and non-cognitive factors that play a role in determining student
performance. According to the CCCCO, a number of factors can be treated as multiple
measures, including, for example, scores from additional standardized placement tests,
writing samples, performance-based assessments, surveys and questionnaires, and past
educational experience.
Since no regulation exists on how much credit a student can earn from multiple
measures, LACCD colleges awarded students at most five points in addition to their test
score; two colleges within the district actually subtracted points from student test scores. On
the whole, students received multiple measure points if they reported taking and receiving
high grades in advanced high school math. Very few colleges awarded students multiple
measure points for non-cognitive factors like their motivation or self-efficacy. Preference to
treat cognitive versus non-cognitive factors as multiple measures stemmed from a general
consensus among faculty that they lacked an understanding of how non-cognitive factors
ought to be factored in placement decisions.
Methods
Regression Discontinuity Design The research presented here is based on an
analytical framework known as a “regression discontinuity design” (RDD) that depends on
the fact that students’ assignment to specific entering levels of math instruction is almost
9
exclusively based on their score on an initial placement test. As described above, the
different LACCD colleges use specific pre-determined point cutoffs in the distribution of
the placement test scores to place students in specific courses. After statistically controlling
for the placement test score, any differences in a student’s subsequent outcomes can be
reliably attributed to the placement decision itself, i.e., the place in the test score distribution
where the cut point was set. As discussed in the introduction, this RDD method has been
widely used in other research of community college placement policies and remedial
education programs (Boatman & Long, 2010; Calcagno & Long; 2008; Martorell & McFarlin,
2011; Moss & Yeaton, 2006; Scott-Clayton & Rodriguez, 2012). As a viable alternative to
randomized control trials, RDD studies have been used in program evaluation and policy
research across a wide range of policy areas, ranging from labor research to financial analysis
to medical research (Angrist & Lavy, 1999; Gamse et al, 2008; Robinson, 2011; Urquiola &
Verhoogen, 2009; Zuckerman, Lee, Wutoh, Xue, & Stuart, 2006). The inherent validity of
their causal inferences is considered on par with fully experimental randomized control trials
(Shadish, Cook & Campbell, 2002).
Figure 1 illustrates how RDD works in the context of this particular study. It depicts
the relationship between an educational outcome on the Y-axis and the initial placement test
score on the X-axis. (The outcome could be attainment of a certain number of math credits
or successful completion of a given course level). As illustrated with the individual data
points shown in the figure, the hypothesized relationship between the initial placement score
and attainment of the subsequent outcome is positive: students scoring higher on the
placement test are predicted to be more successful college students. As indicated with a
vertical line, there is a cut point at point X in the distribution of the placement test score.
Students who score above this cut point are placed in a higher-level class (e.g., elementary

10
algebra) and students who score below the cut point are placed in a lower-level class (e.g.,
pre-algebra). The visible shift in the relationship between the placement test score and the
outcome is an indication of the effect of the placement decision. By statistically controlling
for the placement test score, the magnitude and statistical significance of this shift can be
precisely estimated.
Figure 1. The Mechanics of Regression Discontinuity
As mentioned in the introduction, our study differs from other research on the
effects of community college placement policies in that (a) it estimates placement effects at
multiple points in the distribution of placement test scores, and (b) it uses discrete time
hazard analysis (Singer & Willet, 2003) to describe how placement effects develop over time.
These refinements are important because placement effects cannot be assumed to be
11
constant throughout the distribution of placement test scores and because placement effects
are unlikely to be constant over time. That is, a student who is placed in pre-algebra instead
of elementary algebra may take longer to complete elementary algebra but may ultimately
have a higher likelihood of doing so. Thus, a placement effect estimated after six months
may be negative while the same effect estimated 12 months later might be positive. Similarly,
the effect of placement in a lower-level course may be positive at the cut point between
arithmetic and pre-algebra, but may be negative at the next higher cut point between pre-
algebra and elementary algebra.
The precision of RDD estimates depends on the size of the analysis sample and the
degree to which the sample is closely clustered around the cut point of interest (Murnane &
Willett, 2011; Schochet, 2008). Sophisticated RDD estimation procedures consider these
properties by establishing an “optimal bandwidth” for each estimate, which optimizes the
tightness of the distribution and the size of the available sample. We use the Fan and Gijbels
(1996) procedure to establish optimal bandwidths for all estimates. We conducted sensitivity
analyses to ensure that this procedure did not materially affect the estimated placement
effects and found no such interference. Detailed results of these sensitivity tests are available
from the authors.
Discrete Time Hazard Analysis Typically, estimates of the effects of community
college placement decisions focus on outcomes at a given point in time. For example, a
study may estimate whether a student graduates with a college degree or successfully
transfers to a four-year college within a two-year follow-up period. In this study we move
beyond these point-in-time outcomes and estimate how outcomes (and placement effects)
change over time. To conduct such analyses we use a framework developed by Singer &
Willet (2003), in which student-level outcomes are transformed into student-time units (in
12
this case, student-quarters), thus creating multiple observations for each individual sample
member. This framework was used to investigate the effect of course placement on the
successful completion of the next course of each college’s remedial math sequence, the
completion of 30 degree-applicable credits, and the completion of 30 transferable credits.
We conducted separate outcome analyses for each of these student-quarter
observations to estimate the effects of placement decisions at each specific time point. By
converting the resulting regression coefficients into predicted outcome variables (e.g.,
quarterly educational attainment variables) we were then able to present cumulative
incidence profiles for outcomes such as credit attainment and successful completion of
milestone math courses. As detailed by Singer & Willet (2003), this method maximizes the
use of available data by estimating each time-specific effect on the entire available sample for
that time point. As a result, effects for time periods close to the initial placement test are
more precisely estimated than they would have been had the entire sample been constrained
to students with a minimum amount of available follow-up (e.g., 36 or 48 months). This is
especially important in research involving community college students, many of whom attain
their educational objectives across multiple episodes with frequent and sometimes lengthy
interruptions.
A concern with discrete time hazard analyses is the fact that person-time
observations are serially correlated. Without appropriate statistical adjustments such serial
correlation can bias the standard errors of regression estimates considerably. To address this
concern we used the SAS (version 9.3) software’s survey logistic regression procedure. This
method accounts for the correlation that exists between observations of the same student
across time periods by adjusting the degrees of freedom so that standard errors are
13
computed using the number of students in the sample, rather than the number of person-
time observations (Allison, 2005).
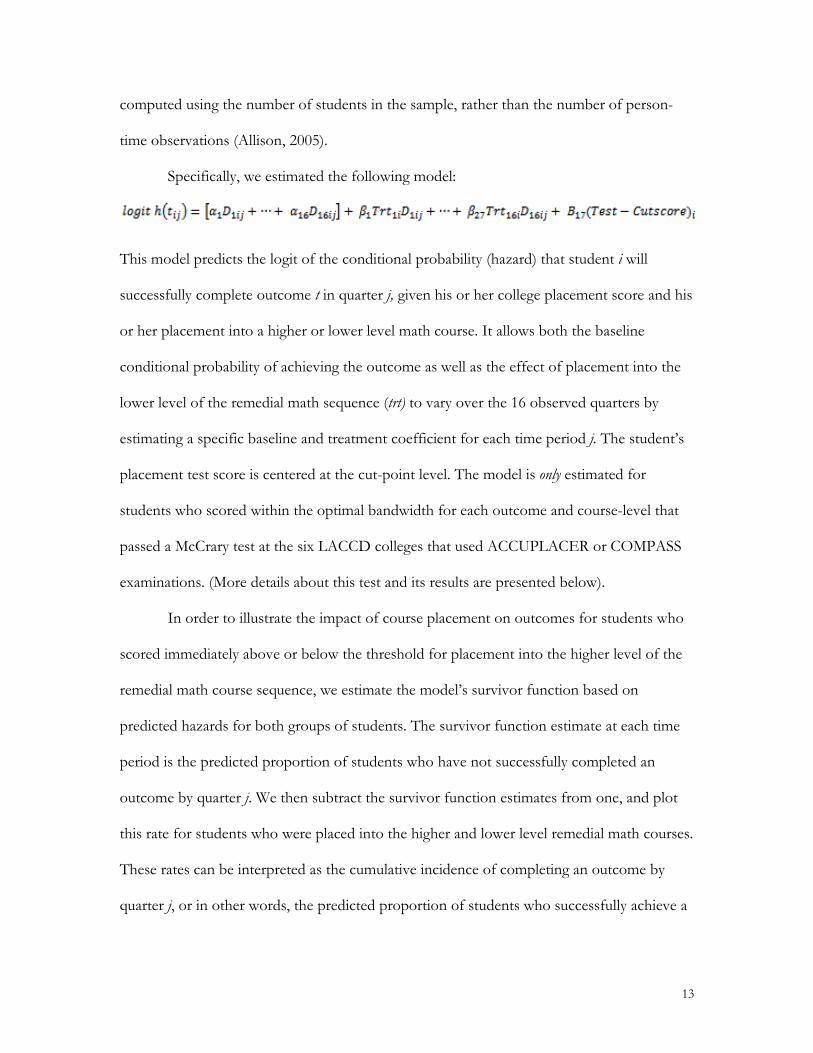
Specifically, we estimated the following model:
This model predicts the logit of the conditional probability (hazard) that student i will
successfully complete outcome t in quarter j, given his or her college placement score and his
or her placement into a higher or lower level math course. It allows both the baseline
conditional probability of achieving the outcome as well as the effect of placement into the
lower level of the remedial math sequence (trt) to vary over the 16 observed quarters by
estimating a specific baseline and treatment coefficient for each time period j. The student’s
placement test score is centered at the cut-point level. The model is only estimated for
students who scored within the optimal bandwidth for each outcome and course-level that
passed a McCrary test at the six LACCD colleges that used ACCUPLACER or COMPASS
examinations. (More details about this test and its results are presented below).
In order to illustrate the impact of course placement on outcomes for students who
scored immediately above or below the threshold for placement into the higher level of the
remedial math course sequence, we estimate the model’s survivor function based on
predicted hazards for both groups of students. The survivor function estimate at each time
period is the predicted proportion of students who have not successfully completed an
outcome by quarter j. We then subtract the survivor function estimates from one, and plot
this rate for students who were placed into the higher and lower level remedial math courses.
These rates can be interpreted as the cumulative incidence of completing an outcome by
quarter j, or in other words, the predicted proportion of students who successfully achieve a

14
given outcome. We generate confidence intervals for these estimated rates using
Greenwood’s approximation (Greenwood, 1926).
Two Potential Sources of Bias RDD estimates are subject to two distinct types of
bias. The first stems from the fact that students may be able to enroll in classes to which
they were not assigned based on their placement test result. This may occur when students
skirt the official placement decisions or when their placement decision is based on factors
other than their placement test result. As discussed in the introduction, California
community colleges are mandated to use “multiple measures” to inform placement decisions
because exclusive use of standardized placement tests is considered disadvantageous to
certain groups of students (Author, 2013a). Five out of the six colleges in the sample used
multiple measures to place students. For these colleges, test scores were adjusted to take into
account these decisions.
In addition to the “multiple measure” cases, we know that some students were able
to enroll in a class other than the one they were formally assigned to. Because of
administrative controls this number is very small. Fewer than 10 percent of the sample first
enrolled in a class other than the one they were formally assigned to. To avoid biasing the
results, these students are also considered “cross overs” in our analysis and are treated as if
they had been enrolled in the class in which they were placed. (In random assignment-based
research the estimates resulting from this conservative analytical approach are known as
“Intent to Treat” or “ITT” estimates).
A more serious type of bias is one in which the placement test results themselves are
manipulated to achieve a specific placement outcome. This can happen, for example, when
instructors help students as they take the test, correct items or manipulate scores, or allow
students to retake the test if they score close to a cut point. In general, the ACCUPLACER
15
and COMPASS placement tests used by the LACCD colleges we studied do not allow for
such manipulation and we have no indication that any such manipulation occurred during
the study period for our sample. However, because the integrity of the testing and placement
process is so crucial for the validity of RDD studies like these, we also used the McCrary test
(McCrary, 2008),3 which is specifically developed to detect these types of manipulations.
This test looks for anomalies in the distribution of subject test scores across the cut points.
(A spike of scores just above a cut point would indicate possible manipulation of test results
to place more students in a higher-level course). Across the 20 comparisons presented in this
paper we found 11 cases where we could not statistically rule out such manipulation. We
excluded all of these cases from the findings presented in this paper. Therefore, we are
confident that the estimates presented in this paper represent unbiased effects of the
placement decisions associated with students’ placement test scores.
Interpretation of the Results A limitation of RDD research is that estimated effects
apply only “at the cut point”. That is, they represent what would have happened to a student
scoring just below the cut point if that same student would have scored just above the cut
point. This places important limitations on the interpretation of subsequent placement
effects. If a marginal student who is placed in pre-algebra would have done better had they
been placed in elementary algebra this does not mean that all students in pre-algebra would
have done better in the higher-level course or that pre-algebra is ineffective or a waste of
time. Thus, the best way to interpret such a negative marginal effect is that the cut point is
too high: it should be lowered until a marginal student neither benefits nor suffers from
being placed on either side of the cut point. (Because there is a cost associated with initially
3 For a detailed presentation of the use of this test see the Appendix.
16
placing a student in a lower-level course it may be acceptable or even desirable if the effect
of placement above the cut point is modestly negative).
Data
The present study describes the math placement trajectories and subsequent
educational outcomes for a sample of 16,096 first-time community college students in six
community colleges in the LACCD. These students took a standardized placement test
(either the ACCUPLACER or the COMPASS) between the summer of 2005 and the spring
of 2008, and subsequently enrolled in college. At the time of their enrollment they
completed an education planning form, which for most students included the following
demographic background variables: age, gender, race and ethnicity, whether English was
their primary language, and residence status (i.e., U.S. citizen, permanent resident and other
visa). The outcome data included quarterly enrollment data (for up to four quarters per year;
three in the school year and one in the summer), quarterly course completion and credit
attainment data, and variables capturing a number of educational outcomes (i.e., passed the
following course in the math trajectory, and total degree applicable and transfer level credits
attained). We transformed these data such that each student in our sample has a series of
quarterly status variables beginning with the quarter of their enrollment (usually immediately
following the placement test) and ending with the final quarter of the 2010-11 school year.
We then transformed those data into a series of student-quarter observations for use in the
discrete-time hazard analyses described above. We did not pool these data across the six
colleges but instead estimated separate effects for each cut point in each college for which
the distribution of the placement test scores met the criteria of the McCrary test for
normality.
17
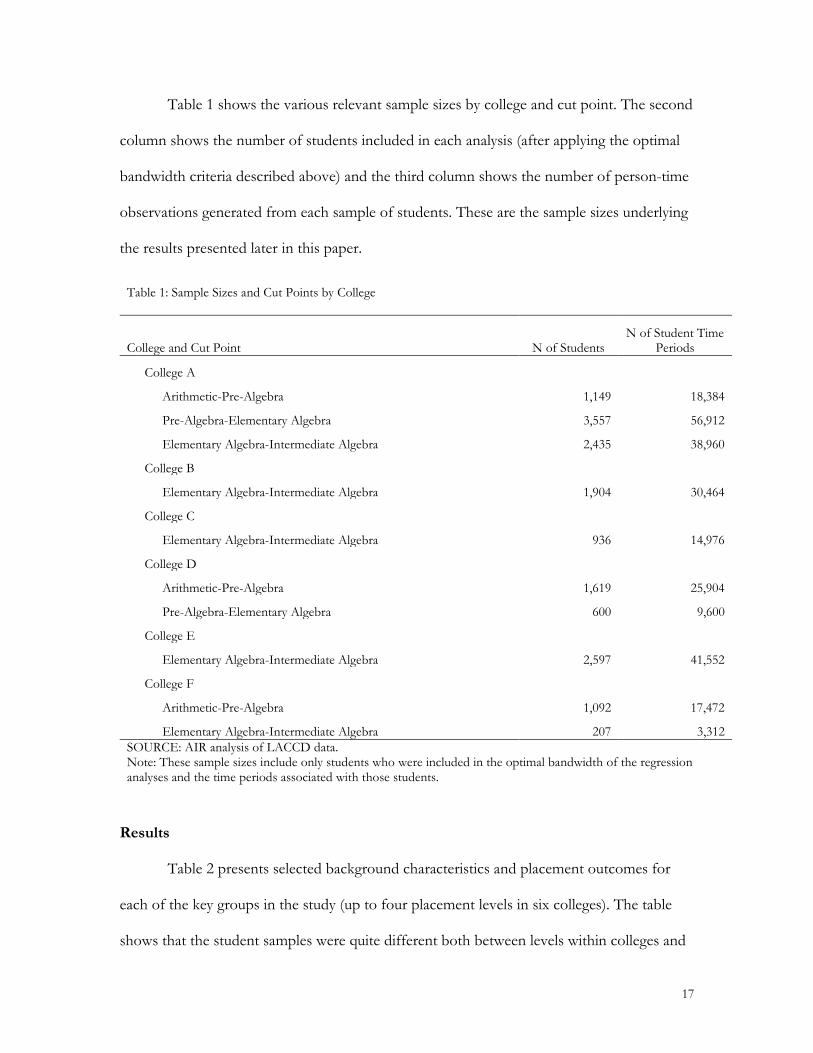
Table 1 shows the various relevant sample sizes by college and cut point. The second
column shows the number of students included in each analysis (after applying the optimal
bandwidth criteria described above) and the third column shows the number of person-time
observations generated from each sample of students. These are the sample sizes underlying
the results presented later in this paper.
Table 1: Sample Sizes and Cut Points by College
College and Cut Point N of Students N of Student Time
Periods
College A
Arithmetic-Pre-Algebra 1,149 18,384
Pre-Algebra-Elementary Algebra 3,557 56,912
Elementary Algebra-Intermediate Algebra 2,435 38,960
College B
Elementary Algebra-Intermediate Algebra 1,904 30,464
College C
Elementary Algebra-Intermediate Algebra 936 14,976
College D
Arithmetic-Pre-Algebra 1,619 25,904
Pre-Algebra-Elementary Algebra 600 9,600
College E
Elementary Algebra-Intermediate Algebra 2,597 41,552
College F
Arithmetic-Pre-Algebra 1,092 17,472
Elementary Algebra-Intermediate Algebra 207 3,312 SOURCE: AIR analysis of LACCD data. Note: These sample sizes include only students who were included in the optimal bandwidth of the regression analyses and the time periods associated with those students.
Results
Table 2 presents selected background characteristics and placement outcomes for
each of the key groups in the study (up to four placement levels in six colleges). The table
shows that the student samples were quite different both between levels within colleges and

18
within levels across colleges. This is the case both in terms of their background
characteristics and in terms of their educational outcomes. For example, compared to
students placed into arithmetic at College A, nearly twice the proportion of students at
college F were under 20. Additionally, the percent of students in the sample who indicated
that English is not their primary language varied widely by college. For students placed into
elementary algebra, it ranged from 17.8 percent at College B to 42.6 percent at College A.
Similar variation across colleges appears to exist in racial and ethnic background as well as
student gender. Moreover, the distribution of placement decisions across the different
colleges varied considerably. For example, in college D, as many as 47.5 percent of the
students were placed in arithmetic (the lowest level), compared to as few as 13.3 percent in
college A.
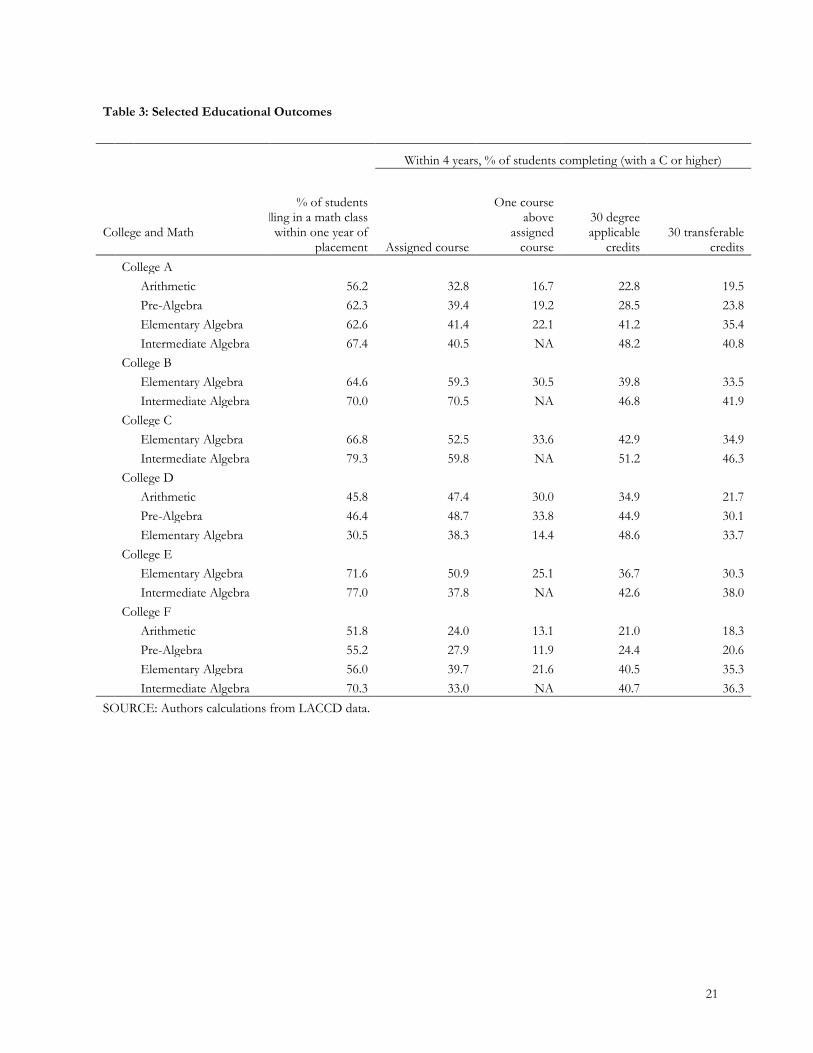
When examining educational outcomes, a similar pattern of variation within and
across levels and colleges is apparent. The first key outcome presented in Table 3 is rate of
enrollment in any math class. As expected, not all students who took a math placement test
subsequently enrolled in a math course and these enrollment rates varied across levels and
colleges. In general, students who had higher placement test scores (and higher-level
placements) were more likely to enroll in a math class, although those patterns were not
entirely consistent across the different colleges. One key related question, which we will
examine below, is whether the placement decision a student faces affected his or her
decision to enroll in a math course. This question is important both for policy reasons (do
certain placement decisions lower math enrollment?) and for methodological reasons (are
lower-scoring students a more motivated subset because they decided to enroll at all?).
Subsequent outcomes shown in Table 3 are completion of the class in which a student was
first placed, completion of the next higher class (where applicable), attainment of 30 degree-

19
applicable credits within four years after initial placement, and attainment of 30 transferable
credits during that timeframe.

20
Table 2: Student Background Characteristics and Placement Ratios
College and Math Level % of
students Median
Age %Younger
than 20 %No HS credential
% English not primary
language % US
Citizen % Female %Asian %Black %Hispanic %Other %White College A Arithmetic 13.3 25.3 21.7 15.7 37.3 74.7 58.1 9.5 20.0 50.7 6.5 13.4 Pre-Algebra 42.9 21 42.1 7.2 39.3 72.7 52.3 11.5 13.4 52.6 6.8 15.7 Elementary Algebra 29.2 19.7 53.8 5.4 42.6 64.9 53.2 21 8.8 47.8 7.3 15.1 Intermediate Algebra 14.5 20.7 45.0 5.8 46.1 60.8 52.1 31.5 8.9 31.5 8.0 20.2 College B Elementary Algebra 57.8 18.5 63.4 4.7 17.8 85.5 49.8 15.7 11.1 45.3 7.5 20.4 Intermediate Algebra 42.2 18.5 65.9 2.9 23.4 82.1 46.8 23.9 9.8 41.2 7.6 17.5 College C Elementary Algebra 65.0 18.6 75.7 4.3 28.6 82.9 51.8 5.6 3.9 76.5 5.9 8.1 Intermediate Algebra 35.0 18.6 70.7 3.4 27.4 80.2 53.0 9.5 2.7 71.3 6.7 9.8 College D Arithmetic 47.5 23.3 33.7 14.2 30.7 79.3 48.5 5.8 34.3 51.7 4.9 3.3 Pre-Algebra 41.6 24.2 29.9 7.0 33.7 72.5 42.7 14.0 27.8 47.0 4.2 6.9 Elementary Algebra 11.0 27.1 20.2 3.7 37.0 60.9 33.3 3.0 17.3 33.7 5.8 13.2 College E Elementary Algebra 50.7 18.9 75.1 2.6 29.9 81.8 51.8 8.1 7.9 50.9 9.0 24.0 Intermediate Algebra 49.3 18.7 74.7 3.2 32.0 79.8 49.7 10.1 6.0 46.8 9.6 27.6 College F Arithmetic 28.3 22.3 39.8 9.3 13.6 93.5 60.5 3.5 62.4 27.0 4.4 2.7 Pre-Algebra 55.8 20.9 42.8 8.4 14.6 90.2 61.4 3.0 54.9 31.2 5.8 5.1 Elementary Algebra 8.9 20.8 44.0 3.4 21.6 81.0 48.3 10.3 29.3 36.2 6.0 18.1 Intermediate Algebra 7.0 20.7 42.9 5.5 24.2 76.9 51.6 11.0 25.3 30.8 16.5 16.5 SOURCE: Authors calculations from LACCD data. Note: These sample sizes include only students and student-time periods that were included in the optimal bandwidths used in the analyses.
21
Table 3: Selected Educational Outcomes
Within 4 years, % of students completing (with a C or higher)
College and Math
% of students lling in a math class
within one year of placement Assigned course
One course above
assigned course
30 degree applicable
credits 30 transferable
credits College A Arithmetic 56.2 32.8 16.7 22.8 19.5 Pre-Algebra 62.3 39.4 19.2 28.5 23.8 Elementary Algebra 62.6 41.4 22.1 41.2 35.4 Intermediate Algebra 67.4 40.5 NA 48.2 40.8 College B Elementary Algebra 64.6 59.3 30.5 39.8 33.5 Intermediate Algebra 70.0 70.5 NA 46.8 41.9 College C Elementary Algebra 66.8 52.5 33.6 42.9 34.9 Intermediate Algebra 79.3 59.8 NA 51.2 46.3 College D Arithmetic 45.8 47.4 30.0 34.9 21.7 Pre-Algebra 46.4 48.7 33.8 44.9 30.1 Elementary Algebra 30.5 38.3 14.4 48.6 33.7 College E Elementary Algebra 71.6 50.9 25.1 36.7 30.3 Intermediate Algebra 77.0 37.8 NA 42.6 38.0 College F Arithmetic 51.8 24.0 13.1 21.0 18.3 Pre-Algebra 55.2 27.9 11.9 24.4 20.6 Elementary Algebra 56.0 39.7 21.6 40.5 35.3 Intermediate Algebra 70.3 33.0 NA 40.7 36.3 SOURCE: Authors calculations from LACCD data.
22
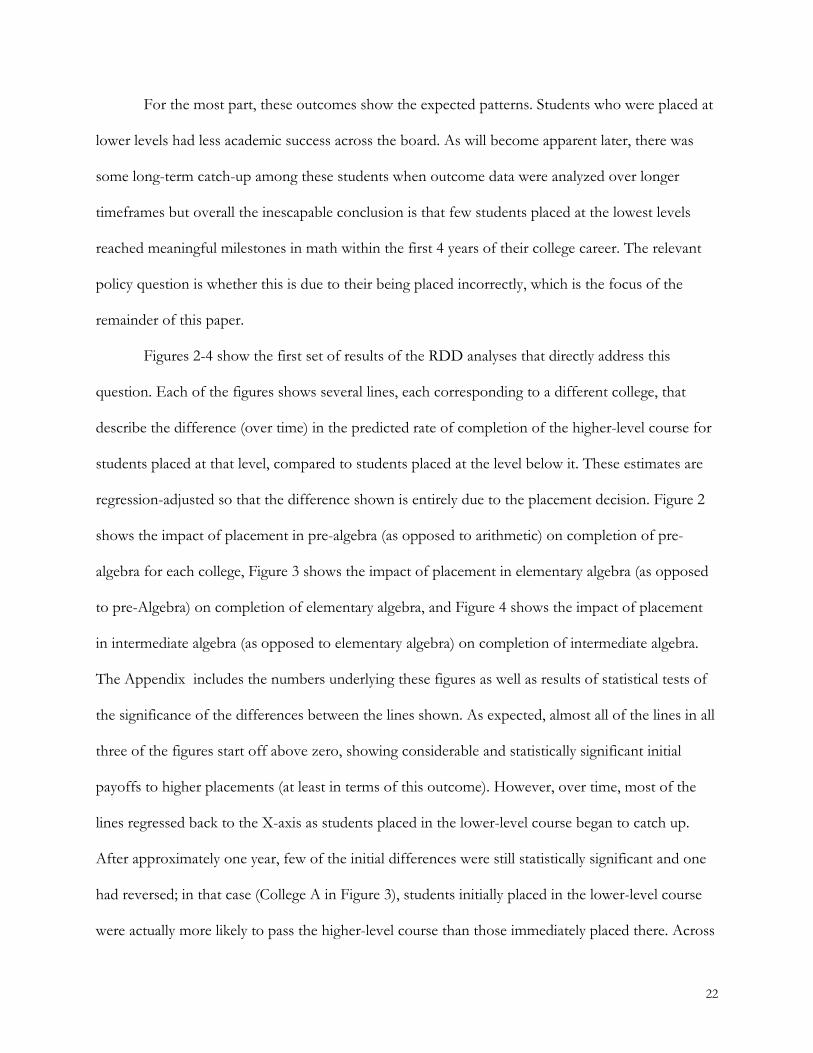
For the most part, these outcomes show the expected patterns. Students who were placed at
lower levels had less academic success across the board. As will become apparent later, there was
some long-term catch-up among these students when outcome data were analyzed over longer
timeframes but overall the inescapable conclusion is that few students placed at the lowest levels
reached meaningful milestones in math within the first 4 years of their college career. The relevant
policy question is whether this is due to their being placed incorrectly, which is the focus of the
remainder of this paper.
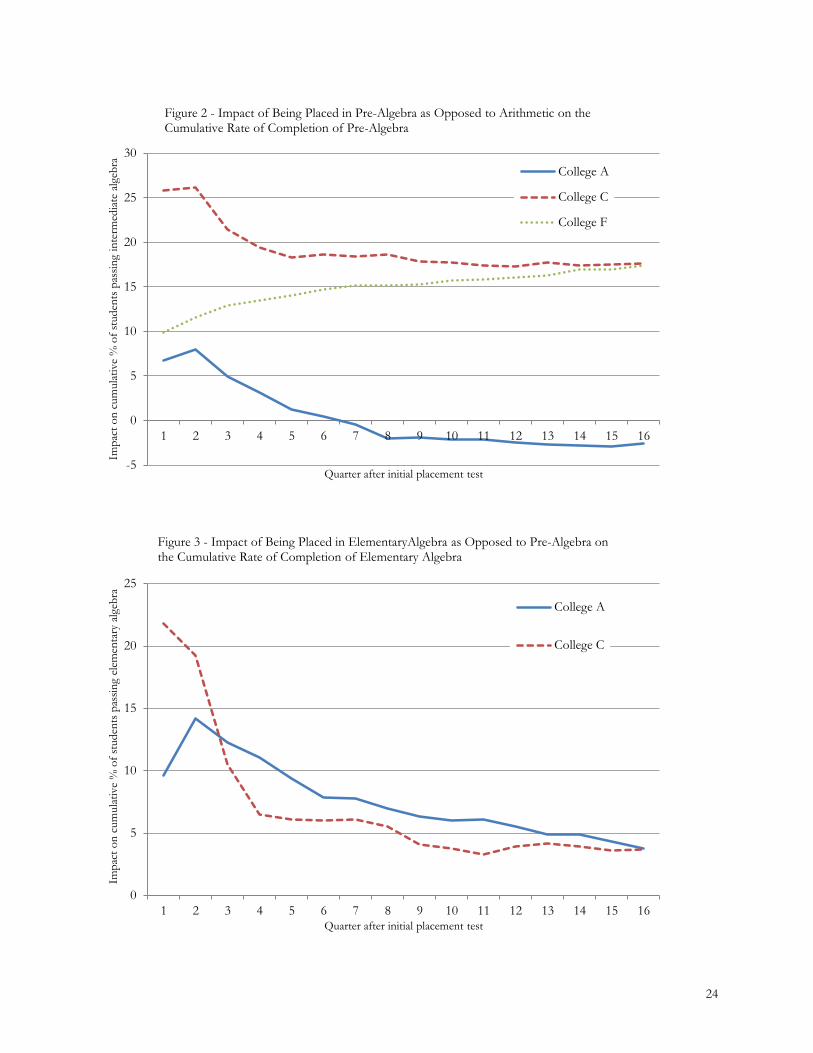
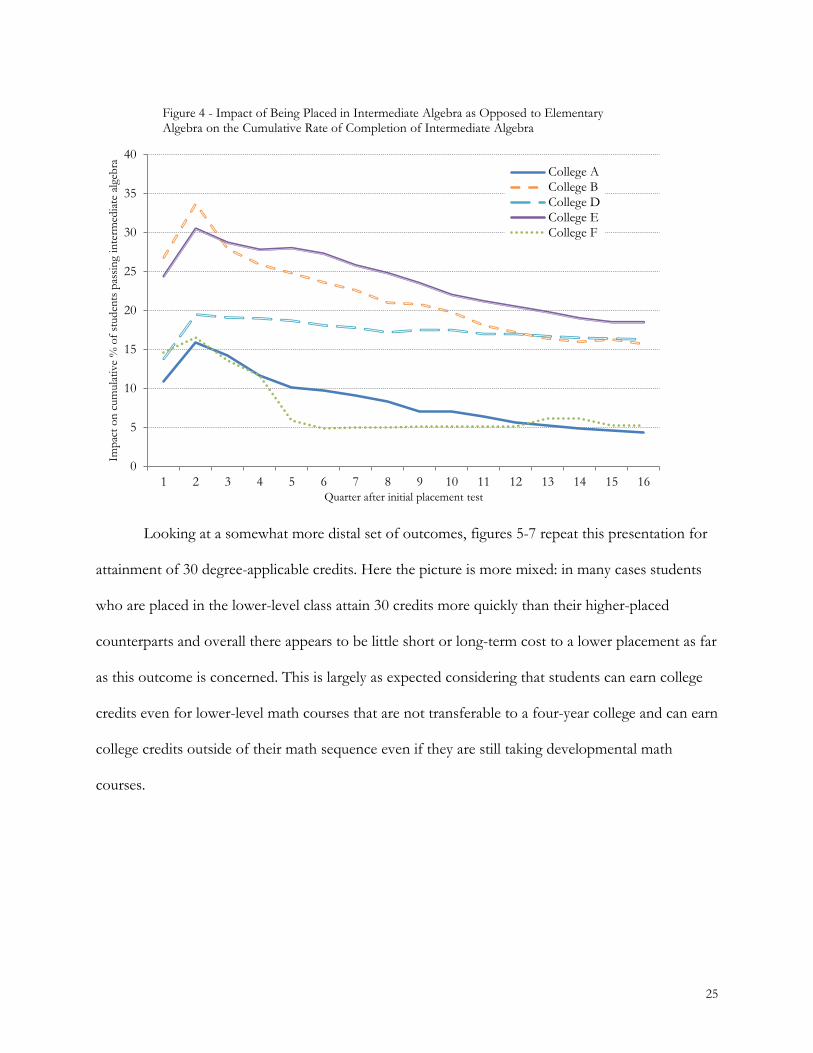
Figures 2-4 show the first set of results of the RDD analyses that directly address this
question. Each of the figures shows several lines, each corresponding to a different college, that
describe the difference (over time) in the predicted rate of completion of the higher-level course for
students placed at that level, compared to students placed at the level below it. These estimates are
regression-adjusted so that the difference shown is entirely due to the placement decision. Figure 2
shows the impact of placement in pre-algebra (as opposed to arithmetic) on completion of pre-
algebra for each college, Figure 3 shows the impact of placement in elementary algebra (as opposed
to pre-Algebra) on completion of elementary algebra, and Figure 4 shows the impact of placement
in intermediate algebra (as opposed to elementary algebra) on completion of intermediate algebra.
The Appendix includes the numbers underlying these figures as well as results of statistical tests of
the significance of the differences between the lines shown. As expected, almost all of the lines in all
three of the figures start off above zero, showing considerable and statistically significant initial
payoffs to higher placements (at least in terms of this outcome). However, over time, most of the
lines regressed back to the X-axis as students placed in the lower-level course began to catch up.
After approximately one year, few of the initial differences were still statistically significant and one
had reversed; in that case (College A in Figure 3), students initially placed in the lower-level course
were actually more likely to pass the higher-level course than those immediately placed there. Across
23
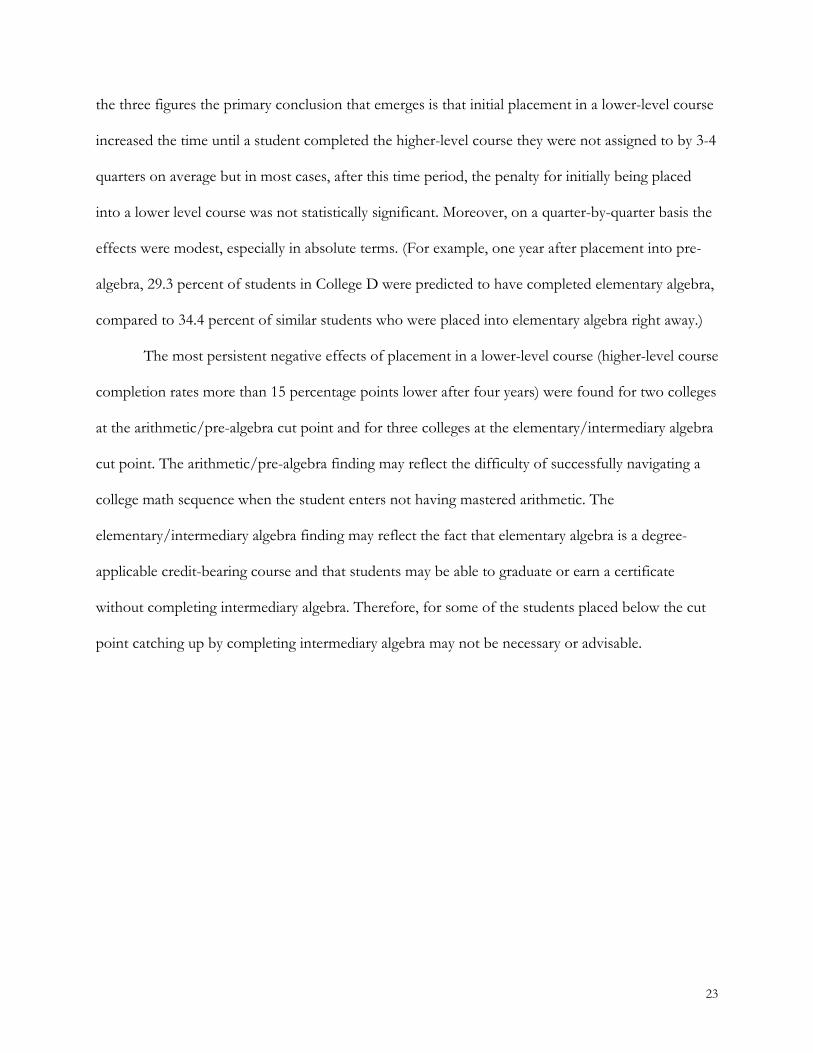
the three figures the primary conclusion that emerges is that initial placement in a lower-level course
increased the time until a student completed the higher-level course they were not assigned to by 3-4
quarters on average but in most cases, after this time period, the penalty for initially being placed
into a lower level course was not statistically significant. Moreover, on a quarter-by-quarter basis the
effects were modest, especially in absolute terms. (For example, one year after placement into pre-
algebra, 29.3 percent of students in College D were predicted to have completed elementary algebra,
compared to 34.4 percent of similar students who were placed into elementary algebra right away.)
The most persistent negative effects of placement in a lower-level course (higher-level course
completion rates more than 15 percentage points lower after four years) were found for two colleges
at the arithmetic/pre-algebra cut point and for three colleges at the elementary/intermediary algebra
cut point. The arithmetic/pre-algebra finding may reflect the difficulty of successfully navigating a
college math sequence when the student enters not having mastered arithmetic. The
elementary/intermediary algebra finding may reflect the fact that elementary algebra is a degree-
applicable credit-bearing course and that students may be able to graduate or earn a certificate
without completing intermediary algebra. Therefore, for some of the students placed below the cut
point catching up by completing intermediary algebra may not be necessary or advisable.
24
-5
0
5
10
15
20
25
30
1 2 3 4 5 6 7 8 9 10 11 12 13 14 15 16
Impa
ct o
n cu
mul
ativ
e %
of s
tude
nts p
assin
g in
term
ediat
e alg
ebra
Quarter after initial placement test
Figure 2 - Impact of Being Placed in Pre-Algebra as Opposed to Arithmetic on the Cumulative Rate of Completion of Pre-Algebra
College A
College C
College F
0
5
10
15
20
25
1 2 3 4 5 6 7 8 9 10 11 12 13 14 15 16
Impa
ct o
n cu
mul
ativ
e %
of s
tude
nts p
assin
g el
emen
tary
alg
ebra
Quarter after initial placement test
Figure 3 - Impact of Being Placed in ElementaryAlgebra as Opposed to Pre-Algebra on the Cumulative Rate of Completion of Elementary Algebra
College A
College C
25
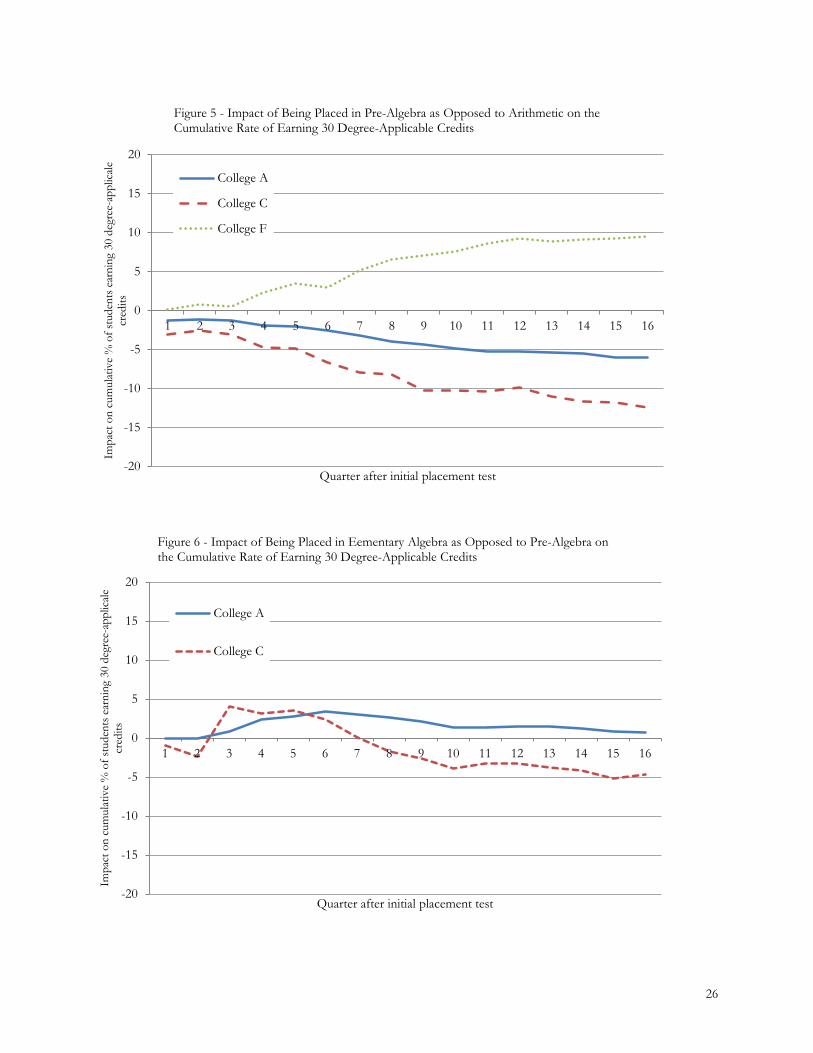
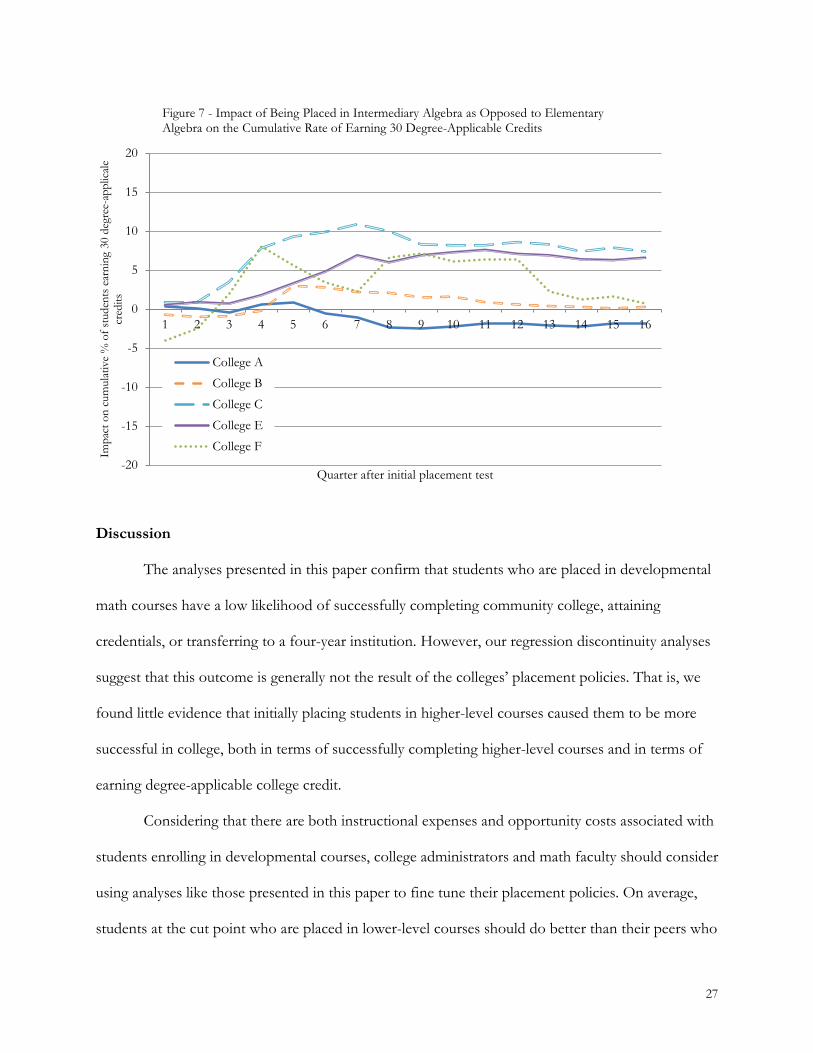
Looking at a somewhat more distal set of outcomes, figures 5-7 repeat this presentation for
attainment of 30 degree-applicable credits. Here the picture is more mixed: in many cases students
who are placed in the lower-level class attain 30 credits more quickly than their higher-placed
counterparts and overall there appears to be little short or long-term cost to a lower placement as far
as this outcome is concerned. This is largely as expected considering that students can earn college
credits even for lower-level math courses that are not transferable to a four-year college and can earn
college credits outside of their math sequence even if they are still taking developmental math
courses.
0
5
10
15
20
25
30
35
40
1 2 3 4 5 6 7 8 9 10 11 12 13 14 15 16
Impa
ct o
n cu
mul
ativ
e %
of s
tude
nts p
assin
g in
term
ediat
e alg
ebra
Quarter after initial placement test
Figure 4 - Impact of Being Placed in Intermediate Algebra as Opposed to Elementary Algebra on the Cumulative Rate of Completion of Intermediate Algebra
College ACollege BCollege DCollege ECollege F
26
-20
-15
-10
-5
0
5
10
15
20
1 2 3 4 5 6 7 8 9 10 11 12 13 14 15 16
Impa
ct o
n cu
mul
ativ
e %
of s
tude
nts e
arni
ng 3
0 de
gree
-app
licale
cr
edits
Quarter after initial placement test
Figure 5 - Impact of Being Placed in Pre-Algebra as Opposed to Arithmetic on the Cumulative Rate of Earning 30 Degree-Applicable Credits
College A
College C
College F
-20
-15
-10
-5
0
5
10
15
20
1 2 3 4 5 6 7 8 9 10 11 12 13 14 15 16
Impa
ct o
n cu
mul
ativ
e %
of s
tude
nts e
arni
ng 3
0 de
gree
-app
licale
cr
edits
Quarter after initial placement test
Figure 6 - Impact of Being Placed in Eementary Algebra as Opposed to Pre-Algebra on the Cumulative Rate of Earning 30 Degree-Applicable Credits
College A
College C
27
Discussion
The analyses presented in this paper confirm that students who are placed in developmental
math courses have a low likelihood of successfully completing community college, attaining
credentials, or transferring to a four-year institution. However, our regression discontinuity analyses
suggest that this outcome is generally not the result of the colleges’ placement policies. That is, we
found little evidence that initially placing students in higher-level courses caused them to be more
successful in college, both in terms of successfully completing higher-level courses and in terms of
earning degree-applicable college credit.
Considering that there are both instructional expenses and opportunity costs associated with
students enrolling in developmental courses, college administrators and math faculty should consider
using analyses like those presented in this paper to fine tune their placement policies. On average,
students at the cut point who are placed in lower-level courses should do better than their peers who
-20
-15
-10
-5
0
5
10
15
20
1 2 3 4 5 6 7 8 9 10 11 12 13 14 15 16
Impa
ct o
n cu
mul
ativ
e %
of s
tude
nts e
arni
ng 3
0 de
gree
-app
licale
cr
edits
Quarter after initial placement test
Figure 7 - Impact of Being Placed in Intermediary Algebra as Opposed to Elementary Algebra on the Cumulative Rate of Earning 30 Degree-Applicable Credits
College A
College B
College C
College E
College F
28
are not. If not, then the cut points should be lowered gradually until the costs and benefits of
developmental education for these students are in balance. However, this would only partially
address the challenge of improving the college experience for students whose initial academic skills
are insufficient for successful college-level work. Placing these students in the most appropriate
courses for them does not mean that their success rates in those courses are sufficient to make their
college experience worthwhile. Ensuring that is a larger educational and policy challenge that goes
beyond the practice of creating and adjusting placement policies and includes issues like course
quality, support services, and the interaction between higher education and the K-12 and adult
education systems.
29
References
Angrist, J.D., & Lavy, V (1999). Using Maimonides’ rule to estimate the effect of class size
on scholastic achievement. Quarterly Journal of Economics, 114(2), 533-75.
Bailey, T., Jeong, D.W., & Cho, S. (2010). Referral, enrollment, and completion in
developmental education sequences in community colleges, Economics of Education
Review, 29, 255-270.
Bettinger, E., & Long, B.T. (2009). Addressing the needs of under-prepared students in
higher education: Does college remediation work? Journal of Human Resources 44, 736–
771.
Boatman, A. & Long, B.T. (2010). Does remediation work for all students? How the effects of
postsecondary remedial and developmental courses vary by level of academic preparation. National
Center for Postsecondary Research Working Paper.
Boylan, H., Bliss, L., & Bonham, D. (1994). Characteristics components of developmental
programs. Review of Research in Developmental Education, 11(1), 1-4.
Calcagno, J.C., & Long, B.T. (2008). The impact of remediation using a regression discontinuity
approach: Adressing endogenous sorting and noncompliance. Working Paper 14194.
Cambridge, MA: National Bureau of Economic Research.
California Community College Chancellor’s Office. (2011). Matriculation Handbook.
Retrieved from:
http://www.cccco.edu/Portals/4/SS/Matric/Matriculation%20Handbook%20(RE
V.%2009-2011).pdf
Cook, T.D. and Campbell, D.T. (1979). Quasi-Experimentation: Design and Analysis for Field
Settings. Rand McNally, Chicago, Illinois.
Fan, J., & Gijbels, I. (1996). Local polynomial modeling and its applications. London: Chapman &
Hall.
Gamse, B.C., Jacob, R.T., Horst, M., Boulay, B., Unlu, F. (2008). Reading First impact study:
Final report. NCEE 2009-4038. Washington DC: National Center for Educational
Evaluation and Regional Assistance, Institute of Education Sciences, U.S.
Department of Education.
Lazarick, L. (1997). Back to the basics: Remedial education. Community College Journal 11-15.
30
Lesik, S. A. (2007). Do developmental mathematics programs have a causal impact on
student retention? An application of discrete-time survival and regression-
discontinuity analysis. Research in Higher Education, 48(5), 583-608.
Mantorell, P., & McFarlin, I. (2011). Help or hindrance? The effect of remediation on
academic and labor market outcomes. The Review of Economics and Statistics.
McCrary, J. (2008). Manipulation of the running variable in the regression discontinuity
design: a density test. Journal of Econometrics, 142 (2), 698–714.
Moss, B. & Yeaton, W. (2006). Shaping policies related to developmental education: An
evaluation using the regression-discontinuity design, Educational Evaluation & Policy
Analysis, 28(3), 215-229.
Murnane, R.J., & Willett, J.B. (2011). Methods matter: Improving causal inference in education and
social science research. Oxford: Oxford University Press.
National Center for Public Policy and Higher Education & Southern Regional Education
Board. (2010). Beyond the Rhetoric: Improving College Readiness through Coherent State Policy.
Washington, D.C.
Robinson, J. P. (2011). Evaluating criteria for English learner reclassification: A causal-
effects approach using a binding-score regression discontinuity design with
instrumental variables. Educational Evaluation and Policy Analysis, 33(3), 267-292.
Schneider, M., & Yin, L. (2011). The hidden costs of community colleges. Washington, DC:
American Institutes for Research. Retrieved from
http://www.air.org/files/AIR_Hidden_Costs_of_Community_Colleges_Oct2011.p
df
Scott-Clayton, J & Rodriguez, O. (2012). Detour, diversion, or discouragement? A new framework
and new evidence on the effects of college remediation. Working paper. Teachers College,
Columbia University: Community College Research Center.
Shadish, W., Cook, T., & Campbell, D. (2002). Experimental and quasi-experimental designs for
generalized causal inference. Boston: Houghton-Mifflin.
Schochet, P.A. (2006). Regression discontinuity design case study: National evaluation of early reading
first. Princeton, NJ: Mathematica Policy Research.
Singer, J., & Willett, J. (2003). Applied longitudinal data analysis: Modeling change and event
occurrence. New York, NY: Oxford University Press.

31
Strong American Schools. (2008). Diploma to nowhere. Retrieved from
http://www.edin08.com
Urquiola, M., Verhoogen, E. (2009). Class-size caps, sorting, and the regression-discontinuity
design. American Economic Review, 99(1), 179-215.
Zuckerman, I. H., Lee, E., Wutoh, A. K., Xue, Z. and Stuart, B. (2006). Application of
Regression-Discontinuity Analysis in Pharmaceutical Health Services Research.
Health Services Research, 41: 550–563. doi: 10.1111/j.1475-6773.2005.00487