USING A CLAIM SIMULATION MODEL FOR RESERVING LOSS
21
USING A CLAIM SIMULATION MODEL FOR RESERVING & LOSS FORECASTING FOR MEDICAL PROFESSIONAL LIABILITY By Rajesh V. Sahasrabuddhe, FCAS, MAAA Abstract Various recent papers have included criticisms related to the use of link‐ratio techniques for estimating ultimate losses. While this paper does not review these criticisms, it does outline development characteristics of medical professional liability1 losses that would lead the actuary to believe that link‐ratio techniques may not always be the best available option for projecting ultimate losses. The paper then proceeds to provide a model that addresses these weaknesses and then extends this model for loss forecasting applications. More specifically, this paper provides a framework for evaluating medical professional liability 1 loss exposures. The concepts used in this model are more fully discussed and described in other statistical textbooks or refereed actuarial journals. This paper is intended to provide a synthesis of existing distinct processes. Rather than repeat those discussions, a bibliographical reference is provided. The bibliography included, therefore, should be considered a critical section of this paper. Specifics of the modeling within the framework presented are the responsibility of the actuary implementing the model. While the paper does include alternatives that may be considered within the framework, it is not intended to be a comprehensive listing of these alternatives. This model has been developed in recognition of data availability issues for self‐ insured healthcare facilities. However, this model may easily be expanded for use in an insurance company context or for evaluating other medical professional liability exposures. I. Motivation and Rationale A recent paper published in the CAS Forum included the following statement: 1 This model may be extended to other general liability or professional liability exposures. This model is not appropriate for coverages subject to partial payments such as workers compensation.
Transcript of USING A CLAIM SIMULATION MODEL FOR RESERVING LOSS
USING A CLAIM SIMULATION MODEL FOR RESERVING & LOSS FORECASTING FOR MEDICAL PROFESSIONAL LIABILITY
By Rajesh V. Sahasrabuddhe, FCAS, MAAA Abstract Various recent papers have included criticisms related to the use of link‐ratio techniques for estimating ultimate losses. While this paper does not review these criticisms, it does outline development characteristics of medical professional liability1 losses that would lead the actuary to believe that link‐ratio techniques may not always be the best available option for projecting ultimate losses. The paper then proceeds to provide a model that addresses these weaknesses and then extends this model for loss forecasting applications. More specifically, this paper provides a framework for evaluating medical professional liability1 loss exposures. The concepts used in this model are more fully discussed and described in other statistical textbooks or refereed actuarial journals. This paper is intended to provide a synthesis of existing distinct processes. Rather than repeat those discussions, a bibliographical reference is provided. The bibliography included, therefore, should be considered a critical section of this paper. Specifics of the modeling within the framework presented are the responsibility of the actuary implementing the model. While the paper does include alternatives that may be considered within the framework, it is not intended to be a comprehensive listing of these alternatives. This model has been developed in recognition of data availability issues for self‐insured healthcare facilities. However, this model may easily be expanded for use in an insurance company context or for evaluating other medical professional liability exposures. I. Motivation and Rationale A recent paper published in the CAS Forum included the following statement:
1 This model may be extended to other general liability or professional liability exposures. This model is not appropriate for coverages subject to partial payments such as workers compensation.

Using a Claim Situation Model for Reserving and Loss Forecasting for Medical Professional Liability
"...for most, if not all, cumulative arrays the assumptions made by the standard link ratio techniques are not satisfied by the data . . . . ,,2 [1]
Without providing a statistical analysis to prove this statement, there are a number of intuitive reasons why we would expect this statement to be true for medical professional liability losses.
(1) Claims-made medical professional liability is generally considered a "short-tailed" coverage in comparison to other liability coverages. Occurrence coverage is generally considered "long-tailed." This leads to the natural conclusion that on an occurrence basis, the majority of loss development may be attributed to claims that are incurred but not reported ("IBNR'). Consistent with common actuarial usage, this type of development is referred to as "pure IBNR" emergence. This development should be distinguished from the development on known claims, which will be referred to as bulk development. Link ratio techniques assume future development is a function of prior cumulative experience. This is inconsistent with the understanding developed that future development is actually due to newly reported claims. These newly reported claims do not necessarily have any relationship to past claims.
This relationship between pure IBNR and bulk development may be driven by the fact that healthcare institutions, in general, are conservative by their very nature. In the aggregate, case reserves established by these conservative institutions tend to be reasonably adequate.
(2) A model is defined as "a simplified mathematical description" [3] of a more complicated process. Loss development approaches would not appear to satisfy this definition since future development is not entirely a function of cumulative losses. Therefore the "mathematical description" is not consistent with the process being modeled.
(3) Link ratio techniques are generally based on the analysis and review of loss development triangles. Given the long-tail nature of occurrence coverage the predictive ability of loss development triangles is severely compromised by inflation. Emergence in the 10th calendar period for the
2 That same paper was later published in the Proceedings with softer language: "Most loss arrays don ' t satisfy the assumpt ions of s tandard link ratio techniques."
308 Casualty Actuarial Society Forum, Winter 2007

Using a Claim Situation Model for Reserving and Loss Forecasting for Medical Professional Liability
10th prior accident period is likely to differ from the for the current accident period due to inflationary pressures.
(4) Loss development data for self-insureds may be subject to various limits and deductibles. This further compounds the inflation problem. Even if we obtain triangles at constant limits and deductibles on a nominal basis, the development for each period will be different on a real, or inflation- adjusted, basis.
In addition, if actuaries choose (as they often do) to select a single development pattern and apply it to every exposure period 3, they are making the implicit assumption that trend acts in one direction - across exposure periods. Any other "direction" of trend, i.e. across settlement period, report period or maturity, would be inconsistent with the development patterns as they are used in general practice.
These factors would compromise estimates using traditional Bomhuetter- Ferguson ("B-F') or additive techniques as well as link-ratio methods.
(5) When information is aggregated, information is lost. Fundamentally, by aggregating loss information into somewhat arbitrary accident year groupings, information provided by individual claim detail is lost. It is also critical to recognize that loss development is a statistical model. In this model, parameters (loss development factors) are estimated using data (loss triangles).
The framework described herein is based on multiple underlying stochastic models and is likely to be more robust. This is because we are estimating fewer parameters with more information. However, there may be residual uncertainties that cannot be eliminated.
From a practical perspective, these methods also suffer from the following problems:
(1) To many users of actuarial information, risk (deviation from the point- estimate) is just as important as, if not more important than, the point- estimate itself. We may be able to develop statistical measures of the uncertainty involved in the selection of loss development factors - also
3 "exposure period" is intended as a generalized term for accident period, policy, period, report period, etc.
Casualty Actuarial Society Forum, Winter 2007 309

Using a Claim Situation Model for Reserving and Loss Forecasting for Medical Professional Liability
known as parameter risk. However, we have not been able to determine the model specification risk. This risk can be quite large since the assumption of link ratio models may not be consistent with the
underlying cause of loss development.
(2) Oftentimes loss triangles are simply not available. This is particularly the case for self-insureds. Self-insured entities often keep a current loss database and generally do not track aggregate loss development.
(3) For many self-insureds, excess insurance is only available on a claims- made basis. However, accruals need to be made on an occurrence basis. This would require that actuarial analyses recognize differences in limits and retentions that are dependant on the report date of the claim. Link- ratio methods do not easily recognize these differences.
The goal of this paper is to present a model that overcomes these limitations. Specifically, we present a model that is adaptable, accounts for inflation, estimates risk, and is easily extendable for loss forecasting applications.
This model has the following benefits relative to link-ratio models because:
(1) This model reduces model specification error. This is due to that fact that this model that attempts to replicate claims process. The model includes the following phases of the actual claim life cycle: an accident occurs, the claim is reported, and the claim is settled for some amount. It would be naive to believe that each and every driver of the claim process is (or can be) included in the model presented herein. However, the model better
satisfies the definition of a "model" as stated above.
(2) The model is "unified" and easily adaptable to provide consistent estimation of pure IBNR, bulk reserves and prospective loss forecasts.
(3) The model is specifically designed to be used in a simulation environment. Given that insurance involves bearing risk - a reserve or loss forecast model should measure that risk. Use of simulation techniques is necessary in analyzing these exposures to provide an estimate of variability. Insureds retaining risk require this information as they are quite concerned with the variability in the point estimate. A model that yields only a point estimate does not accomplish this goal.
310 Casualty Actuarial Society Forum, Winter 2007

Using a Claim Situation Model for Reserving and Loss Forecasting for Medical Professional Liability
A claim level simulation model allows for the evaluation various per- occurrence and aggregate coverage alternatives in a prospective loss forecast. This information is particularly useful for insureds considering changes in their insurance program.
II. Mode l Overv iew The loss-reserving model estimates indemnity and expense reserves for pure IBNR separately from bulk reserves. Each reserve component is estimated using a frequency x severity methodology. Model specification error is reduced with a frequency × severity model as it attempts to replicate the claims process. This is a benefit relative to link-ratio, additive or B-F methods, which only provide models for loss movements in aggregate. The claim process replicated by the frequency x severity may be illustrated as follows:
FIGURE 1
I Medical Error / Accident 1 Occurs
I Claim is Reported 1
I
I ClaimSettleswithC°st I I ClamSettleswith°ut l C o s t
Based on the diagram above, the model is specified in the following order:
Casualty Actuarial Society Forum, Winter 2007 311

Using a Claim Situation Model for Reserving and Loss Forecasting for Medical Professional Liability
FIGURE 2
Estimate of Claim Reporting Lags ]
I Estimation of 1BNR Claim Frequency
I
I Estimate Claim Closing Lags ]
~ Estimate Claims Severity ]
The model used to estimate required bulk reserves or prospective loss forecasts are simply "special cases" of the model used to estimate pure IBNR. For this reason, the model for pure IBNR is presented first and the special cases follow.
III. The Genera l M o d e l - E v a l u a t i o n of Pure IBNR
Claims Reporting Lag Recognizing usual self-insured data limitations, the model employs an approach that does not require claim triangles. In typical self-insured loss runs, observed report lag for each claim will be available. These lags are calculated as the
difference between the report date and the accident date for each claim. A statistical distribution may then be fit to these observed report lags.
In doing so, it must be recognized that the observed report lags have a problem similar to that found with deductible claim data 4. With deductible claim data, our observations will not include losses below the deductible - i.e. claims are said to be truncated from below. With observed report lag data, our observations will not include claims that have not yet been reported - i.e. the observations are truncated from above. The observations, W, will follow a conditional distribution with the following density function:
4 The parallel to the deductible loss data may be understood by reviewing Hogg & Klugman [6] (p. 129 -130).
312 Casualty Actuarial Society Forum, Winter 2007

Using a Claim Situation Model for Reserving and Loss Forecasting for Medical Professional Liability
fw (x)= fx (x)/F x (M) where M = (valuation date- accident date)
= 0 for x > (valuation date - accident date)
Using this density function, we can solve for the parameters of the lag distribution using maximum likelihood techniques and spreadsheet optimization tools. The likelihood function for individual claim data may be written as:
L(B) = L(0; w I, w2, w3, w, ..... w n )
= ] - [ L ( x i ; e ) J
Tak ing logar i thms, we have:
In(L(8)) = ~ l n ( f ~ ( x j ; a ) ) J
where 0 represents the parameter(s) of the selected d is t r ibu t ion 5
Using spreadsheet optimization tools, we can solve for the parameter(s), 19, which maximize the likelihood function. This analysis is presented on Exhibit 1. Column (4) of this exhibit shows the calculated observed lag (in days). The maximum report lag is calculated as shown in Column (5). The conditional likelihood and conditional log likelihood are calculated in Columns (6) and (7), respectively. The mathematics of this lag model are described :in Weissner [2].
The cumulative distribution function provides our claims reporting pattern. The stochastic distribution also is easily used in a simulation analyses.
Determining Pure IBNR Claim Frequency
The report lag model is then used to estimate pure IBNR claims frequency. IBNR claims are estimated using a B-F approach. This estimation is illustrated on Exhibit 2.
For the B-F calculation, the claims reporting pattern is provided by the cumulative distribution function of the report lag model and the a priori ultimate claim estimate is determined using the average of development method estimates of ultimate claims of the mature claims periods (Column (9)).
s In genera l , we tend to use R a y l e i g h or Weibu l l d i s t r i b u t i o n s for lags.
Casualty Actuarial Society Forum, Winter 2007 313

Using a Claim Situation Model for Reserving and Loss Forecasting for Medical Professional Liability
The "Percent Reported" (Column (8)) is calculated using the cumulative distribution function of the lag model as determined on Exhibit 1. The function is evaluated at the difference between the data evaluation date and the midpoint of the accident period.
This is not the only approach available for estimating IBNR claims; however, based on the understanding that future claims are unrelated from prior claims, approaches, such as B-F, where IBNR claims are estimated (largely) independently of reported claim count are desirable.
Determination of Claims Closing Lag Model The development of a conditional closing lag distribution is identical to the development of the claim reporting lag with one fundamental difference. Since the closing lag in this model represents the difference between the report date and the date of closing, the observed closing lags are truncated (from above) at the difference between the valuation date and the report date. As the reader will recall, the observed reporting lags are truncated (from above) at the difference between valuation date and the accident date. As this process is identical to that for reporting lags, the calculations underlying a closing lag model are not included in this paper.
Claims Settlement Model Professional liability claims will settle with one of the following outcomes: (1) no payment, (2) indemnity and expense, (3) indemnity only, or (4) expense only. Depending on the quantity of available data, it may be necessary to collapse settlement outcomes into: (1) "no payment" and (2) "with cost" outcomes. The first step in determining our claim settlement model is to estimate the probability of each of these possible claim settlement outcomes.
It is recommended that the distribution of claim settlements be reviewed based on both closing year and accident year bases. Closing years are preferred as they better capture changes in claims settlement practices. Changes in claims settlement practices tend to apply to claims closed after a given date regardless of the accident date of the claim. When reviewing accident year distributions of settlements, only accident years that are completely or nearly completely closed should be considered. Consideration of immature periods may bias results towards the more quickly closed "no payment" or "expense only" settlement types. This type of review is presented on Exhibit 3.
314 Casualty Actuarial Society Forum, Winter 2007

Using a Claim Situation Model for Reserving and Loss Forecasting for Medical Professional Liability
Claims Cost Models
There are numerous previously published papers and texts describing methods to estimate stochastic claims cost models. The development of claims cost models is beyond the scope of this paper. The following is a partial listing of relevant papers and texts on this topic that the interested reader should review.
, Klugmanm Panjer, & Wilmot - Loss Models [3] ,, Keatinge -Model ing Losses with the Mixed Exponential Distribution [4] ,~ Philbrick - A Practical Guide to Single Parameter Pareto Distribution [5]
In practice, mixed distribution models appear to best describe claims severity and are easily adaptable to the Simulation process. Each component of the mixture represents a "type of claim." For example, a mixture of two lognormals, a point mass and a uniform distribution many be used to describe "small normal claims" (first lognormal), "large normal claims" (second lognormal), "losses clustered at the limit of insurance" (point mass) and "shock claims" (uniform distribution), respectively. An example of this model is presented in Exhibit 4 and is used later in this paper.
Credibi l i ty
Credibility of the loss data used in the estimation of the model parameters is an issue with every model. However, relative to development or B-F models, credibility should be less of an issue for the model presented herein. Credibility becomes an issue as actuaries attempt to estimate more parameters with fewer data. Relative to other models, this model estimates fewer parameters from more data.
Actuaries should recognize that, in estimating development patterns, each selected link-ratio is a parameter that is estimated from the observation in a column of observed link ratios. In addition to these link ratios, development methods or B-F methods may add other estimated parameters such as a priori
loss estimates. Even with a 10-year development triangle, this may require the actuary to estimate more than 10 parameters. The model presented herein should generally require the est imation of fewer than 10 parameters. In addition, because this model relies on claim level detail, we have significantly more data - or information - relative to models in which claim level detail is collapsed into accident years - thereby destroying.information.
Oftentimes, when credibility is an issue with B-F or development models, actuaries will simply rely on "industry data" or some other external source. This
Casualty Actuarial Society Forum, Winter 2007 315

Using a Claim Situation Model for Reserving and Loss Forecasting for Medical Professional Liability
of course has a (generally unstated) credibility problem caused by lack of homogeneity.
An additional advantage of the model is that parameter uncertainty can be explicitly considered in this model. The following is a listing of relevant papers that the author has reviewed that provide uncertainty models that may be incorporated into the model framework:
, Heckman, Philip E.; Meyers, Glenn G.- The Calculation of Aggregate Loss Distributions from Claim Severity and Claim Count Distributions [7]
~ Kreps, Rodney - Parameter Uncertainty in (Log) Normal Distributions [8]
Since we tend to employ lognormal claim cost models, we tend to use the derivation of parameter uncertainty as described by Kreps [8].
Claims Simulation We now have all the elements necessary to simulate the pure IBNR reserve. Our simulation proceeds according to the claims process illustrated in Figure 1.
Step 1. Simulation of the number of claims - the number of claims is simulated using a stochastic model with a mean equal to the estimated IBNR claims frequency discussed previously. A Poisson model is often used to simulate the number of claims; however there is no requirement to do so. (We can also use a prior distribution for the Poisson parameter to incorporate parameter risk - which, as is well known, results in a negative binomial model.)
Step 2. Simulation of accident year - For each of the simulated claims, the accident year is simulated. The distribution of claims by accident year is based on the discrete distribution of IBNR claims by accident year derived in our estimation of IBNR claims frequency.
Step 3. Simulation of accident date - the accident date is simulated using a uniform distribution betweenthe inception and expiration of the accident year simulated in Step 2. It is recognized that accident dates are not uniformly distributed throughout the accident year. That is, it is expected that there are more IBNR claims resulting from accidents occurring later within the simulated accident year. However, this is not considered to be a material weakness in the
316 Casualty Actuarial Society Forum, Winter 2007

Using a Claim Situation Model for Reserving and Loss Forecasting for Medical Professional Liability
Step 4.
Step 5.
Step 6.
Step 7.
Step 8.
model and consideration of this nuance is a further area of development left to the interested actuary.
Simulation of report date - the report date is simulated by adding a simulated report lag to the simulated accident date from Step 3. In this simulation, it must be recognized that the domain of possible report lags has a minimum value of the difference between the data evaluation date and simulated accident date. (For pure IBNR claims, the report date of the claim must, by definition, be greater than the valuation date of the data.) Therefore the report lag should be simulated using a truncated distribution.
Simulation of claim closing date - the claims closing date is simulated by adding a simulated closing lag to the simulated report date from Step 4.
Determination of present value factor - the present value factor applicable to each claim is calculated using the claim closing date. In general, for professional liability coverage, all indemnity is paid at claims closing and partial payments are not an issue. The calculated present value factor should consider that expenses are paid in advance of the claim closing date. It would not be overly difficult to develop a pattern for the payment of expenses; however, this consideration is beyond the scope of this paper.
Simulation of claims outcomes - using the discrete distribution of claims settlement probabilities, we simulate the outcome of each claim.
Simulation of claim value - the final step is estimation of claims settlement values. Using a mixed distribution model, the simulation of claim cost is a two-step process. The first step is the determination of which component of mixture generates the loss. This is simulated using a discrete distribution and the weight of each component in the mixture. The second step is to determine the claim value. This is simulated directly using the parameters and model-form of the component of the mixture that generates the loss.
Casualty Actuarial Society Forum, Winter 2007 317

Using a Claim Situation Model for Reserving and Loss Forecasting for Medical Professional Liability
Using the .parameter uncertainty model described, in Kreps [8], the severity parameters may also be simulated in each iteration.
The parameters of stochastic distribution of claim values should be adjusted for trend between the simulated accident date and the date at which the claims severity model is .evaluated. The discussion of the impact of trend on loss distributions (and their parameters) is contained in Hogg & Klugman [6]:.Essentially, this allows for each and every claim to be individually adjusted for trend. Furthermore, the model allows for trend adjustment based on accident date, report date or date of closing. The ability of the
model to respond to trend in this manner is a benefit relative to link-ratio methods.
This simulation is shown on Exhibit 5. While spreadsheet tools can be used to simulate all these values, simulation software packages (often spreadsheet add-
ins) will facilitate this process. .
Through this process we have now have a comprehensive listing of all IBNR
claims and all necessary information on those claims to: ,~ assign claims to report period, ~, assign limits and retentions given claims made excess coverages, and ,~ calculate claims at various indemnity and / or expense retentions.
IV. A S p e c i f i c C a s e - B u l k R e s e r v e s
The estimation of bulk reserves is simply a special case of the IBNR simulation model. Bulk reserves are simply the difference between case reserves and ultimate claims values. The process described above may also be applied to known claims with the following exceptions:
,~ The number of reported open claims is known and therefore does not
need to be simulated.
~> The accident dates and report dates of report claims are known and do not
need to be simulated.
In this simulation of closing lags it mustlbe recognized that the domain of possible closing lags has a minimum vdflue of the difference between the data valuation date and the actual report date. Therefore the closing lag should be simulated using a truncated distribution.
318 Casualty Actuarial Society Forum, Winter 2007

Using a Claim Situation Model for Reserving and Loss Forecasting for Medical Professional Liability
>> Cons ide ra t i on m a y be given to the reserved va lue of the claim. If no
cons idera t ion is given, the ac tuary (implicit ly) assumes that the case
reserve p rov ides no predic t ive information. This m a y be a val id
• . a s sumpt ion for immatu re claims. For more mature claims, the r epor ted
value of the case should be cons idered in the s imulat ion. General ly, this
considera t ion results in "shift ing" of the weights of the componen t s of the
mixed sever i ty mode l or t runcat ion of the severi ty dis t r ibut ion. Fur ther
research in this area is left to the in teres ted reader.
>> The s imula ted sever i ty mode l should be t runcated from be low as the
pa id - to -da te value of the claim. This may be a conservat ive ad jus tment as
it will not a l low claims to settle at their current value. An al ternat ive
w o u l d be to not consider pa id amount s and a l low ind iv idua l claims to
s imulate at less then the pa id va lue (most optimist ic) or censor the
resul t ing,claim values to the pa id value.
The reader should notice that these except ions s imply change the pa rame te r s of
the s imula t ion of u l t imate values on k n o w n claims. The basic f r amework is
identical to that used for the s imula t ion of pu re IBNR claims.
V. A Specif ic Case - Prospective Loss Forecast
The es t imat ion of loss forecasts is also s imply a special case of the IBNR
s imula t ion model . Loss forecast ing and pure IBNR es t imat ion are a lmos t
ident ical since no informat ion is k n o w n about ei ther claim type. The mode l is
ad jus ted as fol lows to s imulate prospec t ive losses:
,> T h e a priori es t imate used in the B-F calculat ion is used as the mean
es t imate of prospect ive claims. 6
>, All claims occur wi th in a single accident period. Therefore, the accident
year need not be s imula ted .
6 Essentially, this procedure is identical to. that employed for pure IBNR frequency. The percentage of claims reported for a prost~ective period is by definition 0% and the estimated ultimate number of claims using a Bomhu~etter -Ferguson model would be identical to the a priori frequency. ' '
Casua l ty Actuar ia l Society F o r u m , W i n t e r 2007 319
Using a Claim Situation Model for Reserving and Loss Forecasting for Medical Professional Liability
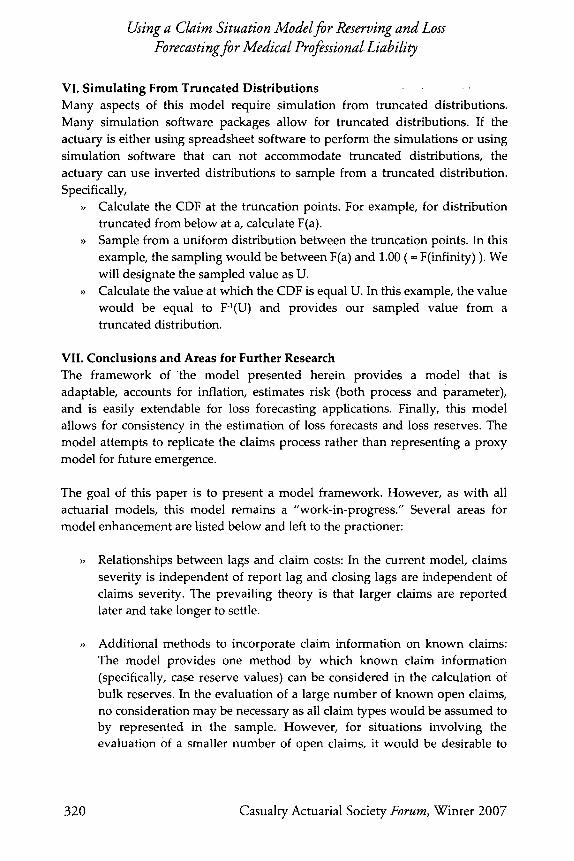
V|. Simulating From Truncated Distributions Many aspects of this model require simulation from truncated distributions. Many simulation software packages allow for truncated distributions. If the actuary is either using spreadsheet software to perform the simulations or using simulation software that can not accommodate truncated distributions, the actuary can use inverted distributions to sample from a truncated distribution. Specifcally,
,> Calculate the CDF at the truncation points. For example, for distribution truncated from below at a, calculate F(a).
,~ Sample from a uniform distribution between the truncation points. In this example, the sampling would be between F(a) and 1.00 ( = F(infinity) ). We will designate the sampled value as U.
>~ Calculate the value at which the CDF is equal U. In this example, the value would be equal to F-I(U) and provides our sampled value from a truncated distribution.
VII. Conclusions and Areas for Further Research The framework of the model presented herein provides a model that is adaptable, accounts for inflation, estimates risk (both process and parameter), and is easily extendable for loss forecasting applications. Finally, this model allows for consistency in the estimation of loss forecasts and loss reserves. The model attempts to replicate the claims process rather than representing a proxy model for future emergence.
The goal of this paper is to present a model framework. However, as with all actuarial models, this model remains a "work-in-progress." Several areas for model enhancement are listed below and left to the practioner:
Relationships between lags and claim costs: In the current model, claims severity is independent of report lag and closing lags are independent of claims severity. The prevailing theory is that larger claims are reported later and take longer to settle.
Additional methods to incorporate claim information on known claims: The model provides one method by which known claim information (specifically, case reserve values) can be considered in the calculation of bulk reserves. In the evaluation of a large number of known open claims, no consideration may be necessary as all claim types would be assumed to by represented in the sample. However, for situations involving the evaluation Of a smaller number of open claims, it would be desirable to
320 Casualty Actuarial Society Forum, Winter 2007

Using a Claim Situation Model for Reserving and Loss Forecasting for Medical Professional Liability
develop models under which the simulated severity considered as much 'of the information regarding these claims as possible.
Essentially because the model is simulating the measurable aspects of the claims process, it allows the actuary an almost limitless opportunity to study various relationships.
Casualty Actuarial Society Forum, Winter 2007 321

[1]
[2]
[3]
[4]
[51
[6]
[71
[81
Using a Claim Situation Model for Reserving and Loss Forecasting for Medical Professional Liability
. ' , BIBLIOGRAPHY
Barnett, Glen; and Zehnwirth, Ben, "Best Estimates for Reserves," Casualty Actuarial Society Forum, 1998 Vol: Fall, Proceedings of the Casualty Actuarial Society 1978 Voh LXV Page(s): 1-9, Casualty Actuarial Society: Arlington, Virginia.
Weissner, Edward W., "Estimation of the Distribution of Report Lags by the Method of Maximum Likelihood," Proceedings of the Casualty Actuarial Society 1978 Vol: LXVPage(s): 1-9, Casualty Actuarial Society: Arlington, Virginia.
Klugman, S.A.; Panjer, H.H.; and Willmot, G.E., Loss Models: From Data to Decisions, 1998, John Wiley and Sons: New York.
Keatinge, Clive L., "Modeling Losses with the Mixed Exponential Distribution," Proceedings of the Casualty Actuarial Society 1999 Vol: LXXXVI Page(s): 654-698, Casualty Actuarial Society: Arlington, Virginia.
Philbrick, Stephen W., "A Practical Guide to Single Parameter Pareto Distribution," Proceedings of the Casualty Actuarial Society 1985 Vol: LXXII Page(s): 44-84, Casualty Actuarial Society: Arlington, Virginia.
Hogg, Robert V. and Klugman, Stuart A., Loss Distributions, 1984, John Wiley and Sons, New York
Heckman, Philip E.; Meyers, Glenn G., "The Calculation of Aggregate Loss Distributions from Claim Severity and Claim Count Distributions;" Proceedings of the Casualty Actuarial Society 1983 Vol: LXX Page(s): 22- 61, Casualty Actuarial Society: Arlington, Virginia.
Kreps, Rodney E., "Parameter Uncertainty in (Log) Normal Distributions," Proceedings of the Casualty Actuarial Society 1997 Vol: LXXXIV Page(s): 553-580, Casualty Actuarial Society: Arlirlgton, Virginia.
322 Casualty Actuarial Society Forum, Winter 2007

Using a Claim Situation Mode/for Reserving and Loss Forecasting for Medical Professional Liability
Hospital for Injured Actuarial Students Est imat ion of Losses and Expense as of 9 /30/2002
Est imat ion of Report Lag
(1) (2) (3) [ Observations
Incident Date
01/06/97 01/09197 01106197 01106197 01107197 04101197 01104197 01104197 02128197 02128197 02128197 04/11/97 04/13/97 01105197 04106197 07108197 07109/97 03122197 03122197 05119197 06136197 06127197 02120197 02/15/97 09/14/97 07114197 07114197 04/01/97 11/01/01 11101101 11120101 11126101 11126161 07/12/01 01/19/00 09120101 09/20101
01/13/01 09/10/01 08/11/02 09110101 62103100 01/09/00 10/01/01 08108101 04107101 10/03/01 10/03/01 10107101 08124100 10117101 04/13/00 04113100
(4) (5) (6) (7) J (2)- (1) (3)-(1) f(x)IF(M) In(6)
Maximum Valuation Report Lag Report Lag Condttional Conditional Log-
Report Date Date (Days) (x) for Claim (M) Likelihood (L) Ltkehhood In(L)
01131197 09130102 25 2,093 1,3052-04 -8.9439 01131197 09130102 22 2,090 1.1492-04 -9.0714 01131197 09130102 25 2,693 1.305E-04 -6.9439 01131197 09130162 25 2,093 1.305E-04 -8.9439 61131197 09130102 24 2,092 1.253E-04 -8.9846 64123/97 09130102 22 2,008 1.149E-04 -9.0714 06162/97 09130102 149 2,095 7.353E-04 -7.2153 06162/97 09130102 149 2,095 7.353E-04 -7.2153 06122/97 09130102 114 2,040 5.763E-04 -7.4590 06122/97 09130102 114 2,040 5.763E-04 -7.4596 06122/97 09130/02 114 2,040 5.763E-04 -7.4590 07114197 09130102 94 1,998 4.804E-04 -7.6410 07114197 09130102 92 1,996 4 706E-04 -7 6615 07124197 09/30102 200 2,094 9 420E-04 -6 9675 07128197 09/30/02 113 2,003 5 715E-04 -7.4672 07131197 09130102 23 1,910 1 201E-04 -9 0270 07131197 09t30/02 22 1,909 1 149E-04 -9.0713 08/18/97 09/30/02 149 2,018 7.353E-04 -7.2153 08/18/97 09130102 149 2,018 7.353E-04 -7.2163 09105197 09130102 109 1,960 5.526E-04 -7.5009 09126197 09130102 88 1,918 4 510E-04 -7.7040 09/26197 09130102 91 1,921 4.657E-04 -7.6719 10/09/97 09/30/02 231 2,048 1.051E-03 -6 8583 11163/97 09130102 261 2,053 1.142E-03 -6,7748 11/05/97 09130/02 52 1,842 2.701E-04 -8.2169 11/12/97 09/30/02 121 1,904 6 0902-04 -7.4036 11/12/97 09130102 121 1,964 6.090E-04 -7.4036 12110197 09/30/02 253 2,068 1 119E-63 -6.7951 08129102 09130102 301 333 4.935E-03 -5.3115 08129102 69130102 361 333 4.935E-03 -5.3115 09116162 09130102 294 314 5.397E-03 -5.2219 09/10/02 09130102 294 314 5.397E-03 -5.2219 09/10/02 09130102 294 314 5.397E-03 -5.2219 09111162 09136102 426 445 3.430E-03 -5.6753 09/12/02 09130102 967 985 4.762E-04 -7 6496 09123102 09/30/02 368 375 4.390E-03 -5 4285 09123102 09/30/02 368 375 4.390E-63 -5 4286
i ~ i i i i 09/25/02 09/30/02 620 625 1 854E-03 -6 2901 09125102 09136162 380 385 4,240E-03 -5.4632 09125102 09/30/02 45 50 3,593E-02 -3.3263 09125102 09130102 380 385 4 240E-03 -5.4632 09125/02 09130162 965 970 4,834E-04 -7.6347 09/27/02 09/30/02 992 995 4,280E-04 -7.7565 16162/02 09/30/02 366 364 4 605E-63 -5.3806 10104162 09130102 422 418 3.7772*03 -5.5787 10/10/02 09/30/02 551 541 2.4362-63 -6 0174 10/15/02 69130102 377 362 4.686E-03 -5.3631 10115102 09/30/02 377 362 4.686E-03 -5.3631 10/15/02 09130102 373 358 4.761E-03 -5.3472 10/21/02 09130/02 788 767 1.035E-03 -6.8735 10/21/02 69130102 369 348 49802-03 -5 3023 10/23/01 09130102 558 900 1 470E-03 -6.5228 10123101 03131102 558 717 1 749E-03 -6 3489
Condittonal Locj- Ltkehhood In(L) -9150 5841 I
Model Rayleigh Parameters
Report Lag b = 437 290 Model
Estimation MLE Yln (L) -9,150.58
Exhibit 1
Casualty Actuarial Society Forum, Winter 2007 323

C~
P_..
~o P__ r j3 o t'b ~°
o
Hospital for Injured Actuarial Students Estimation of Losses and Expense as of 09/30/2002
Estimation of IBNR Claims
(1) (2) (3) (4) (5) (6) (7) (8) (9) Avg of (1) & (2) (4)- (3) CDF ((5)) (7) / (8)
t Calendar Period [
Time Average Valuation Available to
Inception Expiry Accident Date Date Report (X) Exposure
11111997 12/31/1997 07102197 09/30/2002 1,916 2,741 1/1/1998 12/31/1998 07102198 0913012002 1,551 2,838 1/1/1999 12/31/1999 07102199 0913012002 1,186 2,843 11112000 12131/2000 07101100 0913012002 821 2,929 11112001 1213112001 07102101 0913012002 455 3,144 11112002 1213112002 07102102 0913012002 90 3,322
Total 17,816
Exhibit 2
Claims Expected Estimated Reported to Percent Ultimate
Date Reported Claims
294 100% 294.02 324 100% 324.60 322 97% 330.35 278 83% 335.75 105 42% 251.18
8 2% 381.74
1,331
A. Selected a pr ior i frequency
(10) (11) (9) / ((6)) A.*(6)*(1-(8))
Estimated IBNR Claims
at Frequency 09/30/2002
0.107 0.02 0.114 0.56 0.116 7.65 0.115 53.63 0.080 194.83 0.115 346.26
602.95
0.106

C~
P_..
P__ (.f) O
b,J
-.q
Hospital for Injured Actuarial Students Estimation of Losses and Expense as of 09130/2002
Claims Settlement Model
(1) (2) (3) (4) (5) (6) (7) (8) (4) / ((3)+(4)+(5)) (3) / ((3)+(4)+(5)) (5) I ((3)+(4)+(5))
Period I Closed w/ Expense Closed with
Indemnity Only Claim no payment % of Expense Only
Total by Occurrence Year
% of Closed with % of Closed with Indemnity no paymenl
Inception Expiry
11111997 12/31/1997 11111998 12/31/1998 11111999 12131/1999 11112000 12/31/2000 11112001 12/31/2001 11112002 12/31/2002
77 103 71 41.0% 30.7% 28.3% 63 98 72 42.1% 27.0% 30.9% 44 83 75 41.1% 21.8% 37.1% 13 42 71 33.3% 10.3% 56.3%
1 4 23 14.3% 3.6% 82.1% 0 0 2 0.0% 0.0% 100.0%
Total 198 330 314 39.2% 23.5% 37.3%
Inception Expiry
1/1/1997 1213111997 11111998 12/31/1998 11111999 12/31/1999 11112000 1213112000 11112001 12/31/2001 11112002 12/31/2002
not coded
Total
Total by Closin 9 Year
0 0 0 2 5 4 45.5%
12 37 19 54.4% 43 58 23 46.8% 68 105 60 45.1% 72 114 65 45.4%
1 11 143 7.1%
198 330 314 39.2%
I Selected Distribution 40.0%
18.2% 36.4% 17.6% 27.9% 34.7% 18.5% 29.2% 25.8% 28.7% 25.9%
0.6% 92.3%
23.5% 37.3%
24.0% 36.0% I
t~J Exhibit 3

Hospital for Injured Actuarial Students ~, Estimation of Losses and Expense as of 09/30/2002
C~
P__
P_ 5/3 O
hJ
--..j
Severity Model
Model: Mixed Claim Type --> Component Model -->
i.~ = a~=
Truncation Point - Maximum Possible Claim
w,=
Normal Small Normal Large Limit Loss Lognormal Lognormal Point Mass
10.204 11.542 Mean 1,000,000
0.932 1.187 Std Dev.
1,000,000 1,000,000 None
0.566 0.378 0.047
Exhibit 4
Minimum
Maximum
Shock Uniform
1,000,000
6,000,000 None
0.009

C~
P_-
> t'3
O (7 ~o
t'J
....J
Hospital for Injured Actuarial Students Estimation of Losses and Expense as of 09/30/2002
Simulation of True IBNR Claims Sample Iteration
(1) (2) (3) (4)
Accident Date of Claim No. Year Occurrence Report Date
1 2001 01119101 12/22/03 2 2001 0 4 / 3 0 / 0 1 01/08/04 3 2002 03/19/02 07115104 4 2000 09123100 01117103 5 2002 07106102 05107104 6 2002 0 9 / 1 6 / 0 2 11/02/03 7 2002 07112102 09113103 8 2001 1 1 / 1 5 / 0 1 12/31/03 9 2001 1 2 / 2 6 / 0 1 03119105 10 2002 08116102 10/07/03 11 2002 01108102 10126/02 12 2002 03 /04102 09122/03 13 2001 03/18/01 11/06/02 14 2002 06 /01102 04103104
(5)
Type of Claim
Normal Large Normal Small Normal Small Normal Small Shock Loss
Normal Small Normal Large Normal Small Normal Small Normal Small Normal Small
Limit Loss Normal Small Normal Large
(8)
Indemni~ & Expense
68,854 63.381 8,323
14,616 2,004,453
44,159 32,163 41,512 93,695 79,486 41,606
1,000,000 37,381
294,091
"~ Exhibit 5