User’s Guide for the Single-Degree-of-Freedom Blast ...
95
PDC TR-06-02 Rev 1 September 2008 U.S. ARMY CORPS OF ENGINEERS PROTECTIVE DESIGN CENTER TECHNICAL REPORT User’s Guide for the Single-Degree-of-Freedom Blast Effects Design Spreadsheets (SBEDS) DISTRIBUTION STATEMENT A: Approved for Public Release; Distribution is unlimited. US Army Corps of Engineers ®
Transcript of User’s Guide for the Single-Degree-of-Freedom Blast ...

PDC TR-06-02 Rev 1 September 2008
U.S. ARMY CORPS OF ENGINEERS PROTECTIVE DESIGN CENTER TECHNICAL REPORT
User’s Guide for the Single-Degree-of-Freedom Blast Effects Design Spreadsheets (SBEDS)
DISTRIBUTION STATEMENT A: Approved for Public Release; Distribution is unlimited.
US Army Corps of Engineers ®

PDC TR-06-02 Rev 1 September 2008
This page intentionally blank
PDC TR-06-02 Rev 1 September 2008
1
SBEDS User’s Guide Document
1) See Instructions on the bottom of the Introduction sheet in the SBEDS workbook for general help on using the workbook. See detailed information on SBEDS
Methodology Report appended to the end of initial Help section of this document
2) Click on the applicable hyperlink from the list below for specific help with input items.
• General Input and Output Items (including solution control, design criteria, and dynamic shear factors, and results summary)
• Charge Weight-Standoff Blast Load Input Items
• One Way Corrugated Panel
• One-Way or Two-Way Steel Plate
• Steel Beam or Beam-Column
• Metal Stud Wall
• Open-Web Steel Joist
• One-Way or Two-Way Reinforced Concrete Slab
• Reinforced Concrete Beam or Beam-Column
• Prestressed Concrete Beam or Slab
• One-Way or Two-Way Reinforced Masonry
• One-Way or Two-Way Unreinforced Masonry
• Wood Beam or Beam-Column
• One-Way or Two-Way Wood Panel
• General SDOF Analysis
• Pressure-Impulse (P-i) and Standoff-Charge Weight (R-W) Diagrams
• SBEDS Methodology Report
3) Click the SBEDS.xls application button at bottom of computer screen to return to EXCEL and continue input into SBEDS

PDC TR-06-02 Rev 1 September 2008
2
Explanation of General Input and Output Items Including Blast Loads Item Explanation
Blast Load Input Type
• Manual blast load is input with a maximum of 8 time-pressure pairs on the input form below the Blast Load Input pulldown menu.
• Charge Weight and Standoff input is described in Table 3. • Pressure-time history file prompts user to select an input text file with an optional
first line with number of time-pressure pairs followed by lines with one time-pressure pair separated by commas. This option will read a DPLOT file saved using the ASCII file option. If the initial time in file is not zero, it is subtracted from all times to get t(0)=0. See Appendix A for an example file. Note: The user designated file must have correct units (see below). User should change units on pressure history plot in DPLOT before saving to get required units below by using Edit/Operate on X and Edit/Operate on Y.
• Note: Time Units are milliseconds, Pressure Units are psi (English), kPa (Metric)
Gravity Displacement
• None (vertical component) the component is perpendicular to the ground, there is no component initial deflection or resistance from gravity effects.
• In Direction of Blast Load the component is parallel to the ground surface and deflects under gravity in the same direction as the initial applied blast load. SDOF calculations include an initial positive deflection and resistance from gravity effects based on the component self-weight and supported weight.
• Opposite Blast Load Direction the component is parallel to the ground surface and deflects under gravity in opposite direction as the initial applied blast load. SDOF calculations include an initial negative deflection and resistance from gravity effects based on the component self-weight and supported weight.
• Note: The input component self-weight and supported weight must not cause any yielding for gravity displacement in direction of blast load or in opposite direction
Dynamic Shear Factors
• F and R are the factors applied to the blast pressure and component resistance, respectively, at each time step using Equation 11-26 in UFC 3-340-01 to determine the dynamic shear pressure history at a given support. These factors are a function of the boundary conditions, load distribution, and deflected shape function. The dynamic shear pressure history must be multiplied by the full component blast loaded area to get the total shear reaction load along the support.
• F and R factors are provided in SBEDS based primarily on Chapter 11 in UFC 3-340-01. See Section 4.3.1 of SBEDS Methodology Manual for additional information.
• F and R factors for elastic response are used at time steps when the resistance is less than the ultimate flexural resistance for inbound and rebound response. Otherwise, F and R factors for plastic response are used.
% of Critical Damping
The input percentage of critical damping is multiplied by the critical damping constant to determine the damping constant used in the SDOF calculations at each time step. See Table 4 for more information on damping, which is intended for response that is primarily elastic. Damping is calculated in SBEDS as recommended in UFC 3-340-01, where the damping constant is nonzero based on user input for time steps when the resistance is less than the ultimate flexural resistance during inbound and rebound response. Otherwise, the damping constant is set to 0.05%. Even when the user inputs 0% damping, SBEDS uses this very low value of damping because there is always at least a minimal amount of damping present in a real system and a very small amount of damping makes the numerical solution to determine maximum response of the SDOF system slightly more stable.

PDC TR-06-02 Rev 1 September 2008
3
Item Explanation Time Step The input time step should typically be equal to the recommended time step, shown
above the time step input space. The recommended time step is the smallest value based on the following criteria. • 10% of the natural period • 10% of the smallest time increment in a manually input blast load • 3% of the equivalent triangular positive phase duration or 1.5% of the equivalent
triangular negative phase duration of an input charge weight-standoff blast load • 3% of the smallest calculated time between local maxima and minima points of a
input blast load file • The total 2900 time steps in the time-stepping SDOF method in SBEDS divided
by 8 natural periods (but not less than 0.01 ms) Note 1: The accuracy of the solution tends to increase as the time step decreases. If the time step can be changed by a factor of 2 or 3 and virtually the same answer is achieved, then the user can be confident that the result is not influenced by the time step. The spreadsheet solution may become unstable if the time step is much greater than the first two bulleted items above or 10% of the blast load positive or negative phase duration. A smaller time step (i.e. 3%) is recommended above for cases with blast loads that can have an exponential decay to increase accuracy. Note 2: If the time step is too small, dynamic response will not be calculated all the way out to peak deflection. The spreadsheet is programmed to give a warning message if peak deflection is not calculated, but the user should always review the displacement vs. time plot. If peak deflection is not calculated, increase the time step as much as possible without significantly exceeding the first four bulleted items above. The use of an initial velocity in place of an input blast pressure history (or in place of a short duration “spike” within the history) may also be appropriate, see next item.
Initial Velocity The input initial velocity is applied as an initial condition in the SDOF equation of motion. This may be useful when the blast load duration is less than one-third of the natural period and a time step that is small enough compared to the blast load duration is too small to capture peak displacement. In this case, an initial velocity v0=i/(mKlm) may be used in place of the blast load, where i = blast load impulse, Klm = initial load-mass factor, and m=mass. A time step equal to 10% of the natural period can be used if the only input load is an initial velocity.
Response Criteria
• θ and μ are input maximum allowable design support rotation and ductility ratio, respectively, for the input component. They are compared to the calculated θ and μ values from the SDOF analysis in the Results Summary.
• Recommended values for θ and μ based on selected component sub-category and LOP/Type from the two drop-down boxes under Response Criteria are provided by SBEDS based on values in the Response_Limits.xls file, which is maintained by the Protective Design Center at the U.S. Army Corps of Engineers, Omaha District (PDC). This file is based on PDC-TR 06-08 Rev 1 distributed with SBEDS by the PDC. The response limits are primarily applicable for Antiterrorism/Force Protection in the DoD. The LOP/Type refers to the desired Level of Protection (LOP) for the building containing the input component and the Type (i.e., Primary or Secondary/NS) of the input component. Primary framing components are Primary. Cladding and secondary framing components (i.e., girts and purlins) are Secondary.
• Alternative design values for θ and μ are found in other blast design documents, including TM 5-1300 and “Design of Blast Resistant Buildings in Petrochemical Facilities” from ASCE. The user may select the “User Defined” option in the first component sub-category drop-down box under Response Criteria and then directly enter any desired θ and μ design values for the input component. If the user selects “User Defined”, the LOP/Type is not used. SBEDS has no response

PDC TR-06-02 Rev 1 September 2008
4
Item Explanation criteria applicable for shear controlled response.
SDOF Calculations
SDOF calculations are performed using a constant velocity numerical integration scheme as generally recommended in “Introduction to Structural Dynamics” by J.M. Biggs (1964). Based on numerous trials, this simple method is stable and accurate for a wide variety of resistance-deflection cases provided the time step is small enough, which is typically possible with the 2900 time steps in SBEDS. The stiffness and resistance at each time step are determined as described in Table 1 and Figure 2 and Figure 3.
Xmax Inbound and Xmin Rebound
The maximum calculated inbound displacement and the maximum calculated negative rebound displacement. Inbound response is in the direction of positive blast load. If no negative rebound deflection is calculated, Xmin =0.
θmax and μ in Results Summary
• θmax is the maximum support rotation based on larger of Xmax Inbound or Xmin Rebound divided by the shortest calculated distance from a support to point of maximum deflection.
• μ is the ductility ratio based on the larger of Xmax Inbound divided by the elastic yield deflection or Xmin Rebound divided by the elastic rebound yield deflection. The equivalent elastic yield deflections, xE, is used to determine μ for indeterminate component (see Figure 1).
Note: μ is always expressed as a positive value, θmax is negative when maximum rebound displacement is larger than maximum inbound displacement.
Rmax and Rmin Maximum resistance during inbound response and maximum negative resistance during rebound. Inbound response is in the direction of positive blast load.
Dynamic Axial Load
The Results sheet shows the applied Dynamic Axial Load per Unit Width on the same plot as the applied blast load. This load, which is read from a save file, is applied axially over the blast-loaded width of the analyzed component to cause P-delta effects that are accounted for in the SDOF analysis as explained in Section 4.4 of the SBEDS Methodology Manual. Since this option is only available for component types typically used as load bearing components, it is discussed in sections for each applicable component type.
Peak Dynamic Reactions
The Results sheet shows the maximum calculated dynamic reaction pressures from Equation 11-26 in UFC 3-340-01 based on the Dynamic Shear Factors determined by SBEDS on the Input sheet. These pressures can be multiplied by the component span length to get the peak dynamic reaction load per unit width along the support.
Strain-Rate to First Yield
The Results sheet shows the calculated strain-rate, equal to the dynamic yield strain (i.e. dynamic yield stress divided by elastic modulus or 0.002 in/in for concrete and masonry) divided by the time to yield (when inbound deflection = xe for determinant and xE for indeterminate components in Figure 1). If no yield occurs, the maximum strain is divided by the time to maximum response assuming strain increases linearly with resistance up to first yield. Separate strain rates are calculated for reinforcing steel and concrete/masonry in reinforced concrete/masonry components. Note: No strain-rate is output for Open Web Steel Joists.
SDOF Output Response Histories
The SDOF Output sheet in the SBEDS workbook has all a full suite of calculated response histories, the applied blast load history, and the equivalent calculated load history representing P-delta effects. All of these response and load histories can be saved to a DPLOT file with a SAVE button on this sheet.
Dynamic Reactions on Supporting Components
The SDOF Output sheet in the SBEDS workbook has SAVE file buttons to save the calculated dynamic reaction pressure histories to files that can be read as Pressure-Time file loads into a subsequent SBEDS analysis of a supporting member. They act over the full loaded area of the component. The saved dynamic reaction pressure histories are multiplied by 2.0 to represent the dynamic reaction pressure load acting over the tributary area of a supporting component, except for components with a cantilever boundary condition. See Section 3.5 of the SBEDS Methodology Manual for additional explanation.

PDC TR-06-02 Rev 1 September 2008
5
Item Explanation
SAVE and RETRIEVE click buttons
Use SAVE button to save user input for any component type into a user designated text format save file using the pop-up browser feature. The save file information can be read back into SBEDS using the RETRIEVE button on the Input sheets. A saved file with any component type or units can be retrieved from an Input sheet for any component type. A component type that is either the same or different from the component type on the current Input sheet can be retrieved.
Figure 1. Resistance-Deflection Curve Showing Equivalent Elastic Deflection (xE)
x4_reb
3R = 4R
R1
2R
maxR
k1
k2
k3k4
k5
k1_rb
x4
k2_rb
k3_rb
Deflection
k5_rb
Res
ista
nce
= 0
0=
maxx
1_rbR
R2_rb
3_rbR = 4_rbR
max_rbR
1kk4_rb
Figure 2. General Resistance-Deflection Diagram Without Softening
Note: ki are input stiffness for stiffness regions i = 1 to 5 ki_rb are input stiffness for stiffness regions i = 1 to 5
Ri are input inbound resistances for stiffness regions i = 1 to 5: ri≥0 Ri_rb are input rebound resistances for stiffness regions i = 1 to 5: ri_rb≤0 xi are input inbound maximum deflections for stiffness regions i = 1 to 5: xi≥0 xi_rb are input rebound maximum deflections for stiffness regions i = 1 to 5: xi≤0 xi is only used if ki = 0 and ki+1≠ 0 and xi_rb is only used if ki_rb = 0 and ki+1_rb≠ 0 (see Table 1)

PDC TR-06-02 Rev 1 September 2008
6
3R = 4RR 1
2RmaxR
k1
k2 k3
k4
k5
k1_rb
x4
k3_rbk4_rb
Deflection
Res
ista
nce
= 0
0=
maxx
Softening<3(k 0)
X 2_rb = 0
k2_rb = 05_rbk
R 3_rb
1_rbR R= 2_rb1k R= 4_rb
4_rbX
k2_rb = 0
Figure 3. Typical Resistance-Deflection Diagram With Softening (See Figure 2
and Table 1 for Definition of Terms in Figure)
Table 1. Definition of Terms for Stiffness Region Criteria Tables Parameter Definition Ri where i=1..4 Inbound yield resistance for ith stiffness region (Ri ≥ 0) Ri_rb where i=1..4 Rebound yield resistance for ith stiffness region (Ri_rb≤ 0) R_max Maximum resistance from previous cycle ki Stiffness value for ith stiffness region in inbound response ki_rb Stiffness value for ith stiffness region in rebound. xi and xi_reb Yield displacements for ith stiffness region in inbound and rebound. SBEDS
uses these values as a basis for changing stiffness region when the current stiffness equals zero. Otherwise, SBEDS compares the resistance at the current time step to the yield resistance for the current stiffness region to change stiffness regions, see Table 2 for more information.

PDC TR-06-02 Rev 1 September 2008
7
Table 2. Criteria for Determining To Stay in Current Stiffness Region During Dynamic Response
Case Criteria for Staying in ith Region 1,2 Response in ith region for components with no softening (i.e., no negative stiffnesses)3
SBEDS stays in current ith stiffness region for ki >0 when R<Ri during inbound and R>Ri_rb during rebound and for ki <0 when R>Ri during inbound and R<Ri_rb during rebound. See next case of ki = 0 in row below.
Response in ith inbound region when ki = 0
SBEDS stays in current ith stiffness region for x<xi (for perfectly plastic response where ki = 0 for all i greater than the current i this criteria is not necessary)
Response in ith rebound region when ki_rb = 0 and ki+1_rb ≠ 0
SBEDS stays in current ith stiffness region for x>xi_rb
Response in ith region for components with softening
Same as all three cases above for first inbound response. Then, SBEDS stays in current ith stiffness region when R<-Ri_rb during inbound and R>Ri_rb during rebound 4 (i.e., input rebound resistances and stiffnesses are used for inbound response after first inbound cycle – see discussion in paragraphs below)
Response in ith region for unreinforced masonry with brittle flexural response mode
Same as softening case above if cracking (i.e., softening) has occurred. Otherwise, SBEDS stays in current ith stiffness region when R>-Ri during rebound R<Ri during inbound prior to cracking 4 (i.e., input inbound resistances and stiffnesses are also used for rebound response prior to cracking– see discussion in paragraphs below)
Note 1: If velocity changes sign, stiffness is changed to input k1 value for opposite response direction Note 2: When criteria for staying in region is not met, stiffness is changed to the input stiffness value for next highest region. When i=5, the stiffness is only changed by rebound (i.e., velocity sign change). Note 3: Not applicable for unreinforced masonry with brittle flexural response mode Note 4: See discussion below regarding components with softening including special case of unreinforced masonry with brittle flexural response.
The rules used to transition between stiffness regions were set up to cover the most common situations for the component types and response types in SBEDS, including special rules for components with softening in the input resistance-deflection curve and for unreinforced masonry components with brittle flexural response mode and arching from axial load. The basic approach for components without input softening in the resistance-deflection curve is illustrated in Figure 2 and described in the first three rows of Table 2. These rules also apply during the first inbound response for components with input softening in the resistance-deflection curve. Softening, which is shown in Figure 3, is assumed to imply that the input component has compression membrane response or is an unreinforced masonry components with brittle flexural response and arching from axial load. For the case of a component with compression membrane response, SBEDS automatically arranges the rebound resistance-deflection curve to prohibit compression membrane during rebound until the deflection is less than zero, since this response mode depends on the location of the midspan deflection relative to the supports. It is arguable if previously crushed material can still provide the same stiffness during subsequent response cycles, but SBEDS simplistically assumes no change in stiffness

PDC TR-06-02 Rev 1 September 2008
8
(i.e., degradation) due to multiple response cycles. SBEDS uses the rebound stiffnesses and the negative of the rebound resistances for all inbound cycles after the first inbound cycle. This prohibits compression membrane during subsequent inbound cycles unless the deflection is greater than zero. This would not occur if the inbound values for resistance and stiffness were used for subsequent inbound cycles. An unreinforced masonry component with a brittle flexural response mode and arching from axial load has an input resistance-deflection similar to Figure 3 except that the peak resistance is due to flexural response rather than compression membrane. Softening implies brittle cracking and a loss of all flexural strength for any subsequent rebound and inbound cycles. However, rebound flexural response can occur if there has not been cracking. SBEDS automatically arranges the rebound resistance-deflection curve for an unreinforced masonry component that has a brittle flexural response mode and arching from axial load assuming cracking has occurred during the first inbound response, so that no flexural stiffness is included during rebound. This assumption is applicable during rebound only if cracking occurs during inbound response and it is also applicable to all subsequent inbound response cycles after cracking has occurred. Therefore, the case for softening described above, where the rebound stiffness and resistance are used for inbound response, is applicable for all cycles after cracking. Prior to cracking, SBEDS uses the inbound resistances and stiffnesses for rebound because they are applicable for both inbound and rebound response prior to cracking. These rules are hard-coded into SBEDS. The rules for an unreinforced masonry component with brittle flexural response mode and arching from axial load are only applied by SBEDS to the SDOF response calculations when this component and response type are selected by the user. The rules for softening are applied for any other case with softening in the calculated response. These rules can be controlled by the user when using the General SDOF Analysis input template. Go back to the top of this document to link with specific help for this component type.
PDC TR-06-02 Rev 1 September 2008
9
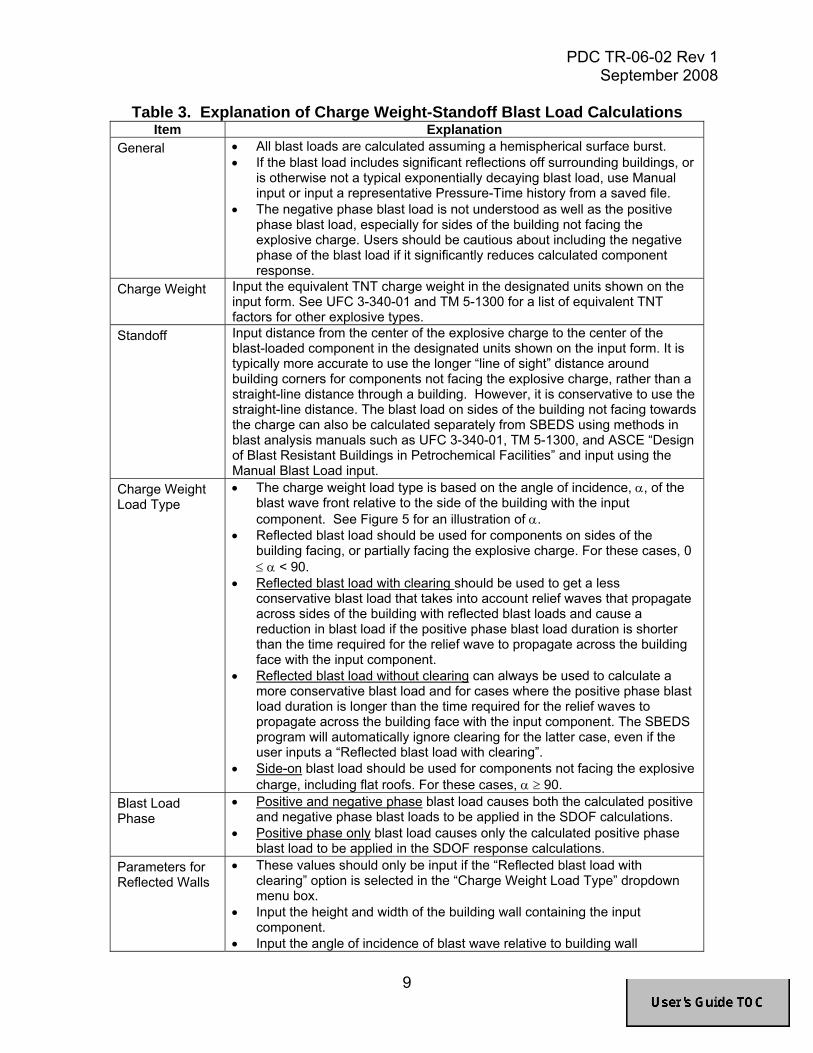
Table 3. Explanation of Charge Weight-Standoff Blast Load Calculations Item Explanation
General • All blast loads are calculated assuming a hemispherical surface burst. • If the blast load includes significant reflections off surrounding buildings, or
is otherwise not a typical exponentially decaying blast load, use Manual input or input a representative Pressure-Time history from a saved file.
• The negative phase blast load is not understood as well as the positive phase blast load, especially for sides of the building not facing the explosive charge. Users should be cautious about including the negative phase of the blast load if it significantly reduces calculated component response.
Charge Weight Input the equivalent TNT charge weight in the designated units shown on the input form. See UFC 3-340-01 and TM 5-1300 for a list of equivalent TNT factors for other explosive types.
Standoff Input distance from the center of the explosive charge to the center of the blast-loaded component in the designated units shown on the input form. It is typically more accurate to use the longer “line of sight” distance around building corners for components not facing the explosive charge, rather than a straight-line distance through a building. However, it is conservative to use the straight-line distance. The blast load on sides of the building not facing towards the charge can also be calculated separately from SBEDS using methods in blast analysis manuals such as UFC 3-340-01, TM 5-1300, and ASCE “Design of Blast Resistant Buildings in Petrochemical Facilities” and input using the Manual Blast Load input.
Charge Weight Load Type
• The charge weight load type is based on the angle of incidence, α, of the blast wave front relative to the side of the building with the input component. See Figure 5 for an illustration of α.
• Reflected blast load should be used for components on sides of the building facing, or partially facing the explosive charge. For these cases, 0 ≤ α < 90.
• Reflected blast load with clearing should be used to get a less conservative blast load that takes into account relief waves that propagate across sides of the building with reflected blast loads and cause a reduction in blast load if the positive phase blast load duration is shorter than the time required for the relief wave to propagate across the building face with the input component.
• Reflected blast load without clearing can always be used to calculate a more conservative blast load and for cases where the positive phase blast load duration is longer than the time required for the relief waves to propagate across the building face with the input component. The SBEDS program will automatically ignore clearing for the latter case, even if the user inputs a “Reflected blast load with clearing”.
• Side-on blast load should be used for components not facing the explosive charge, including flat roofs. For these cases, α ≥ 90.
Blast Load Phase
• Positive and negative phase blast load causes both the calculated positive and negative phase blast loads to be applied in the SDOF calculations.
• Positive phase only blast load causes only the calculated positive phase blast load to be applied in the SDOF response calculations.
Parameters for Reflected Walls
• These values should only be input if the “Reflected blast load with clearing” option is selected in the “Charge Weight Load Type” dropdown menu box.
• Input the height and width of the building wall containing the input component.
• Input the angle of incidence of blast wave relative to building wall

PDC TR-06-02 Rev 1 September 2008
10
containing input component, α. See Figure 5. The input for α should be 0 ≤ α < 90, since if α ≥ 90, then a “Side-on” blast load should be selected for “Charge Weight Load Type”. It is always conservative to use an angle of incidence equal to zero, which causes a fully reflected blast load.
Positive Phase Blast Load Calculations
• The positive phase peak pressure and impulse for all side-on blast loads are calculated from the scaled curves in Fig. 5-6 of UFC 3-340-01.
• The positive phase peak pressures for all reflected blast loads are calculated using the input angle of incidence, α, the peak side-on pressure, and reflection factors Crα in Fig. 5-3 of UFC 3-340-01.
• The positive phase impulses for all reflected blast loads without clearing are calculated using the input angle of incidence, α, the peak side-on pressure, and scaled reflected impulse factors from Fig. 2-194 in TM 5-1300 with some minor adjustments to cause fully reflected impulses from this graph to match those from Fig. 5-6 of UFC 3-340-01.
• The positive phase impulses for all reflected blast loads with clearing are calculated from the input building wall dimensions based on Section 9.3.3 and Eq. 9-11 in UFC 3-340-01. The peak pressure for these cases is calculated considering the input angle of incidence, α.
• The shape of the positive phase blast load is based on the exponential decay coefficient from the CONWEP computer program for all cases except reflected blast loads with clearing, where the shape is linear based on Section 9.3.3 of UFC 3-340-01.
• SBEDS calculates the pressures at 1000 evenly spaced time interval points within the positive blast load duration. The pressures at each time step in the SDOF calculations are interpolated between time interval points.
Negative Phase Blast Load Calculations
• The negative phase peak pressure and impulse of side-on blast loads and fully reflected blast loads are calculated from curve-fits to scaled curves in Fig. 5-6 and 5-7 of UFC 3-340-01. The shape of the negative blast pressure history is shown in Figure 4 from page 2.08-20 of the "Blast Resistant Structures, Design Manual 2.08, December 1986" from the U.S. Navy. This shape is used for both reflected and side-on loads, subject to the modification factors Cp- in Equation 1.
• The peak pressure and impulse of the negative phase are based on fully reflected values if the input angle of incidence, α, is less than 45 degrees. Otherwise, it is based on side-on values.
• There is no available methodology for calculating clearing effects on negative blast loads. The peak pressure and impulse of the negative phase is not affected by clearing, even when the user selected “Reflected blast loads with clearing”, except when the clearing time occurs prior to the peak negative phase blast load estimated to occur at one quarter of the negative phase blast load duration. In this case, the side-on negative phase blast load is used because it is assumed that the blast load is fully cleared during all or most of the negative phase blast loading.
• SBEDS calculates the pressures at 1000 evenly spaced time interval points within the negative blast load duration. The pressures at each time step in the SDOF calculations are interpolated between time interval points.

PDC TR-06-02 Rev 1 September 2008
11
1.00
0.80
0.60
0.40
0.20
0.00
0 0.2 0.4 0.6 0.8 1
t-/t-o
P- /P- o
2
14
27⎟⎟⎠
⎞⎜⎜⎝
⎛−⎟
⎟⎠
⎞⎜⎜⎝
⎛= −
−
−
−
−
−
ooo tt
tt
PP
Figure 4. Pressure History Shape Used in SBEDS for Blast Load from Input
Charge Weight and Standoff
−
−−
−−−
=
=
'
*'
iiCp
Cptt
Equation 1 where:
t’- = time since first negative pressure t - = corrected time since first negative pressure used in SBEDS calculations i’- = impulse calculated with equation for negative pressure history in Figure 4 i- = actual negative phase impulse from UFC 3-340-01 charts
Note: Negative phase times (time after first negative pressure) are modified to cause impulse of approximate blast history shape in Figure 4 to match actual negative phase impulse. Typically t’- is modified by less than 10%.
Figure 5. Plan View Showing Angle of Incidence of Shock Front Relative to
Building Wall
P-o = peak negative
pressure t -o = negative phase duration t - = see Equation 1
Blast Wave Front
α = Angle of Incidence
Components at Locations a, b, or c (anywhere on wall) all have same α
Blast Source
α

PDC TR-06-02 Rev 1 September 2008
12
Table 4. Damping Factor Information For Primarily Elastic Dynamic Response
Note: Multiply above Structural Damping Ratio values by 100 to get “% of Critical Damping“ values for SBEDS input.

PDC TR-06-02 Rev 1 September 2008
13
Input of Steel Components Item Explanation
Flexural Response
• Flexural response is based on yielding at the maximum moment regions with resistance-deflection curves as shown in Figure 6. Load-mass, stiffness, and ultimate flexural resistance values for all one-way and two-way components are based on Chapter 3, TM 5-1300, except as below.
• The elastic resistances for two-way components with fixed supports are based on Table 10-5 in UFC 3-340-01. For components with adjacent fixed supports, the elastic resistance is based only on the negative moment capacity acting on the yield lines pattern for ultimate resistance.
• All ultimate resistances for two-way spanning components are calculated based on TM 5-1300 with a 1.08 increase factor to account for conservative approach in TM 5-1300 where only 2/3 maximum moment capacity is assumed in corners.
Flexural and Tension Membrane Response
• This response mode should only be selected if the component has supports that prevent in-plane displacement as the component responds to blast load. The in-plane tension capacity of the component supports must be input as explained below in table.
• Response is based on yielding at the maximum moment regions (using KE in Figure 6 for components with indeterminate boundary conditions) followed by linear tension membrane response as shown in Figure 7. KE is based on Equation 3.34 in TM 5-1300 assuming equal positive and negative moment capacities for two-way spanning components with fixed supports.
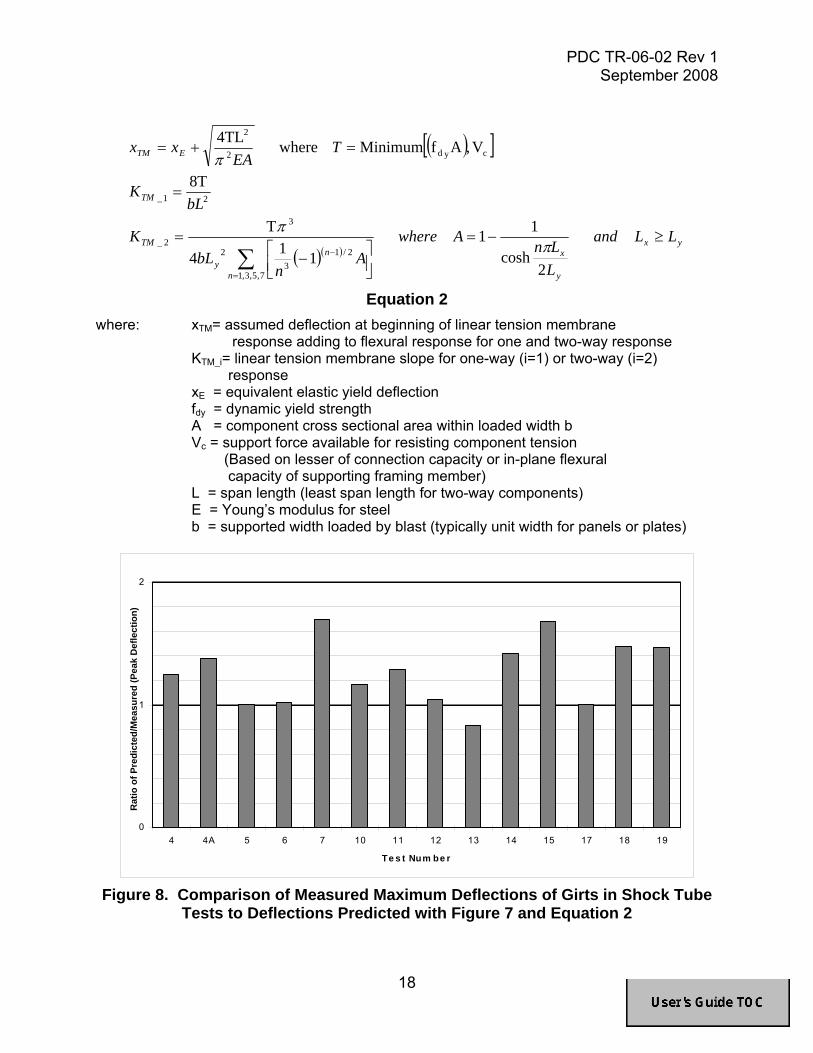
• Tension membrane response calculations are approximate. A constant tension membrane stiffness based on the maximum tension in component is assumed to add to the flexural response at a deflection xTM , as shown in Figure 7 and Equation 2. Previous calculations by BakerRisk for shock tube tests show this approximate method compares reasonably well to test data as shown in Figure 8, where predicted girt deflections were based on Figure 7 and Equation 2 for one-half scale shock tube tests on cold-formed steel girts.
• Conservatively, tension membrane response can be ignored. TM 5-1300 recommends that tension membrane be ignored for corrugated steel panels, where tension membrane is implicitly accounted for with higher allowable response limits for panels well connected to supports.
Note: When KTM>KE in Figure 7, tension membrane stiffness exceeds flexural stiffness. The SDOF analysis will not correctly calculate rebound for this case and calculations are stopped at the maximum deflection. If rebound is critical, another methodology should be used to calculate response.
Column Anchor Bolt Shear Response
• Tests have shown the base plate bolts take load very quickly and the bolts will fail in shear before the column fails in flexure. Therefore, it is recommended that columns be embedded into the floor slab, if the column is not continuous into a basement. If this is not possible, the column should be analyzed with its ultimate resistance based on the anchor bolt shear capacity and have a maximum allowable ductility ratio of 1.0 to avoid failure (i.e. hazardous damage). This can be done using the General SDOF option on the Intro Sheet of SBEDS.
Supported Weight
• Input the supported weight that moves through same deflection as component. This is equal to the total supported weight for panels and closely spaced beams (i.e. up to approximately 7 ft). Conservatively, 20% of the supported weight over total tributary area can be input for beams or columns at further spacing.
Loaded Area • Ratio of [blast loaded area on component] to [component spacing*span].

PDC TR-06-02 Rev 1 September 2008
14
Item Explanation Factor, AF AF =1 for any uniformly distributed blast load, AF ≤1for concentrated loads
where attached components transfer load from area that does not include full span. See Figure 9 for example case where AF = 0.5. Stiffness and resistance values are based on a blast loaded area = AF BL. Mass calculations unaffected by AF since supported mass per unit loaded area is input directly and the self-weight mass is independent of AF.
Static Strength Increase Factor (SIF)
• This is the ratio of the actual static yield strength to the minimum specified yield strength. Default input values in SBEDS are shown in Table 5. This can also be referred to as an average strength factor (ASF).
Dynamic Strength Increase Factor (DIF)
• This is the ratio of the dynamic yield strength including strain-rate effects to the actual static yield strength. Default input values in Table 6 for “Low Pressure” are provided in SBEDS. See Chapter 4 in UFC 3-340-01 for more detailed information on DIF and strain-rate for steel. See “Results” sheet for strain-rate from SDOF calculations for input component. The “User Defined” material property may be used to input DIF and SIF values.
Moment Capacity • Moment capacity for corrugated panels is calculated as 0.9fdy* Savg, where Savg is the average of the section modulus for positive and negative moment regions.
• Moment capacity for steel plates is calculated as fdy*(S+Z)/2. • Moment capacity for cold-formed beams is calculated as fdy*S, if well
braced. • Moment capacity for hot-rolled beams is calculated as fdy*Z, if well braced. • Moment capacity for beams not well braced and beam-columns is
calculated using Equation 5-44, 5-45, and 5-47 in TM 5-1300 with My=0 and Cm/(1-P/Pex)=1, since there is no biaxial bending and second order P-delta effects are accounted for directly in SDOF calculations as described below. The compressive load includes the input static axial load and the peak dynamic axial load. These equations are consistent with interaction formulas for Plastic Design in the AISC Manual of Steel Construction. Equation 5-44 and 5-45 are set equal to 1.0 and solved for Mx. The lesser value of Mx is the “available” moment capacity and is used to calculate flexural resistances. Equation 5-47 accounts for the effect of the input unbraced length of the compression flange on Mx.
Inbound and Rebound Unbraced Length for Compression Flange, Lbr
Distance between lateral brace points for the compression flange for inbound and rebound response used in Equation 5-47 from TM 5-1300. Note that the compression flange is opposite for inbound and rebound response. The damage caused by lateral torsional buckling of blast-loaded beams is not well understood and may be overestimated in SDOF calculations based on a long unbraced compression flange length. No lateral torsional bucking effects are included in moment capacity calculations in SBEDS for tube sections or beams responding in their weak axis.
Support capacity for tension membrane, Vc
Vc is the maximum in-plane tension strength provided by the connection and supporting framing members to the input component. See Equation 2 for effect of Vc on tension membrane response. • Typically Vc<fdyA and therefore the support capacity controls maximum
tension force in component. • Vc can be based on the full capacity of the connection when the
component bears against its support during blast load, otherwise some reduction can be made to account for out-of-plane shear forces on connection acting with in-plane tension.
• Vc can also be limited by the in-plane flexural strength of the framing component supporting the component of interest.
Static Axial Load • User should input static axial load P causing compression and P-delta
PDC TR-06-02 Rev 1 September 2008
15
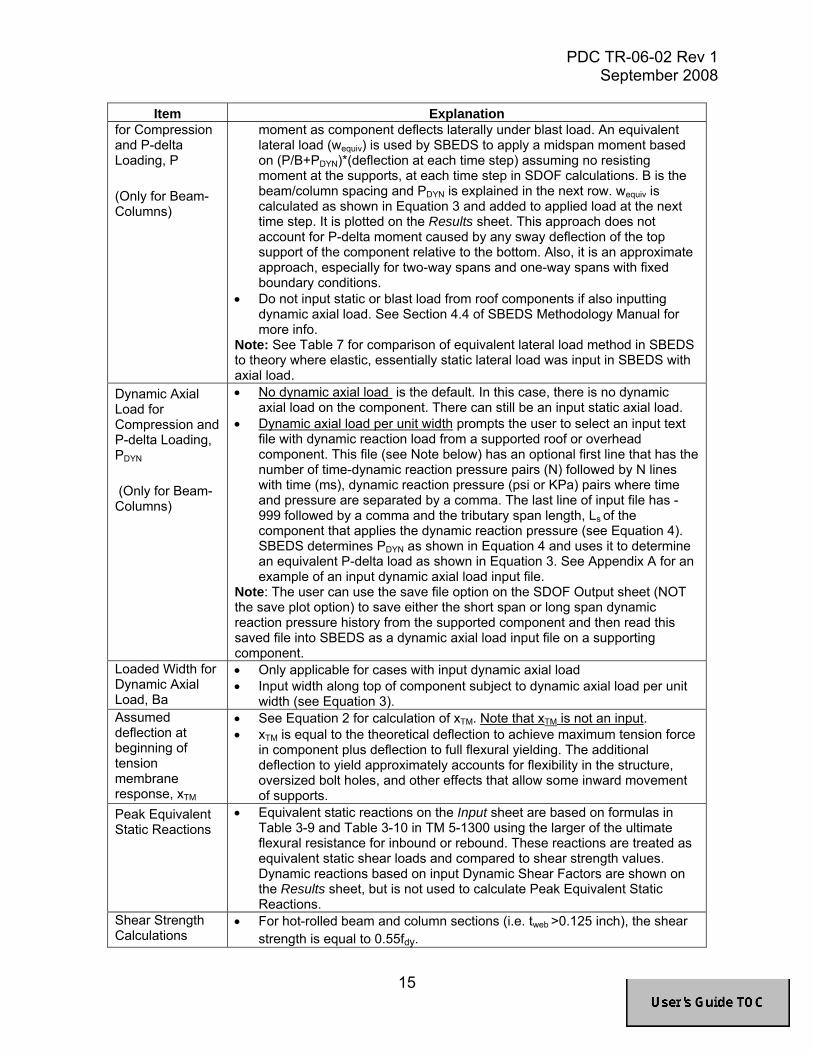
Item Explanation for Compression and P-delta Loading, P
(Only for Beam-Columns)
moment as component deflects laterally under blast load. An equivalent lateral load (wequiv) is used by SBEDS to apply a midspan moment based on (P/B+PDYN)*(deflection at each time step) assuming no resisting moment at the supports, at each time step in SDOF calculations. B is the beam/column spacing and PDYN is explained in the next row. wequiv is calculated as shown in Equation 3 and added to applied load at the next time step. It is plotted on the Results sheet. This approach does not account for P-delta moment caused by any sway deflection of the top support of the component relative to the bottom. Also, it is an approximate approach, especially for two-way spans and one-way spans with fixed boundary conditions.
• Do not input static or blast load from roof components if also inputting dynamic axial load. See Section 4.4 of SBEDS Methodology Manual for more info.
Note: See Table 7 for comparison of equivalent lateral load method in SBEDS to theory where elastic, essentially static lateral load was input in SBEDS with axial load.
Dynamic Axial Load for Compression and P-delta Loading, PDYN
(Only for Beam-Columns)
• No dynamic axial load is the default. In this case, there is no dynamic axial load on the component. There can still be an input static axial load.
• Dynamic axial load per unit width prompts the user to select an input text file with dynamic reaction load from a supported roof or overhead component. This file (see Note below) has an optional first line that has the number of time-dynamic reaction pressure pairs (N) followed by N lines with time (ms), dynamic reaction pressure (psi or KPa) pairs where time and pressure are separated by a comma. The last line of input file has -999 followed by a comma and the tributary span length, Ls of the component that applies the dynamic reaction pressure (see Equation 4). SBEDS determines PDYN as shown in Equation 4 and uses it to determine an equivalent P-delta load as shown in Equation 3. See Appendix A for an example of an input dynamic axial load input file.
Note: The user can use the save file option on the SDOF Output sheet (NOT the save plot option) to save either the short span or long span dynamic reaction pressure history from the supported component and then read this saved file into SBEDS as a dynamic axial load input file on a supporting component.
Loaded Width for Dynamic Axial Load, Ba
• Only applicable for cases with input dynamic axial load • Input width along top of component subject to dynamic axial load per unit
width (see Equation 3). Assumed deflection at beginning of tension membrane response, xTM
• See Equation 2 for calculation of xTM. Note that xTM is not an input. • xTM is equal to the theoretical deflection to achieve maximum tension force
in component plus deflection to full flexural yielding. The additional deflection to yield approximately accounts for flexibility in the structure, oversized bolt holes, and other effects that allow some inward movement of supports.
Peak Equivalent Static Reactions
• Equivalent static reactions on the Input sheet are based on formulas in Table 3-9 and Table 3-10 in TM 5-1300 using the larger of the ultimate flexural resistance for inbound or rebound. These reactions are treated as equivalent static shear loads and compared to shear strength values. Dynamic reactions based on input Dynamic Shear Factors are shown on the Results sheet, but is not used to calculate Peak Equivalent Static Reactions.
Shear Strength Calculations
• For hot-rolled beam and column sections (i.e. tweb >0.125 inch), the shear strength is equal to 0.55fdy.

PDC TR-06-02 Rev 1 September 2008
16
Item Explanation • For cold-formed beams and panels, the shear strength is calculated using
Table 5-5 through 5-7 in TM 5-1300 accounting for shear buckling effects in the web. Equations for web buckling with combined shear and bending stresses are used for corrugated panels with a fixed boundary condition.
• The shear area of corrugated steel panels is equal to the web area based on two webs per rib and input rib spacing. The shear area of beams and columns is equal to the web area for strong axis response and equal to the full cross section area for weak axis response.
• The shear capacity (Vs) is compared to the maximum Peak Equivalent Static Reaction to determine if the shear capacity is sufficient (i.e., OK ).
ReRunning SDOF with Resistance Controlled by Shear Capacity (Shear Flag)
• If the shear capacity Vs < Peak Equivalent Static Reactions, SBEDS provides a user option to recalculate dynamic response using Ru_shear from Equation 5 for all resistances (Ri) based on flexure capacity where Ri >Ru_shear. The user must enter a value of 1 in the Shear Flag input cell created by SBEDS when Vs < Peak Equivalent Static Reactions in order to rerun SBEDS with maximum resistances of Ru_shear where Ri >Ru_shear. Resistances based on tension membrane are not affected. The Error Message area on the Input Sheet provides directions for rerunning the SDOF analysis using Ru_shear.
• Note that the Peak Equivalent Static Reactions in SBEDS are based on the ultimate flexural resistance (Ru), not the maximum calculated resistance (Rmax) from the SDOF analysis. If the shear flag is calculated for a case where Rmax < Ru, the actual reactions might not exceed the shear strength. This case will be indicated by SBEDS in a message box.
• DoD design methods may require that the shear capacity Vs ≥ Peak Equivalent Static Reactions. In this case, redesign the component and do not use the shear flag.
• Use of the shear flag is generally recommended only for analysis of existing components where upgrading the shear capacity is not feasible. HOWEVER, SBEDS only includes response criteria for flexural response. See Section 4.5.2 of the SBEDS Methodology Manual for alternative response criteria for shear-controlled component response.
All Other Items Return to top of document and link to Help on General Input and Output Items Including Blast Load
Determinate Boundary Conditions Indeterminate Boundary Conditions (Solid Curve Used for Flexure Only) (Dashed Curve for Flexure and Tension Membrane)
Figure 6. Resistance-Deflection Curve For Flexural Response
PDC TR-06-02 Rev 1 September 2008
17
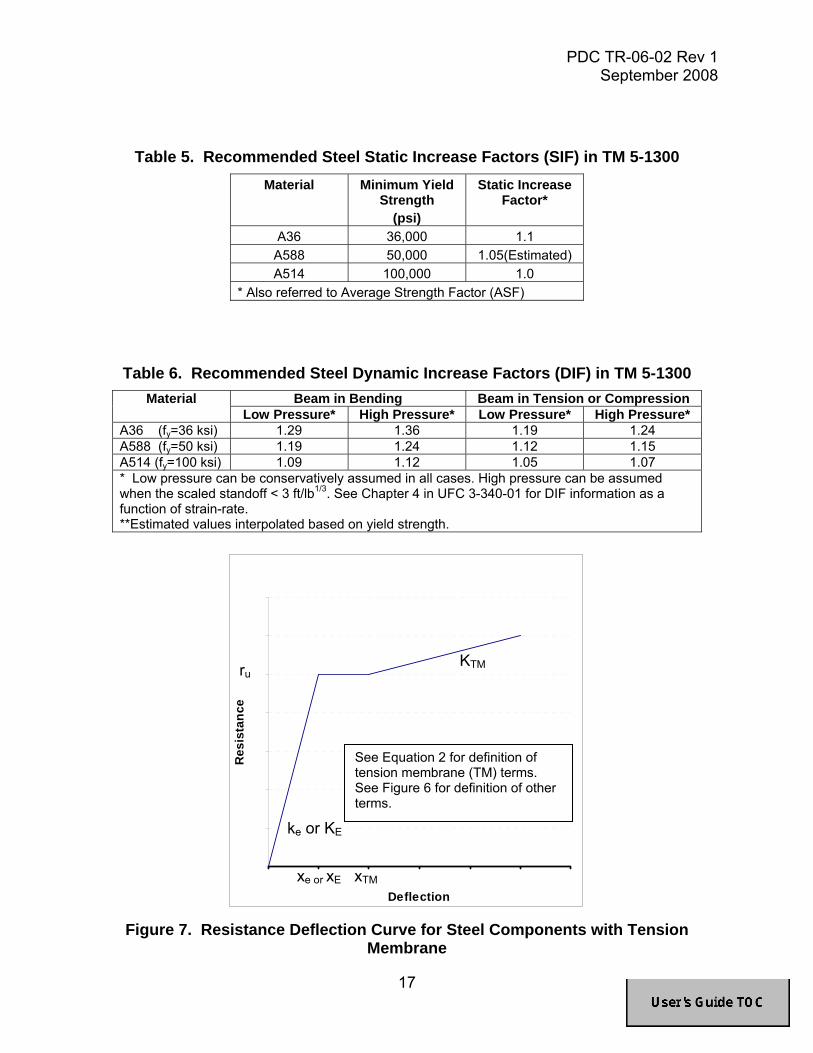
Table 5. Recommended Steel Static Increase Factors (SIF) in TM 5-1300 Material Minimum Yield
Strength (psi)
Static Increase Factor*
A36 36,000 1.1 A588 50,000 1.05(Estimated) A514 100,000 1.0
* Also referred to Average Strength Factor (ASF)
Table 6. Recommended Steel Dynamic Increase Factors (DIF) in TM 5-1300 Beam in Bending Beam in Tension or Compression Material
Low Pressure* High Pressure* Low Pressure* High Pressure* A36 (fy=36 ksi) 1.29 1.36 1.19 1.24 A588 (fy=50 ksi) 1.19 1.24 1.12 1.15 A514 (fy=100 ksi) 1.09 1.12 1.05 1.07 * Low pressure can be conservatively assumed in all cases. High pressure can be assumed when the scaled standoff < 3 ft/lb1/3. See Chapter 4 in UFC 3-340-01 for DIF information as a function of strain-rate. **Estimated values interpolated based on yield strength.
0
0.2
0.4
0.6
0.8
1
1.2
1.4
0 1 2 3 4 5 6
Deflection
Res
ista
nce
Figure 7. Resistance Deflection Curve for Steel Components with Tension
Membrane
xe or xE xTM
ru KTM
ke or KE
See Equation 2 for definition of tension membrane (TM) terms. See Figure 6 for definition of other terms.
PDC TR-06-02 Rev 1 September 2008
18
( )[ ]
( )( )yx
y
x
n
ny
TM
TM
ETM
LLand
LLn
AwhereA
nbL
K
bLK
TEA
xx
≥−=
⎥⎦⎤
⎢⎣⎡ −
=
=
=+=
∑=
−
2cosh
11114
T
8T
V,AfMinimumwhere4TL
7,5,3,1
2/13
2
3
2_
21_
cyd2
2
ππ
π
Equation 2 where: xTM= assumed deflection at beginning of linear tension membrane
response adding to flexural response for one and two-way response KTM_i= linear tension membrane slope for one-way (i=1) or two-way (i=2) response xE = equivalent elastic yield deflection
fdy = dynamic yield strength A = component cross sectional area within loaded width b
Vc = support force available for resisting component tension (Based on lesser of connection capacity or in-plane flexural capacity of supporting framing member)
L = span length (least span length for two-way components) E = Young’s modulus for steel b = supported width loaded by blast (typically unit width for panels or plates)
Figure 8. Comparison of Measured Maximum Deflections of Girts in Shock Tube Tests to Deflections Predicted with Figure 7 and Equation 2
0
1
2
4 4A 5 6 7 10 11 12 13 14 15 17 18 19
Te s t Num be r
Rat
io o
f Pre
dict
ed/M
easu
red
(Pea
k D
efle
ctio
n)

PDC TR-06-02 Rev 1 September 2008
19
L
B
Beam
Blast Loaded Areaon Girder
Girder
Note that beams only transfer blast load from 50% of the area B*L into girder in this example where the beams have a pinned connection to girders. The blast load from the rest of this area is transferred by beams directly into columns supporting girder.
Figure 9. Example of Girder with Loaded Area Factor (AF) Equal to 0.5
CLKW
tBB
tPBPWw
F
L
aDYN
LFequiv
2
)()(
=
Δ⎟⎟⎠
⎞⎜⎜⎝
⎛+=
Equation 3 where: wequiv(t) = equivalent lateral load with same spatial distribution as blast
load causing P-delta moments in component (added to applied blast load)
WF = equivalent P-delta load factor K = 8 for uniformly loaded component supported top and bottom over
axially loaded span (including all 3 side supported component = 4 for component supported top and bottom with concentrated
midspan load = 2 for uniform load component supported at bottom of axially loaded
span C = load factor in direction perpendicular to axially loaded span
accounting for component deflection distribution over axially loaded width
C = 0.64 for all two-way spans (this is conservative in some cases) C = 1.0 for all one-way spans L = span length (in direction of axial load for 2-way spanning
components) P = total static axial load applied to analyzed component PDYN(t) = dynamic axial load per unit width from supported component (usually the dynamic reaction force from a supported component along its support) See Equation 4.
B=Girder Spacing
BLarealoadedblastAF
__=

PDC TR-06-02 Rev 1 September 2008
20
Δ(t) = displacement of SDOF system at each time step Iavg = average of gross and cracked moment of inertia A = cross sectional area Ba = loaded width of analyzed component subject to dynamic axial load BL = blast loaded width of analyzed component
sDYN LtVtP )()( =
Equation 4 where:
PDYN = dynamic reaction load per unit width of component (lb/in or N/m) V(t) = dynamic reaction pressure multiplied by a factor of 2 (except when applied
by cantilevers). See Section 3.5 of the SBEDS Methodology Manual (psi or KPa)
Ls = one-half the span along the direction that applies PDYN to the support except it equals full span when loading component is a cantilever (inches or mm).Ls is typically calculated and saved to file by SBEDS when dynamic reaction pressure output is saved. (Example: Ls = 60 in for a 10 ft simply supported or fixed-simple beam. Ls = 120 in for axial load 20 ft high wall slab)
Table 7. Calculated Deflections from SBEDS for W12x40 Beam-Column
Compared to Theoretical Values (Moment Magnifier) Boundary Condition
Span (ft)
Effective Length
(ft)
Calculated with SBEDS
Theoretical (Calculated with
Moment Magnifier Method*)
SBEDS/Theoretical
50 25 1.25 1.11 1.13 40 20 1.16 1.02 1.14
Fixed-Fixed
30 15 1.09 0.94 1.16 50 35 1.46 1.45 1.01 40 28 1.33 1.28 1.04
Fixed-Simple
30 21 1.19 1.13 1.05 50 50 1.81 1.78 1.02 30 30 1.45 1.43 1.01
Simple-Simple
15 15 1.11 1.11 1.00 *Cm=0.85 for fixed support, Cm=1.0 for simple support, Cm estimated as 0.93 for fixed simple support Note: Static uniform lateral load in SBEDS was 50% of load causing first yield and axial load was 50% of axial load capacity in all cases above for W12x40 where weak axis had continuous lateral support.
PDC TR-06-02 Rev 1 September 2008
21
beamsforLBK
VRplatesorpanelsfor
LKV
RL
sshearu
L
sshearu _,___ __ ==
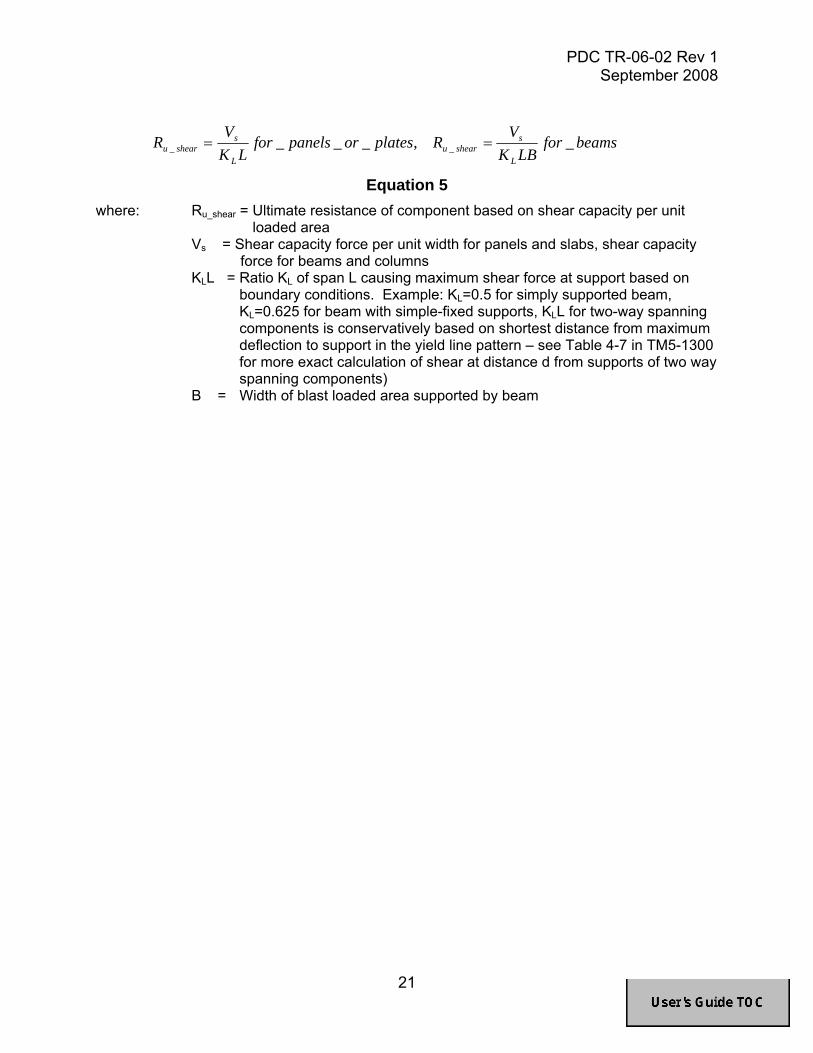
Equation 5 where: Ru_shear = Ultimate resistance of component based on shear capacity per unit
loaded area Vs = Shear capacity force per unit width for panels and slabs, shear capacity
force for beams and columns KLL = Ratio KL of span L causing maximum shear force at support based on
boundary conditions. Example: KL=0.5 for simply supported beam, KL=0.625 for beam with simple-fixed supports, KLL for two-way spanning components is conservatively based on shortest distance from maximum deflection to support in the yield line pattern – see Table 4-7 in TM5-1300 for more exact calculation of shear at distance d from supports of two way spanning components)
B = Width of blast loaded area supported by beam

PDC TR-06-02 Rev 1 September 2008
22
Input of Metal Stud Wall Components Item Explanation
Flexural Response
• Flexural response SDOF parameters are determined using load-mass, stiffness, and ultimate resistance values based on Section 10.9 and 11 of UFC 3-340-01 and TM 5-1300. See illustration in Figure 10.
Flexural and Tension Membrane Response
• Response is based on yielding at the maximum moment regions (using KE in Figure 10 for indeterminate boundary conditions) followed by linear tension membrane response as shown in Figure 12. The component must have supports that resist in-plane displacement as the component responds to blast load. The in-plane tension capacity of the component supports must be input as explained below in this table.
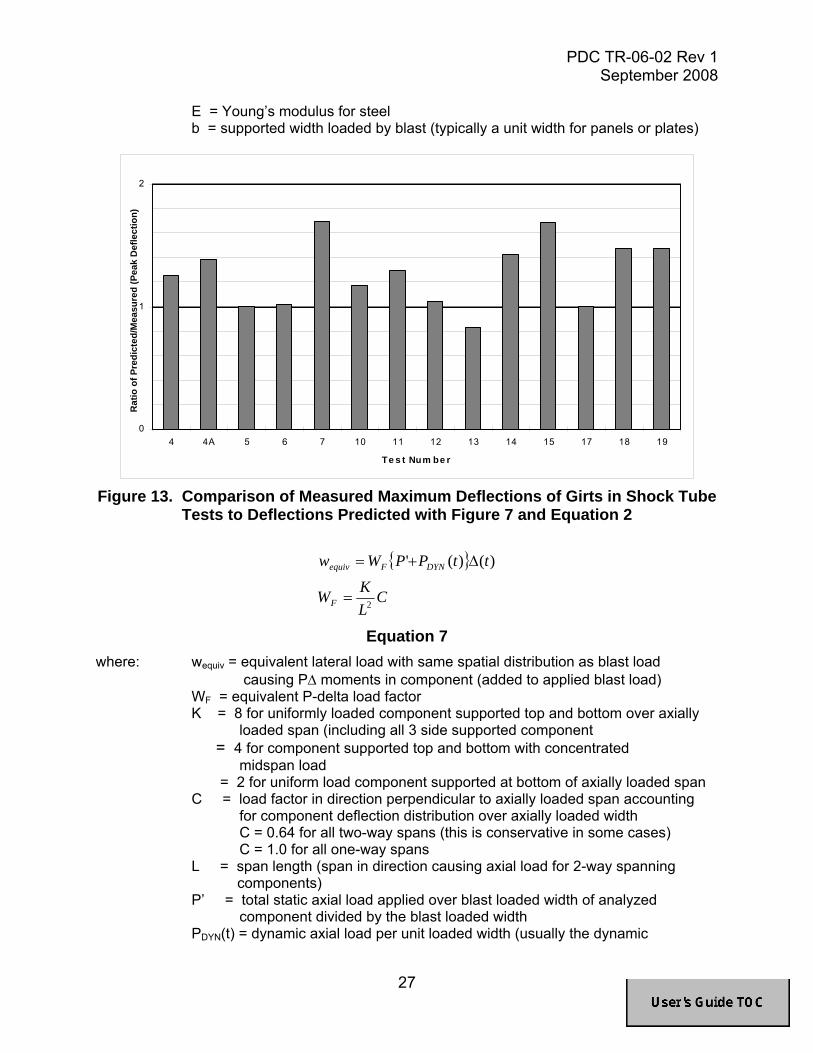
• Tension membrane response calculations are approximate. A constant tension membrane stiffness based on the maximum tension in component is assumed to add to the flexural response at a deflection xTM , as shown in Figure 12 Equation 6. Previous calculations by BakerRisk for shock tube tests show this approximate method compares reasonably well to test data as shown in Figure 13, where predicted girt deflections were based on Figure 12 and Equation 6 for one-half scale shock tube tests on steel panels supported by cold-formed steel girts.
• Conservatively, tension membrane response can be ignored. Note: When KTM>KE in Figure 12, tension membrane stiffness exceeds flexural stiffness. The SDOF analysis will not correctly calculate rebound for this case and calculations are stopped at the maximum deflection. If rebound is critical, another methodology should be used to calculate response.
Metal Stud Shapes • Structural metal stud shapes are shown in the drop down table as designated by the Steel Stud Manufacturer’s Association (SSMA) for structural and non-structural studs. The stud shape designations refer to member dimensions as shown in Figure 11 and Table 8. Also, see www.ssma.com/ssmatechcatalog.pdf for additional information. Manufacturers with their own shape designations typically have a correlation to the SSMA shape designations available on their website or from their technical representatives. User defined cross sectional information can also be input.
Web Punch-Outs • Web punch-outs are typically provided on the centerline of the web in metal studs to facilitate electrical conduit placement within the wall. Standard factory punch-outs have a minimum center-to-center spacing of 24 inches, a maximum width equal to the lesser of one-half the member depth or 2.5 inches, and a maximum length of 4.5 inches. The minimum distance to the supports is 10 inches. If designated by the user, SBEDS reduces the critical axial section of the stud for compression and tension loads based on the stud thickness and punch-out width, but does not change not the flexural or shear capacity. See Figure 11 for an illustration of a punch-out. See www.ssma.com/ssmatechcatalog.pdf for additional information.
Supported Weight (Exclusive of Structural Veneer Wall)
• This weight includes any items attached to the studs exclusive of a structural veneer wall. This includes the weight of any interior drywall and non-structural veneer wall. The user can designate the veneer wall as structural or non-structural on the input sheet.
Static Strength Increase Factor
• This factor is assumed equal to 1.21 for both Grade 33 and Grade 50 A653 cold-formed steel as recommended in TM 5-1300. This factor can also be referred to as an average strength factor (ASF).
Dynamic Strength Increase Factor
• This factor is assumed equal to 1.1 for both Grade 33 and Grade 50 A653 cold-formed steel as recommended in TM 5-1300.

PDC TR-06-02 Rev 1 September 2008
23
Item Explanation Moment Capacity • Moment capacity for metal studs without axial load is calculated as fdy*Seff,
where Seff is the effective section modulus assuming that they are well braced. • Moment capacity for stud-columns is calculated using Equation 5-44 in TM 5-
1300 with My=0 and Cm/(1-P/Pex)=1, since there is no biaxial bending and second order P-delta effects are accounted for directly in SDOF calculations as described below. The compressive axial load includes the input static axial load and the peak dynamic axial load. Equation 5-44 is set equal to 1.0 and solved for Mx, which is the “available” moment capacity and is used to calculate flexural resistances in SBEDS. The compression flange is assumed to be well braced. Equation 5-44 in TM 5-1300 is virtually the same as the controlling interaction formula in the LRFD manual for cold-formed steel design for simple supports.
Static Axial Load per Unit Width for Compression and P-delta Loading, P’
(Only for load-bearing walls)
• User should input static axial load on stud divided by the stud spacing (P’) that causes compression and P-delta moment as component deflects laterally under blast load. An equivalent lateral load (wequiv) is used by SBEDS to apply a midspan moment based on (P’+PDYN)*(deflection at each time step) assuming no resisting moment at the supports, at each time step in SDOF calculations. wequiv is calculated as shown in Equation 3 and added to applied load at the next time step. It is plotted on the Results sheet. This approach does not account for P-delta moment caused by any sway deflection of the top support of the component relative to the bottom. Also, it is approximate, especially for 2-way spans and one-way spans with fixed boundary conditions.
• Do not input static or blast load from roof components if also inputting dynamic axial load. See Section 4.4 of SBEDS Methodology Manual for more info.
Note: See Table 7 for comparison of equivalent lateral load method in SBEDS to theory where elastic, essentially static lateral load was input with axial load.
Dynamic Axial Load for Compression and P-delta Loading, PDYN
(Only for load-bearing walls)
• No dynamic axial load is the default. In this case, there is no dynamic axial load on the component. There can still be an input static axial load.
• Dynamic axial load per unit width prompts the user to select an input text file with a dynamic reaction load from a supported roof or overhead component. The load is applied over the blast-loaded width of the analyzed component. The input text file can be modified for cases where the axially loaded width is not equal to the blast loaded width as discussed in Appendix A. The input file (see Note below) has an optional first line that has the number of time-dynamic reaction pressure pairs (N) followed by N lines with time (ms), dynamic reaction pressure (psi or KPa) pairs where time and pressure are separated by a comma. The last line of input file has -999 followed by a comma and the span length, Ls (inch or mm) of the supported component that applies the dynamic reaction pressure (see Equation 8). SBEDS determines PDYN as shown in Equation 8 and uses it to determine an equivalent P-delta load as shown in Equation 7. See Appendix A for an example dynamic axial load input file. Also, see Section 4.4 of SBEDS Methodology Manual.
Note: The user can use the save file option on the SDOF Output sheet (NOT the save plot option) to save either the short span or long span dynamic reaction pressure history from the supported component and then read this saved file into SBEDS as a dynamic axial load input file on a supporting component.
Support capacity for tension membrane, Vc
• Vc is the maximum in-plane tension strength provided by the metal stud connection and supporting framing members to the input component. See Equation 6 for effect of Vc on tension membrane response.
• Typically Vc<fdyA and therefore the support capacity controls maximum tension force in component, where A is the effective axial area including the effects of web punch-outs.
• Vc can be based on the full capacity of the connection when the component

PDC TR-06-02 Rev 1 September 2008
24
bears against its support during blast load, otherwise some reduction can be made to account for out-of-plane shear forces on connection acting with in-plane tension.
• Vc can also be limited by the in-plane flexural strength of the framing component supporting the component of interest.
Deflection at beginning of tension membrane response, xTM
• See Equation 6 for calculation of xTM. Note that xTM is not an input. • xTM is equal to the theoretical deflection to achieve maximum tension force in
component plus deflection to full flexural yielding. The additional deflection to yield approximately accounts for flexibility in the structure, oversized bolt holes, and other effects that allow some inward movement of supports.
Peak Equivalent Static Reactions
• Equivalent static reactions on the Input sheet are based on formulas in TM 5-1300 using the larger of the ultimate flexural resistance for inbound or rebound. These reactions are treated as equivalent static shear loads and compared to shear strength values. Dynamic reactions based on input Dynamic Shear Factors are shown on the Results sheet but is not used to calculate Peak Equivalent Static Reactions.
Shear Strength Calculations
• The shear strength is calculated based only on the metal studs using Table 5-5 through 5-7 in TM 5-1300 accounting for shear buckling effects in the web.
Veneer wall
• The user can input a non-structural veneer wall, where the weight of the veneer is input separately as a Supported Weight as noted previously in this table. If a significant portion of a veneer wall is interrupted by a window opening, the veneer wall should be considered non-structural.
• Alternatively, the user can select a given veneer wall type that is assumed to provide strength in a response mode of brittle flexural response and axial load arching. See the Unreinforced Masonry Walls section of this document for more information. Only self weight above midheight is assumed to act as axial load on the veneer wall.
• The veneer wall is assumed to deflect with the metal studs and have the same height or span as the wall studs. It is always assumed to span one-way with simple boundary conditions.
• The resistance-deflection curves for a structural veneer wall and the input metal stud wall are superimposed for initial inbound response. If the veneer wall yields, only the metal stud wall response is assumed by SBEDS during rebound. Typically, the resistance of the veneer wall adds relatively little to the overall blast capacity to the wall system (less than 20%).
ReRunning SDOF with Resistance Controlled by Shear Capacity (Shear Flag)
• If the shear capacity Vs < Peak Equivalent Static Reactions, SBEDS provides a user option to recalculate dynamic response using Ru_shear from Equation 5 for all resistances (Ri) based on flexure capacity where Ri >Ru_shear. The user must enter a value of 1 in the Shear Flag input cell created by SBEDS when Vs < Peak Equivalent Static Reactions in order to rerun SBEDS with maximum resistances of Ru_shear where Ri >Ru_shear. Resistances based on tension membrane are not affected. The Error Message area on the Input Sheet provides directions for rerunning the SDOF analysis using Ru_shear.
• Note that the Peak Equivalent Static Reactions in SBEDS are based on the ultimate flexural resistance (Ru), not the maximum calculated resistance (Rmax) from the SDOF analysis. If the shear flag is calculated for a case where Rmax < Ru, the actual reactions may not exceed the shear strength as displayed by SBEDS in a message box.
• DoD design methods may require that the shear capacity Vs ≥ Peak Equivalent Static Reactions. In this case, redesign the component with no shear flag input
• Use of the shear flag is generally only recommended for analysis of existing components. HOWEVER, SBEDS only includes response criteria for flexural response. See Section 4.5.2 of the SBEDS Methodology Manual for alternative response criteria for shear-controlled component response.

PDC TR-06-02 Rev 1 September 2008
25
All Other Items Return to top of document and link to Help on General Input and Output Items Including Blast Load
Determinate Boundary Conditions Indeterminate Boundary Conditions (Solid Curve Used for Flexure Only) (Dashed Curve for Flexure and Tension Membrane)
Figure 10. Resistance-Deflection Curve For Flexural Response
Figure 11. Metal Stud Size Designation and Cross Section of Typical S-Section
Stud with Punch-Out (See Table 8 Below for Information on Mils)
Table 8. Correlation Between Metal Stud Gage Thickness and Mils Gage Minimum Thickness
(1/1000 of an inch= mil) Minimum Thickness
(mm) 25 18 0.455 22 27 0.683 21 30 0.752 20 33 0.836 18 43 1.09 16 54 1.37 14 68 1.72 13 88 2.24

PDC TR-06-02 Rev 1 September 2008
26
12 97 2.45 10 118 3.00
0
0.2
0.4
0.6
0.8
1
1.2
1.4
0 1 2 3 4 5 6
Deflection
Res
ista
nce
Figure 12. Resistance Deflection Curve for Steel Components with Tension
Membrane
( )[ ]
( )( )yx
y
x
n
ny
TM
TM
ETM
LLand
LLn
AwhereA
nbL
K
bLK
TEA
xx
≥−=
⎥⎦⎤
⎢⎣⎡ −
=
=
=+=
∑=
−
2cosh
11114
T
8T
V,AfMinimumwhere4TL
7,5,3,1
2/13
2
3
2_
21_
cyd2
2
ππ
π
Equation 6 where: xTM= assumed deflection at beginning of linear tension membrane
response adding to flexural response for one and two-way response KTM_i= linear tension membrane slope for one-way (i=1) or two-way (i=2) response xE = equivalent elastic yield deflection
fdy = dynamic yield strength A = component cross sectional area within loaded width b
Vc = support force available for resisting component tension (Based on lesser of connection capacity or in-plane flexural capacity of supporting framing member)
L = span length (least span length for two-way components)
xe or xE xTM
ru KTM
ke or KE
See Equation 6 for definition of tension membrane (TM) terms. See Figure 6 for definition of other terms.
PDC TR-06-02 Rev 1 September 2008
27
E = Young’s modulus for steel b = supported width loaded by blast (typically a unit width for panels or plates)
Figure 13. Comparison of Measured Maximum Deflections of Girts in Shock Tube Tests to Deflections Predicted with Figure 7 and Equation 2
{ }
CLKW
ttPPWw
F
DYNFequiv
2
)()('
=
Δ+=
Equation 7 where: wequiv = equivalent lateral load with same spatial distribution as blast load
causing PΔ moments in component (added to applied blast load) WF = equivalent P-delta load factor K = 8 for uniformly loaded component supported top and bottom over axially
loaded span (including all 3 side supported component = 4 for component supported top and bottom with concentrated
midspan load = 2 for uniform load component supported at bottom of axially loaded span C = load factor in direction perpendicular to axially loaded span accounting
for component deflection distribution over axially loaded width C = 0.64 for all two-way spans (this is conservative in some cases) C = 1.0 for all one-way spans L = span length (span in direction causing axial load for 2-way spanning
components) P’ = total static axial load applied over blast loaded width of analyzed
component divided by the blast loaded width PDYN(t) = dynamic axial load per unit loaded width (usually the dynamic
0
1
2
4 4A 5 6 7 10 11 12 13 14 15 17 18 19
Te s t Num be r
Rat
io o
f Pre
dict
ed/M
easu
red
(Pea
k D
efle
ctio
n)

PDC TR-06-02 Rev 1 September 2008
28
reaction force from a supported component loaded by blast). See Equation 8
Δ(t) = maximum component displacement at each time step
sDYN LtVtP )()( =
Equation 8 where: PDYN = dynamic reaction load per unit width of component (lb/in or N/m) V(t) = dynamic reaction pressure multiplied by a factor of 2 (except when applied
by cantilevers) See Section 3.5 of the SBEDS Methodology Manual (psi or KPa)
Ls = one-half the span along the direction that applies PDYN to the support except it equals full span when loading component is a cantilever (inches or mm).Ls is typically calculated and saved to file by SBEDS when dynamic reaction pressure output is saved. (Example: Ls = 60 in for a 10 ft simply supported or fixed-simple beam. Ls = 120 in for axial load 20 ft high wall slab) Note: Ls can be modified in the saved file for cases where PDYN is applied over a width different from the blast loaded width – see Appendix A.
LBKV
RL
sshearu =_
Equation 9 where: Ru_shear = Ultimate resistance of component based on shear capacity per unit
loaded area Vs = Shear capacity force per unit width for panels and slabs, shear capacity
force for beams and columns KLL = Ratio KL of span L causing maximum shear force at support based on
boundary conditions Example: KL=0.5 for simply supported beam, KL=0.625 for beam with simple-fixed supports
B = Width of blast loaded area supported by beam

PDC TR-06-02 Rev 1 September 2008
29
Input for Open Web Steel Joists Item* Explanation
Allowable joist design load, wdesign
• Allowable load for given span from load tables in manufacturer’s and Steel Joist Institute literature. SBEDS backs out a constant moment capacity for each joist from load tables and uses this to calculate wdesign except that a constant wdesign is used for when the span length is less the critical value causing constant wdesign in the load tables.
• Ultimate dynamic resistance is based on 2.12*wdesign, where the 2.12 factor includes a safety factor of 1.7 and static and dynamic increase factors of 1.05 and 1.19, respectively.
• If the ultimate capacity is controlled by shear response rather than flexural yielding in the chords, lower maximum response criteria should be used for design. Shear control can be indicated by spans where the change in allowable load capacity is not proportional to the square of the change in span length in the manufacturer’s literature.
Load causing L/360 deflection, wLL
• Load causing L/360 deflection for given span from load tables in manufacturer’s and Steel Joist Institute literature. The literature has values of wLL for shorter spans, where wdesign becomes constant, that probably underestimate the actual load causing L/360 deflection. SBEDS backs out a constant EI for each joist from load tables and uses this to calculate wLL for all span lengths.
• The elastic stiffness for SDOF calculations is based on wLL/(L/360) Equivalent Static Reactions
• Peak equivalent static reactions on the Input sheet are based on the ultimate flexural resistance and formulas in TM 5-1300. Peak dynamic reaction information, which is based on the Dynamic Shear Factors on the Input sheet, is shown on the Results sheet.
All Other Items Return to top of document and link to Help on General Input and Output Items Including Blast Load
*These items are not required inputs – information is provided for background knowledge or for cases where “User Defined” input is required.

PDC TR-06-02 Rev 1 September 2008
30
Reinforced Concrete Slab Components Item Explanation
Width Resisting Blast Load / Loaded Width; Bw
• For one-way spanning slabs only, SBEDS allows input of a width resisting blast load that is less than the loaded width. Therefore, 0< Bw ≤1.0. This is applicable for analyzing the wall area between windows, where Bw equals the (wall width between windows)/(center-to-center distance between windows). SBEDS will give an error message if 0< Bw ≤1.0 is not true. Input Bw=1.0 for the typical case of slab without openings.
Flexural Response
• Flexural response is based on yielding at the maximum moment regions with resistance-deflection curves as shown in Figure 6. Load-mass, stiffness, and ultimate flexural resistance for all one-way and two-way components are based on Chapter 3 in TM 5-1300, except as stated below.
• SBEDS calculates all moment capacities based only on the input tension reinforcing steel. There is no consideration of reinforcing steel input for the opposite face of the member.
• The elastic resistances for two-way components with fixed supports are based on Table 10-5 in UFC 3-340-01. For components with adjacent fixed supports, the elastic resistance is from only the negative moment capacity acting on the yield line pattern corresponding to the ultimate resistance.
• All ultimate resistances for two-way spanning components are calculated based on TM 5-1300 with a 1.08 increase factor to account for conservative approach in TM 5-1300 where only 2/3 maximum moment capacity is assumed in corners.
Flexural and Compression Membrane Response
• See above discussion for flexural response. • An equivalent elastic stiffness (KE in Figure 14) is used for flexural
response. For two-way components with fixed boundaries, KE is based on Equation 3.34 in TM 5-1300 assuming equal positive and negative moment capacities.
• Compression membrane response is calculated as described in Chap. 10 in UFC 3-340-01. Boundary conditions must be as shown in Figure 18. The supports should be very stiff against in-plane forces so they cause material crushing as the wall or slab rotates at the supports under lateral load. These boundary conditions can typically be achieved by symmetry for a slab continuous over its supports or by an infill wall built with a tight fit (i.e. no gap) between heavy reinforced concrete framing members. Otherwise, ignore compression membrane effects.
• The resistance deflection curve is similar to that shown in the portion of Figure 17 for flexural and compression membrane response.
Flexural and Tension Membrane Response
• See above discussion for flexural response. • An equivalent elastic stiffness (KE in Figure 14) is used for flexural
response. For two-way components with fixed boundaries, KE is based on Equation 3.34 in TM 5-1300 assuming equal positive and negative moment capacities.
• Tension membrane response is calculated as described in Chapter 10 in UFC 3-340-01. Tension membrane response should only be based on unspliced, continuous steel along at least one face of the component. Boundary conditions must be as shown in Figure 18. Otherwise, tension membrane effects should not be included.
• The resistance deflection curve is similar to that shown for the flexural and tension membrane response portions of Figure 17.

PDC TR-06-02 Rev 1 September 2008
31
Item Explanation Flexural, Compression and Tension Membrane Response
• See above discussion for Flexural, Compression and Tension Membrane Response.
• The resistance deflection curve is based on Chapter 10 in UFC 3-340-01 and is similar to that shown in Figure 17.
• Due to limited number of rebound stiffnesses available in SBEDS, there is no rebound tension membrane stiffness is used for flexural response with compression and tension membrane.
Type of Cross Section
• For a Type I cross section, the entire dynamic response is calculated assuming the compression force of the resisting moment is provided by the concrete at all maximum moment regions - even at large support rotations. A Type I cross section should always be assumed if there is no compression face reinforcing steel.
• For a Type II cross section, the dynamic response is calculated assuming a Type I cross section at all maximum moment regions up to a support rotation of 2 degrees, and a Type II cross section at larger support rotations. The compression force of the resisting moment is provided by the reinforcing steel at the compression face in a Type II cross section. This only affects the ultimate resistance of the equivalent SDOF system. SBEDS transitions to a Type II cross section over a support rotation of 0.2 degrees (i.e. between 2 and 2.2 degrees). The user can see this effect on the resistance-deflection curve shown on the Input worksheet. See Figure 15 for a comparison of Type I and Type II cross sections. According to UFC 3-340-01 and TM 5-1300, a Type I cross section is only applicable up to 2 degrees of support rotation and stirrups are required in the maximum moment regions to provide lateral support to the compression face reinforcing steel. However, available test data indicates that this assumption is conservative, except possibly at very high steel reinforcing ratios as discussed in the SBEDS Methodology Manual.
• If the calculated support rotation exceeds 2 degrees for a Type II cross section, SBEDS provides a warning message that stirrups are required to provide lateral support for compression reinforcing steel in all maximum moment regions.
Reinforcing Steel Areas
• See Note: Averaging is necessary for cases with unequal steel - SBEDS allows onlyone input for this steel.
• Figure 16 for definition of terms used for input of reinforcing steel areas • SBEDS assumes that the lesser of the areas of steel input for inbound and
rebound steel (see Note: Averaging is necessary for cases with unequal steel - SBEDS allows onlyone input for this steel.
• Figure 16) at each face in negative and positive moment regions are continuous and unspliced along that face for any tension membrane calculations.
Distance of Cover to Center of Bars
• See Note: Averaging is necessary for cases with unequal steel - SBEDS allows onlyone input for this steel.
• Figure 16 for definition of terms used for input cover distance (dc) over reinforcing bars.
Concrete Static Strength Increase Factor
• This is ratio of the actual expected concrete strength to the minimum specified strength. UFC 3-340-01 recommends a static increase factor of 1.1, unless available test data indicates otherwise, and an aging factor of 1.1 for concrete aged at least 6 months or 1.15 for concrete aged at least 1 year. These two increase factors may be combined for a maximum input static increase factor of 1.26. Conservatively, no static increase factor is recommended in TM 5-1300. This factor can also be referred to as an average strength factor (ASF).

PDC TR-06-02 Rev 1 September 2008
32
Item Explanation Concrete Dynamic Strength Increase Factor
• This is ratio of the dynamic concrete strength including strain-rate effects to the expected static strength. TM 5-1300 recommends a value of 1.19 for far range loading and 1.23 for close-in loading (i.e. scaled standoff < 3 ft/lb1/3). See UFC 3-340-01, Chapter 4 for more detailed information on the concrete dynamic increase factor as a function of strain-rate. The concrete strain-rate to yield is reported on the Results sheet based on a yield strain of 0.002.
Reinforcing Steel Yield Strength Dynamic and Static Strength Increase Factors
• Default values of 1.1 for the static increase factor (this can also be referred to as an average strength factor (ASF)) and 1.17 for the dynamic increase factor are used in SBEDS as recommended in TM 5-1300. See UFC 3-340-01 Chapter 4 for more detailed information as a dynamic increase factor as a function of strain-rate. The steel strain-rate to yield is reported on the Results sheet. The increase factors can be modified using the “User Defined” input for the reinforcing steel.
Moment of Inertia (I)
• I is calculated as average of cracked and uncracked moment of inertia using a Type I cross section according to Eq. 10-31 in UFC 3-340-01 and Figure 10-5 for a singly reinforced cross section to determine the cracked section coefficient, F, for Icracked. This is slightly conservative for a doubly reinforced cross section.
Supported Weight
• Input any supported weight that moves through same deflection as component. Do not include self-weight of slab.
Static Axial Load for P-delta Effects, P’
(Only for load bearing walls)
• User should input static axial load per unit width loaded by blast, P’, causing P-delta moment as component deflects laterally under blast load. An equivalent lateral load (wequiv) is used by SBEDS to apply a midspan moment based on (P’+PDYN)*(deflection at each time step) assuming no resisting moment at the supports, at each time step in SDOF calculations. wequiv is calculated as shown in Equation 3 and added to applied load at the next time step. It is plotted on the Results sheet. This approach does not account for P-delta moment caused by any sway deflection of the top support of the component relative to the bottom. Also, it is an approximate approach, especially for two-way spans and one-way spans with fixed boundary conditions.
• Do not input static or blast load from roof components if also inputting dynamic axial load. Also, see Section 4.4 of SBEDS Methodology Manual.
Note: See Table 7 for comparison of method in SBEDS to theory where elastic, essentially static lateral load was input in SBEDS with axial load.
Dynamic Axial Load for P-delta Loading, PDYN
(Only for load bearing walls)
• No dynamic axial load is the default. In this case, there is no dynamic axial load on the component. There can still be an input static axial load.
• Dynamic axial load per unit width prompts the user to select an input text file with the dynamic reaction load from a supported roof or overhead component. The load is applied over the blast-loaded width of the analyed component. The input text file can be modified for cases where the axially loaded width is not equal to the blast loaded width as discussed in Appendix A. The input file (see Note below) has an optional first line that has the number of time-dynamic reaction pressure pairs (N) followed by N lines with time (ms), dynamic reaction pressure (psi or KPa) pairs where time and pressure are separated by a comma. The last line of input file has -999 followed by a comma and the span length, Ls (inch or mm) of the supported component that applies the dynamic reaction pressure (see Equation 11). SBEDS determines PDYN as shown in Equation 11 and uses it to determine an equivalent P-delta load as shown in Equation 10. See Appendix A for an example of an input dynamic axial load input file. See Section 4.4. of SBEDS Methodology Manual for more discussion.
Note: The user can use the save file option on the SDOF Output sheet (NOT

PDC TR-06-02 Rev 1 September 2008
33
Item Explanation the save plot option) to save either the short span or long span dynamic reaction pressure history from the supported component and then read this saved file later into SBEDS as a dynamic axial load input file on a supporting component.
Equivalent Static Reactions
• Equivalent static reactions on the Input sheet are based on Table 3-9 and Table 3-10 in TM 5-1300 using the larger of the inbound and rebound ultimate flexural resistance. These reactions, which are per unit width over the full blast loaded area, are equivalent static shear loads compared to shear strength values. Dynamic reactions based on Dynamic Shear Factors is shown on the Results sheet, but are not used to determine maximum equivalent static reactions.
• The calculated maximum reaction at distance “d” from the support is applicable when support is on opposite face of component from blast load. For two-way components, the support reactions are multiplied by (L’-d)/L’, where L’ is the shortest distance between the support and point of maximum deflection in the yield line pattern for the given direction. This is a simplified, conservative value for 2-way components (see Table 4.7 in TM 5-1300 for more exact values).
Shear Strength Calculations
• The direct and diagonal shear strengths are based on Chap. 10 in UFC 3-340-01, except no DIF for concrete in tension is used for the diagonal shear strength. However, the concrete compression strength used in the diagonal shear strength calculations includes the effects of the static and dynamic increase factors. No effects of axial compression or tension on shear strength are included, these should be added if they are applicable as described in UFC 3-340-01, Chapter 10.3. It is conservative to ignore axial compression. Required stirrup area is calculated if diagonal shear strength is less than equivalent static reactions. Calculations of any required stirrup area include steel static and dynamic increase factors.
• The distance “d” used in SBEDS for shear calculations is equal to (thickness – applicable concrete cover), where the cover is the cover depth to the top layer of reinforcing steel at the supports of one-way spans, except for a simply support span where it is the cover depth to bottom steel at midspan. For two way spans, the above approach is used except the depths in both span directions are averaged. If the two-way span is fixed on two opposite sides and simply supported on two opposite sides, then it is the cover depth to the top steel only in the direction of the fixed span. This is summarized in Table 9.
• SBEDS assumes the entire blast loaded width resists shear at the supports. If openings reduce width of wall resisting shear, multiply shear capacity by Bw and manually check shear.
• The shear reinforcing steel area shown in SBEDS for slabs, which has units of in2/in2, is multiplied by the stirrup spacing in each direction to get a stirrup area.
Rerunning SDOF Calculations for Shear Controlled Slabs (Shear Flag)
• If the diagonal concrete shear capacity Vc < Peak Equivalent Static Reactions, SBEDS provides a user option to recalculate dynamic response using Ru_shear from Equation 12 (based only on diagonal concrete shear strength) for all resistances (Ri) based on flexure capacity where Ri >Ru_shear. The user must enter a value of 1 (for max shear stress at supports) or 2 (for max shear stress at distance “d” from supports) in the Shear Flag input cell created by SBEDS to rerun SBEDS with maximum resistances of Ru_shear where Ri >Ru_shear. Resistances based on compression membrane, tension membrane, and arching are not affected. The Error Message area on the Input Sheet provides directions for rerunning the SDOF analysis using Ru_shear. Only use this option if sufficient stirrups cannot be provided and where shear controled response is

PDC TR-06-02 Rev 1 September 2008
34
Item Explanation acceptable (See SBEDS Methodology Manual.).
• Note that the Peak Equivalent Static Reactions in SBEDS are based on the ultimate flexural resistance (Ru), not the maximum calculated resistance (Rmax) from the SDOF analysis. If the shear flag is calculated for a case where Rmax < Ru, the actual reactions may not exceed the shear strength as displayed by SBEDS in a message box.
• DoD design methods may require that the shear capacity Vc ≥ Peak
Equivalent Static Reactions. In this case, redesign the component and do not use the shear flag.
• Use of the shear flag is generally only recommended for analysis of existing components. HOWEVER, SBEDS only includes response criteria for flexural response. See Section 4.5.2 of the SBEDS Methodology Manual for alternative response criteria for shear-controlled component response.
All Other Items Return to top of document and link to Help on General Input and Output Items Including Blast Load
Determinate Boundary Conditions Indeterminate Boundary Conditions (Solid Curve Used for Flexure Only) (Dashed Curve for Flexure and Tension Membrane)
Figure 14. Resistance-Deflection Curve For Flexural Response

PDC TR-06-02 Rev 1 September 2008
35
Figure 15. Type I and Type II Cross Sections
Positive Moment Steel
(Rebound)
Positive Moment Steel
(Inbound)
Negative Moment Steel (Rebound)(Use average if necessary)
Negative Moment Steel (Inbound)(Use average if necessary)
d (loaded side)
d (unloaded side)
L or H
Blast Load
c
c
Note: Averaging is necessary for cases with unequal steel - SBEDS allows onlyone input for this steel.
Figure 16. Information for Input of Steel Area and Distance of Cover Depth (dc)

PDC TR-06-02 Rev 1 September 2008
36
Figure 17. Resistance-Deflection Curve for Reinforced Concrete and Masonry Components with Compression and Tension Membrane (from UFC 3-340-01)

PDC TR-06-02 Rev 1 September 2008
37
Figure 18. Boundary Conditions for Tension and Compression Membrane
Response

PDC TR-06-02 Rev 1 September 2008
38
{ }
CLKW
ttPPWw
F
DYNFequiv
2
)()('
=
Δ+=
componentsmasonryandconcreteforwhenWNote F 22
AIL0:
avg
<=
Equation 10 where: wequiv = equivalent lateral load with same spatial distribution as blast load
causing PΔ moments in component (added to applied blast load) WF = equivalent P-delta load factor K = 8 for uniformly loaded component supported top and bottom over axially
loaded span (including all 3 side supported component = 4 for component supported top and bottom with concentrated
midspan load = 2 for uniform load component supported at bottom of axially loaded span C = load factor in direction perpendicular to axially loaded span accounting
for component deflection distribution over axially loaded width C = 0.64 for all two-way spans (this is conservative in some cases) C = 1.0 for all one-way spans L = span length (span in direction causing axial load for 2-way spanning
components) P’ = total static axial load applied over blast loaded width of analyzed
component divided by the blast loaded width PDYN(t) = dynamic axial load per unit loaded width (usually the dynamic
reaction force from a supported component loaded by blast). See Equation 11
Δ(t) = maximum component displacement at each time step Iavg = average of gross and cracked moment of inertia A = cross sectional area
sDYN LtVtP )()( =
Equation 11 where: PDYN = dynamic reaction load per unit width of component (lb/in or N/m) V(t) = dynamic reaction pressure multiplied by a factor of 2 (except when applied
by cantilevers) as explained in Section 3.5 of the SBEDS Methodology Manual (psi or KPa)
Ls = one-half the span along the direction that applies PDYN to the support except it equals full span when loading component is a cantilever (inches or mm).Ls is typically calculated and saved to file by SBEDS when dynamic reaction pressure output is saved. (Example: Ls = 60 in for a 10 ft simply supported or fixed-simple beam. Ls = 120 in for axial load 20 ft high wall slab) Note: Ls can be modified in the saved file for cases where PDYN is applied

PDC TR-06-02 Rev 1 September 2008
39
over a width different from the blast loaded width – see Appendix A.
1 1,FlagShear When 2,FlagShear When
_
==−
==
=
dL
Ld
L
dsshearu
KLK
dLKK
LKKV
R
Equation 12 where: Ru_shear = Ultimate resistance of component based on shear capacity per unit
loaded area Vs = Shear capacity force per unit width based only on concrete shear strength
KLL = Ratio KL of span L causing maximum shear force at support based on boundary conditions (KLL for two-way spans is dependent on yield line pattern per Table 3-10 in TM 5-1300) Example: KL=0.5 for simply supported one-way slab, KL=0.625 for fixed-simple one-way slab
d = distance from blast loaded face to reinforcing steel on opposite face (see discussion in table above)
Kd = Factor applicable when shear is controlled at distance d from support, which generally occurs when supports on are opposite side of slab from blast load. (Kd is controlled in SBEDS by user input Shear Flag value)
Table 9. Depth to Reinforcing Steel Used by SBEDS for Shear Strength Calculations
Boundary Condition Depth (d) Used for Shear Strength Calculations One-way, Cantilever d at support One-way, Fixed-Fixed d at supports One-way, Fixed-Simple d at fixed support* One-way, Simple-Simple d at midspan Two-Way, All Edges Simply Supported
Average d at midspan in both directions
Two-Way, All Edges Fixed Average d at supports in both directions Two-Way, Opposite Edges Fixed and Simply Supported
d at fixed supports *
*Highest shear load is at fixed support

PDC TR-06-02 Rev 1 September 2008
40
Reinforced Concrete Beam-Column Item Explanation
Flexural Response
• Flexural response is based on yielding at the maximum moment regions with resistance-deflection curves as shown in Figure 19. Load-mass, stiffness, and resistance values are based on TM 5-1300.
Flexural and Compression Membrane Response
• See above discussion for flexural response. • An equivalent elastic stiffness (KE in Figure 19) is used for flexural response. • Compression membrane response is calculated as described in Chap. 10 in
UFC 3-340-01. The supports should be very stiff against in-plane forces so that they cause material crushing as the wall or slab rotates at the supports under lateral load. Typically, this can be achieved by symmetry for a beam/column that is continuous over its supports. Otherwise, compression membrane effects should not be included.
• The resistance deflection curve is similar to that shown in the portion of Figure 20 for flexural and compression membrane response.
Flexural and Tension Membrane Response
• See above discussion for flexural response. • An equivalent elastic stiffness (KE in Figure 19) is used for flexural response. • Tension membrane response is calculated as described in Chapter 10 in
UFC 3-340-01. Tension membrane response should only be based on unspliced, continuous steel along at least one face of the component. Boundary conditions must be rigid supports that resist inward movement of the supports. Otherwise, tension membrane effects should not be included.
• The resistance deflection curve is similar to that shown in Figure 20 for flexural and tension membrane response.
Flexural, Compression and Tension Membrane Response
• See above for flexural, compression and tension membrane response. • The resistance deflection curve is based on Chapter 10 in UFC 3-340-01
and is similar to that shown in Figure 20. • Due to limited number of stiffnesses, there is no rebound tension membrane
stiffness in SBEDS for flexure with compression and tension membrane. Type of Cross Section
• For a Type I cross section, the entire dynamic response is calculated assuming the compression force of the resisting moment is provided by the concrete at all maximum moment regions - even at large support rotations. A Type I cross section should always be assumed if there is no compression face reinforcing steel.
• For a Type II cross section, the dynamic response is calculated assuming a Type I cross section at all maximum moment regions up to a support rotation of 2 degrees, and a Type II cross section at larger support rotations. The compression force of the resisting moment is provided by the reinforcing steel at the compression face in a Type II cross section. This only affects the ultimate resistance of the equivalent SDOF system. SBEDS transitions to a Type II cross section over a support rotation of 0.2 degrees (i.e. between 2 and 2.2 degrees). The user can see this effect on the resistance-deflection curve shown on the Input worksheet. See Figure 21 for a comparison of Type I and Type II cross sections. According to UFC 3-340-01 and TM 5-1300, a Type I cross section is only applicable up to 2 degrees of support rotation. However, available test data indicates that this assumption is conservative, except possibly at very high steel reinforcing ratios as discussed in the SBEDS Methodology Manual.
• If the calculated support rotation exceeds 2 degrees for a Type II cross section, SBEDS provides a warning message that stirrups are required to provide lateral support for compression reinforcing steel in all maximum moment regions.
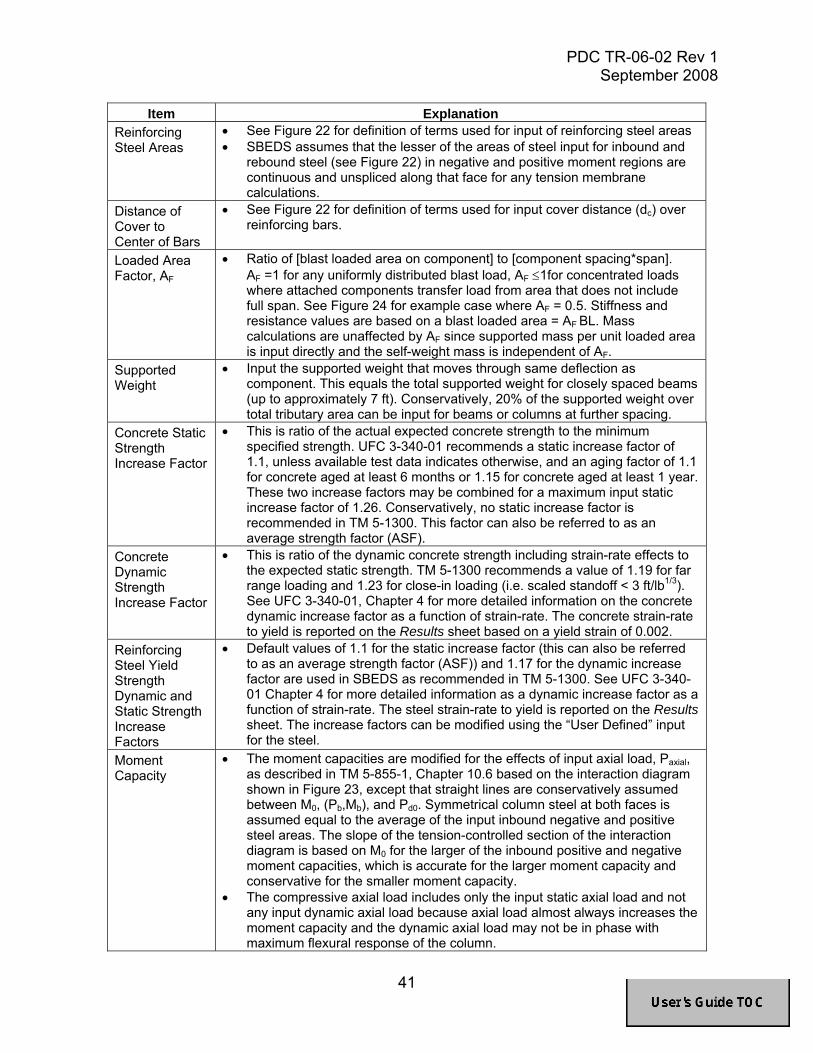
PDC TR-06-02 Rev 1 September 2008
41
Item Explanation Reinforcing Steel Areas
• See Figure 22 for definition of terms used for input of reinforcing steel areas • SBEDS assumes that the lesser of the areas of steel input for inbound and
rebound steel (see Figure 22) in negative and positive moment regions are continuous and unspliced along that face for any tension membrane calculations.
Distance of Cover to Center of Bars
• See Figure 22 for definition of terms used for input cover distance (dc) over reinforcing bars.
Loaded Area Factor, AF
• Ratio of [blast loaded area on component] to [component spacing*span]. AF =1 for any uniformly distributed blast load, AF ≤1for concentrated loads where attached components transfer load from area that does not include full span. See Figure 24 for example case where AF = 0.5. Stiffness and resistance values are based on a blast loaded area = AF BL. Mass calculations are unaffected by AF since supported mass per unit loaded area is input directly and the self-weight mass is independent of AF.
Supported Weight
• Input the supported weight that moves through same deflection as component. This equals the total supported weight for closely spaced beams (up to approximately 7 ft). Conservatively, 20% of the supported weight over total tributary area can be input for beams or columns at further spacing.
Concrete Static Strength Increase Factor
• This is ratio of the actual expected concrete strength to the minimum specified strength. UFC 3-340-01 recommends a static increase factor of 1.1, unless available test data indicates otherwise, and an aging factor of 1.1 for concrete aged at least 6 months or 1.15 for concrete aged at least 1 year. These two increase factors may be combined for a maximum input static increase factor of 1.26. Conservatively, no static increase factor is recommended in TM 5-1300. This factor can also be referred to as an average strength factor (ASF).
Concrete Dynamic Strength Increase Factor
• This is ratio of the dynamic concrete strength including strain-rate effects to the expected static strength. TM 5-1300 recommends a value of 1.19 for far range loading and 1.23 for close-in loading (i.e. scaled standoff < 3 ft/lb1/3). See UFC 3-340-01, Chapter 4 for more detailed information on the concrete dynamic increase factor as a function of strain-rate. The concrete strain-rate to yield is reported on the Results sheet based on a yield strain of 0.002.
Reinforcing Steel Yield Strength Dynamic and Static Strength Increase Factors
• Default values of 1.1 for the static increase factor (this can also be referred to as an average strength factor (ASF)) and 1.17 for the dynamic increase factor are used in SBEDS as recommended in TM 5-1300. See UFC 3-340-01 Chapter 4 for more detailed information as a dynamic increase factor as a function of strain-rate. The steel strain-rate to yield is reported on the Results sheet. The increase factors can be modified using the “User Defined” input for the steel.
Moment Capacity
• The moment capacities are modified for the effects of input axial load, Paxial, as described in TM 5-855-1, Chapter 10.6 based on the interaction diagram shown in Figure 23, except that straight lines are conservatively assumed between M0, (Pb,Mb), and Pd0. Symmetrical column steel at both faces is assumed equal to the average of the input inbound negative and positive steel areas. The slope of the tension-controlled section of the interaction diagram is based on M0 for the larger of the inbound positive and negative moment capacities, which is accurate for the larger moment capacity and conservative for the smaller moment capacity.
• The compressive axial load includes only the input static axial load and not any input dynamic axial load because axial load almost always increases the moment capacity and the dynamic axial load may not be in phase with maximum flexural response of the column.

PDC TR-06-02 Rev 1 September 2008
42
Item Explanation • SBEDS calculates all moment capacities based only on the input tension
reinforcing steel. There is no consideration of reinforcing steel input for the opposite face of the member.
Moment of Inertia
• I is calculated as average of cracked and uncracked moment of inertia according to Eq. 10-31in UFC 3-340-01 and Figure 10-5 for a singly reinforced cross section to determine the cracked section coefficient, F, for Icracked. This is slightly conservative for a doubly reinforced cross section.
Static Axial Load for Compression and P-delta Loading, P
(Only for Beam-Columns)
• User should input static axial load P on beam/column causing compression and P-delta moment as component deflects laterally under blast load. An equivalent lateral load (wequiv) is used by SBEDS to apply a midspan moment based on (P/B+PDYN)*(deflection at each time step) assuming no resisting moment at the supports, at each time step in SDOF calculations. B is the beam/column spacing and PDYN is explained in the next item. wequiv is calculated as shown in Equation 3 and added to applied load at the next time step. It is plotted on the Results sheet. This approach does not account for P-delta moment caused by any sway deflection of the top support of the component relative to the bottom. Also, it is an approximate approach, especially for two-way spans and one-way spans with fixed boundary conditions.
• Do not input static load from roof components if also inputting dynamic axial load. See Section 4.4 of SBEDS Methodology Manual for more info. .
Note: See Table 7 for comparison of equivalent lateral load method in SBEDS to theory for elastic, essentially static lateral load input in SBEDS with axial load.
Dynamic Axial Load for P-delta Loading, PDYN
(Only for Beam-Columns)
• No dynamic axial load is the default. In this case, there is no dynamic axial load on the component. There can still be an input static axial load.
• Dynamic axial load per unit width prompts the user to select an input text file with the dynamic reaction load from a supported roof or overhead component. The file (see Note below) has an optional first line that has the number of time-dynamic reaction pressure pairs (N) followed by N lines with time (ms), dynamic reaction pressure (psi or KPa) pairs where time and pressure are separated by a comma. The last line of input file has -999 followed by a comma and the span length, Ls (inch or mm) of the supported component that applies the dynamic reaction pressure (see Equation 14). SBEDS determines PDYN as shown in Equation 14 and uses it to determine an equivalent P-delta load as shown in Equation 13. See Appendix A for an example of an input dynamic axial load input file. See Section 4.4. of SBEDS Methodology Manual for more discussion.
Note: The user can use the save file option on the SDOF Output sheet (NOT the save plot option) to save either the short span or long span dynamic reaction pressure history from the supported component and then later read this saved file into SBEDS as a dynamic axial load input file on a supporting component.
Loaded Width for Dynamic Axial Load, Ba
• Only applicable for cases with input dynamic axial load • Input width along top of component subject to dynamic axial load per unit
width (see Equation 13). Equivalent Static Reactions
• Equivalent static reactions on the Input sheet are based on Table 3-9 in TM 5-1300 and the larger of the inbound and rebound ultimate flexural resistance. These reactions are treated as equivalent static shear loads and compared to shear strength values. Dynamic reactions based on Dynamic Shear Factors on the Input sheet are shown on the Results sheet, but are not used to determine maximum equivalent static reactions.
• The calculated maximum reactions at distance “d” (see row below) from the support is applicable when support is on opposite face of component from blast load.

PDC TR-06-02 Rev 1 September 2008
43
Item Explanation
Shear Strength Calculations
• The direct and diagonal shear strengths are based on Chap. 10 in UFC 3-340-01, except no DIF for concrete in tension is used for the diagonal shear strength. However, the concrete compression strength used in the diagonal shear strength calculations includes the effects of the static and dynamic increase factors. No effects of axial compression or tension on shear strength are included, these should be added if they are applicable as described in UFC 3-340-01, Chapter 10.3. It is conservative to ignore axial compression. Required stirrup area is calculated if diagonal shear strength is less than equivalent static reactions. Calculated stirrup areas include steel static and dynamic increase factors.
• The distance “d” used in SBEDS for shear calculations is equal to (thickness – applicable concrete cover), where the cover is the cover depth to the top layer of reinforcing steel at the supports of one-way spans, except for a simply support span where it is the cover depth to bottom steel at midspan. For two way spans, the above approach is used except the depths in both span directions are averaged. If the two-way span is fixed on two opposite sides and simply supported on two opposite sides, then it is the cover depth to the top steel only in the direction of the fixed span. This is summarized in Table 10.
Response Criteria for Columns
The response criteria for the subcategory “Columns with Shear Failure” is meant to be applied with shear controlled response in SBEDS, where the maximum resistance is based on shear capacity of the column (i.e., the shear flag and message stating that shear controls component response is displayed by SBEDS). The other response criteria subcategories for columns are meant to be applied if flexure controls the ultimate resistance of the column.
Rerunning SDOF Calculations for Shear Controlled Components
Sufficient stirrups are normally provided so that beams are not actually controlled by shear. Therefore, no automatic option is provided in SBEDS for rerunning reinforced concrete beams or columns using a shear controlled capacity based on concrete strength only. However, for the case where a beam/column does not have sufficient stirrups and the shear capacity is less than the flexural capacity, the user can reanalyze the beam using the General SDOF Analysis option where an ultimate resistance based on shear (Ru_shear), as shown in Equation 15, is substituted for all resistances (Ri) based on flexure capacity where Ri >Ru_shear. Otherwise all mass, stiffness, and resistance shown for the beam/column in the SDOF Properties section of the Input sheet can be input into appropriate input cells in the General SDOF Analysis input sheet.
ReRunning SDOF with Resistance Controlled by Shear Capacity (Shear Flag)
• Sufficient stirrups are normally provided so that beams are not actually controlled by shear. Therefore, no automatic option is provided in SBEDS for rerunning reinforced concrete beams or columns using a shear controlled capacity based on concrete strength only. However, for the case where a beam/column does not have sufficient stirrups and the shear capacity is less than the flexural capacity, the user can reanalyze the beam using the General SDOF Analysis option where an ultimate resistance based on shear (Ru_shear), as shown in Equation 15, is substituted for all resistances (Ri) based on flexure capacity where Ri >Ru_shear. Otherwise all mass, stiffness, and resistance shown for the beam/column in the SDOF Properties section of the Input sheet can be input into appropriate input cells in the General SDOF Analysis input sheet.
• SBEDS only includes response criteria for flexural response. See Section 4.5.2 of the SBEDS Methodology Manual for alternative response criteria for shear-controlled component response.
All Other Items Return to top of document and link to Help on General Input and Output Items Including Blast Load

PDC TR-06-02 Rev 1 September 2008
44
Determinate Boundary Conditions Indeterminate Boundary Conditions (Solid Curve Used for Flexure Only) (Dashed Curve for Flexure and Tension Membrane)
Figure 19. Resistance-Deflection Curve For Flexural Response
Figure 20. Resistance-Deflection Curve for Reinforced Concrete Components
with Compression and Tension Membrane (from UFC 3-340-01)

PDC TR-06-02 Rev 1 September 2008
45
Figure 21. Type I and Type II Cross Sections
Positive Moment Steel
(Rebound)
Positive Moment Steel
(Inbound)
Negative Moment Steel (Rebound)(Use average if necessary)
Negative Moment Steel (Inbound)(Use average if necessary)
d (loaded side)
d (unloaded side)
L or H
Blast Load
c
c
Note: Averaging is necessary for cases with unequal steel - SBEDS allows onlyone input for this steel. Figure 22. Information for Input of Steel Area and Distance of Cover Depth (dc)

PDC TR-06-02 Rev 1 September 2008
46
Figure 23. Reinforced Concrete Column Axial Load Moment Capacity Interaction
Diagram
L
B
Beam
Blast Loaded Areaon Girder
Girder
Note that beams only transfer blast load from 50% of the area B*L into girder in this example where the beams have a pinned connection to girders. The blast load from the rest of this area is transferred by beams directly into columns supporting girder.
Figure 24. Example of Girder with Loaded Area Factor (AF) of 0.5
Note: Tension controlled region idealized as straight line
B=Girder Spacing
BLarealoadedblastAF
__=
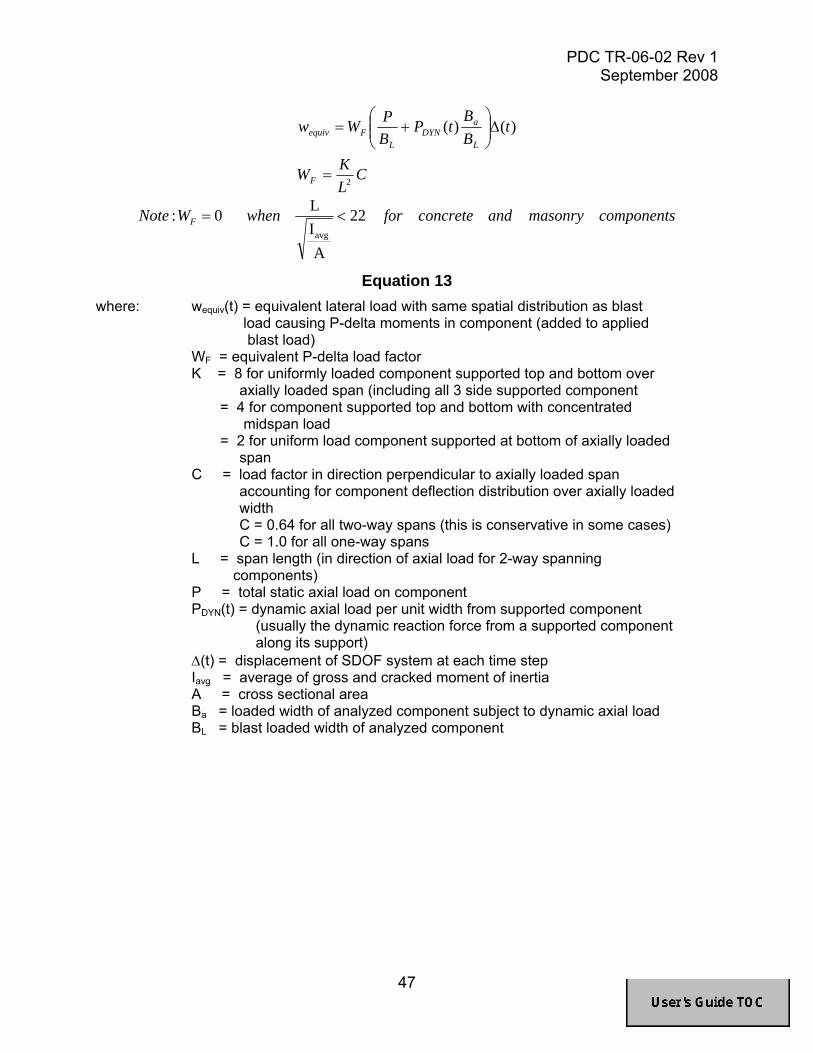
PDC TR-06-02 Rev 1 September 2008
47
CLKW
tBB
tPBPWw
F
L
aDYN
LFequiv
2
)()(
=
Δ⎟⎟⎠
⎞⎜⎜⎝
⎛+=
componentsmasonryandconcreteforwhenWNote F 22
AIL0:
avg
<=
Equation 13 where: wequiv(t) = equivalent lateral load with same spatial distribution as blast
load causing P-delta moments in component (added to applied blast load)
WF = equivalent P-delta load factor K = 8 for uniformly loaded component supported top and bottom over
axially loaded span (including all 3 side supported component = 4 for component supported top and bottom with concentrated
midspan load = 2 for uniform load component supported at bottom of axially loaded
span C = load factor in direction perpendicular to axially loaded span
accounting for component deflection distribution over axially loaded width
C = 0.64 for all two-way spans (this is conservative in some cases) C = 1.0 for all one-way spans L = span length (in direction of axial load for 2-way spanning
components) P = total static axial load on component PDYN(t) = dynamic axial load per unit width from supported component (usually the dynamic reaction force from a supported component along its support)
Δ(t) = displacement of SDOF system at each time step Iavg = average of gross and cracked moment of inertia A = cross sectional area Ba = loaded width of analyzed component subject to dynamic axial load BL = blast loaded width of analyzed component

PDC TR-06-02 Rev 1 September 2008
48
sDYN LtVtP )()( =
Equation 14 where: PDYN = dynamic reaction load per unit width of component (lb/in or N/m) V(t) = dynamic reaction pressure multiplied by a factor of 2 (except when applied
by cantilevers) as explained in Section 3.5 of the SBEDS Methodology Manual (psi or KPa)
Ls = one-half the span along the direction that applies PDYN to the support except it equals full span when loading component is a cantilever (inches or mm).Ls is typically calculated and saved to file by SBEDS when dynamic reaction pressure output is saved. (Example: Ls = 60 in for a 10 ft simply supported or fixed-simple beam. Ls = 120 in for axial load 20 ft high wall slab)
LKdLK
KLBKKV
RL
Ld
L
dsshearu
−==_
Equation 15 where: Ru_shear = Ultimate resistance of component per unit loaded area based on shear
capacity Vs = Dynamic shear capacity in units of force including contribution from any
stirrups KLL = Ratio KL of span L causing highest shear force at supports based on
boundary conditions (Example: KL=0.5 for simply supported beam, KL=0.625 for beam with simple-fixed supports)
B = Width of blast loaded area supported by beam d = Distance from blast loaded face to reinforcing steel on opposite face
Kd = Factor applicable when shear is controlled at distance d from support, which generally occurs when supports on are opposite side of slab from blast load.
Note: Use Kd=1.0 when critical shear section is at support.
Table 10. Depth to Reinforcing Steel Used by SBEDS for Shear Strength Calculations
Boundary Condition Depth (d) Used for Shear Strength Calculations One-way, Cantilever d at support One-way, Fixed-Fixed d at supports One-way, Fixed-Simple d at fixed support* One-way, Simple-Simple d at midspan Two-Way, All Edges Simply Supported
Average d at midspan in both directions
Two-Way, All Edges Fixed Average d at supports in both directions Two-Way, Opposite Edges Fixed and Simply Supported
d at fixed supports *
*Highest shear load is at fixed support

PDC TR-06-02 Rev 1 September 2008
49
Prestressed Concrete Beam or Slab
Item Explanation Flexural Response
• Flexural response is based on yielding at the maximum moment regions with resistance-deflection curves as shown in Figure 25. Load-mass, stiffness, and ultimate flexural resistance values for all one-way and two-way components are based on Chapter 3 in TM 5-1300, except as below.
• SBEDS calculates all moment capacities based only on the input tension reinforcing steel. There is no consideration of reinforcing steel input for the opposite face of the member.
• The elastic resistances for two-way components with fixed supports are based on Table 10-5 in UFC 3-340-01. For components with adjacent fixed supports, the elastic resistance is from only the negative moment capacity acting on the yield line pattern at ultimate resistance.
• All ultimate resistances for two-way spanning components are calculated based on TM 5-1300 with a 1.08 increase factor to account for conservative approach in TM 5-1300 where only 2/3 maximum moment capacity is assumed in corners.
Input of Cross Sectional Dimensions for Beams
• Non-rectangular prestressed beams (i.e. AASHTO bridge beams or T-beams) can be input. It assumed for simplicity that there is no tension flange, which is conservative for the moment of inertia and does not affect the moment capacity. It is assumed that the compression block stays within the beam flange for moment calculations and a warning message is output if this is not the case, but no recalculation of the moment capacity is performed. If this error message occurs, see Beam Compression Block/Flange Thickness Ratio under Calculated Properties on cell D53 of the Input sheet. As long as this ratio is less than approximately 1.25, there is very little error.
Reinforcing and Prestressed Steel Areas and Spacing
• See Figure 26 for definition of terms used for input of reinforcing steel areas
• SBEDS assumes that there is only one layer of prestressed steel that contributes to both and inbound and rebound response.
• Input conventional steel areas for the positive and negative moment regions are assumed equal in the L and H directions of a two-way panel in SBEDS, but differences in moment capacity in the two directions can be accounted for by adjusting the input reinforcing steel spacing in each direction. Check calculated positive and negative moments in the L and H directions under Calculated Properties, which include the effects of both prestressed and conventional steel. Input zero prestressed steel to check moment capacity of conventional steel and then reset to correct value.
Distance of Cover to Center of Bars
• See Figure 26 for definition of terms used for input cover distance (dc) over reinforcing bars.
Supported Weight
• Input the supported weight that moves through same deflection as component. This is equal to the total supported weight for panels and closely spaced beams (i.e. up to approximately 7 ft). Conservatively, 20% of the supported weight over total tributary area can be input for beams at further spacing.
Concrete Static • This is ratio of the actual expected concrete strength to the minimum

PDC TR-06-02 Rev 1 September 2008
50
Item Explanation Strength Increase Factor
specified strength. UFC 3-340-01 recommends a static increase factor of 1.1, unless available test data indicates otherwise, and an aging factor of 1.1 for concrete aged at least 6 months or 1.15 for concrete aged at least 1 year. These two increase factors may be combined for a maximum input static increase factor of 1.26. Conservatively, no static increase factor is recommended in TM 5-1300. This factor can also be referred to as an average strength factor (ASF).
Concrete Dynamic Strength Increase Factor
• This is ratio of the dynamic concrete strength including strain-rate effects to the expected static strength. TM 5-1300 recommends a value of 1.19 for far range loading and 1.23 for close-in loading (i.e. scaled standoff < 3 ft/lb1/3). See UFC 3-340-01, Chapter 4 for more detailed information on the concrete dynamic increase factor as a function of strain-rate. The concrete strain-rate to first yield on Results sheet is based on a 0.002 yield strain.
Dynamic and Static Strength Increase Factors for Reinforcing Steel
• For conventional reinforcing steel, default values of 1.1 for the static increase factor (this factor can also be referred to as an average strength factor (ASF)) and 1.17 for the dynamic increase factor are used as recommended in TM 5-1300. See UFC 3-340-01 Chapter 4 for more detailed information as a dynamic increase factor as a function of strain-rate. The steel strain-rate to yield is reported on the Results sheet. The increase factors can be modified using the “User Defined” input for the reinforcing steel.
• No increase factors are assumed for prestressed steel since these factors are typically very near 1.0 for steel with high yield strengths.
Prestressed Steel Yield Strength
• The yield strengths for bonded and unbonded prestressed steel are calculated from the input ultimate strength, concrete strength, and steel ratios as recommended in Chapter 6, Section 13 of TM 5-1300. This method is related to similar formulas in ACI 318 with dynamic yield strengths for concrete and reinforcing steel.
Moment Capacity • The moment capacities are the sum of the ultimate dynamic moment capacities from both conventional and prestressed reinforcing steel as recommended in Chapter 6 of TM 5-1300. See Input of Cross Sectional Dimensions for Beams on preceding page for note on flanged beams.
Moments of Inertia
• The gross moment of inertia is calculated in the conventional manner except that any tension flange is ignored in flanged beams. See Input of Cross Sectional Dimensions for Beams for more information.
• The cracked moment of inertia is calculated as recommended for prestressed components in Chapter 6 of TM 5-1300.
• The average of the cracked and gross moments of inertia are used to calculate the beam or slab stiffness for dynamic response calculations.
Equivalent Static Reactions
• Equivalent static reactions on the Input sheet are based on Table 3-9 and Table 3-10 in TM 5-1300 using the ultimate flexural resistance. These reactions are treated as equivalent static shear loads and compared to shear strength values. Dynamic reactions based on Dynamic Shear Factors on the Input sheet are shown on the “Results” sheet, but are not used to calculate Peak Equivalent Static Reactions.
• The calculated maximum reactions at distance “d” from the support is applicable when support is on opposite face of component from blast load. For two-way components, the support reactions are multiplied by (L’-d)/L’, where L’ is the shortest distance between the support and point of maximum deflection in the yield line pattern for the given direction. This is simplified, conservative value for two-way components (see Table 4.7 in TM 5-1300 for more exact values).
Shear Strength • The direct and diagonal shear strengths are based on Chap. 10 in UFC 3-

PDC TR-06-02 Rev 1 September 2008
51
Item Explanation Calculations 340-01, except no DIF for concrete in tension is used for the diagonal
shear strength. However, the concrete compression strength used in the diagonal shear strength calculations includes the effects of the static and dynamic increase factors. No effects of axial compression or tension on shear strength are included, these should be added if they are applicable as described in UFC 3-340-01, Chapter 10.3. It is conservative to ignore axial compression. Required stirrup area is calculated if diagonal shear strength is less than equivalent static reactions. Calculated stirrup areas include steel static and dynamic increase factors.
• Required stirrup area is calculated if diagonal shear strength is less than equivalent static reactions. Stirrup calculations include steel static and dynamic increase factors.
• The distance “d” used in SBEDS for shear calculations is equal to (thickness – applicable concrete cover), where the cover is the cover depth to the top layer of reinforcing steel (i.e., prestressed or conventional steel, whichever is closer to the surface) at the supports of one-way spans, except for a simply support span where it is the cover depth to bottom steel at midspan. For two way spans, the above approach is used except the depths in both span directions are averaged. If the two-way span is fixed on two opposite sides and simply supported on two opposite sides, then it is the cover depth to the top steel only in the direction of the fixed span. This is summarized in Table 11.
• The shear reinforcing steel area shown in SBEDS for slabs, which has units of in2/in2, is multiplied by the stirrup spacing in each direction to get a stirrup area.
Rerunning SDOF Calculations for Shear Controlled Components (Shear Flag)
• For prestressed slabs only, if the diagonal concrete shear capacity Vc < Peak Equivalent Static Reactions, SBEDS provides a user option to recalculate dynamic response using Ru_shear from Equation 16 for all resistances (Ri) based on flexure capacity where Ri >Ru_shear. The user must enter a value of 1 (max shear stress at supports) or 2 (max shear stress at distance “d” from supports) in the Shear Flag input cell created by SBEDS to rerun SBEDS with maximum resistances of Ru_shear where Ri >Ru_shear. Resistances based on compression membrane, tension membrane, and arching are not affected. The Error Message area on the Input Sheet provides directions for rerunning the SDOF analysis using Ru_shear. This option should only be used if sufficient stirrups are not provided.
• For prestressed beams, sufficient stirrups are normally provided so that the component is not actually controlled by shear. Therefore, no shear controlled option for prestressed beams is provided in SBEDS. However, for the case where a beam does not have sufficient stirrups and the shear capacity is less than the flexural capacity, the user can reanalyze the beam using the General SDOF Analysis component type where an ultimate resistance based on shear (Ru_shear), as shown in Equation 16, is substituted for all resistances (Ri) based on flexure capacity where Ri >Ru_shear. . Otherwise all mass, stiffness, and resistance shown in the SDOF Properties section of the Input sheet for the prestressed beam can be input the General SDOF Analysis Input sheet.
• Note that the Peak Equivalent Static Reactions in SBEDS are based on the ultimate flexural resistance (Ru), not the maximum calculated resistance (Rmax) from the SDOF analysis. If the shear flag is calculated for a case where Rmax < Ru, the actual reactions may not exceed the shear strength as displayed by SBEDS in a message box.
• DoD design methods may require that the component shear capacity,

PDC TR-06-02 Rev 1 September 2008
52
Item Explanation Vs ≥ Peak Equivalent Static Reactions. In this case, redesign the component and do not use the shear flag.
• Use of the shear flag is generally recommended for analysis of existing components. HOWEVER, SBEDS only includes response criteria for flexural response. See Section 4.5.2 of the SBEDS Methodology Manual for alternative response criteria for shear-controlled component response
All Other Items Return to top of document and link to Help on General Input and Output Items Including Blast Load
Determinate Boundary Conditions Indeterminate Boundary Conditions (Solid Curve Used for Flexure Only) (Dashed Curve is used to calculate ductility ratio)
Figure 25. Resistance-Deflection Curve For Flexural Response
Positive Moment Steel
(Rebound)
Positive Moment Steel
(Inbound)
Negative Moment Steel (Rebound)(Use average if necessary)
Negative Moment Steel (Inbound)(Use average if necessary)
d (loaded side)
d (unloaded side)
L or H
Blast Load
c
c
Negative Moment
Prestressed Steel
d (loaded side)p
d (unloaded side)p
Positive Moment
Prestressed Steel
Note: Averaging is necessary for cases with unequal steel since SBEDS allows one input for these steel
Figure 26. Information for Input of Conventional and Prestressing Steel Areas and Distance of Cover Depth

PDC TR-06-02 Rev 1 September 2008
53
beamsforLK
dLKK
LBKKV
R
slabsforLK
dLKKLK
KVR
L
Ld
L
dsshearu
L
Ld
L
dsshearu
−==
−==
_
_
Equation 16 where: Ru_shear = Ultimate resistance of component per unit loaded area based on shear
capacity Vs = Shear capacity in units of force per unit length for slabs based on
concrete strength only without benefits of prestressing. (Use shear capacity in units of force including effects of stirrups to calculate Ru_shear for beams.)
KLL = Ratio KL of span L causing highest shear force at supports based on boundary conditions (Note: KL=0.5 for simply supported beam, KL=0.625 for beam with simple-fixed supports, KL conservatively based on shortest distance from maximum deflection to support in yield line pattern – see Table 4-7 in TM5-1300 for more exact calculation of shear at distance d from supports of two way spanning components)
B = Width of blast loaded area supported by beam d = Distance from blast loaded face to reinforcing steel on opposite face (see
table above for more explanation) Kd = Factor applicable when shear is controlled at distance d from support,
which generally occurs when supports on are opposite side of beam from blast load. Kd = 1.0 when shear is controlled at the support.
Table 11. Depth to Reinforcing Steel Used by SBEDS for Shear Strength Calculations
Boundary Condition Depth (d) Used for Shear Strength Calculations One-way, Cantilever d at support One-way, Fixed-Fixed d at supports One-way, Fixed-Simple d at fixed support* One-way, Simple-Simple d at midspan Two-Way, All Edges Simply Supported
Average d at midspan in both directions
Two-Way, All Edges Fixed Average d at supports in both directions Two-Way, Opposite Edges Fixed and Simply Supported
d at fixed supports *
*Highest shear load is at fixed support

PDC TR-06-02 Rev 1 September 2008
54
Reinforced Masonry Component Input Information Item Explanation
Width Resisting Blast Load / Loaded Width; Bw
• For one-way spanning slabs only, SBEDS allows input of a width resisting blast load that is less than the loaded width. Therefore, 0< Bw ≤1.0. This is particularly applicable for analyzing the wall area between windows, where Bw would equal the (wall width between windows/ center-to-center distance between windows). If 0< Bw ≤1 is not input, SBEDS will give an error message. Input Bw=1.0 for the typical case of slab without openings.
Flexural Response
• Flexural response is based on yielding at the maximum moment regions with resistance-deflection curves as shown in Figure 6. Load-mass, stiffness, and ultimate flexural resistance values for all one-way and two-way components are based on Chapter 3 in TM 5-1300, except as stated below.
• The moment capacity is based only on the input tension reinforcing steel. SBEDS assumes symmetric steel reinforcement only for the purposes of determining tension reinforcement at negative moment locations and for rebound.
• The elastic resistances for two-way components with fixed supports are based on Table 10-5 in UFC 3-340-01. For components with adjacent fixed supports, the elastic resistance is from only the negative moment capacity acting on the yield line pattern corresponding to the ultimate resistance.
• All ultimate resistances for two-way spanning components are calculated based on TM 5-1300 with a 1.08 increase factor to account for conservative approach in TM 5-1300 where only 2/3 maximum moment capacity is assumed in corners.
Flexural and Compression Membrane Response
• See above discussion for flexural response. • An equivalent elastic stiffness (KE in Figure 27) is used for flexural response.
For two-way components with fixed boundaries, KE is based on Equation 3.34 in TM 5-1300 assuming equal positive and negative moment capacities.
• Compression membrane response is calculated as described in UFC 3-340-01, with no allowance for ungrouted cells of reinforced masonry. This is a somewhat unconservative simplification, but most of the resisting moment from compression membrane comes from the masonry shells at the outer fibers and grouted cells, which are always present in reinforced masonry.
• Boundary conditions must be as shown in Figure 32. The supports should be very stiff against in-plane forces so that they cause material crushing as the wall or slab rotates at the supports under lateral load. Typically, this can be achieved by symmetry for a wall continuous over supports or by an infill wall built with a tight fit (i.e. no gap) between heavy reinforced concrete framing members. Otherwise, compression membrane effects should be ignored. .
• The resistance deflection curve is similar to that shown in the portion of Figure 28 for flexural and compression membrane response.
Flexural and Tension Membrane Response
• See above discussion for flexural response. • An equivalent elastic stiffness (KE in Figure 27) is used for flexural response.
For two-way components with fixed boundaries, KE is based on Equation 3.34 in TM 5-1300 assuming equal positive and negative moment capacities.
• Tension membrane response is calculated as described in Chapter 10 in UFC 3-340-01. Tension membrane response should only be based on unspliced, continuous steel along at least one face of the component. Boundary conditions must be as shown in Figure 32. Otherwise, tension membrane effects should not be included.
• The resistance deflection curve is similar to that shown Figure 28 for flexural and tension membrane response.
Flexural, • See above discussion for flexural, compression/tension membrane response.

PDC TR-06-02 Rev 1 September 2008
55
Item Explanation Compression and Tension Membrane Response
• The resistance deflection curve is based on Chapter 10 in UFC 3-340-01 and is similar to that shown in Figure 28.
• There is no rebound tension membrane stiffness for flexural response with compression and tension membrane due to limited number of rebound stiffnessess in SBEDS.
Type of Cross Section
• For a Type I cross section, the entire dynamic response is calculated assuming the compression force of the resisting moment is provided by the masonry at all maximum moment regions - even at large support rotations. A Type I cross section should always be assumed if there is no compression face reinforcing steel.
• For a Type II cross section, the dynamic response is calculated assuming a Type I cross section at all maximum moment regions up to a support rotation of 2 degrees, and a Type II cross section at larger support rotations. The compression force of the resisting moment is provided by the reinforcing steel at the compression face in a Type II cross section. This only affects the ultimate resistance of the equivalent SDOF system. SBEDS transitions to a Type II cross section over a support rotation of 0.2 degrees (i.e. between 2 and 2.2 degrees). The user can see this effect on the resistance-deflection curve shown on the Input worksheet. See Figure 29 for a comparison of Type I and Type II cross sections. According to UFC 3-340-01 and TM 5-1300, a Type I cross section is only applicable up to 2 degrees of support rotation. However, available test data indicates that this assumption is conservative, except possibly at very high steel reinforcing ratios as discussed in the SBEDS Methodology Manual.
• If the calculated support rotation exceeds 2 degrees for a Type II cross section, SBEDS provides a warning message that stirrups are required to provide lateral support for compression reinforcing steel in all maximum moment regions.
Reinforcing Steel Areas
• See Figure 30 for definition of terms used for input of reinforcing steel areas • SBEDS assumes that the lesser area of steel input for inbound and rebound
steel in the positive and negative moment regions (see Figure 30) at each face is continuous and unspliced along that face for any calculations related to tension membrane response.
Cover Distance to Center of Bars
• See Figure 30 for definition of terms used for input cover distance (dc) over reinforcing bars.
Masonry Type • See Table 12 and Table 13 for assumptions for each available masonry type. The user can also choose the User Defined option. The User Defined option requires input of “Percent Solid Through Webs” (see Figure 31 for definition), which is used for masonry shear strength calculations.
Static Compressive Strength, f’m
• Input masonry prism strength. If no measured values are available, see conservative recommended values in Table 14 from TM 5-1300.
Dynamic Compr. Increase Factor (DIF)
• This is ratio of the dynamic masonry strength including strain-rate effects to the static strength. A value of 1.19 is recommended in TM 5-1300.
Reinforcing Steel Yield Strength Dynamic and Static Strength Increase Factors
• Default values of 1.1 for the static increase factor (this can also be referred to as an average strength factor (ASF)) and 1.17 for the dynamic increase factor are used in SBEDS, as recommended in TM 5-1300. See UFC 3-340-01 Chapter 4 for more detailed information as a dynamic increase factor as a function of strain-rate. The steel strain-rate to yield is reported on the Results sheet. These increase factors can be modified using the “User Defined” input for the reinforcing steel.
Moment of Inertia • I is calculated as the average of the gross and cracked moment of inertias

PDC TR-06-02 Rev 1 September 2008
56
Item Explanation (I) using Equation 6-6 in TM5-1300. Equation 6-7 in TM 5-1300 is used to
calculate Icracked for reinforced masonry. Supported Weight
• Input supported weight that moves through same deflection as component. Do not include wall or slab self-weight.
Static Axial Load for P-delta Loading, P’
(Only for load bearing walls)
• User should input static axial load per unit width loaded by blast, P’, causing P-delta moment as component deflects laterally under blast load. An equivalent lateral load (wequiv) is used by SBEDS to apply a midspan moment based on (P+PDYN)*(deflection at each time step) assuming no resisting moment at the supports, at each time step in SDOF calculations. wequiv is calculated as shown in Equation 3 and added to applied load at the next time step. It is plotted on the Results sheet. This approach does not account for P-delta moment caused by any sway deflection of the top support of the component relative to the bottom. Also, it is approximate, especially for two-way spans and one-way spans with fixed boundary conditions.
• Do not input static or blast load from roof components if also inputting dynamic axial load. Also, see Section 4.4 of SBEDS Methodology Manual.
Note: See Table 7 for comparison of equivalent lateral load method in SBEDS to theory where elastic, essentially static lateral load was input in SBEDS with axial load.
Dynamic Axial Load for P-delta Loading, PDYN
(Only for load bearing walls)
• No dynamic axial load is the default. In this case, there is no dynamic axial load on the component. There can still be an input static axial load.
• Dynamic axial load per unit width prompts the user to select an input text file with dynamic reaction load from a supported roof or overhead component. The load is applied over the blast-loaded width of the analyed component. The input text file can be modified for cases where the axially loaded width is not equal to the blast loaded width as discussed in Appendix A. The input file (see Note below) has an optional first line that has the number of time-dynamic reaction pressure pairs (N) followed by N lines with time (ms), dynamic reaction pressure (psi or KPa) pairs where time and pressure are separated by a comma. The last line of input file has -999 followed by a comma and the span length, Ls (inch or mm) of the supported component that applies the dynamic reaction pressures (Equation 18). SBEDS determines PDYN as shown in Equation 18 and uses it to determine an equivalent P-delta load as shown in Equation 17. See Appendix A for an example of an input dynamic axial load input file. See Section 4.4 of SBEDS Methodology Manual for more discussion.
Note: The user can use the save file option on the SDOF Output sheet (NOT the save plot option) to save either the short span or long span dynamic reaction pressure history from the supported component and then read this saved file into SBEDS later as a dynamic axial load input file on a supporting component..
Equivalent Static Reactions
• Equivalent static reactions on the Input sheet are based on Table 3-9 and Table 3-10 in TM 5-1300 using the larger of the inbound and rebound ultimate flexural resistance. These reactions, which are per unit width over the full blast loaded area, are equivalent static shear loads compared to shear strength values. Dynamic reactions based on Dynamic Shear Factors is shown on the Results sheet, but are not used to determine maximum equivalent static reactions.
• The calculated maximum reaction at distance “d” from the support is applicable when support is on opposite face of component from blast load. For two-way components, the support reactions are multiplied by (L’-d)/L’, where L’ is the shortest distance between the support and point of maximum deflection for the given direction and the maximum value is reported. This is a simplified, conservative value (see Table 4.7 in TM 5-1300 for exact values).
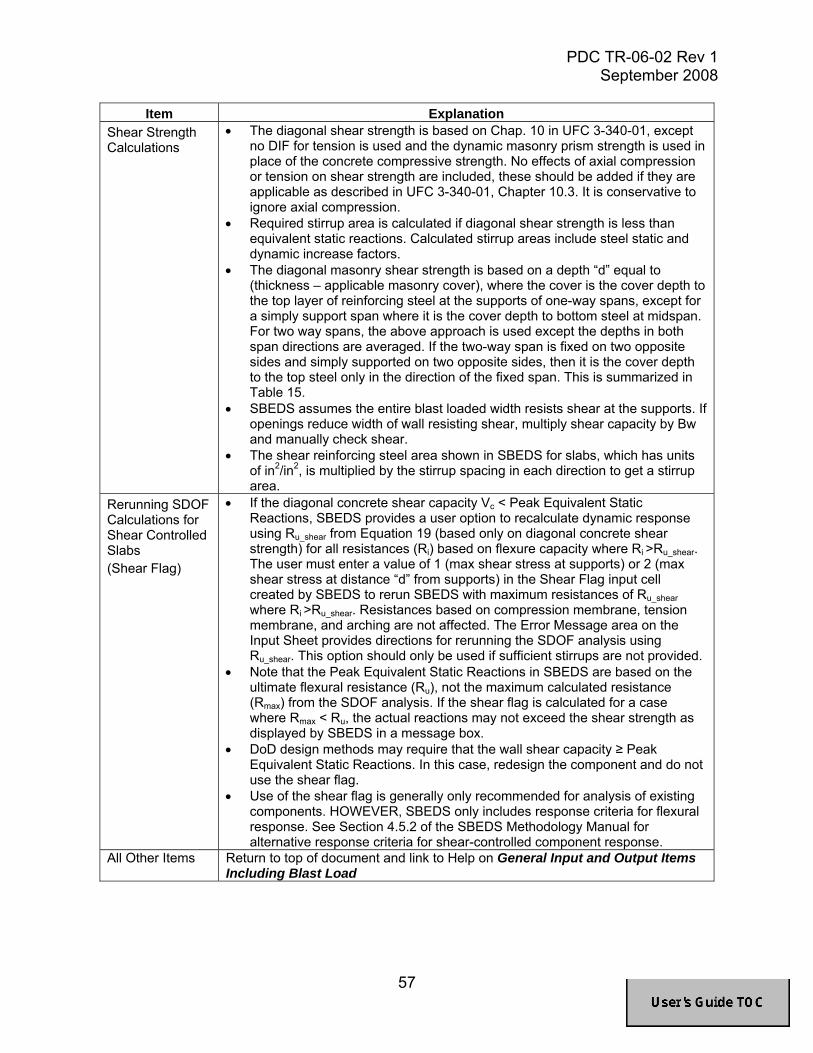
PDC TR-06-02 Rev 1 September 2008
57
Item Explanation Shear Strength Calculations
• The diagonal shear strength is based on Chap. 10 in UFC 3-340-01, except no DIF for tension is used and the dynamic masonry prism strength is used in place of the concrete compressive strength. No effects of axial compression or tension on shear strength are included, these should be added if they are applicable as described in UFC 3-340-01, Chapter 10.3. It is conservative to ignore axial compression.
• Required stirrup area is calculated if diagonal shear strength is less than equivalent static reactions. Calculated stirrup areas include steel static and dynamic increase factors.
• The diagonal masonry shear strength is based on a depth “d” equal to (thickness – applicable masonry cover), where the cover is the cover depth to the top layer of reinforcing steel at the supports of one-way spans, except for a simply support span where it is the cover depth to bottom steel at midspan. For two way spans, the above approach is used except the depths in both span directions are averaged. If the two-way span is fixed on two opposite sides and simply supported on two opposite sides, then it is the cover depth to the top steel only in the direction of the fixed span. This is summarized in Table 15.
• SBEDS assumes the entire blast loaded width resists shear at the supports. If openings reduce width of wall resisting shear, multiply shear capacity by Bw and manually check shear.
• The shear reinforcing steel area shown in SBEDS for slabs, which has units of in2/in2, is multiplied by the stirrup spacing in each direction to get a stirrup area.
Rerunning SDOF Calculations for Shear Controlled Slabs (Shear Flag)
• If the diagonal concrete shear capacity Vc < Peak Equivalent Static Reactions, SBEDS provides a user option to recalculate dynamic response using Ru_shear from Equation 19 (based only on diagonal concrete shear strength) for all resistances (Ri) based on flexure capacity where Ri >Ru_shear. The user must enter a value of 1 (max shear stress at supports) or 2 (max shear stress at distance “d” from supports) in the Shear Flag input cell created by SBEDS to rerun SBEDS with maximum resistances of Ru_shear where Ri >Ru_shear. Resistances based on compression membrane, tension membrane, and arching are not affected. The Error Message area on the Input Sheet provides directions for rerunning the SDOF analysis using Ru_shear. This option should only be used if sufficient stirrups are not provided.
• Note that the Peak Equivalent Static Reactions in SBEDS are based on the ultimate flexural resistance (Ru), not the maximum calculated resistance (Rmax) from the SDOF analysis. If the shear flag is calculated for a case where Rmax < Ru, the actual reactions may not exceed the shear strength as displayed by SBEDS in a message box.
• DoD design methods may require that the wall shear capacity ≥ Peak Equivalent Static Reactions. In this case, redesign the component and do not use the shear flag.
• Use of the shear flag is generally only recommended for analysis of existing components. HOWEVER, SBEDS only includes response criteria for flexural response. See Section 4.5.2 of the SBEDS Methodology Manual for alternative response criteria for shear-controlled component response.
All Other Items Return to top of document and link to Help on General Input and Output Items Including Blast Load

PDC TR-06-02 Rev 1 September 2008
58
Determinate Boundary Conditions Indeterminate Boundary Conditions (Solid Curve Used for Flexure Only) (Dashed Curve for Flexure and Tension Membrane)
Figure 27. Resistance-Deflection Curve For Flexural Response
Figure 28. Resistance-Deflection Curve for Reinforced Masonry Components
with Compression and Tension Membrane (from UFC 3-340-01)
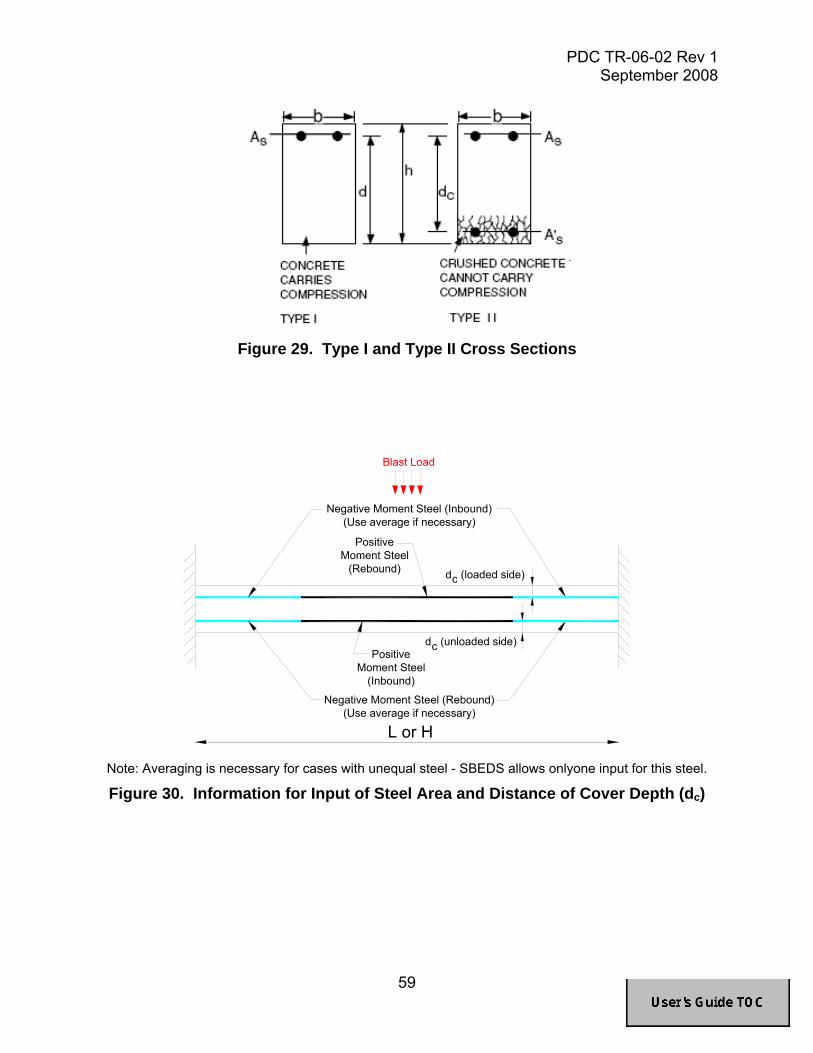
PDC TR-06-02 Rev 1 September 2008
59
Figure 29. Type I and Type II Cross Sections
Positive Moment Steel
(Rebound)
Positive Moment Steel
(Inbound)
Negative Moment Steel (Rebound)(Use average if necessary)
Negative Moment Steel (Inbound)(Use average if necessary)
d (loaded side)
d (unloaded side)
L or H
Blast Load
c
c
Note: Averaging is necessary for cases with unequal steel - SBEDS allows onlyone input for this steel. Figure 30. Information for Input of Steel Area and Distance of Cover Depth (dc)

PDC TR-06-02 Rev 1 September 2008
60
{ }
CLKW
ttPPWw
F
DYNFequiv
2
)()('
=
Δ+=
componentsmasonryandconcreteforwhenWNote F 22
AIL0:
avg
<=
Equation 17 where: wequiv = equivalent lateral load with same spatial distribution as blast load
causing PΔ moments in component (added to applied blast load) where: wequiv = equivalent lateral load with same spatial distribution as blast load
causing PΔ moments in component (added to applied blast load) WF = equivalent P-delta load factor K = 8 for uniformly loaded component supported top and bottom over axially
loaded span (including all 3 side supported component = 4 for component supported top and bottom with concentrated
midspan load = 2 for uniform load component supported at bottom of axially loaded span C = load factor in direction perpendicular to axially loaded span accounting
for component deflection distribution over axially loaded width C = 0.64 for all two-way spans (this is conservative in some cases) C = 1.0 for all one-way spans L = span length (span in direction causing axial load for 2-way spanning
components) P’ = total static axial load applied over blast loaded width of analyzed
component divided by the blast loaded width PDYN(t) = dynamic axial load per unit loaded width (usually the dynamic
reaction force from a supported component loaded by blast) Δ(t) = maximum component displacement at each time step
Iavg = average of gross and cracked moment of inertia A = cross sectional area
sDYN LtVtP )()( =
Equation 18 where: PDYN = dynamic reaction load per unit width of component (lb/in or N/m) V(t) = dynamic reaction pressure multiplied by a factor of 2 (except when applied
by cantilevers) as explained in Section 3.5 of the SBEDS Methodology Manual (psi or KPa)
Ls = one-half the span along the direction that applies PDYN to the support except it equals full span when loading component is a cantilever (inches or mm).Ls is typically calculated and saved to file by SBEDS when dynamic reaction pressure output is saved. (Example: Ls = 60 in for a 10 ft simply supported or fixed-simple beam. Ls = 120 in for axial load 20 ft high wall slab) Note: Ls can be modified in the saved file for cases where PDYN is applied

PDC TR-06-02 Rev 1 September 2008
61
over a width different from the blast loaded width – see Appendix A.
Shell Thickness ( t )s
A A
Percent Solid Through Web =100 x (width of solid space through block along A-A)/(block width) (Note: Do not include any grout, this is accounted for separately in SBEDS input)
Figure 31. Percent Solid Through Webs for CMU Cross Section
Table 12. Masonry Block Information Assumed In SBEDS Type Density
(pcf)
Percentage Solid Cross
Section (%)
Percentage Solid Through
Webs (%)
Brick 120 100 100 European Insulated Block 60 – 120* 50** 50**
Heavy Weight CMU 135 Light Weight CMU 95
Medium Weight CMU 120
See Table 13
See Table 13
• 87 pcf assumed in SBEDS calculations – use User Defined option if incorrect. ** An approximate, generally conservative value for blocks shown in Figure 33
Table 13. Assumed Cross Sectional Parameters for CMU Blocks Block
Thickness
(in)
Face Shell Thickness
(in)
Web Thickness
(in)
Percent Solid Cross Section
(%)
Percent Solid Through Webs
(%)
4 0.75 0.75 50 14 6 1.25 1.0 55 19 8 1.25 1.25 49 23
10 1.25 1.25 43 23 12 1.25 1.25 40 23

PDC TR-06-02 Rev 1 September 2008
62
Figure 32. Boundary Conditions for Tension and Compression Membrane
Response

PDC TR-06-02 Rev 1 September 2008
63
Figure 33. Small and Large European Insulated Blocks
Table 14. Recommended Conservative Values for Compressive Strength
Type of Masonry Unit Compressive Strength (f'm)* Ungrouted CMU 1350 psi Fully Grouted CMU 1500 psi Brick or Solid Masonry 1800 psi *Note: Values of 500 psi or less may be appropriate for old masonry walls (i.e., more than approximately than 50 yrs old). Also, modifications from original construction and structural discontinuities (e.g. bricked-up openings, large bearing plates and lintels, etc.) may affect strength.
1 1,FlagShear When 2,FlagShear When
_
==−
==
=
dL
Ld
L
dsshearu
KLK
dLKK
LKKV
R
Equation 19 where: Ru_shear = Ultimate resistance of component based on shear capacity per unit
loaded area Vs = Shear capacity force per unit width based only on masonry shear strength
KLL = Ratio KL of span L causing maximum shear force at support based on boundary conditions (Note: KL=0.5 for simply supported beam, KL=0.625 for beam with simple-fixed supports, KLL conservatively equals the shortest distance from maximum deflection to support inyield line pattern – see Table 4-7 in TM5-1300 for more exact calculation of shear at distance d from supports of two way spanning components)
d = distance from blast loaded face to reinforcing steel on opposite face (see discussion in table above)
Kd = Factor applicable when shear is controlled at distance d from support, which generally occurs when supports on are opposite side of slab from blast load.
Note: Kd=1.0 when shear is controlled at the support.

PDC TR-06-02 Rev 1 September 2008
64
Table 15. Depth to Reinforcing Steel Used by SBEDS for Shear Strength Calculations
Boundary Condition Depth (d) Used for Shear Strength Calculations One-way, Cantilever d at support One-way, Fixed-Fixed d at supports One-way, Fixed-Simple d at fixed support* One-way, Simple-Simple d at midspan Two-Way, All Edges Simply Supported
Average d at midspan in both directions
Two-Way, All Edges Fixed Average d at supports in both directions Two-Way, Opposite Edges Fixed and Simply Supported
d at fixed supports *
*Highest shear load is at fixed support

PDC TR-06-02 Rev 1 September 2008
65
Unreinforced Masonry Input Information Item Explanation
Width Resisting Blast Load / Loaded Width; Bw
• For one-way spanning slabs only, SBEDS allows input of a width resisting blast load that is less than the loaded width. Therefore, 0< Bw ≤1.0. This is particularly applicable for analyzing the wall area between windows, where Bw would equal the (wall width between windows/ center-to-center distance between windows). If 0< Bw ≤1 is not input, SBEDS will give an error message. Input Bw=1.0 for the typical case of slab without openings.
Brittle Flexural Response with Axial Load
• The response is based on assumptions summarized in Figure 35. • The methodology for this response mode is largely based on the WAC
computer program. r1 and r2 are the initial flexural yield and ultimate flexural resistance. r3 is calculated based on axial load and self-weight, see Equation 20.
• Figure 36 shows resistance-deflection curves used in SBEDS for this response mode. Flexural response is only assumed to occur up to the deflection causing ultimate flexural resistance. Arching from axial load controls the resistance at all larger deflections.
• For two-way spans, arching from axial load is assumed in the shorter span direction since two-way walls are typically wider than they are tall. Otherwise, the axial load can be increased to cause the correct value r3 in Equation 20. This will cause conservative P-delta calculations, but they are typically not very significant.
• See comments on flexural response in next row. Elastic-Plastic Flexural Response
• This approach is not typically recommended because static testing shows that unreinforced masonry walls to not typically exhibit plastic response. It is included only because limited plastic response has been used as an approximate approach for analyzing blast response of unreinforced masonry walls in the past.
• Flexural response is based on yielding at the maximum moment regions with resistance-deflection curves as shown in Figure 6. Load-mass, stiffness, and ultimate flexural resistance for all one-way and two-way components are based on TM 5-1300 (Chapter 3), except as stated below.
• The elastic resistances for two-way components with fixed supports are based on Table 10-5 in UFC 3-340-01. For components with adjacent fixed supports, the elastic resistance is from only the negative moment capacity acting on the yield line pattern corresponding to the ultimate resistance.
• All ultimate resistances for two-way spanning components are calculated based on TM 5-1300 with a 1.08 increase factor to account for conservative approach in TM 5-1300 where only 2/3 maximum moment capacity is assumed in corners.
• See calculation of flexural moment capacity below. Rigid Arching (Compression Membrane Response)
• Flexural response not included, assumed negligible compared to arching. • Arching response is calculated as shown in Equation 21 and Equation 22
for one-way and two-way arching, respectively, based on the methodology in Chapter 12 of “Reinforced Concrete Slabs” by Park and Gamble (2000) assuming zero reinforcing steel and allowing for ungrouted masonry voids and a gap between edge of wall and rigid supports. The gap is treated as a “support movement” independent of compression force in the methodology.
• The resistance deflection curve is similar to that shown in Figure 37. • No rebound is calculated for arching if there is an input gap dimension
between the wall and support. This causes a very low initial stiffness and the rebound SDOF calculation method in SBEDS is set up for initial stiffness > other stiffnesses. If rebound is critical, another methodology should be used to calculate response.

PDC TR-06-02 Rev 1 September 2008
66
Item Explanation Double Wythe Wall Systems
• SBEDS allows input of double wythe walls, where the walls are assumed to deflect together. Both walls must have the same height and/or width dimensions and the same boundary conditions. They can have different cross sectional properties.
• The load resisted by each wall in flexural response is based on the relative wall stiffnesses, as recommended in ACI 530-02, Section 2.1.5.3.1. The walls are assumed to act in flexural as two springs in parallel until one of the walls yields, when the two wall system is assumed to achieve maximum flexural resistance. See Equation 23 and Equation 24.
• All rigid boundary arching and applied axial load is assumed to act only on the inner wall. The outer wall only contributes to the mass.
• Axial load arching includes the summed effect of self-weight load on the outer wall and self-weight plus input axial load on the inner wall.
Masonry Type • See Table 16 and Table 17 for assumptions for each available masonry type. The user can also choose the User Defined option. The User Defined option requires input of “Percent Solid Through Webs”. See Figure 38 for definition of this variable.
Masonry Dynamic Tensile Strength, fdt
• Input dynamic tensile strength for flexural response calculations. Recommended input value is 0.1f’m ≥ 200 psi.
Masonry Static Prism Strength, f’m
• Input masonry prism strength. If no measured values are available, see recommended values in Table 14 from TM 5-1300.
Masonry Dynamic Increase Factor, DIF
• This is the ratio of the dynamic masonry compressive strength, including strain-rate effects, to the static strength. A value of 1.19 is recommended in TM 5-1300.
Moment Capacity • The moment capacity for flexural response is S*(fdt + Paxial/A), where S=elastic section modulus, A=cross sectional area, fdt and Paxial are input values.
Axial Load, Paxial • User should input axial load only if rigid arching response mode has not been selected. In this case, Paxial is used to determine moment capacity and the post-peak resistance for brittle response. The axial load is always applied over the full blast loaded width of one-way slabs regardless of input Bw value defined above. Unlike other components, axial load enhances strength of unreinforced masonry and the resistance generally goes to zero at deflections greater than its thickness. Therefore, P-delta (and thus dynamic axial load) effects are not included.
Gap from Edge of Wall to Rigid Support
• If arching response mode is selected, input total gap dimension from edges of wall to rigid supports in direction of input arching. This will be sum of gap on both sides for horizontal arching, gap at top of wall for vertical arching, or average of these values for two-way arching. There is often a 0.25 inch to 0.5 inch gap at the edges of masonry walls (usually filled with a flexible material) to allow masonry to expand/contract with temperature change.
• In most cases, rigid arching can only be assumed for an in-fill masonry wall built within a substantial reinforced concrete frame or a wall panel that is continuous over its supports.
Damping • Small amounts of damping have much more of an affect on unreinforced masonry with brittle flexure and arching from axial load than on other cases. Based on SDOF comparisons to unreinforced masonry data with this response type performed while developing the CEDAW methodology, 2% of critical damping is recommended for this case.

PDC TR-06-02 Rev 1 September 2008
67
Item Explanation Equivalent Static Reactions
• Equivalent static reactions on the Input sheet are based on Table 3-9 and Table 3-10 in TM 5-1300 and the ultimate flexural resistance. These reactions are treated as equivalent static shear loads and compared to shear strength values. Dynamic reactions based on Dynamic Shear Factors on the Input sheet are shown on the Results sheet.
• The calculated maximum reaction at distance equal to the wall thickness (t) from the support is applicable when support is on opposite face of component from blast load. For two-way components, the support reactions are multiplied by (L’-t)/L’, where L’ is the shortest distance between the support and point of maximum deflection for the given direction and the maximum value is reported. This is a simplified, conservative value for two-way components (see Table 4.7 in TM 5-1300 for more exact values).
Shear Strength Calculations
• The diagonal shear strength is based on Chap. 10 in UFC 3-340-01, except no DIF for tension is used and the dynamic masonry prism strength is used in place of the concrete compressive strength. No effects of axial compression or tension on shear strength are included, these should be added if they are applicable as described in UFC 3-340-01, Chapter 10.3. It is conservative to ignore axial compression.
• The shear area is based only on the solid area through the webs in Figure 38, plus grouted cells.
Note: A vertical span is assumed in the shear area calculations. For a horizontal spanning wall, the shear area per unit width is equal to twice the shell thicknesses divided by the wall thickness.
Rerunning SDOF Calculations for Shear Controlled Slabs (Shear Flag)
• If the shear capacity Vs < Peak Equivalent Static Reactions, SBEDS provides a user option to recalculate dynamic response using Ru_shear from Equation 25 for all resistances (Ri) based on flexure capacity where Ri >Ru_shear. The user must enter a value of 1 (max shear stress at supports) or 2 (max shear stress at distance “d” from supports) in the Shear Flag input cell created by SBEDS to rerun SBEDS with maximum resistances of Ru_shear where Ri >Ru_shear. Resistances based on compression membrane, tension membrane, and arching are not affected. The Error Message area on the Input Sheet provides directions for rerunning the SDOF analysis using Ru_shear. This option is generally recommended, but there may be cases where the shear capacity is conservatively calculated and the user may elect not to rerun the SDOF calculations.
• Note that the Peak Equivalent Static Reactions in SBEDS are based on the ultimate flexural resistance (Ru), not the maximum calculated resistance (Rmax) from the SDOF analysis. If the shear flag is calculated for a case where Rmax < Ru, the actual reactions may not exceed the shear strength as displayed by SBEDS in a message box.
• DoD design methods may require that the wall shear capacity ≥ Peak Equivalent Static Reactions. In this case, redesign the component and do not use the shear flag.
• Use of the shear flag is generally only recommended for analysis of existing components. HOWEVER, SBEDS only includes response criteria for flexural response. See Section 4.5.2 of the SBEDS Methodology Manual for alternative response criteria for shear-controlled component response.
All Other Items Return to top of document and link to Help on General Input and Output Items Including Blast Load

PDC TR-06-02 Rev 1 September 2008
68
Determinate Boundary Conditions Indeterminate Boundary Conditions (Solid Curve Used for Flexure Only) (Dashed Curve is used to calculate ductility ratio)
Figure 34. Resistance-Deflection Curve For Flexural Response
h
x
W + Paxial
r 1&
2r
r 3
Leng
th, L
axialP axialP
v
v
x
v
v
axialW + P Response prior to ultimate flexural resistance, r2 Response after r2 where x= arching moment arm
Figure 35. Response of Brittle Unreinforced Masonry Wall Under Combined Lateral and Axial Load

PDC TR-06-02 Rev 1 September 2008
69
rr 2=1
3r
3rR
esis
tanc
e
Deflection
1x = 2x x3
Decaying
Elastic
ek1
ek1
h
Phase
r 2
3r
3r
Res
ista
nce
Deflection2x x3
hx1
1r
1ke
1kep
k
1
ep
Elastic &Elastic-Plastic
DecayingPhase
Determinate Component Indeterminate Component
Figure 36. Resistance-Deflection Curves for Unreinforced Masonry with Brittle Flexural Response and Axial Load From WAC Program
( ) ⎟⎠⎞
⎜⎝⎛ +−=
28
223WLPxh
Lr
Equation 20 where: r3 = maximum resistance from axial load effects x3 = flexural deflection at r2+ (r3 – r2) /Kep Kep = elastic-plastic stiffness for indeterminate components, otherwise equal
to elastic stiffness h = overall wall thickness
P = input axial load per unit width along wall, Paxial W = areal self-weight and supported weight of wall L = span length equal to wall height
( )
( )
( )[ ] hMIN
LhLh
MIN
tckfCtfC
Ltwhere
LLhc
CCtc
thCthC
Lr
gst
gg
gm
sm
sm
gm
ms
ss
≤Δ+=Δ
⎟⎟⎠
⎞⎜⎜⎝
⎛ +−+⎟
⎠⎞
⎜⎝⎛−=Δ
Δ+⎟⎠⎞
⎜⎝⎛=Δ
−==
+=⎟⎟⎠
⎞⎜⎜⎝
⎛+−
Δ−=
⎥⎦
⎤⎢⎣
⎡Δ+−⎟
⎠
⎞⎜⎝
⎛ −−−+⎟
⎠
⎞⎜⎝
⎛−=
0.08L,0.8h
22
2h,
30L
85.0'85.0'85.0
2''22
)(2
85.02
222
28
22
2
2
1
2
21212max
δ
εεδ
εβ
Equation 21

PDC TR-06-02 Rev 1 September 2008
70
where: rmax = maximum one-way rigid arching resistance occurring at Δm Δm = midspan deflection at maximum resistance
c = compression block depth h = overall wall thickness
ε’ = compression strain due to arching forces and support movement strain (see Eq. 10-39 in UFC 3-340-01 with no steel forces for calculation of ε’)
t = outward movement of each support caused by arching forces (Note: support stiffness assumed equal to 0.2Em per UFC 3-340-01) δg = gap between edge of wall and rigid supports f’m = masonry compressive prism strength ts = masonry shell thickness (see Figure 31) k = solid ratio of masonry through webs (i.e. cross section A-A in Figure 31) (k = 0 assumed for horizontal span arching if not fully grouted) L = span length C1 = compression force per unit width in shell C2 = compression force per unit width in webs Δg = deflection when corner of wall engages rigid support (Δg = 0 if δg =0) Δst = arching snap through deflection causing zero arching resistance β = distance from support to yield location divided by span length = 0.5
( ) ( )
( )
( )
yyy
xxx
yy
gy
my
xx
gx
mx
syymy
sxxmx
smxx
sysy
syyy
sxsx
sxxx
y
xyyx
m
y
yxyyyyxx
yxy
CCnCCn
Ltwhere
LLhc
Ltwhere
LLhc
tckfCtckfC
tfCC
tcthC
thCmm
tcthC
thCmm
LL
nnnL
LLmmmmmm
LLLr
21
21
2
2
2
2
21
21
21
max
2''22
2''22
)85(.'85.0)85(.'85.0
'85.0
285.0
222'
285.0
222'
22
'''3
24
+=+=
+=⎟⎟⎠
⎞⎜⎜⎝
⎛+−
Δ−=
+=⎟⎟⎠
⎞⎜⎜⎝
⎛+−
Δ−=
−=−=
==
⎟⎟⎠
⎞⎜⎜⎝
⎛ −−−+⎟
⎠
⎞⎜⎝
⎛ −==
⎟⎟⎠
⎞⎜⎜⎝
⎛ −−−+⎟
⎠
⎞⎜⎝
⎛ −==
⎥⎥⎦
⎤
⎢⎢⎣
⎡⎟⎟⎠
⎞⎜⎜⎝
⎛+−
Δ−
−++++++
−=
εεδ
εβ
εεδ
εβ
Equation 22
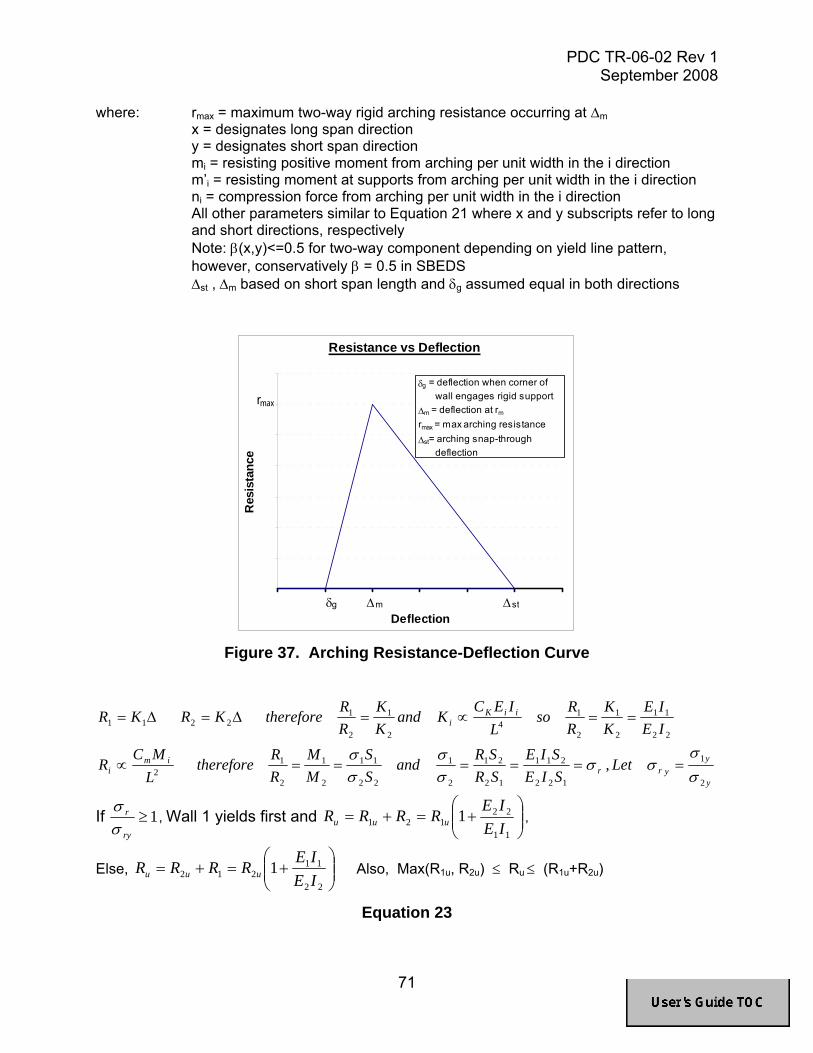
PDC TR-06-02 Rev 1 September 2008
71
where: rmax = maximum two-way rigid arching resistance occurring at Δm
x = designates long span direction y = designates short span direction
mi = resisting positive moment from arching per unit width in the i direction m’i = resisting moment at supports from arching per unit width in the i direction ni = compression force from arching per unit width in the i direction All other parameters similar to Equation 21 where x and y subscripts refer to long
and short directions, respectively Note: β(x,y)<=0.5 for two-way component depending on yield line pattern,
however, conservatively β = 0.5 in SBEDS Δst , Δm based on short span length and δg assumed equal in both directions
Resistance vs Deflection
0
0.5
1
1.5
2
2.5
3
3.5
0 2 4 6 8 10 12
Deflection
Res
ista
nce
δg
rmax
δg = deflection when corner of wall engages rigid support Δm = deflection at rm
rmax = max arching resistanceΔst= arching snap-through deflection
Δm Δst
Figure 37. Arching Resistance-Deflection Curve
y
yyrr
imi
iiKi
LetSIESIE
SRSR
andSS
MM
RR
thereforeLMC
R
IEIE
KK
RR
soL
IECKand
KK
RR
thereforeKRKR
2
1
122
211
12
21
2
1
22
11
2
1
2
12
22
11
2
1
2
14
2
1
2
12211
,σσ
σσσσ
σσ
======∝
==∝=Δ=Δ=
If 1≥ry
r
σσ
, Wall 1 yields first and ⎟⎟⎠
⎞⎜⎜⎝
⎛+=+=
11
22121 1
IEIE
RRRR uuu ,
Else, ⎟⎟⎠
⎞⎜⎜⎝
⎛+=+=
22
11212 1
IEIE
RRRR uuu Also, Max(R1u, R2u) ≤ Ru ≤ (R1u+R2u)
Equation 23

PDC TR-06-02 Rev 1 September 2008
72
21 KKK +=
Equation 24
where: i =1 for inner wall and 2 for outer wall Ri = resistance ith wall Riu = ultimate or maximum resistance of ith wall Ru = ultimate or maximum resistance of two-wall system Ki = flexural stiffness of ith wall K = flexural stiffness of two-wall system Ei = Young’s modulus of walls Ii = moment of inertia of ith wall Si = section modulus of ith wall Δ = equal midpan deflections of both walls
L = equal spans of both walls σi = maximum flexural stress in walls Mi = maximum moment capacity of ith wall σiy = yield stress of ith wall Cm = moment constants dependent on boundary conditions - same for
each wall CK = stiffness constants dependent on boundary conditions - same for each wall
Shell Thickness ( t )s
A A
Percent Solid Through Web =100 x (width of solid space through block along A-A)/(block width) (Note: Do not include any grout, this is accounted for separately in SBEDS input)
Figure 38. Percent Solid Through Web of CMU Cross Section Table 16. Masonry Block Information Assumed In SBEDS
Type Density
(pcf)
Percentage Solid Cross
Section (%)
Percent Solid Through Webs
(%)
Brick 120 100 100
European Insulated Block 60 – 120* 50** 50**
Heavy Weight CMU 135 Light Weight CMU 95
Medium Weight CMU 120
See Table 17
See Table 17
* 87 pcf assumed in SBEDS calculations – use User Defined option if incorrect. ** An approximate, generally conservative value for blocks shown in Figure 39

PDC TR-06-02 Rev 1 September 2008
73
Table 17. Assumed Cross Section Parameters for CMU Blocks Block
Thickness
(in)
Face Shell Thickness
(in)
Web Thickness
(in)
Percentage Solid Cross Section
(%)
Percentage Solid Through Webs
(%)
4 0.75 0.75 50 14 6 1.25 1.0 55 19 8 1.25 1.25 49 23
10 1.25 1.25 43 23 12 1.25 1.25 40 23
Figure 39. Small and Large European Insulated Blocks
Table 18. Recommended Conservative Values for Compressive Strength
Type of Masonry Unit Compressive Strength (f'm)* Ungrouted CMU 1350 psi Fully Grouted CMU 1500 psi Brick or Solid Masonry 1800 psi *Note: Values of 500 psi or less may be appropriate for old masonry walls (i.e., more than approximately than 50 yrs old). Also, modifications from original construction and structural discontinuities (e.g. bricked-up openings, large bearing plates and lintels, etc.) may affect strength.
1 1,FlagShear When 2,FlagShear When
_
==−
==
=
dL
Ld
L
dsshearu
KLK
dLKK
LKKV
R
Equation 25

PDC TR-06-02 Rev 1 September 2008
74
where: Ru_shear = Ultimate resistance of component based on shear capacity per unit
loaded area Vs = Shear capacity force per unit width based on masonry shear strength.
This is equal to Vu in Equation 26 for the case of a double wythe wall. KLL = Ratio KL of span L causing maximum shear force at support based on
boundary conditions (Note: KL=0.5 for simply supported beam, KL=0.625 for beam with simple-fixed supports, KLL conservatively equals the shortest distance from maximum deflection to support inyield line pattern – see Table 4-7 in TM5-1300 for more exact calculation of shear at distance d from supports of two way spanning components)
d = distance from blast loaded face to reinforcing steel on opposite face (see discussion in table above)
Kd = Factor applicable when shear is controlled at distance d from support, which generally occurs when supports on are opposite side of slab from blast load.
Note: Kd=1.0 when shear is controlled at the support.
2
1
21
12
21
12
2
1
22
11
2
1
22
11
2
1
2
1
2
1 *
y
yyrr
ivi
vv
vandKAKA
RARA
vvvlet
AvAv
VV
IEIE
KK
RR
VVtherefore
LRC
V
=====
===∝
If 1≥ry
r
vv
, then Wall 1 yields first and ⎟⎟⎠
⎞⎜⎜⎝
⎛+=+=
11
22121 1
IEIE
VVVV uuu
Else, Wall 2 yields first and ⎟⎟⎠
⎞⎜⎜⎝
⎛+=+=
22
11212 1
IEIEVVVV uuu
*See first line of Equation 24
Equation 26 where: i =1 for inner wall and 2 for outer wall
Vi = shear force on of ith wall per unit width Viu = ultimate resisting shear force of ith wall Vu = ultimate resisting shear force of two wall system Ri = ultimate flexural resistance of walls Ki = flexural stiffness of walls Ai = shear area of ith wall per unit width
L = equal spans of both walls vi = maximum shear stress in ith wall vyi = yield shear stress of ith wall
Cv = shear force constants dependent on boundary conditions, which are the same for each wall

PDC TR-06-02 Rev 1 September 2008
75
Wood Beam-Column Component Input Information Item Explanation
Response Mode • Only flexural response is considered for wood components with a number of available boundary and load conditions. Load-mass, stiffness, and ultimate resistance values are based on Chapter 3 of TM 5-1300.
Wood Density • Wood density ranges based on wood type from 25 to 60 lb/ft3. The AISC Manual of Steel Construction has a wide range of values in Part 6 under Miscellaneous Data.
Wood Species and Grade
• A wood species and grade can be selected and SBEDS will use properties from the National Design Specification® (NDS) for Wood Construction Supplement: Design Values for Wood Construction, 2005 Edition in Table 19. The user can also choose the User Defined option and directly enter wood properties.
Modulus of Elasticity, E
• Wood modulus of elasticity generally ranges from 1x10⁶ psi to 2x10⁶ psi. SBEDS will use a value from Table 19 for a user designated wood species and grade.
Dynamic Yield Strength in flexure, fdy
• Input the ultimate dynamic rupture strength for wood in flexure. Typically, there is at least a 2.5 safety factor on allowable static strengths and a dynamic increase factor of 2.0 for very short term loading. Therefore, allowable static wood flexural strengths can be increased by at least a factor of 5.0. SBEDS will calculate a dynamic flexural strength equal to five times the allowable strength in Table 19 for a user designated wood species and grade.
Loaded Area Factor, AF
• Ratio of [blast loaded area on component] to [component spacing*span]. AF =1 for any uniformly distributed blast load, AF ≤1for concentrated loads where attached components transfer load from area that does not include full span. See Figure 40 for example case where AF = 0.5. Stiffness and resistance values are based on a blast loaded area = AF BL. Mass calculations unaffected by AF since supported mass per unit loaded area is input directly and the self-weight mass is independent of AF.
Moment Capacity • The moment capacity for flexural response is S(fdy + PT/A), where S=elastic section modulus, A=cross sectional area, and fdy are input values. PT includes the input static axial load and the peak dynamic axial load.
Static Axial Load for Compression and P-delta Loading, P
(Only for Beam-Columns)
User should input static axial load P on beam/column causing compression and P-delta moment as component deflects laterally under blast load. An equivalent lateral load (wequiv) is used by SBEDS to apply a midspan moment based on (P/B+PDYN)(deflection at each time step) assuming no resisting moment at the supports, at each time step in SDOF calculations. B is the beam-column spacing and PDYN is explained in the next row. wequiv is calculated as shown in Equation 27 and added to applied load at the next time step. It is plotted on the Results sheet. This approach does not account for P-delta moment caused by any sway deflection of the top support of the component relative to the bottom. Also, it is an approximate approach, especially for two-way spans and one-way spans with fixed boundary conditions. Note: See Table 7 for comparison of equivalent lateral load method in SBEDS to theory where elastic, essentially static lateral load was input in SBEDS with axial load.

PDC TR-06-02 Rev 1 September 2008
76
Dynamic Axial Load for Compression and P-delta Loading, PDYN
(Only for Beam-Columns)
• No dynamic axial load is the default. In this case, there is no dynamic axial load on the component. There can still be an input static axial load.
• Dynamic axial load per unit width prompts the user to select an input text file with a dynamic reaction load from a supported roof or overhead component. This file (see Note below) has an optional first line that has the number of time-dynamic reaction pressure pairs (N) followed by N lines with time (ms), dynamic reaction pressure (psi or KPa) pairs where time and pressure are separated by a comma. Usually this input file is generated by SBEDS as described in note below. The last line of input file has -999 followed by a comma and the span length, Ls (inch or mm) of the supported component that applies the dynamic reaction pressure (Equation 28). SBEDS determines PDYN as shown in Equation 28 and uses it to determine an equivalent P-delta load as shown in Equation 27. See Appendix A for an example of an input dynamic axial load input file. See Section 4.4. in the SBEDS Methodology Manual for more discussion.
Note: The user can use the save file option on the SDOF Output sheet (NOT the save plot option) to save either the short span or long span dynamic reaction pressure history from the supported component and then read this saved file into SBEDS as a dynamic axial load input file on a supporting component.
Loaded Width for Dynamic Axial Load, Ba
• Only applicable for cases with input dynamic axial load • Input width along top of component subject to dynamic axial load per
unit width (see Equation 27). Equivalent Static Reactions
• Equivalent static reactions on the Input sheet are based on Table 3-9 in TM 5-1300 using the ultimate flexural resistance. These reactions can be treated as equivalent static shear loads and compared to shear strength values. Dynamic reactions based on Dynamic Shear Factors on the Input sheet are shown on the Results sheet.
• The shear strength of wood is almost always controlled by the connections and is outside the scope of SBEDS.
All Other Items Return to top of document and link to Help on General Input and Output Items Including Blast Load
L
B
Beam
Blast Loaded Areaon Girder
Girder
Note that beams only transfer blast load from 50% of the area B*L into girder in this example where the beams have a pinned connection to girders. The blast load from the rest of this area is transferred by beams directly into columns supporting girder.
B=Girder Spacing
BLarealoadedblastAF
__=
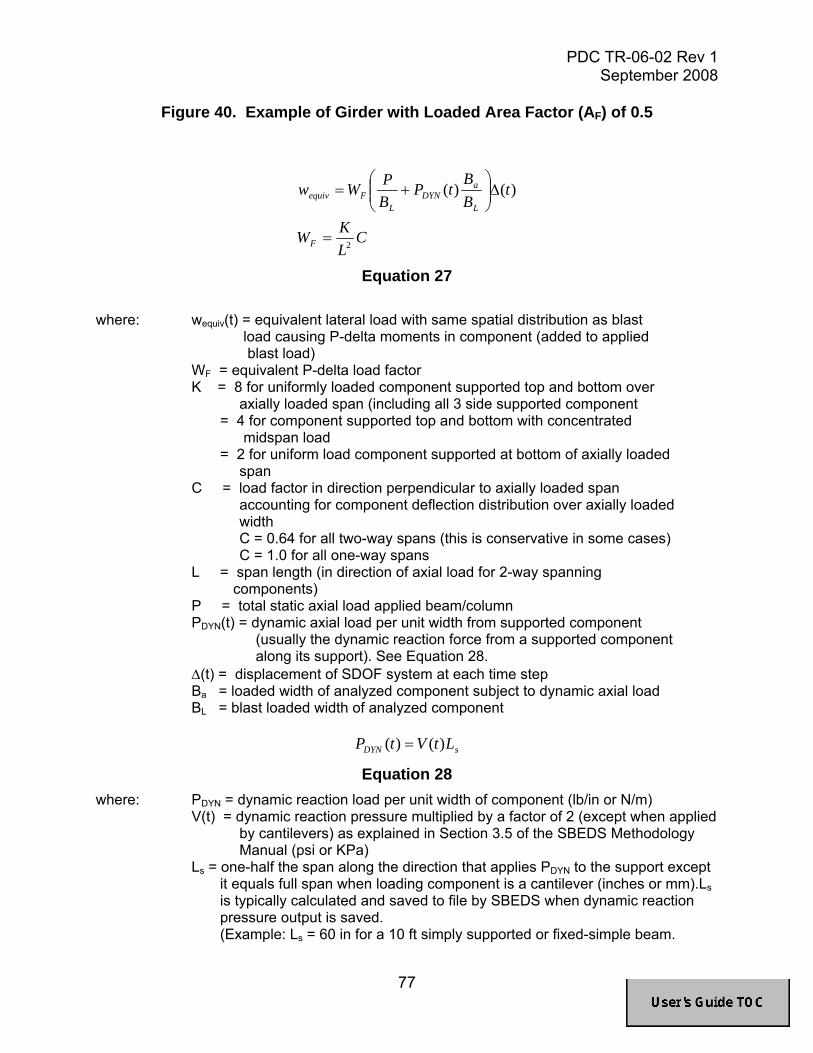
PDC TR-06-02 Rev 1 September 2008
77
Figure 40. Example of Girder with Loaded Area Factor (AF) of 0.5
CLKW
tBB
tPBPWw
F
L
aDYN
LFequiv
2
)()(
=
Δ⎟⎟⎠
⎞⎜⎜⎝
⎛+=
Equation 27 where: wequiv(t) = equivalent lateral load with same spatial distribution as blast
load causing P-delta moments in component (added to applied blast load)
WF = equivalent P-delta load factor K = 8 for uniformly loaded component supported top and bottom over
axially loaded span (including all 3 side supported component = 4 for component supported top and bottom with concentrated
midspan load = 2 for uniform load component supported at bottom of axially loaded
span C = load factor in direction perpendicular to axially loaded span
accounting for component deflection distribution over axially loaded width
C = 0.64 for all two-way spans (this is conservative in some cases) C = 1.0 for all one-way spans L = span length (in direction of axial load for 2-way spanning
components) P = total static axial load applied beam/column PDYN(t) = dynamic axial load per unit width from supported component (usually the dynamic reaction force from a supported component along its support). See Equation 28.
Δ(t) = displacement of SDOF system at each time step Ba = loaded width of analyzed component subject to dynamic axial load BL = blast loaded width of analyzed component
sDYN LtVtP )()( =
Equation 28 where: PDYN = dynamic reaction load per unit width of component (lb/in or N/m) V(t) = dynamic reaction pressure multiplied by a factor of 2 (except when applied
by cantilevers) as explained in Section 3.5 of the SBEDS Methodology Manual (psi or KPa)
Ls = one-half the span along the direction that applies PDYN to the support except it equals full span when loading component is a cantilever (inches or mm).Ls is typically calculated and saved to file by SBEDS when dynamic reaction pressure output is saved. (Example: Ls = 60 in for a 10 ft simply supported or fixed-simple beam.

PDC TR-06-02 Rev 1 September 2008
78
Ls = 120 in for axial load 20 ft high wall slab)
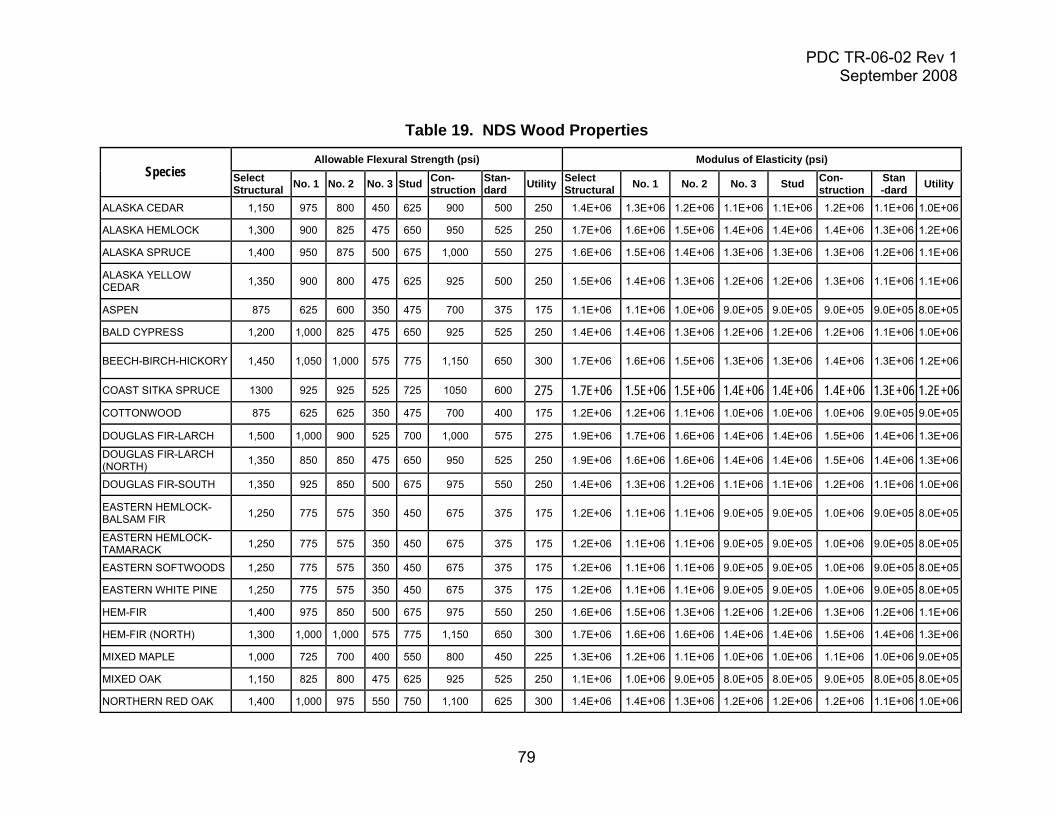
PDC TR-06-02 Rev 1 September 2008
79
Table 19. NDS Wood Properties
Allowable Flexural Strength (psi) Modulus of Elasticity (psi) Species Select
Structural No. 1 No. 2 No. 3 Stud Con- struction
Stan- dard Utility Select
Structural No. 1 No. 2 No. 3 Stud Con-struction
Stan -dard Utility
ALASKA CEDAR 1,150 975 800 450 625 900 500 250 1.4E+06 1.3E+06 1.2E+06 1.1E+06 1.1E+06 1.2E+06 1.1E+06 1.0E+06
ALASKA HEMLOCK 1,300 900 825 475 650 950 525 250 1.7E+06 1.6E+06 1.5E+06 1.4E+06 1.4E+06 1.4E+06 1.3E+06 1.2E+06
ALASKA SPRUCE 1,400 950 875 500 675 1,000 550 275 1.6E+06 1.5E+06 1.4E+06 1.3E+06 1.3E+06 1.3E+06 1.2E+06 1.1E+06
ALASKA YELLOW CEDAR 1,350 900 800 475 625 925 500 250 1.5E+06 1.4E+06 1.3E+06 1.2E+06 1.2E+06 1.3E+06 1.1E+06 1.1E+06
ASPEN 875 625 600 350 475 700 375 175 1.1E+06 1.1E+06 1.0E+06 9.0E+05 9.0E+05 9.0E+05 9.0E+05 8.0E+05
BALD CYPRESS 1,200 1,000 825 475 650 925 525 250 1.4E+06 1.4E+06 1.3E+06 1.2E+06 1.2E+06 1.2E+06 1.1E+06 1.0E+06
BEECH-BIRCH-HICKORY 1,450 1,050 1,000 575 775 1,150 650 300 1.7E+06 1.6E+06 1.5E+06 1.3E+06 1.3E+06 1.4E+06 1.3E+06 1.2E+06
COAST SITKA SPRUCE 1300 925 925 525 725 1050 600 275 1.7E+06 1.5E+06 1.5E+06 1.4E+06 1.4E+06 1.4E+06 1.3E+06 1.2E+06 COTTONWOOD 875 625 625 350 475 700 400 175 1.2E+06 1.2E+06 1.1E+06 1.0E+06 1.0E+06 1.0E+06 9.0E+05 9.0E+05
DOUGLAS FIR-LARCH 1,500 1,000 900 525 700 1,000 575 275 1.9E+06 1.7E+06 1.6E+06 1.4E+06 1.4E+06 1.5E+06 1.4E+06 1.3E+06
DOUGLAS FIR-LARCH (NORTH) 1,350 850 850 475 650 950 525 250 1.9E+06 1.6E+06 1.6E+06 1.4E+06 1.4E+06 1.5E+06 1.4E+06 1.3E+06
DOUGLAS FIR-SOUTH 1,350 925 850 500 675 975 550 250 1.4E+06 1.3E+06 1.2E+06 1.1E+06 1.1E+06 1.2E+06 1.1E+06 1.0E+06
EASTERN HEMLOCK-BALSAM FIR 1,250 775 575 350 450 675 375 175 1.2E+06 1.1E+06 1.1E+06 9.0E+05 9.0E+05 1.0E+06 9.0E+05 8.0E+05
EASTERN HEMLOCK-TAMARACK 1,250 775 575 350 450 675 375 175 1.2E+06 1.1E+06 1.1E+06 9.0E+05 9.0E+05 1.0E+06 9.0E+05 8.0E+05
EASTERN SOFTWOODS 1,250 775 575 350 450 675 375 175 1.2E+06 1.1E+06 1.1E+06 9.0E+05 9.0E+05 1.0E+06 9.0E+05 8.0E+05
EASTERN WHITE PINE 1,250 775 575 350 450 675 375 175 1.2E+06 1.1E+06 1.1E+06 9.0E+05 9.0E+05 1.0E+06 9.0E+05 8.0E+05
HEM-FIR 1,400 975 850 500 675 975 550 250 1.6E+06 1.5E+06 1.3E+06 1.2E+06 1.2E+06 1.3E+06 1.2E+06 1.1E+06
HEM-FIR (NORTH) 1,300 1,000 1,000 575 775 1,150 650 300 1.7E+06 1.6E+06 1.6E+06 1.4E+06 1.4E+06 1.5E+06 1.4E+06 1.3E+06
MIXED MAPLE 1,000 725 700 400 550 800 450 225 1.3E+06 1.2E+06 1.1E+06 1.0E+06 1.0E+06 1.1E+06 1.0E+06 9.0E+05
MIXED OAK 1,150 825 800 475 625 925 525 250 1.1E+06 1.0E+06 9.0E+05 8.0E+05 8.0E+05 9.0E+05 8.0E+05 8.0E+05
NORTHERN RED OAK 1,400 1,000 975 550 750 1,100 625 300 1.4E+06 1.4E+06 1.3E+06 1.2E+06 1.2E+06 1.2E+06 1.1E+06 1.0E+06
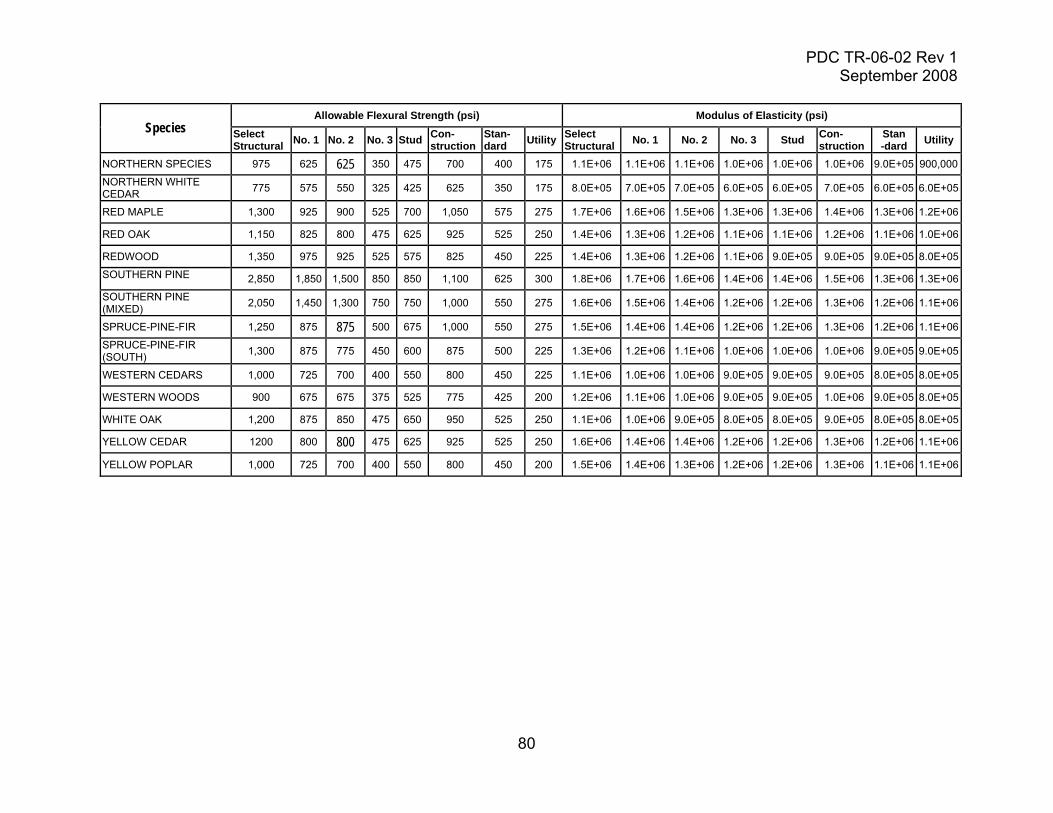
PDC TR-06-02 Rev 1 September 2008
80
Allowable Flexural Strength (psi) Modulus of Elasticity (psi) Species Select
Structural No. 1 No. 2 No. 3 Stud Con- struction
Stan- dard Utility Select
Structural No. 1 No. 2 No. 3 Stud Con-struction
Stan -dard Utility
NORTHERN SPECIES 975 625 625 350 475 700 400 175 1.1E+06 1.1E+06 1.1E+06 1.0E+06 1.0E+06 1.0E+06 9.0E+05 900,000
NORTHERN WHITE CEDAR 775 575 550 325 425 625 350 175 8.0E+05 7.0E+05 7.0E+05 6.0E+05 6.0E+05 7.0E+05 6.0E+05 6.0E+05
RED MAPLE 1,300 925 900 525 700 1,050 575 275 1.7E+06 1.6E+06 1.5E+06 1.3E+06 1.3E+06 1.4E+06 1.3E+06 1.2E+06
RED OAK 1,150 825 800 475 625 925 525 250 1.4E+06 1.3E+06 1.2E+06 1.1E+06 1.1E+06 1.2E+06 1.1E+06 1.0E+06
REDWOOD 1,350 975 925 525 575 825 450 225 1.4E+06 1.3E+06 1.2E+06 1.1E+06 9.0E+05 9.0E+05 9.0E+05 8.0E+05
SOUTHERN PINE 2,850 1,850 1,500 850 850 1,100 625 300 1.8E+06 1.7E+06 1.6E+06 1.4E+06 1.4E+06 1.5E+06 1.3E+06 1.3E+06
SOUTHERN PINE (MIXED) 2,050 1,450 1,300 750 750 1,000 550 275 1.6E+06 1.5E+06 1.4E+06 1.2E+06 1.2E+06 1.3E+06 1.2E+06 1.1E+06
SPRUCE-PINE-FIR 1,250 875 875 500 675 1,000 550 275 1.5E+06 1.4E+06 1.4E+06 1.2E+06 1.2E+06 1.3E+06 1.2E+06 1.1E+06
SPRUCE-PINE-FIR (SOUTH) 1,300 875 775 450 600 875 500 225 1.3E+06 1.2E+06 1.1E+06 1.0E+06 1.0E+06 1.0E+06 9.0E+05 9.0E+05
WESTERN CEDARS 1,000 725 700 400 550 800 450 225 1.1E+06 1.0E+06 1.0E+06 9.0E+05 9.0E+05 9.0E+05 8.0E+05 8.0E+05
WESTERN WOODS 900 675 675 375 525 775 425 200 1.2E+06 1.1E+06 1.0E+06 9.0E+05 9.0E+05 1.0E+06 9.0E+05 8.0E+05
WHITE OAK 1,200 875 850 475 650 950 525 250 1.1E+06 1.0E+06 9.0E+05 8.0E+05 8.0E+05 9.0E+05 8.0E+05 8.0E+05
YELLOW CEDAR 1200 800 800 475 625 925 525 250 1.6E+06 1.4E+06 1.4E+06 1.2E+06 1.2E+06 1.3E+06 1.2E+06 1.1E+06
YELLOW POPLAR 1,000 725 700 400 550 800 450 200 1.5E+06 1.4E+06 1.3E+06 1.2E+06 1.2E+06 1.3E+06 1.1E+06 1.1E+06

PDC TR-06-02 Rev 1 September 2008
81
Wood Panel Component Input Information Item Explanation
Response Mode • Only flexural response is considered for wood components with numerous available boundary and load conditions.
• Flexural response is based on yielding at the maximum moment regions with resistance-deflection curves as shown in Figure 6. Load-mass, stiffness, and ultimate flexural resistance values for all one-way and two-way components are based on Chapter 3 in TM 5-1300, except as stated below.
• The elastic resistances for two-way components with fixed supports are based on Table 10-5 in UFC 3-340-01. For components with adjacent fixed supports, the elastic resistance is from only the negative moment capacity acting on the yield line pattern corresponding to the ultimate resistance.
• All ultimate resistances for two-way spanning components are calculated based on TM 5-1300 with a 1.08 increase factor to account for conservative approach in TM 5-1300 where only 2/3 maximum moment capacity is assumed in corners.
Wood Density • Wood density ranges from 25 to 60 lb/ft3. The AISC Manual of Steel Construction has a range of values in Part 6 under Miscellaneous Data.
Modulus of Elasticity, E
• Wood modulus of elasticity generally ranges from 1x10⁶ psi to 2x10⁶ psi.
Dynamic Yield Strength in flexure, fy
• Input the ultimate dynamic rupture strength for wood in flexure. Typically, there is at least a 2.5 safety factor on allowable static strengths and a dynamic increase factor of 2.0 for very short term loading. Therefore, allowable static wood flexural strengths can be increased by at least a factor of 5.0. The moment capacity if based on S*fy, where S=section modulus.
Equivalent Static Reactions
• Equivalent static reactions on the Input sheet are based on Table 3-9 in TM 5-1300 using the ultimate flexural resistance. These reactions can be treated as equivalent static shear loads and compared to shear strength values. Dynamic reactions based on Dynamic Shear Factors on the Input sheet are shown on the Results sheet.
• The shear strength of wood is almost always controlled by the connections and is outside the scope of SBEDS.
All Other Items Return to top of document and link to Help on General Input and Output Items Including Blast Load
Determinate Boundary Conditions Indeterminate Boundary Conditions (Solid Curve Used for Flexure Only) (Dashed Curve is used to calculate ductility ratio)
Figure 41. Resistance-Deflection Curve For Flexural Response

PDC TR-06-02 Rev 1 September 2008
82
General SDOF Analysis Input Information Item Explanation
General Caution This form has very general SDOF input, requiring more user care than input for typical SDOF spreadsheets and computer programs that do not have all the available options on this form. Please read the following information carefully. Most typically, all rebound values are equal to inbound values with a negative sign, except stiffness and load-mass factors have the same sign. Error Messages will provide help if an error is detected on the input. Check the Error Messages both before and after Running SDOF. See the General Input and Output Items at the beginning of this document for help on general input items not specifically addressed in this table.
Initial Displacement
Input the initial displacement not caused by static conditions (i.e. when a spring is pulled and then let suddenly released). This is rarely applicable in practical blast design problems. This displacement is in addition to any displacement due to gravity effects. Note: All initial displacement is assumed to cause elastic response. The sum of the input initial displacement and any initial displacement from gravity effects should not cause any yielding.
Mass Input the total mass of the component and all supported mass that deflects with the component during dynamic response in the units shown. Note: Mass must be > 0.
Load-Mass Factors
Input the applicable Load-Mass factor for each response range 1 to 5 of the resistance-deflection relationship, as illustrated in Figure 42. Different values can be input for inbound and rebound response, although typically they will be equal. See UFC 3-340-01, Chapter 11.5 for information on calculating load-mass factors and typical values. Note: All inbound and rebound load-mass factors must be > 0.
Stiffnesses Input the applicable stiffness for each response range 1 to 5 of the resistance-deflection relationship, as illustrated in Figure 42, in the units shown. See UFC 3-340-01, Chapter 10 for information on calculating stiffnesses for typical components. Different values can be input for inbound and rebound response, although typically they will be equal. Note 1: Stiffnesses can be less than, equal, or greater than 0. Note 2: When Ki>K1_rb for i>1, the SDOF analysis may not correctly calculate rebound and calculations are always stopped at the maximum deflection. If rebound is critical, another methodology should be used to calculate response.
Rebound Flag See to Table 20 for additional information. Rebound flag = 1 for the typical case of no special rules regarding stiffness during rebound that are only applicable for components with compression membrane or brittle flexural cracking indicated by negative input stiffness values.
Resistances Input the applicable resistance for each response range 1 to 5 of the resistance-deflection relationship, as illustrated in Figure 42, in the units shown. Different values can be input for inbound and rebound response. See UFC 3-340-01, Chapter 10 for information on calculating resistances for typical components. Note: Input inbound resistances with Ri ≥ 0 and input all input rebound resistances with Ri_reb≤ 0.
Yield Displacements
Typically, SBEDS determines yield displacements from input stiffness and resistance information. However, when Ki=0 for a response range that is not part of a perfectly plastic response (i.e., when Kj>0 for j>i), the user must input the displacement at the end of the ith response range, in the units shown. For example, the user must input x4 for inbound and x4_reb for rebound in Figure 42. See the last row in “Error Messages” for any required yield displacement input. Note: Any input inbound yield displacement xi ≥ 0 and any input rebound yield displacements xi_reb≤ 0.

PDC TR-06-02 Rev 1 September 2008
83
Item Explanation Equivalent Elastic Yield (xe and xe_reb)
Input the equivalent elastic yield for full flexural yielding during inbound and rebound response, in the units shown (see Figure 43). An equivalent elastic stiffness can be input for indeterminate components. These values are used to calculate the worst case ductility ratio for inbound or rebound response. Note: xe >0 and xe_reb <0 are required input
Shortest Yield Line Distance to Determine θ
Input the distance to be used with the maximum inbound or rebound deflection to calculate the support rotation (θ), in the units shown. For one-way spanning members, this is typically one-half the span length.
Static Axial Load, P’
(Only for P-delta effects on load bearing components)
Input static axial load per unit width loaded by blast, P’, causing P-delta moment as component deflects laterally under blast load. An equivalent lateral load (wequiv) is used by SBEDS to apply a midspan moment based on (P’+PDYN)*(deflection at each time step) assuming no resisting moment at the supports, at each time step in SDOF calculations. PDYN is explained in the next row. wequiv is calculated as shown in Equation 29 and added to applied load at the next time step. It is plotted on the Results sheet. This approach does not account for P-delta moment caused by any sway deflection of the top support of the component relative to the bottom. Also, it is an approximate approach, especially for two-way spans and one-way spans with fixed boundary conditions. Do not include static axial load from roof if dynamic axial load is also input. Note: See Table 7 for comparison of equivalent lateral load method in SBEDS to theory where elastic, essentially static lateral load was input in SBEDS with axial load.
Dynamic Axial Load, PDYN
(Only for P-delta effects on load bearing components)
• No dynamic axial load is the default. In this case, there is no dynamic axial load on the component. There can still be an input static axial load.
• Dynamic axial load per unit width prompts the user to select an input text file with a dynamic reaction load from a supported roof or overhead component. The load is applied over the blast-loaded width of the analyed component. The input text file can be modified for cases where the axially loaded width is not equal to the blast loaded width as discussed in Appendix A. The input file (see Note below) has an optional first line that has the number of time-dynamic reaction pressure pairs (N) followed by N lines with time (ms), dynamic reaction pressure (psi or KPa) pairs where time and pressure are separated by a comma. Usually this input file is generated by SBEDS as described in note below. The last line of input file has -999 followed by a comma and the tributary span length, Ls of the component that applies the dynamic reaction pressure (see Equation 30). SBEDS determines PDYN as shown in Equation 30 and uses it to determine an equivalent P-delta load as shown in Equation. See Appendix A for an example of an input dynamic axial load input file. See Section 4.4 of SBEDS Methodology Manual for more discussion.
Note: The user can use the save file option on the SDOF Output sheet (NOT the save plot option) to save either the short span or long span dynamic reaction pressure history from the supported component and then read this saved file into SBEDS as a dynamic axial load input file on a supporting component.
All Other Items Return to top of document and link to Help on General Input and Output Items Including Blast Load

PDC TR-06-02 Rev 1 September 2008
84
x4_reb
3R = 4R
R1
2R
maxR
k1
k2
k3k4
k5
k1_rb
x4
k2_rb
k3_rb
Deflection
k5_rb
Res
ista
nce
= 0
0=
maxx
1_rbR
R2_rb
3_rbR = 4_rbR
max_rbR
1kk4_rb
Note: See Table 1 and Table 2 and Figure 2 and Figure 3 under “General Input Items” for more information.
Figure 42. General Resistance-Deflection Diagram Without Softening
Determinate Boundary Conditions Indeterminate Boundary Conditions (Solid Curve Used for Flexure Only) (Dashed Curve for Flexure and Tension Membrane)
Figure 43. Resistance-Deflection Curve For Flexural Response

PDC TR-06-02 Rev 1 September 2008
85
{ }
CLKW
ttPPWw
F
DYNFequiv
2
)()('
=
Δ+=
Equation 29 where: wequiv = equivalent lateral load with same spatial distribution as blast load
causing PΔ moments in component (added to applied blast load) WF = equivalent P-delta load factor K = 8 for uniformly loaded component supported top and bottom over axially
loaded span (including all 3 side supported component = 4 for component supported top and bottom with concentrated
midspan load = 2 for uniform load component supported at bottom of axially loaded span C = load factor in direction perpendicular to axially loaded span accounting
for component deflection distribution over axially loaded width C = 0.64 for all two-way spans (this is conservative in some cases) C = 1.0 for all one-way spans L = span length (span in direction causing axial load for 2-way spanning
components) P’ = total static axial load applied over blast loaded width of analyzed
component divided by the blast loaded width PDYN(t) = dynamic axial load per unit loaded width (usually the dynamic
reaction force from a supported component loaded by blast) Δ(t) = maximum component displacement at each time step
sDYN LtVtP )()( =
Equation 30 where: PDYN = dynamic reaction load per unit width of component (lb/in or N/m) V(t) = dynamic reaction pressure multiplied by a factor of 2 (except when applied
by cantilevers) as explained in Section 3.5 of the SBEDS Methodology Manual (psi or KPa)
Ls = one-half the span along the direction that applies PDYN to the support except it equals full span when loading component is a cantilever (inches or mm).Ls is typically calculated and saved to file by SBEDS when dynamic reaction pressure output is saved. (Example: Ls = 60 in for a 10 ft simply supported or fixed-simple beam. Ls = 120 in for axial load 20 ft high wall slab) Note: Ls can be modified in the saved file for cases where PDYN is applied over a width different from the blast loaded width – see Appendix A.

PDC TR-06-02 Rev 1 September 2008
86
Table 20. Rebound Flag Information Rebound
Flag Rules Used by SBEDS for Rebound Response Based on Rebound Flag
1 No special rules. Input inbound and rebound stiffnesses and resistances are used as shown in Figure 2 to calculate response.
0 Rules for stiffness applicable for components with compression membrane response are used in SBEDS. These rules cause the negative value of the input rebound resistance values and the input rebound stiffness values to be used as the inbound resistance and stiffness inbound values after the first inbound cycle. The rebound stiffness and resistance should be selected to prevent compression membrane stiffness from occurring until the deflection is less than zero during rebound. See Figure 2 and Table 2 in the Help on General Input Items section near the top of this document for more information on how SBEDS creates resistance-deflection relationships for components with compression membrane.
-1 Rules for stiffness applicable for unreinforced masonry components with arching from axial load are used in SBEDS. These rules for based on loss of all flexural stiffness and resistance after cracking (i.e., after first negative stiffness value in calculated response). See Figure 2 and Table 2 in the Help on General Input Items section near the top of this document for more information on how SBEDS creates resistance-deflection relationships for components with brittle flexural cracking.

PDC TR-06-02 Rev 1 September 2008
87
Pressure-Impulse (P-i) and Standoff-Charge Weight (R-W) Diagram Input Information
Item Explanation Creating a P-i Diagram
The user should go to the P-i Diagram sheet in the SBEDS workbook. SBEDS will create up to four Pressure-Impulse curves for the component on the Input sheet that show all blast loads in terms of positive phase peak pressure and impulse causing four input controlling deflections of the input component. These four curves are shown on one graph (i.e., P-i diagram) on the P-i Diagram sheet. Each curve is calculated based on the inputs discussed in this table by iterative running the SDOF analysis for the component on the Input sheet to determine blast loads with widely varying durations compared to the natural period of the input component that all cause this component to have the “controlling” deflection, as discussed below.
Creating R-W Diagrams
SBEDS will create up to four curves of combinations of equivalent TNT charge weight (W) and standoff distance (R) that cause each pressure-impulse point on P-i diagrams for four input controlling deflections of the input component. These four curves are shown on one graph (i.e., R-W diagram) on the P-i Diagram sheet in the SBEDS workbook. Each curve is calculated based on the inputs discussed in this table by iterative running the SDOF analysis to determine blast loads with widely varying durations compared to the natural period of the input component that all cause this component to have the “controlling” deflection, as discussed below.
Component Input All P-i or R-W curves are calculated for the component defined on the Input sheet in the SBEDS workbook. The user should input all required values for the component of interest on the Input sheet and then go to the P-i Diagram sheet in the SBEDS workbook. It is not necessary to RUN SDOF for the input component first, but this will allow to user to verify that SBEDS does not see any errors in the component input, which would be promulgated into any P-i or R-W diagram calculations.
Input Criteria for P-i or R-W Curves
• Input ductility ratios defining each of up to four P-i or R-W curves. These ductility ratios will be multiplied by the Equivalent Elastic Displacement (xE) on the Input sheet to determine the Controlling Deflections based on ductility ratio.
• Input support rotations (θ) defining each of the four P-i or R-W curves. The Controlling Deflections based on support rotations are calculated using the definition for θ in Figure 44 and the Shortest Yield Line Distance for Determining θ in the Results Section on the Input sheet. This distance equals half the span for a simply supported beam and it is based on the yield line pattern for two-way spanning components.
• The lower of the Controlling Deflections based on support rotations or ductility ratio are the controlling maximum dynamic deflections used to create the P-i or R-W curves and are shown in the table.
• Either a ductility ratio, a support rotation, or both values must be input in a row of the table for each P-i or R-W curve that will be generated beginning with the first row. At least the first row must have an input ductility ratio or support rotation.
Analysis Type • Select the appropriate option to generate a P-i diagram or R-W diagram. • An R-W diagram can be generated for either side-on or fully reflected
blast loading. Effects such as clearing or angle of incidence of reflected blast loads are not considered. The user can input a maximum charge weight to be displayed on the R-W diagrams after selecting one of the R-W analysis types on the drop-down menu.
• If an R-W diagram option is selected, SBEDS will create an optional

PDC TR-06-02 Rev 1 September 2008
88
Item Explanation input cell in F17 on the P-i_diagram sheet for the maximum charge weight of interest to include in the R-W plot. The default value is 500000 lb or 250000 kg. The R-W diagram will plot more quickly if a lower charge weight is entered in cell F17. A larger charge weight can also be entered.
Load Type for Response Diagram
• Select the appropriate load type option to either include or ignore the negative phase of blast loads used to generate the P-i diagram or R-W diagram. The negative phase blast load tends to increase the amount of positive phase blast load and decrease the scaled standoff (i.e., R/W0.33) required to cause the controlling deflections for cases where component response time to peak deflection is less than the total blast load duration, which is typical of high explosive loads.
• Positive phase load only causes the P-i diagram to be calculated using a right triangular shaped blast load, where the blast load is calculated solely from peak pressure and blast load duration combinations. This option causes a R-W diagram to be calculated with only positive phase blast load that decays exponentially from peak pressure to zero pressure.
• Include negative phase causes the P-i diagram or R-W diagram to be calculated using blast loads calculated from charge weight-standoff combinations that have an exponential decay shape in the positive phase and a non-linear shape for the negative phase as shown in Figure 4. See first bullet below under Error Messages for one exception.
Time step The P-i and R-W diagrams are calculated with iterative SDOF analyses that initially use the smaller of the input or recommended time step on the Input Worksheet. The time step is increased if necessary to calculate response out to the time of maximum deflection. If the resistance vs. deflection diagram for the input component (see plot to the right on the Input Worksheet) has sharp change in slope, such as from positive to negative slope, it may be necessary to input a smaller time step than the recommended value. For these cases, it is recommended that the user check several of the points on the P-i or R-W diagram by running the blast load defined by the point as a SDOF analysis on the Input Worksheet.
Save Plotted Data to DPLOT File
This option saves the positive phase peak pressure and impulse values causing each point on each P-i or the charge weight and standoff for each point on a R-W curve to a user-named file that can be read with the DPLOT computer program. Use Option A in the DPLOT program file read menu to read the saved file.
Error Messages • R-W diagrams will be stopped if the scaled standoff, Z, is > 100 ft/lb1/3.The methods used to calculate charge weight-standoff blast loads in SBEDS are not accurate at higher Z. However, P-i diagram calculations will continue, where the blast load is calculated solely from peak pressure and duration combinations with a right triangular shape. In most cases the effect of the negative phase load is minimal at Z >100 ft/lb1/3 and no “kink” will occur in the P-i diagram due to change in blast load calculations.
• The user is cautioned when “Large Time Step/Load Duration” occurs in P-i or R-W diagram calculations. This means that the time step used to calculate the controlling deflection is more than 10% of the equivalent triangular positive load duration for a given point on a given P-i or R-W diagram. This is not always a problem, but it may explain why some points do not fit in a smooth pattern with other calculated points. This

PDC TR-06-02 Rev 1 September 2008
89
Item Explanation usually occurs because the larger time step is needed to calculate response out to the maximum deflection in the SDOF calculations used to determine the P-i or R-W diagram. See Cell R69 on the P-i Diagram sheet for more detailed information on the points with Large Time Step/Load Duration.
• The user is cautioned when “Peak Deflection not Attained for some points in P-i or R-W diagram calculations”. This means that there were not sufficient time steps to reach the controlling deflection in the SDOF calculations used to determine a given point on a given P-i or R-W diagram. This is not always a problem since the deflection vs. time curve is often relatively flat near the peak deflection and the calculated deflection may be very near the peak value. However, this caution may explain why some points do not fit in a smooth pattern with other calculated points. See Cell R69 on the P-i Diagram sheet for more detailed information on the points without calculated Peak Deflection.
Figure 44. Support Rotation Angle

PDC TR-06-02 Rev 1 September 2008
90
Appendix A
Input Files for Pressure-Time History or Dynamic Axial Load Read by SBEDS

PDC TR-06-02 Rev 1 September 2008
91
Example of Input File for Pressure-Time History or Dynamic Axial Load 230 ‘Note: This is the total number of time, pressure pairs in file (it is optional) 0,0.88 ‘Note: This is the first time, pressure pair that is read into SBEDS 0.08,0.874659123628217 0.16,0.87269411842335 0.24,0.874072094055453 0.32,0.878756512908458 0.4,0.886707230076135 0.48,0.897880537293551 0.56,0.912229210755961 0.64,0.929702562772818 0.72,0.950246497200393 0.8,0.973803568592397 0.88,1.00031304500391 0.96,1.02971097438 1.04,1.06193025445634 1.12,1.09690070609563 1.2,1.13454914997946 1.28,1.1747994865719 1.36,1.21757277926751 continue with additional lines of time, pressure with time in units of ms and pressure in units of psi or KPa to match current units on Input sheet. Note that the pressures can be a blast load pressure or a dynamic shear pressure. 18.23,-7.55E-02 18.31,5.38E-02 ‘Note: this is line 230 -999,120 ‘Note: this final line has -999, Ls. It is only needed for a dynamic axial load file. Ls (inches or mm) equals 120 for the example above. It is the span of the component area contributing to the dynamic reaction force PDYN –see Equation 4 for more information on Ls. Ls is not used if file is read in as a pressure-time history.
See next page for more information.
PDC TR-06-02 Rev 1 September 2008
92
Information on SBEDS Input Files for Pressure-Time History and Dynamic Axial Load The user can create a pressure-history load or a dynamic axial load input file to be read into SBEDS in four ways. 1) The user can save a DPLOT file as an ASCII file that can be read in as a pressure-history load. The
last line with -999,Ls can be added to this file and it can be read in as a dynamic axial load input file. 2) The user can use the save file option on the SDOF Output sheet (NOT the save plot option) to save
either the short span or long span dynamic reaction pressure history from the supported component and then read this saved file into SBEDS as a pressure-history load or a dynamic axial load input file on a supporting component. This saved file includes all the time, dynamic reaction pressure pairs and the last line with Ls. If it is read as a pressure-history load, the line with Ls is ignored by SBEDS. The saved dynamic reaction pressures are increased by a of 2 as described in Section 3.5 of the SBEDS Methodology Manual.
3) When a saved file is read into SBEDS as a dynamic axial load per unit width, SBEDS multiplies the dynamic shear pressures on each line of the saved file by Ls from the last line of the file to create dynamic axial loads per unit width that are used in SBEDS. This dynamic axial load only acts over a user input width of an analyzed beam-column type component. However, it is assumed to act over the same width as the blast load for all wall components. If this is not true for a wall component, the user can edit the saved file (before reading it into SBEDS as a dynamic axial load) by multiplying Ls by an appropriate factor that will cause the correct amount of dynamic axial load (i.e., multiply Ls by 0.5 if only one-half the blast-loaded width of the wall component is subject to the dynamic axial load) and resaving the file. Note that this is an approximate approach that is not validated with high fidelity dynamic analyses or test data.
4) The user can create an electronic file for use as a pressure-time history or dynamic axial load in SBEDS in the format shown in this appendix and save it as a text file. If it has a filename of the form *.dat, then SBEDS will automatically display the file if the user browses the applicable directory during the prompt from SBEDS to read an input file.

PDC TR-06-02 Rev 1 September 2008
93
DISTRIBUTION STATEMENT A: Approved for Public Release; Distribution is unlimited.