User's Guide for the HF Broadcast Antenna Design and Validation Summary Programs · Design and...
112
NTIA Report 87·220 User's Guide for the HF Broadcast Antenna Design and Validation Summary Programs Eldon J. Haakinson Susan L. Rothschild John R. Godwin u.s. DEPARTMENT OF COMMERCE Malcolm Baldrige, Secretary Alfred C. Sikes, Assistant Secretary for Communications and Information July 1987
Transcript of User's Guide for the HF Broadcast Antenna Design and Validation Summary Programs · Design and...

NTIA Report 87·220
User's Guide for the HF Broadcast AntennaDesign and Validation Summary Programs
Eldon J. HaakinsonSusan L. Rothschild
John R. Godwin
u.s. DEPARTMENT OF COMMERCEMalcolm Baldrige, Secretary
Alfred C. Sikes, Assistant Secretaryfor Communications and Information
July 1987


CONTENTSPage
L1ST OF FIGURES v
ABSTRACT 1
1- INTRODUCTION 1
2. DATA PREPARATION FOR PROGRAM VALSUM 5
2.1 General 52.2 Program SKYVOA 5
2.2.1 General 52.2.2 Menu 62.2.3 Input Data Questions 62.2.4 Transmitter Site Name 72.2.5 Power 72.2.6 Main Beam Direction 82.2.7 Antenna Name 82.2.8 Antenna Configurations 92.2.9 AM and PM Time Blocks 102.2.10 Broadcast Language 102.2.11 Language Area 112.2.12 Sector 112.2.13 Test Poi nt Li st 122.2.14 Summary and Process 13
2.3 Program IONCAP 15
2.3.1 Modifications to IONCAP 152.3.2 IONCAP Input Data 152.3.3 IONCAP Output Data 15
2.4 Program VALDPR 16
2.4.1 Function 162.4.2 Program VALDPR's Input Data Format 162.4.3 Program VALDPR Source Code 20
2.5 VAL SUM Data Fil es 21
3. VALSUM PROGRAM INSTRUCTIONS 23
3.1 General 233.2 VALSUM Data Set Name 233.3 Menu 243.4 Input Data Questions 24
3.4.1 Transmitter Site Name 243.4.2 Language Area 253.4.3 Transmitter Antenna Number 253.4.4 Circuit Selection Option 26
iii

CONTENTS (continued)Page
3.5 Summary and Process
4. DESCRIPTION OF VALSUM OUTPUT
4.1 Circuit Data4.2 Required Power Gain Table4.3 Best Frequency For All Time Blocks4.4 Circuits Havi ng Hi ghest Required Gain4.5 Summary of Highest Required Gains4.6 Distribution of Most Probable Modes4.7 Occurrences of Frequency/Takeoff Angle4.8 Spill-Over Region4.9 Supplemental Plots and Tables
5. CONCLUSIONS
6. REFERENCES
7. ACKNOWLEDGMENTS
APPENDIX A. EXAMPLE DIALOG BETWEEN PROGRAM SKYVOA AND A USER
APPENDIX B. SOURCE CODE FOR AN EXAMPLE PROGRAM TO CREATE ANIONCAP ANTENNA FILE
APPENDIX C. SOURCE CODE FOR ONE POSSIBLE IMPLEMENTATION OFPROGRAM VALDPR
APPENDIX D. EXAMPLE DIALOG BETWEEN PROGRAM VALSUM AND A USER
75
26262728283030313132323333
33
34
343539394041414343
44
44
44
45
55
99
LanguageSectorTest Point ListSpill-Over RegionRequired Power Gain CutsTime Block OutputTime Block ListTransmi tter Frequency ListNumber of Transmitter Frequenci esSupplemental Plots and TablesVALSUM IdentificationSunspot NumbersMonths
3.4 .53.4.63.4.73.4.83.4.93.4.103.4.113.4.123.4.133.4 .143.4.153.4.163.4.17
iv

Figure
LIST OF FIGURES
Page
1. Curtain array with conducting screen (2 bays, 4 stacks). 3
2. Interrelation between the HF antenna design and validation 4programs.
3. An example input data set for program IONCAP as created by 14program SKYVOA.
4. An example dataset for program PATTRN as created by program 15SKYVOA.
5. An example of the index file VALIND, which contains the list of 17available data bases for VALSUM.
6. Receiver antenna pattern which is used for all receivers. 18
7. Sample of transmitter antenna pattern which depends upon 19transmitter antenna characteristics and transmitter-receviergeometry.
8. An example of program IONCAP Method 20 output, the HF circuit 20predict ions.
9. An example of the language file used by program VALSUM. 21
10. An example of the data base INDEX file used by program VALSUM. 22
11. An example circuit output table for program VALSUM Cut 5. 35
12. An example required power gain and elevation angle table 36for all time blocks for program VALSUM.
13. An example required power gain and elevation angle table 38for an individual time block from program VALSUM.
14. An example best frequency table from program VALSUM. 39
15. An example circuits with highest required gain table from 40program VALSUM.
16. An example highest required gain summary table from program 40VALSUM.
17. An example of most probable modes table from program VALSUM. 41
18. An example of frequency/takeoff angle table from program 42VAL SUM.
19. An example azimuth angle vs. takeoff angle plot from program 43VALSUM.
v


User's Guide for the HF Broadcast Antenna Design andValidation Summary Programs
Eldon J. Haakinson, Susan L. Rothschild, and John R. Godwin*
A series of programs have been developed by the Institute forTelecommunication Sciences (ITS) that assist the Voice of America (VOA) toplan and operate high frequency (HF) broadcast stations. The VOA hasspecific broadcast bands available for use and has particular receptionareas to cover. Because of the long distances between the broadcasttransmitter and the reception areas, the primary mode of communication isvi a HF skywave. Since the ionosphere, whi ch supports HF sky wave, haselectrical characteristics that vary with time of day, season of the year,frequency, and sunspot number, the HF broadcast antenna d~sign andvalidation summary programs must calculate the best frequency and therequired antenna power gain and pattern for the various conditions thatapply to a particular broadcast scenario. This document will guide a userthrough the use of the programs, provide samples of the input to eachprogram, and give examples of each program's output.
Key words: curtain array antennas; HF broadcast; ionospheric propagation
1. INTRODUCTION
An international, high frequency (HF) broadcast facility has the function
of delivering a specified signal strength with a certain reliability to
particular reception areas on a prescribed broadcast schedule. Because of the
di stances from the faci 1i ty to the reception areas, the primary mode of
transmission is HF sky wave via the ionosphere. Two conditions preclude the
use of a single, fixed antenna at the facility: 1) the ionospheric
propagation path undergoes diurnal, seasonal, and sunspot cycle change,s, and
2) the reception area changes throughout the day depending upon the.broadcast ,
schedule. In order to steer the antenna beam in el evation angle to use the
most efficient ionospheric propagation mode and to steer the beam in azimuth
angle to cover the desired reception area, modern HF broadcast facilities
utilize planar arrays of dipoles with electronic beam steering. By
controlling the gain and phase of each dipole element of the array, the
antenna's main beam can be steered.in both elevation and azimuth and the beam
can be shaped to cover the reception area.
*The authors are with the Institute for Telecommunication Sciences, N~tional
Telecommuni cations and I nformat; on Admi ni strati on, U.S. Department ofCommerce, Boulder, CO 80303.
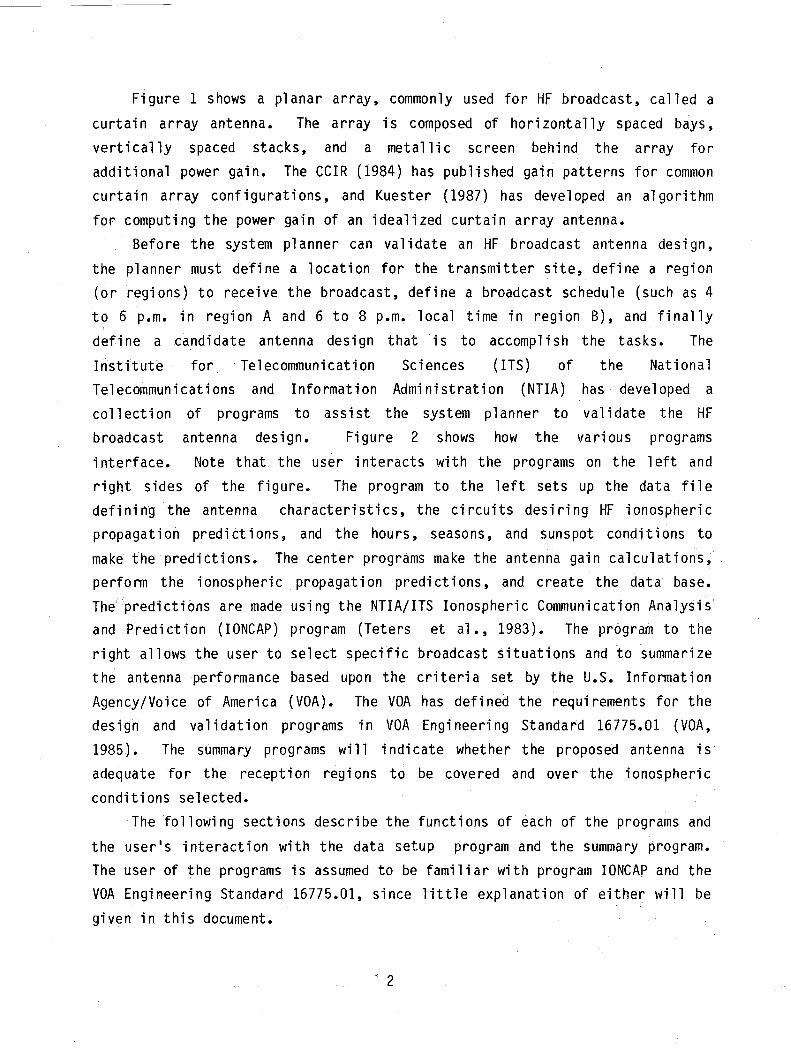
Figure 1 shows a planar array, commonly used for HF broadcast, called a
curtain array antenna. The array is composed of horizontally spaced bays,
vertically spaced stacks, and a metallic screen behind the array for
additional power gain. The CCIR (1984) has published gain patterns for common
curtain array configurations, and Kuester (1987) has developed an algorithm
for computing the power gain of an idealized curtain array antenna.
Before the system planner can validate an HF broadcast antenna design,
the planner must define a location for the transmitter site, define a region
(or regions) to receive the broadcast, define a broadcast schedule (such as 4
to 6 p.m. in region A and 6 to 8 p.m. local time in region B), and finally
define a candidate antenna design that is to accomplish the tasks. The
Institute for Telecommunication Sciences (ITS) of the National
Telecommunications and Information Administration (NTIA) has developed a
collection of programs to assist the system planner to validate the HF
broadcast antenna design. Figure 2 shows how the various programs
interface. Note that the user interacts with the programs on the 1eft and
right sides of the figure. The program to the left sets up the data file
defining the antenna characteristics, the circuits desiring HF ionospheric
propagation predictions, and the hours, seasons, and sunspot conditions to
make the predictions. The center programs make the antenna gain calculatinns,
perform the ionospheric propagation predictions, and create the data base.
The'predictions are made using the NTIA/ITS Ionospheric Communication Analysis
and Prediction (lONCAP) program (Teters et al., 1983). The program to the
right allows the user to select specific broadcast situations and to summarize
the antenna performance based upon the criteria set by the U.S. Information
Agency/Voice of America (VOA). The VOA has defined the requirements for the
design and validation programs in VOA Engineering Standard 16775.01 (VOA,
1985). The summary programs wi 11 i ndi cate whether the proposed antenna is
adequate for the reception regions to be covered and over the ionospheric
conditions selected.
The following sectinns describe the functions of each of the programs and
the user lsi nteract i on with the data setup program and the summary program.
The user of the programs is assumed to be familiar with program IONCAP and the
VOA Engineering Standard 16775.01, since little explanation of either will be
given in this document.
< 2
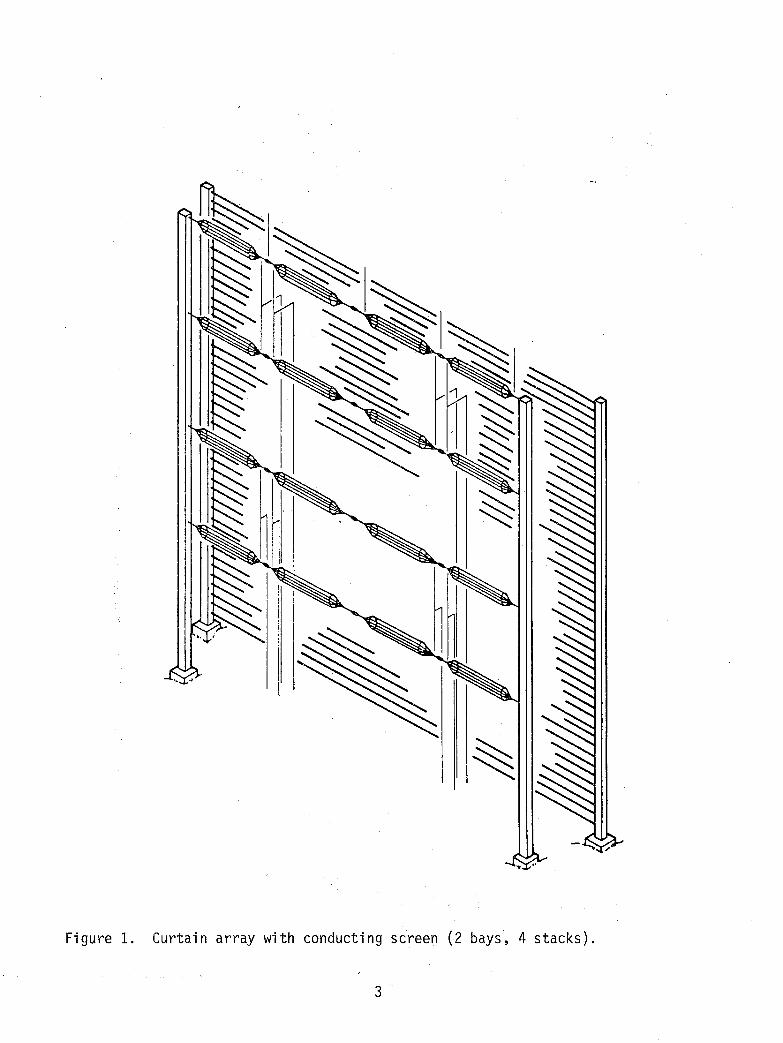
Figure 1. Curtain array with conducting screen (2 bays, 4 stacks).
3
IONCAP and Curtai n Array Ionospheric IONCAP Validation
Antenna AntennaGai n COOlmun i cat ions Output Summary
Pattern Design Pattern Generator f- An a1ys i sand Processor (VALSUM)
Genera tor Data (PATTRN) Program Predi ction (V ALDPR) Program
Setup (SKYVOA) (IONCAP) Program
Program Program~
Input data file preparation Ionos phe ri c
circui t
predi ct ions
Data Base
creation
Text parameter
selection and
corres po ndi ng
performance
results
Figure 2. Interrelation between the HF antenna design and validation programs.

2. DATA PREPARATION FOR PROGRAM VALSUM
2.1 General
Programs SKYVOA, PATTRN, IONCAP, and VALDPR (see Figure 2) must be
executed before VALSUM can be run. Using the data supplied by the user as
defined in Section 3.2 Analysis Input Parameters of VOA (1985) Standard
16675.01, IONCAP will produce the desired output tables for the specified
ci rcuits. These output data must be further culled by VALDPR to retain those
parameters needed by VALSUM and to create the data base VALSUM uses to produce
the summaries.
This portion of the report will give guidelines for the setup and
operation of IONCAP, and to the function of VALDPR. Since VALDPR's input and
output are machine dependent, this report shows an example of VALDPR's
implementation with the warning to the user that other schemes may have to be
used with other machines.
Because of th~ir length, the source code listings for programs SKYVOA and
VALSUM are not included in this document. Requests for the source code should
be made to the Voice of America.
2.2 Program SKYVOA
2.2.1 General
The data and control information for program IONCAP must be created by
program SKYVOA. SKYVOA is an interactive program that allows the user to
select various parameters used for IONCAP input and the antenna parameters
used. to create the antenna pattern. The user .wi 11 be prompted for all the
inputs necessary to run IONCAP. SKYVOA then creates an input file for IONCAP
in the format descri bed in VOA (1985) Standard 16775.02 whi ch contai ns the
IONCAP User's Manual (Teters, et al., 1983). It also creates a data file for
Program PATTRN, the antenna pattern generator.
The IONCAP runs make use of the antenna patterns created by the antenna
pattern generator prior to the execution of IONCAP. If the validation level
isO (the boresight bearing is set to point the antenna main beam directly at
the receiver), there is only one antenna pattern used for each transmitter
site. If the validation level is 1 (the boresight bearing is selected by the
user and off-boresight azimuth to each receiver is calculated), the antenna
pattern generator creates a di fferent antenna pattern for each transmitter
receiver combination. In this case, there must be antenna information
associated with each circuit.5

The program wi 11 start after the user properly logs on to the system and
types SKYVOA. An example of the dialog between the user and the program is
given in Appendix A. The following sections describe the various parts of the
di alog with the text that the program pri nts at the begi nni ng of each sect ion
followed by an explanation.
2.2.2 Menu
Program Prints:
Choose from the menu:V = Verbose dialogC = Concise dialogE = Edit dataS = Summary of dataP = Process last data set enteredQ = Quit
Menu (Verbose)?
Explanation:
The user is presented with a menu that allows for either verbose or
concise dialog screen presentations for entering the data. Another item on
the menu is an lI edit data ll mode whi ch all ows the user to return to a user
specified question number and to change the appropriate values. The II s'ummary
of data ll option provides a list of all the input questions and the user
responses. The IIprocess 1ast data set entered ll permits the user to executethe data stream that has been entered, reviewed, or edited. The II quit ll option
all ows the user to exit from the SKYVOA program.
To return to the menu from any question, the user should type two colons,
"e 'II •• II. ., ...
2.2.3 Input Data Que~tions
Se1ect i ng either CONCISE or VERBOSE from the menu se1 ect ion causes the
program to begi n as ki ng the user for responses to the input data quest ions.
In this manual, the IIverbose ll mode contains the text following the IIprogram
prints ll statement up to and including the line with the question numberfollowed by text. When the user selects the IIconcisell mode, only the question
number followed by text is printed. If the user is runni'ng the concise mode
and wishes a verbose explanation, he can type II??" and the verbose explanation
will be printed. The following parameters require values selected by the user
in order to carry out the calculations and produce the output tables andplots.
6

2.2.4 Transmitter Site Name
Program Prints:Transmitter site name
TNGR = TangierUDRN = UdornPTRC = Puerto RicoCRSN = Sri LankaBOTS = Botswana
1) Tranmitter site name (TNGR)?
Type site lat (followed by carriage return) and site lon (return) for each ofthe sites. Enter the reference site location first.
Limits are - ON <= lat <= 90NOS <= lat <= 90SOW <= lon <= 180WOE <= lon <= 180E
The default hemispheres are Nand E. The Sand W locations can bespecified by adding an S to the latitude value or adding a W to thelongitude value.Inputs of the form X,Y,Z, imply degrees, minutes and seconds."Inputs of the form X.Y imply decimal degrees.
1) Transmitter site lat (43.0000 deg Nor 43 0 0 dms N)?1) Transmitter site lon (26.0000 deg E or 26 0 0 dms E)?
Explanation:
, Transmitter . site names are permitted to have four ill pha-numeri ccharacters.. These characters will be entered on the label card image ofIONCAP. SKYVOA searches a file for the coordinates of the transmitter site.If the coordinates are found, they will be displayed on the screen; otherwise,the user is asked to input the transmitter site latitude and longitude.
Note that for this and all other questions, a default value is entered inparentheses for each question. By typing a carriage return to the question,
the program understands that the default value is to be used as the responseto the question. Otherwise, the user enters the desired value and a carriagereturn.
2.2.5 Power
Program Pri nts:Power delivered to transmitting antenna (between .10 and 1000.0 kW)2) Power delivered to transmitting antenna ( 1.00 kW)?
7

Explanation:
Power delivered to the transmitting antenna is the radio frequency power
applied to the input terminals of the transmitting antenna in kilowatts.
2.2.6 Main Beam Direction
Program Prints:
Main beam direction toward receiverY = YesN = No
3) Main beam direction toward receiver (Yes)? NBearing from reference site.Enter in degrees clockwise from north,i.e. north = 0, east = 90, south = 180, west = 270.Answer can be in decimal degrees (X.Y) or in deg., min., sec.(X,Y,Z), and must be between 0.0 and 360.0 degrees
4) Bearing ( 0.0 deg)?
Explanation:
If the main beam di rectionis toward the receiver, the bearing is set to
0.0 and the validation level is set to O. This means that PATTRN will
cal cul ate one vertical cut transmi tter antenna pattern that wi 11 be used for
all of the circuits. If the main beam is not toward the receiver, the user is
asked for the bearing and the validation level is 1. IONCAP will then use a
different vert i cal cut antenna. pattern for each circuit as cal cul atedby
PATTRN for the bearing between the transmitter and the ci rcuit.
2.2.7 Antenna Name
Program Prints:
Antenna name (up to 8 characters)5) Antenna name (BOTS111)?
Explanation:
The antenna name is the user's identification of the antenna data base.
Associ ated with each antenna name wi 11 be a transmi tter site 1atitude and
longitude, language, validation level, antenna bearing, and antenna
configuration. This information will be displayed for the user in VALSUM when
the user is asked to choose an antenna from the available IONCAP datq (VALSUMquestion 3).
8

2.2.8 Antenna Configurations
Program Prints:Antenna configurations:
L = List current set of antenna configurationsD = Delete an antenna configurationA = Add an antenna configurationC = Change an antenna configuraionN = No change
10) Antenna configuration (Add)?
Up to 12 frequencies (between 6 and 26 MHz)(A carriage return exits this mode)
Frequency band (6.1)?
Number of horizontal bays (1 to 14)Number of bays (4)?
Curtai nMode123456789
10111213
excitat ion
+000+000+++0+0+0+++-0+00+++++++-++--Curtain excitation ( I)?
Horizontal slew angle from the normal to the arrayThe 15 slew angles are:
-30 30-25 25-21 21-17 17-13 13- 9 9- 5 5
oHorizontal slew angle ( O)?
Frequency at which the antenna is designed between 8.00 and 20.00 MHzAntenna design frequency (8.75 MHz)?
He,; ght above ground of lowest stack (1.00 to 100.0 m)One-half wavelength stack height above ground at 8.75 MHz is 17.13 meters
Lowest stack height above ground (17.13 m)?10) Antenna configuration (Add)?
, 9

Explanation:
An antenna configurati on consi sts of the antenna I s frequency, number ofhorizontal bays, curtain excitation mode, horizontal slew angle, antennadesign frequency, and height above ground of lowest stack. The user may enter
one antenna configuration for each frequency with a maximum of 12 frequencies.
Each frequency may be used for only one antenna configuration. Definitions ofthe antenna parameters and details on the antenna pattern calculations aredescribed in the report by Kuester (1987).
2.2.9 AM and PM Time BlocksProgram Prints:
AM time of day to begin analysis and predictions(between 0100 and 2400 hours UT)11) AM start time (0100)?
AM time of day to end analysis and predictions(between 0100 and 2400 hours UT)12) AM end time (1200)?
PM time of day to begin analysis and predictions(between 0100 and 2400 hours UT)13) PM start time (1300)?
PM time of day to end analysis and predictions(between 0100 and 2400 hours UT)14) PM end time (2400)?
Explanation:The user must input two time blocks, one AM and one PM, of the daily
broadcast schedule. In the example, 10NCAP will be run for the hours 04, 05,06, 07, 16, 17, 18, 19, and 20. The data associated with these hours will beused to fi nd one best frequency usi ng the appropri ate al gorithms. VALSUM iscurrently set so that only one broadcast schedule of daily time blocks can beimplemented for the entire month and sunspot number sequence.
2.2.10 Broadcast LanguageProgram Prints:
Broadcast languageThe first four characters of the language are entered; for example,POll = PolishENGL = English
21) Language (POLl)?10

Explanation:
The fi rst four characters of a 1anguage fi 1e must be entered. SKYVOAwi 11 search the named 1anguage file for test poi nts that are candi dates forcircuits to be processed by IONCAP. The following parameters will cull thelist of test points in the language file.
2.2.11 Language Area
Program Prints:Language .area under whi ch to categori ze data base (four characters). ex. ENG2 = English to Africa22) Language Area (TEST)?
Explanation:When running VALSUM, the user will be asked for the language category and
will be given a list of all the available data bases for that category. Theuser will then be able to select the data base to be used in VALSUM.
2.2.12 SectorProgram Prints:
Sector beginning bearing (0.0 to 360.0 deg)23) Sector beginning bearing (30.0 deg)?
Sector ending bearing (0.0 to 360.0 deg)24) Sector ending bearing (50.0 deg)?
Sector beginning range (0.0 to 10000.0 km)25) Sector beginning range (1000.0 km)?
Sector ending range (1001.0 to 12000.0 km)26) Sector ending range (5000.0 km)?
Explanation:The user must select the area for which. the test point IDs are to be
included.· SKYVOA then searches the language file and keeps any test point IDswhich are in the sector.
'11
Type site latof the sites.
Limits
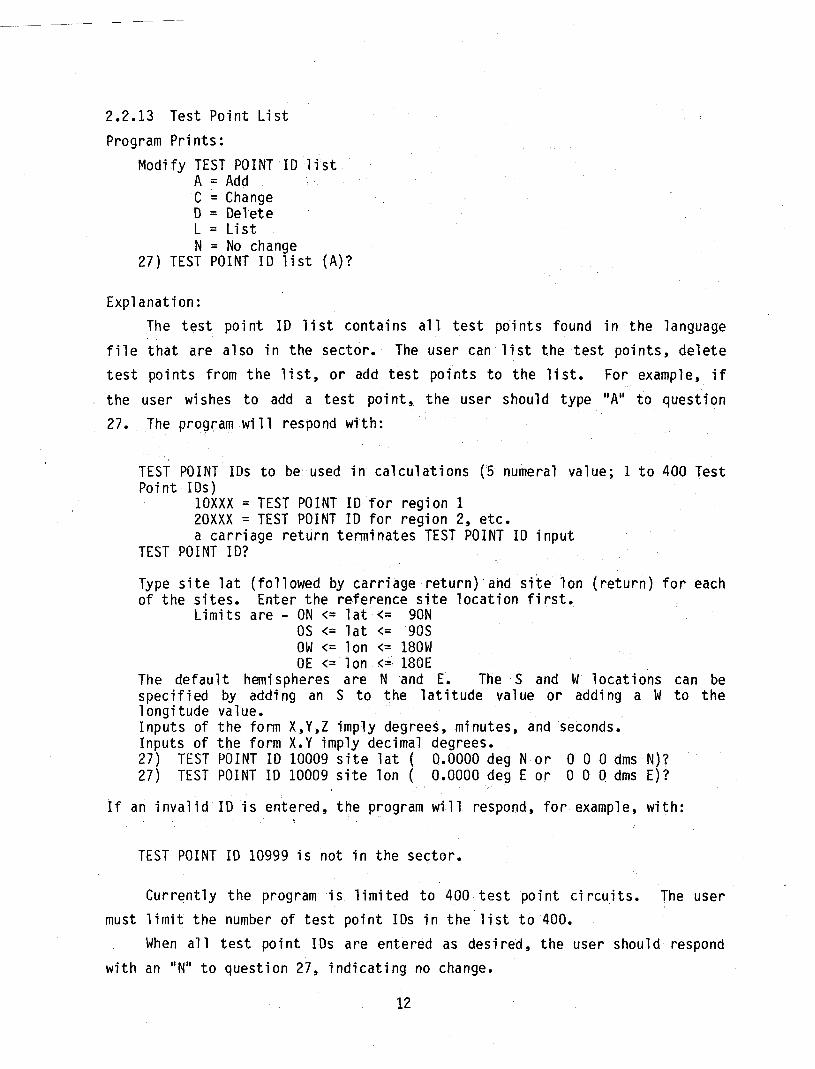
2.2.13 Test Point ListProgram Prints:
Modify TEST POINT 10 listA = AddC = Changeo = OeleteL = ListN = No change
27) TEST POINT 10 list (A)?
Explanation:The test po.int 10 list contains all test points found in the language
file that are also in the sector. The user can list the test points, deletetest points from the list, or add test points to the list. For example, ifthe user wishes to add a test point, the user should type II A" to question27. The program wi 11 respond with:
TEST POINT IDs to be used in calculations (5 numeral value; 1 to 400 T~st
Point IDs)10XXX = TEST POINT 10 for region 120XXX = TEST POINT 10 for region 2, etc.a carriage return terminates TEST POINT 10 input
TEST POINT IO?
(followed by carriage return) and site lon (return) for eachEnter the reference site location first.
are - ON <= lat <= 90Nas <= lat <= 90SOW <= lon <= 180WDE <= lon <= 180E
The default hemispheres are Nand E. The Sand W locations can bespecified by adding an S to the latitude value or adding a W to thelongitude value.Inputs of the form X,Y,Z imply degrees, minutes, and seconds.Inputs of the form X.Y imply decimal degrees.27) TEST POINT 10 10009 site lat ( 0.0000 deg N or 0 a 0 dms N)27) TEST POINT 10 10009 site lon ( 0.0000 deg E or 0 0 0 dms E)
If an invalid 10 is entered, the program will respond, for example, with:
TEST POINT 10 10999 is not in the sector.
Currently the program is limited to 400 test point ci rcuits. The usermust limit the number of test point IDs in the list to 400.
When all test point IDs are entered as desired, the user should respondwith an "Nil to question 27, indicating no change.
12
2.2.14 Summary and Process
Program Prints:
Do you want a summary of the input data (Y or N)?Do you want to process this data (Y or N)?
Explanation:
The user may elect to print a summary of all the parameters and values
chosen. In the summary, each parameter has a question number associated with
it and the value sel ected. After revi ewi ng the summary, the user can return
to the menu, select EDIT, and modify parameters by entering the question
numbers of the parameters to. be changed.
After the summary question, the user is asked if the data set is to be
processed. If "yes", the data are processed and the user is returned to the
menu. The "processed data" are a set of input data that programs lONCAP and·
PATTRN use, as described in the next section. Figure 3 shows the input data
set (card images) for program IONCAP and Figure 4 shows the input data set for·
program PATTRN.
13
DATE COMPUTER BOULDER CYBER 840TRANSMIT LOCATION MIDB LATITUDE 30.83000 LONGITUDE 35.27000ANTENNA ID VALTEST VALIDATION 1 BEARING 334.9 DEG NO CONF 5ANTENNA FRQ 610 BAYS 4 EXCT 10 SLEW 0 DSGN FRQ 875 STKH 1713ANTENNA fRQ 970 BAYS 4 EXCT 4 SLEW 0 DSGN FRQ 875 STKH 1713ANTENNA FRQ 1370 BAYS 4 EXCT 10 SLEW . 0 DSGN FRQ 1900 STKH 789ANTENNA FRQ1772 BAYS 4 EXCT 4 SLEW 0 DSGN FRQ 1900 STKH 789ANTENNA FRQ 2588 BAYS 4 EXCT 1 SLEW 0 DSGN FRQ 1900 STKH 789STARTHRAM 1ENDHRAM 5STARTHRPM 14 ENDHRPM21LANGUAGE MIDBSECTOR BEARING 334.9 - 7.8 DEG DIST 1524.7 - 2427.0 KM
152 181 18
-1
2250E
2500E
2300E
10
4880N
4800N
4900N
1
71
1
41
21
18
18
3527E1818
1
1
14
MIDBI03463083N 3527E
1 18
MIDB100143083N 3527E
1 18
20 1354.0 145. .10 90.73.00 3.00 .10
1.0 1.0 1.0 0.06.10 9.7013.7017.7225.8810.0120.01986 1
1 5
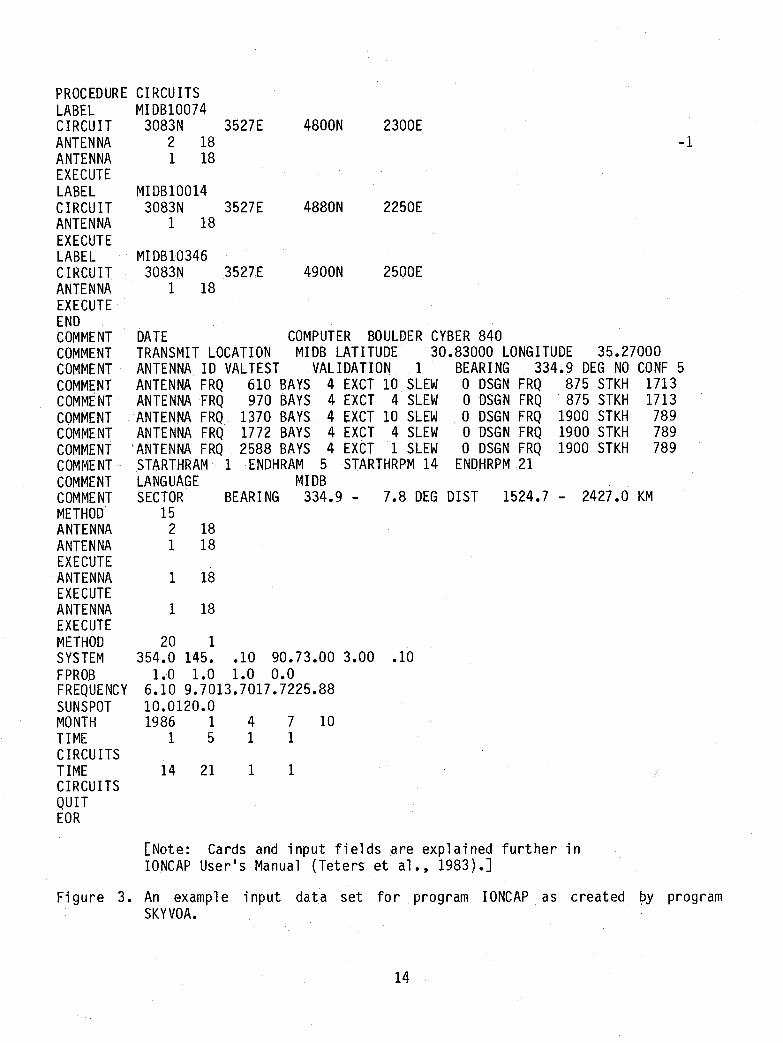
PROCEDURE CIRCUITSLABEL MIDB10074CIRCUIT 3083NANTENNA 2ANTENNA 1EXECUTELABELCIRCUITANTENNAEXECUTELABELCIRCUITANTENNAEXECUTEENDCOMMENTCOMMENTCOMMENTCOMMENTCOMMENTCOMMENTCOMMENTCOMMENTCOMMENTCOMMENTCOMMENTMETHODANTENNAANTENNAEXECUTEANTENNAEXECUTEANTENNAEXECUTEMETHODSYSTEMFPROBFREQUENCYSUNSPOTMONTHTIMECIRCUITSTIMECIRCUITSQUITEOR
[Note: Cards and input fields are explained further inIONCAP User's Manual {Teterset al q 1983).J
Figure 3. An example input data set for program IONCAP as created by programSKYVOA.
14

30.83610 4970 4
1370 41772 42588 4
48.0048.8049.00
EOR
35.27104
1041
23.0022.5025.00
5 28 1 334.9o 875 1713o 875 1713o 1900 789o 1900 789o 1900 789
Figure 4. An example data set for program PATTRN as created by program SKYVOA.
2.3 Program IONCAP
2.3.1 Modifications to IONCAPIONCAP writes its output to a fi 1e that inmost cases is assumed to be
the line printer file. That file must be saved (on magnetic tape or as a diskfile) for processing by VALDPR. The preservation of the file can becontrolled by the site job control structure.
A second consideration is the calculation by IONCAP of long circuit pathsexceedi ng 10000 km. For these cases, IONCAP wi 11 produce di fferent outputtables than those expected by VALDPR. The user must avoid selecting pathslonger than 10000 km.
2.3.2 IONCAP Input DataA sample of the IONCAP input data as created by Program SKYVOA (see
Section 2.2) is shown in Figure 3. The test point ID (e.g. MIDBI0012) must bespecified in a LABEL card in the IONCAP input; this is used by VALDPR to
identify circuits.The antenna card of the IONCAP input must be set to antenna type 18 for
IONCAP to read an external antenna file (see Control Card 43 of VOA Standard16775.02). The' antenna pattern data must be on the antenna fi 1e (LU26).Appendix B provides one possible program, called PATTRN, that could be used tocreate the antenna file.
2.3.3 IONCAP Output DataThe output of IONCAP must be saved on a medi urn that can be read by
VALDPR. The implementation given here uses magnetic tape with the formatgiven in Section 2.4.2.
, 15
2.4 Program VALDPR
2.4.1 Function
The purpose of VALDPR is to create data bases from IONCAP's output that
can be used by VALSUM. The data base names are six characters each, the last
two are al ways "DB". The structure of this data base wi 11 vary wi th the
computer on which VALSUM is implemented. In the original implementation, the
data base consists of a large array IVALDT, which can store 4 IONCAP output
variables for each combination of 12 frequencies, 4 months, and 2 sunspot
numbers, up to 24 hours, and up to 400 circuits. The array is stored in
virtual memory. For computers that do not permit initialized· virtual memory,
IVALDT .could be a function call that accesses a random-access-disk data base.
2.4.2 Program VALDPR's Input Data Format
Program VALDPR reads a tape of output from program IONCAP. The tape is
blocked in 128 80-character logical records to give 10240 characters for each
physical record. The tape density is 1600 BPI on 9-track tapes and the ASCII
character code is used to allow data portability. Each tape can contain a
complete set of data (2 sunspot numbers, 4 months, up to 24 hours, up to 12
frequencies) for approximately 80 circuit paths. Each tape has three
sections: the IONCAP control statements; the antenna gain pattern data; and
the performance analysis tables. Each section is described below.
IONCAP control statements At the beginning of each tape is a list of the
IONCAP control statements used to set up the IONCAP executions (see Figure 3
for a.n example). Program VALDPR reads the control statements and selects
those statements that have the phrase COMMENT in the first seven columns. The
COMMENT statements i ncl ude i nformati on about the data base name, transmitter
site name, language category, validation level, antenna bearing, broadcast
sector, broadcast time blocks, number of transmit frequencies, data base
creati on date, and transmitter 1atitude and longitude. Associ ated with each
operating frequency are the antenna characteristics: the number of bays, the
excitation mode, the horizontal slew angle, the design frequency, and the
lower antenna height. Program VALDPR stores these data on file VALIND, whi~h
provides an index to all of the IONCAP data bases. Figure 5 shows an example
of fil e VALIND.
16

File Site AntName Name NameVBNH MIOB SRMOOE2
Lang Val Ant SectorBrg Brg Range
TIME BLOCKS NUM OATE TLAT TLONGAM PM CONFS
1- 5 14-21 9 06 FEB 1987 30.8 35.3
FREQ720
118515352165
607970
137017722588
BAYS444444444
EXCIT4144
104
1041
SLEWooooooooo
OSGN FRQ875875
19001900875875
190019001900
STK HGT17131713
789789
17131713
789789789
Figure 5. An example of the index file VALINO which contains the list ofavailable data bases for VALSUM. This contains the information fordata base VBNH.
The test point 10, month, sunspot number, hour, and frequency are used to
index the data base. In addition, the azimuth from the transmitter to thereceiver in degrees and the circuit ground path distance in kilometers arestored.
Antenna gain pattern data The antenna patterns generated by program PATTRN
are written to tape when IONCAP Method 15 is executed. If the main beamdirection is toward the receiver, the IONCAP tape will contain the receiverantenna pattern and one transmitter antenna pattern fo 11 owi ng the IONCAPinput. If the main beam direction is not toward the receiver, the receiver
antenna pattern will be followed by a transmitter pattern for each test point10. An example of the Method 15 output is shown in Figure 6, and that outputis described in Teters, et al., (1983).

1
ITS- 1 ANTENNA PACKAGE
METHOD 15 10NCAP 85.04 PAGE 1
ANTENNA PATTERN
-7.8 -7.8 -8.0 -
-.2 -.2 .5
3.8 3.8 5.6
6.4 6.4 9.1
8.1 8.1 11.7 1
9.2 9.2 13.6 1
9.8 9.8 14.9 1
9.9 9.9 15.8 1
9.6 9.6 16.0 1
8.9 8.9 15.8 1
7.7 7.7 14.9 1
5.7 5.7 13.2 1
2.5 2.5 10.3 1
-3.3 -3.3 4.611 12 13
FREQUENCY RANGE ANTENNA TYPE HEIGHT LENGTH ANGLE AZIMUTH EX(1) EX(2) EX(3) EX(4) CONDUCT. DIELECT.
2.0 TO 30.0 CONS17 .000 .000 .000 .000 .000 .000 .000 .000 .010 10.000
2 3 4 5 6 7 8 9 10 11 12 1314 16 18 20 22 24 26 28 30G 28 -12.0 -12.0 -12.0 -12.0 -12.0 -12.0 -12.0 -7.8 -7.8
8.0 -8.0 -5.5 -5.5 -5.5 -5.5 -5.5 -5.5 -5.5 28 GR 26 -1.1 -1.1 -1.1 -1.1 -1.1 -1.1 -1.1 -.2 -.2.5 .5 -45.0 -45.0 -45.0 -45.0 -45.0 -45.0 -45.0 26 RE 24 4.6 4.6 4.6 4.6 4.6 4.6 4.6 3.8 3.8
5.6 5.6 -9.8 -9.8 -9.8 -9.8 -9.8 -9.8 -9.8 24 EE 22 8.5 8.5 8.5 8.5 8.5 8.5 8.5 6.4 6.4
9.1 9.1 -10.8 -10.8 -10.8 -10.8 -10.8 -10.8 -10.8 22 ES 20 11.3 11.3 11.3 11.3 11.3 11.3 11.3 8.1 8.1
1.7 11.7 -15.5 -15.5 -15.5 -15.5 -15.5 -15.5 -15.5 20 S18 13.4 13.4 13.4 13.4 13.4 13.4 13.4 9.2 9.2
3.6 13.6 .2 .2 .2 .2 .2 .2 .2 1816 14.8 1.4.8 14.8 14•.8 14.8 14.8 14.8 9.8 9.8
4.9 14.9 6.7 6.7 6.7 6.7 6.7 6.7 6.7 1614 15.7 15.7 15.7 15.7 15.7 15.7 15.7 9.9 9.9
5.8 15.8 10.7 10.7 10.7 10.7 10.7 10.7 10.7 1412 16.0 16.0 16.0 16.0 16.0 16.0 16.0 9.6 9.6
6.0 ·16.0 13.1 13.1 13.1 13.1 13.1 13.1 13.1 1210 15.8 15.8 15.8 15.8 15.8 15.8 15.8 8.9 8.9
5.8 ·15.8 14.4 14.4 14.4 14.4 14.4 14.4 14.4 108 15.0 15.0 15.0 15.0 15.0 15.0 15.0 7~7 7.7
4.9 14.9 14.6 14.6 14.6 14.6 14.6 14.6 14.6 86 13.3 13.3 13.3 13.3 13.3 13.3 13.3 5.7 5.7
3.2 13.2 13.7 13.7 13.7 13.7 13.7 13.7 13.7 64 10.4 10.4 10.4 10.4 10.4 10.4 10.4 2.5 2.5
0.3 10.3 11.3 11.3 11.3 11.3 11.3 11.3 11.3 42 4.7 4.7 4.7 4.7 4.7 4.7 4.7 -3.3 -3.3
2 3 4 5 6 7 8 9 1014 16 18 20 22 24 26 28 30o FREQUENCY IN MEGAHERTZ
0 ANTENNA EFFICIENCY
.0 .0 .0 .0 .0 .0 .0 .0 .0 .0 .0 .0.0 .0 .0 .0 .0 .0 .0 .0 .0
2 3 4 5 6 7 8 9 10 11 12 1314 16 18 20 22 24 26 28 300 FREQUENCY IN MEGAHERTZ
[Note: The Method 15 output table usually has linesthat are 130 col umns wide. Here they are broken intolines that do not exceed 80 columns wide.]
Figure 6. Receiver antenna pattern which is used for all receivers.
18

1
ITS- 1 ANTENNA PACKAGE
METHOD 15 IONCAP 85.04 PAGE 2
ANTENNA PATTERN
FREQUENCY RANGE ANTENNA TYPE HEIGHT LENGTH ANGLE AZIMUTH EX(1) EX(2) EX(3) EX(4) CONDUCT. DIELECT.2.0 TO 30.0 SWWHIP .000 .000 .000 .000 .0
00 .000 .000 .000 .010 10.0002 3 4 5 6 7 8 9 10 11 12 13
14 16 18 20 22 24 26 28 30G 28 -.2 -.2 -.2 -.2 -.2 -.2 -.2 -.2 -.2 -.2 -.2 -.2
-.2 -.2 -.2 -.2 -.2 -.2 -.2 -.2 -.2 28 GR 26 -.1 -.1 -.1 -.1 -.1 -.1 -.1 -.1 -.1 -.1 -.1 -.1
-.1 -.1 -.1 -.1 -.1 -.1 -.1 -.1 -.1 26 RE 24 .0 .0 .0 .0 .0 .0 .0 .0 .0 .0 .0 .0.0 .0 .0 .0 .0 .0 .0 .0 .0 24 EE 22 .0 •0 .0 .0 .0 .0 . .0 .0 .0 .0 .0 .0.0 .0 .0 .0 .0 .0 .0 .0 .0 22 ES 20 .0 .0 .0 .0 .0 .0 .0 .0 .0 .0 .0 .0.0 .0 .0 .0 .0 .0 .0 .0 .0 20 S18 .0 .0 .0 .0 .0 .0 .0 .0 .0 .0 .0 .0.0 .0 .0 .0 .0 .0 .0 .0 .0 1816 -.2 -.2 -.2 -.2 -.2 -.2 -.2 -.2 -.2 -.2 -.2 -.2
-.2 -.2 -.2 -.2 -.2 -.2 -.2 -.2 -.2 1614 -.5 -.5 -.5 -.5 -.5 -.5 -.5 -.5 -.5 -.5 -.5 -.5
-.5 -.5 -.5 -.5 -.5 -.5 -.5 -.5 -.5 1412 -.9 -.9 -.9 -.9 -.9 -.9 -.9 -.9 -.9 -.9 -.9 -.9
-.9 -.9 -.9 -.9 -.9 -.9 -.9 -.9 -.9 1210 -1.3 -1.3 -1.3 -1.3 -1.3 -1.3 -1.3 -1.3 -1.3 -1.3 -1.3 -1.3 -
1.3 -1.3 -1.3 -1.3 -1.3 -1.3 -1.3 -1.3 -1.3 108 -1.8 -1.8 -1.8 -1.8 -1.8 -1.8 -1.8 -1.8 -1.8 -1.8 -1.8 -1.8 -
1.8 -1.8 -1.8 -1.8 -1.8 -1.8 -1.8 . -1.8 -1.8 86 -3.2 -3.2 -3.2 -3.2 -3.2 -3.2 -3.2 -3.2 -3.2 -3.2 -3.2 -3.2 -
3.2 -3.2 -3.2 -3.2 -3.2 -3.2 -3.2 -3.2 -3.2 64 -5.4 -5.4 -5.4 -5.4 -5.4 -5.4 -5.4 -5.4 -5.4 -5.4 -5.4 -5.4 -
5.4 -5.4 -5.4 -5.4 -5.4 -5.4 -5.4 -5.4 -5.4 42 -11.0 -11.0 -11.0 -11.0 -11.0 -11.0 -11.0 -11.0 -11.0 -11.0 -11.0 -11.0 -1
1.0 -11.0 -11.0 -11.0 -11.0 -11.0 -11.0 -11.0 -11.0 20 -20.0 -20.0 -20.0 -20.0 -20.0 -20.0 -20.0 -20.0 -20.0 -20.0 -20.0 -20.0 -2
0.0 -20.0 -20.0 -20.0 -20.0 -20.0 -20.0 -20.0 -20.0 02 3 4 5 6 7 8 9 10 11 12 13
14 16 18 20 22 24 26 28 300 FREQUENCY IN MEGAHERTZ
a ANTENNA EFFICIENCY
-4.8 -4.8 -4.8 -4.8 --4.8 -4.8 -4.8 -4.8 -4.8 -4.8 -4.8 -4.84.8 -4.8 -4.8 -4.8 -4.8 -4.8 -4.8 -4.8 -4.8
23456 78914 16 18 20 22 24 26 28 30o FREQUENCY IN MEGAHERTZ
10 11 12 13
Fi gure 7. Sampl e of transmitter antenna pattern whi ch depends upon .t ransmi tte rantenna characteristics and transmitter-receiver geometry.
19
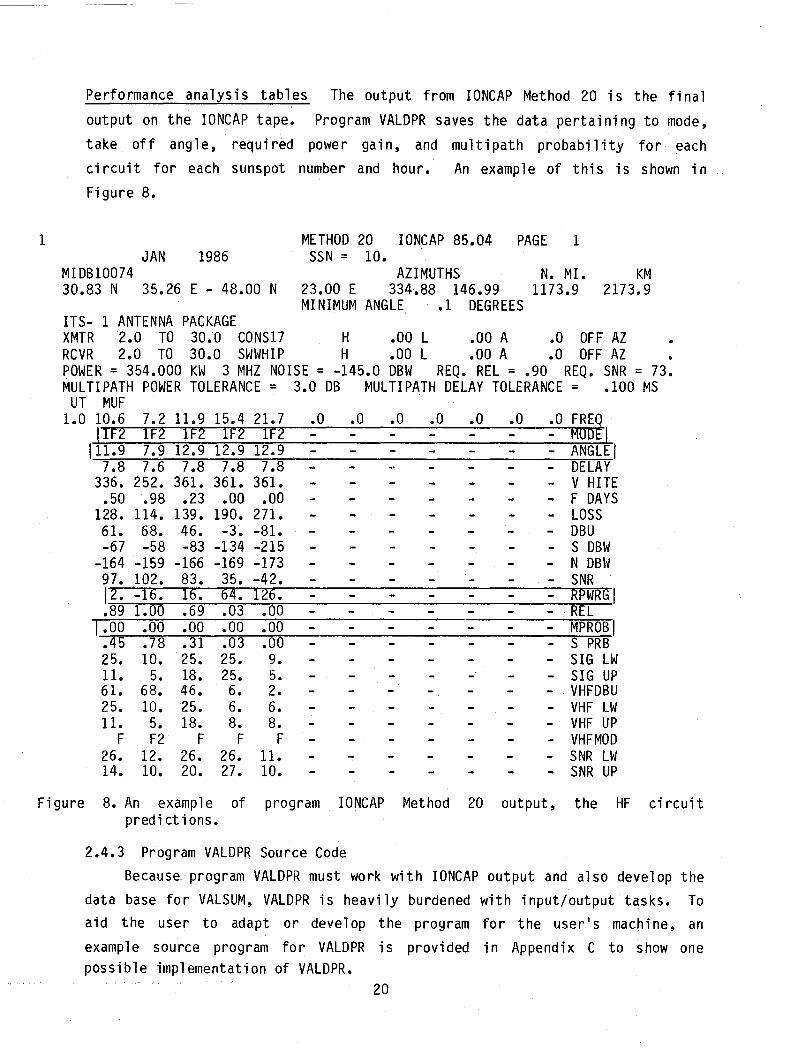
Performance analysis tables The output from IONCAP Method 20 is the final
output on the IONCAP tape. Program VALDPR saves the data pertaining to mode,take off angle, required power gain, and multipath probability for eachcircuit for each sunspot number and hour. An example of this is shown inFigure 8.
1JAN 1986
MIDB1007430.83 N 35.26 E - 48.00 N
METHOD 20 IONCAP 85.04 PAGE 1SSN = 10.
AZIMUTHS N. MI. KM23.00 E 334.88 146.99 1173.9 2173.9MINIMUM ANGLE .1 DEGREES
•ITS- 1 ANTENNA PACKAGEXMTR 2.0 TO 30:0 CONS17 H .00 L .00 A .0 OFF AZRCVR 2.0 TO 30.0 SWWHIP H .00 L .00 A .0 OFF AZPOWER = 354.000 KW 3 MHZ NOISE = -145.0 DBW REQ. REL = .90 REQ. SNR = 73.
ANGLEI
MULTIPATH DELAY TOLERANCE = .100 MS
.0 .0 .0 .0 .0 .0 FREQ- MODEL
111.9 7.9 12.9 12.9 12.9
MULTIPATH POWER TOLERANCE = 3.0 DBUT MUF
1.0 10.6 7.2 11.9 15.4 21.7 .0J1F2 1F2 1F2 1F2 1F2
7.8 7.6 7.8 7.8 7.8336. 252. 361. 361. 361..50.98 .23 .00 .00
128. 114. 139. 190. 271.61. 68. 46. -3. -81.-67 -58 -83 -134 -215
-164 -159 -166 -169 -17397. 102. 83. 35. -42.12. -16. 16. 64. 126.
- DELAY- V HITE- F DAYS- LOSS- DBU- S DBW- N DBW- SNR
RPWRGI
1.00 .00 .00 .00 .00.45 .78 .31 .03 .0025. 10. 25. 25. 9.11. 5. 18. 25. 5.61. 68. 46. 6. 2.25. 10. 25. 6. 6.11. 5. 18. 8. 8.
F F2 F F F26. 12. 26. 26. 11.14. 10. 20. 27. 10.
- REL- MPROBI- S PRB- SIG LW- SIG UP- VHFDBU- VHF LW- VHF UP- VHFMOD- SNR LW- SNR UP
Fi gure 8. An exampl e of program IONCAP Method 20 output, the HF ci rcuitpredi ct ions.
2.4.3 Program VALDPR Source CodeBecause program VALDPR must work with IONCAP output and also develop the
data base for VALSUM, VALDPR is heavily burdened with input/output tasks. Toaid the user to adapt or develop the program for the user's machine, anexample source program for VALDPR is provided in Appendix C to show onepossible implementation of VALDPR.
20
2.5 VALSUM Data Files
VALSUM requires four files: the user input file, which can be created byVALSUM or it can be a fil e previ ously created by the user vi a VALSUM; the
language files, such as UKR1, which should contain no more than 400 test point
IDs; the circuit file, such as VBNHIN, which contains all of the circuits that
have been processed by IONCAP; and VALIND, the file that contains informationabout the available data bases.
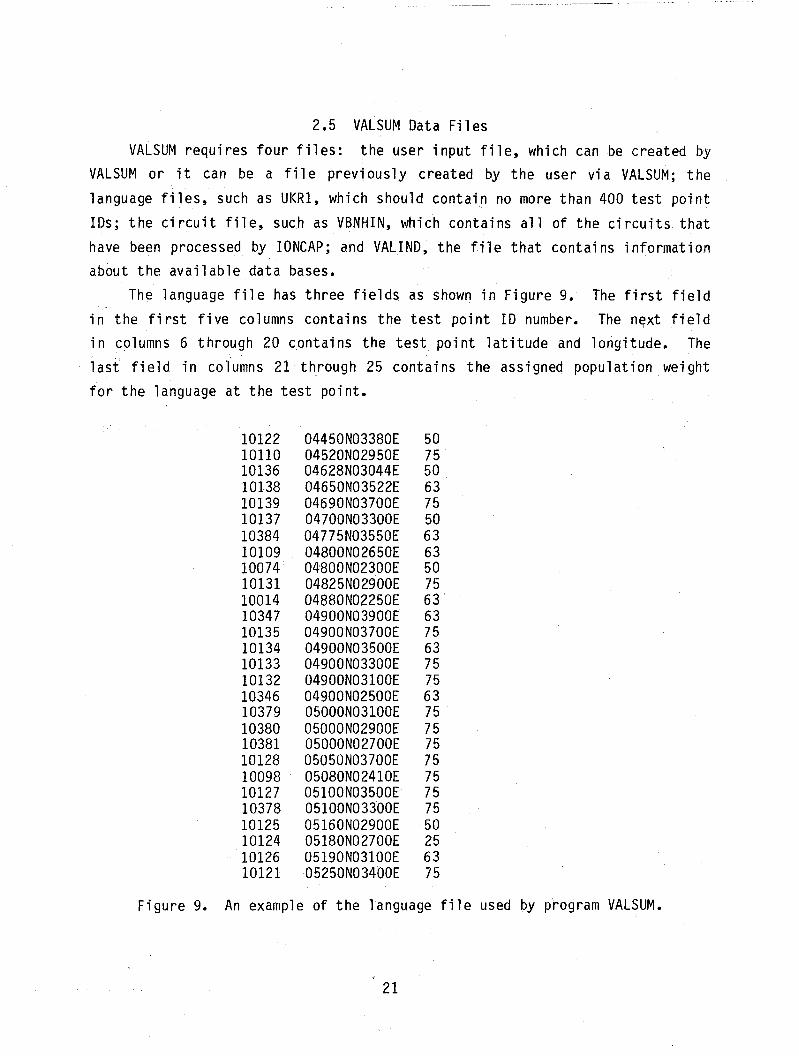
The language file has three fields as shown in Figure 9. The first field
in the first five columns contains the test point ID number. The n~xt field
in columns 6 through 20 contains the test point latitude and longitude. Thelast' field in columns 21 through 25 contains the assigned population weight
for the language at the test point.
10122101101013610138101391013710384101091007410131100141034710135101341013310132103461037910380103811012810098101271037810125101241012610121
04450N03380E04520N02950E04628N03044E04650N03522E04690N03700E04700N03300E04775N03550E04800N02650E04800N02300E04825N02900E04880N02250E04900N03900E04900N03700E04900N03500E04900N03300E04900N03100E04900N02500E05000N03100E05000N02900E05000N02700E05050N03700E05080N02410E05100N03500E05100N03300E05160N02900E05180NO 2700E05190N03100E05250N03400E
50755063755063635075636375637575637575757575757550256375
Figure 9. An example of the language file used by program VALSUM.
21

The circuit file contains the list of circuit IDs that have been
processed by the IONCAP program. Figure 10 shows an example of this file.The first line contains the data base creation date. The second line containsthe transmitter latitude and longitude. The third line contains the number of
ci rcuits and number of frequenci es. The a.m. start hour, a.m. end hour, p.m.
start hour, and p.m. end hour for calculations are contained in line 4. Line5 has the frequencies (in a 12 * 4 format) at which the predictions have been
calculated. The remaining lines contain the circuit 10, bearing (deg E of N)from the transmitter and distance in kilometers from the transmitter for eachcircuit 10. When a user specifies a particular language, VALSUM compares thetest point lOs in the language file with those in the circuit file. This isaccompl i shed by concatenati ng the transmitter name with the test poi nt 10 fromthe language file. VALSUM then searches through the circuit file looking fora match with the ci rcuits that have been processed by IONCAP. Those testpoints that fail to match are listed to the user's terminal.
Tue 17 Feb 198730.83 35.2623 91 5 14 21720118515352165607 970137017722588M1DB10110 344.2 1674.2MIDB10381 344.5 2239.7MIOB10124 346.2 2427.6M1DB10131 346.5 2008.0M1DB10136 347.8 1767.2MIDB10380 348.0 2194 2MIDB10125 349.2 2365.6MIDB10132 351.1 2051.6M1DB10379 351.8 2160.7MIDB10126 352~8 2368.3MIDB10137 354.5 1808.1M1DB10133 355.3 2029.0M1DB10122 355.6 1525.1M1DB10378 355.9 2250.2MIDB10121 357.9 2411.4MIDB10134 359.5 2020.2M1DB10127 359.5 2242.6M10BI0138 359.9 1742.2MIDB10384 .5 1881.2MIOB10128 3.3 2191.6M1DB10135 3.7 2025.4M1DB10139 4.3 1792.8M1DB10347 7.8 2044.5
Figure 10. An example of the data base INDEX file used by program VALSUM.
22

The fourth file, VALIND, has been discussed in Section 2.4.2 of this
report.
3. VALSUM PROGRAM INSTRUCTIONS
3.1 General
VAL SUM is an interactive program that allows the user to select various
predetermined variables from an output data base produced by IONCAP and to
display the IONCAP data in user-selected table formats. The input
instructions for IONCAP follow the steps prescribed in paragraph 3.2 of VOA
(1985) Standard 16775.01. The output from IONCAPi s processed in the manner
previously described in Chapter 2 of this User1s Guide to form a data file,
called IVALDT, for use with VALSUM.
The program will start after the user properly logs on to the system and
types VALSUM. An example of the dialog between the user and the program is
given in Appendix D. The following sections describe the various parts of tbe
dialog with the text that the program prints at the beginning of each section
followed by an explanation.
3.2 VALSUM Data Set Name
Program Prints:
Data set name (must be 6 alpha characters).Entering an existing data set name will cause the program to use thedata set for default values and to replace it with new data.Enteri ng a new data name wi 11 cause the program to use programdefined default~ and to create a new dataset.
Data set name?
Explanation:
As the user enters values defi ni ng the transmitter name, the broadcast
language, the test point locations, etc., the program will create a VALSUM
data set that saves the user's values for the VALSUM calculations and
outputs. Before the user exits the program, the data set is saved on a disk
file. At the beginning of the VALSUM program, the user will be asked for asix-character file name. If a previously defined file is.named, the data set
values in that file will become the default values for the questions during
the dialog. If a new file is named, default values will be supplied by the
program.
23

3.3 Menu
Program Prints:Choose from the menu:
V = Verbose dialogC = Concise dialogE = Edit dataS = Summary of dataP = Process last data set enteredQ = Quit
Menu (Verbose)?
Explanation: )The user is presented wi th a menu that allows for either verbose or
concise ~ialog screen presentations for entering the data. Other items on themenu are an lIedit data ll mode whi ch allows the user to return to a userspecified question number and change the appropriate values. The IIsummary ofdata ll option provides a list of all the input questions and the userresponses. The IIprocess last data set entered ll permits the user to executethe data stream that has been entered, reviewed, or edited. The II qu it ll optionallows the user to exit from the VALSUM program.
To return to the menu from any question, the user should type two colons,i .e. , II •• II
. .. .
3.4 Input Data QuestionsThe following parameters require values selected by the user in order to
carry out the calculations and produce the output tables and plots.
3.4.1 Transmitter Site NameProgram Prints:
Transmitter site nameTNGR = TangierUDRN = UdornPTRC = Puerto RicoCRSN = Sri LankaBTSW = Botswana
1) Transmitter site name (TNGR)?
Explanation:Transmitter site names are permitted to have four al phanumeri c
characters. These characters must have been entered on the 1abel card image
24
of IONCAP and must be in, the transmitter name location in the IONCAP output
file that has been processed by VALDPR and has been made available in the
input data file for VALSUM.
Note that for this and all oth~r questions, a default value is entered in
parentheses for each question. By typing a carriage return to the question,
the program understands that the default value is to be used as the responseto the question.
3.4.2 Language Area
Program Prints:
Language area used for IONCAP executionThe fi rst four characters of the language are entered, for example,
POll =Po 1ishENGL = English
2) Language area (ENGL)?
Explanation:
The language area is the language classification of the IONCAP run. The
program will then provide the user a list of all of the antennas that were run
for that language/transmitter site name such as shown in Section 3.4.3, if
there is at least one available data base. The statement printed by the
program to the user that "There is no data for this transmitter site
name/language" means that there is no VALDPR file for that transmitter site
name/language or that the user entered the wrong transmitter name or
1anguage. The pro'gram wi 11 return to questi ons 1 and 2.
25

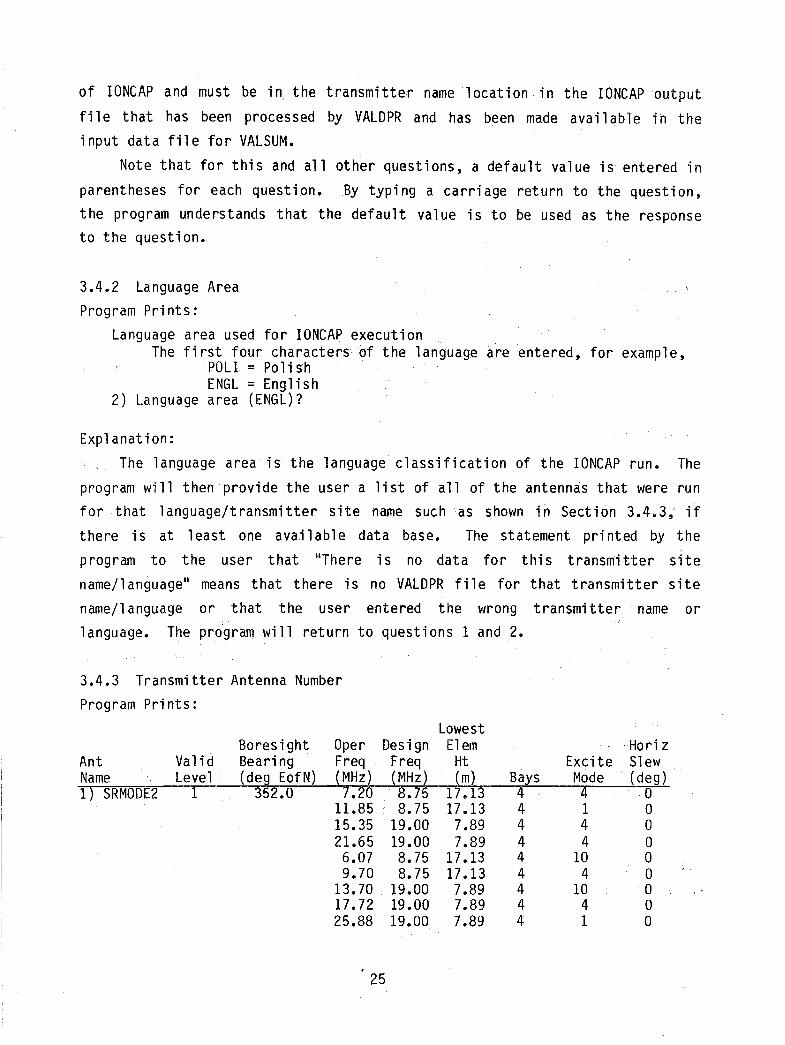
If theverify
IVALDT
Transmi tter antenna number is to be chosen from the list of avail ab1eIONCAP data3) Transmitter antenna (I)?
Explanation:The user must select the data base to be used in VALSUM from this list of
available antennas.
3.4.4 Circuit Selection OptionProgram Prints:
Circuit selection optionL = Language: all ci rcuits of a particular language are chosen
from the TEST POINT data baseS = Sector: the points contained within a specific range of
azimuth and distance are chosen4) Circuit selection option (Language)?
Explanation:Under the circuit selection option the user may choose either a language
or a sector. A language file containing test points of that language must bespecified regardless of whtch option is chosen.
3.4.5 LanguageProgram Prints:
Broadcast languageLanguage area to be studi ed is specifi ed. Thi s area may be a subset ofthe language area speci fi ed in IONCAP for the chosen antenna. The fourcharacter code of language is entered. Any poi nts that do not have datawill be displayed.5) Language (UKRl)?
Explanation:The first four characters of a language file must be entered.
language option was chosen, VALSUM will search the language file tothat all test points identified in the file have IONCAP data in thedata base. Those not having data will be listed to the user's terminal.
3.4.6 Sector
Program Prints:Sector beginning bearing (0.0 to 360.0 deg E of N)6) Sector beginning bearing (30.0 deg E of N)?
26

Sector ending bearing (0.0 to 360.0 deg E of N)7) Sector ending bearing (50.0 deg E of N)7
Sector beginning range (0.0 to 10000.0. km)8) Sector beginning range (1000.0 km)7
Sector ending range (1001.0 to 12000.0 km)9) Sector endi ng range (5000.0 km)7
Exp1anat ion:If II sector ll
these quest ions.
IDs which are in
data base.
was chosen as a circuit option, then the user must answer
VALSUM then searches the language file for the test point
the sector, and saves these I Ds if they are in the IVALDT
3.4.7 Test Point List
Program Pri nts:
Modify TEST POINT ID listA = AddC = ChangeD = DeleteL = Li stN = No change
10) TEST POINT ID list (A)7
Expl anation:
If III anguage ll was selected previously, the test point 101 i st i neludes
all test points found in the language file that are also in the IVJllDT data
ba~e. If II sector ll was chosen, the test point ID list consists of all test
point IDs in the language file, which are also in the sector. The user may
list the test points, delete test points from the list, or add test points to
the list. For example, if the user wishes to add a test point, the user
shoul d typellA: to ques tion 10. The program wi 11 respond with:
TEST POINT IDs to be used in calculations (5 numeral· value; 1 to 400 TestPoint IDs)
10XXX = TEST POINT ID for region 120XXX = TEST POINT ID for region 2, etc.a carri age return terminates TEST POINT 10 input
TEST POINT ID7
If an ID number that is not in the ciata base is entered, the program willrespond, for example, with:
, 27

TEST POINT ID? 10999Circuit number TNGR10999 is not in data file.
Currently the program is 1imited to 400 test point ci rcuits. The usermust limit the number of test point IDs in the list to 400.
When all test point IDs are entered as desi red, the user should respondwith an IIN'I to question 10, indicating no change. VALSUM will, in the
execution stage, combine the transmit site code with the test point ID to forma ni ne-pl ace ci rcuit ID which is used to search the IVALDT fi 1e for theappropriate variables from the desired circuits.
3.4.8 Spill-Over RegionProgram Prints:
Spill-over region calculations optionY = Yes, calculate power to specified spill-over region circuitsN = No, no calculations
11) Spill-over calculations (Yes)?
Explanation:The spill-over region is the region considered to be excluded from the
best frequency selection process but is a region for which the user wishes toknow something about the coverage. If this option is selected, the user mustspecify the desi red ci rcuits in the same manner as was used for the primarycoverage area (described above in paragraph 3.4.4 on Circuit SelectionOption).
3.4.9 Required Power Gain CutsProgram Prints:
Culling process to be used to calculate the required power gainMost stringent is Cut 1; least string'ent is Cut 5. For furtherexplanation, see paragraph 3.5 ~f VOA Std 16775.01
Cut Brief Description1 = Meets the highest required gains with 100% area coverage2 = Meets 90% of the highest required gains with 100% area
coverage3 = Meets 90% of all circuit hours with Case 1 Best Frequency4 = Meets 90% of all circuit hours with Case 2 Best Frequency
(90% circuit reliability for 90% of the locations)5 = Meets 90% of all listener hours with Case 2 Best Frequency and
population weights19) Cut number to be used to determine requi red power gain (5)?
28
Explanation:
The process, defined in VOA Standard 16775.01, paragraph 3.5 and 3.6,
describes an interactive design approach consisting of five steps or cuts.
The first cut is the most stringent and provides the required power gain
needed to achieve the minimum required signal-to-noise ratio on 90 percent of
the broadcast hours in a month at the most difficult test points in the
specified region. The assumption for the frequency of operation during each
broadcast time block is the one that minimizes the highest requi red power gain
in the listening area (see paragraph 3.4.1 in VOA Standard 16775.01 for the
Case 1 Best Frequency).
The second cut is the same as Cut 1 with the exception that the highest
required gains are limited or clipped at the upper decile value of the
distribution of highest required gains from each hour in the broadcast time
blocks over the months and sunspot numbers. The Case 1 Best Frequency is used
to obtain the required gain values in this cut.
The third cut is the same as the second cut except that the limiting
upper decile value is obtained from the entire distribution of required gains
from each broadcast hour in the time blocks over the months and sunspot
numbers at each test point for the Case 1 Best Frequency.
The fourth cut is the same as the thi rd cut but uses the Case 2 Best
Frequency for finding the distribution of required power gain values. The
Case 2 Best Frequency al gorithm attempts to fi nd the frequency that mi nimi zes
the required gain for the majority of the test points while not letting any
test point in the listening area at a given time block have a required gain
value 6 dB greater than the minimum highest required gain. The procedure for
the Case 2 Best Frequency is gi ven in paragraph 304.2 of the VOA (1985)
Standard 16775.01.
The fifth cut, which is an optional cut, is the same as the fourth cut
except that the requi red power gai ns for each test poi nt are wei ghted by the
popul ati on weighti ng factor associ ated wi theach test poi nt in the test poi nt
data fil e.
29

3.4.10 Time Block Output
Program Prints:
Time blocks given in outputS = Single table for all time blocks combinedM = Multiple tables for each time block and all time blocks
combined20) Output time blocks (Multiple table)?
Explanation:
The user specifies if the output tables are to be shown for the combined
time blocks (i.e., entries from individual time blocks are superimposed in one
table showing the worst case or highest required power gain). If so desired,
the user selects the II s ingle tablelloption. If it is also desired to see the
required gain values displayed as a function of elevation angle and frequency
for each specified time block, then the user selects the II mu ltiple tables ll
option.
3.4.11 Time Block List
Program Prints:
Modify time blocks listA = AddC = Changeo = DeleteL = Li stN = No change
21) Time blocks list (A)?
If IIA II is sel ected ,then the program prints:
Time block starting hour = 1-24 implies 0100 UT to 2400UTTime block ending hour = 1-24 implies 0159 UT to 2459 UT
a carriage return terminates time block inputTime block starting hour?Time block ending hour?
Explanation:
The user must specify the time blocks (i.e., set of continuous hours) of
the daily broadcast schedule. For example, an entry of 05 to 07 hours UT will
sel ect the data base associ ated with these hours from the IONCAP data base
(IVALoT). The data associated with these hours will be used to find one Best
Frequency usi ng the appropri ate algorithms. VALSUM is currently set so that
only one broadcast schedule of daily time blocks can be implemented for the
enti re month and sunspot number sequence. The default time blocks are the two
time blocks that were run for IONCAP.30
To supply additional time blocks, the user selects "add" from the menu
presented. This allows the user to enter a beginning and ending hour for a
time block. If more than one time block is desired, the user continues to
enter time blocks (to a maximum of 12 blocks) until all of the desired time
blocks have been specified. Any additional time blocks must be a subset of
the time blocks that were run in IONCAP. A carriage return terminates the
time block input. At that point the user may list the blocks entered, edit
the list by the "add" or IIdelete" menu items, and when satisfied with the time
block entries, proceed to the next question by entering II no change".
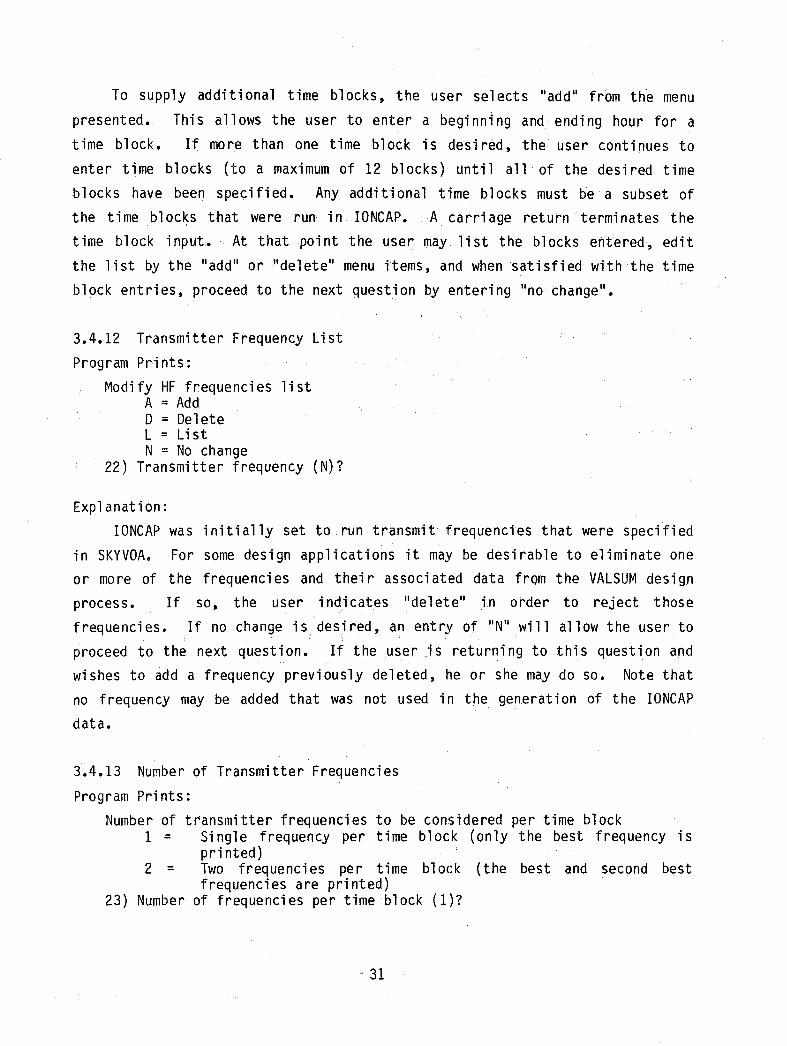
3.4.12 Transmitter Frequency List
Program Prints:
Modify HF frequenci es 1i stA = AddD = DeleteL = ListN = No change
22) Transmitter frequency (N)?
Explanation:
IONCAP was i nit i ally set to run transmit frequencies that were specifi ed
in SKYVOA. For some design applications it may be desirable to eliminate one
or more of the frequencies and their associated data from the VALSUM design
process. If so, the user indicates "delete"in order to reject those
frequencies. If no change is desired, an entry of liN" will allow the user to
proceed to the next question. If the user is returning to this question and
wishes to add a frequency previously deleted, he or she may do so. Note that
no frequency may be added that was not used in the generat i on of the IONCAP
data.
3.4.13 Number of Transmitter Frequencies
Program Prints:
Number of transmitter frequencies to be considered per time block1 = Single frequency per time block (only the best frequency is
printed)2 = Two frequencies per time block (the best and second best
frequencies are printed)23) Number of frequencies per time block (I)?
Explanation:
In some design applications it may be desirable to consider use of more
t han one antenna/t ransmitter pair to sat i sfy a 1anguage requi rement from asingle transmit site. The user is allowed to select either the case of one
frequency used per time block or the case of two simultaneous frequencies per
time block. If the latter case is selected, the best frequency algorithm for
the cut chosen is looped through twice per time block with the first BestFrequency el iminated after the fi rst pass. The second pass produces the
second Best Frequency. The user should be aware that for diffi cult coverage
situations such as a language area falling in the one-hop/two-hop F2-layer
transition region, the two-frequency selection process mayor may not attempt
to fi nd the best set of one-hop and two-hop frequenci es. The use of testpoint elimination in VALSUM (described in Section 3.4.4 on Circuit Selection
Option) is better suited for separating the listening area into two different
coverage regions.
3.4.14 Supplemental Plots and Tables
Program Prints:
Calcul ate and output suppl emental plots and tabl es24) Output supplemental plots and tables (No)?
Explanation:
If the user wishes to see the required power gain values shown as a
function of takeoff and azimuth angle for each of the best frequenciesselected by VALSUM, then this question should be answered with a Uyesll entry.
3.4.15 VALSUM Identification
Program Pri nts:Identification to be printed on output tables and plots (up to 20characters)25) VALSUM identification (VALSUM test run)?
Explanation:
The user is allowed 20 characters to label the VALSUM printouts with a
desired name.
32

3.4.16 Sunspot Numbers
Program Prints:
Modify sunspot number listA = AddD = DeleteL = ListN = No change
26) Sunspot Number (N)?
Explanation:
IONCAP was initially set to run two sunspot numbers. See 3.4.12
Transmitter Frequency List explanation for a discussion on modifying the list.
3.4.17 Months
Program Prints:
Modify month listA = AddD = DeleteL = ListN = No change
27) Month number (N)?
Explanation:
IONCAP wa? initiall,y set to run 4 months. See 3.4.12 Transmitter
Frequency List explanation for a discussion on modifying the list.
3.5 Summary and Process
Program Prints:
Do you want a 'summary of the input data (Y or N)?Do you want to process this data(Y or N)?
Explanation:
The user may elect to pri nt a summary of all the parameters and val ues
chosen. In the summary, each parameter has a question number associated with
it and the values selected. After reviewing the summary, the user can r~turn
to the menu, select EDIT, and modify parameters by entering the question
numbers of the parameters 'to be changed.
After the summary question, the user is asked if the data set is to be
processed. If "yes", the data is processed and the user is returned to the
menu.
33

4. DESCRIPTION OF VALSUM OUTPUT
4.1 Circuit Data
The first output table lists all of the circuit IDs (i.e., the
transmitter site designator and the test point IDs) the user specified either
for an entire language area or by keyboard entry to form a region. The
longitude and latitude as they appear in the IONCAP output for the receive
site location are printed out for each test point along with the great circle
route azimuth and distance as seen from the transmit location. Also, thepopulation weighting factor appearing in the test point data file for the
user-specified language is listed. (Note: This value is displayed for all
cuts, but for cuts other than Cut 5, the value used in the calculations is
1.) Below the circuit listing is a table of transmitter site specific data
that provides the following:
Total Azimuth Range The total arc in the azimuth planeexpressed in degrees that describes thereceive area as seen from thetransmitter site.
Geometric Center
Azimuth Weighted by Di stance
Azimuth Weighted by Population
Azimuth Weighted by Distanceand Popul at i on
Mean Distance
The azimuth in degrees from true northcentered on the mid point of the totalazimuth range, above.
The mean azimuth in degrees from truenorth wei ghted by di stance so thatlonger paths tend to influence theazimuth.
The mean azimuth in degrees from truenorth weighted by popul ati on so thatmore densely populated test points tendto influence the azimuth~
The mean azimuth in degrees from truenorth weighted by the di stribution ofpopul ation and path di stance so thatlonger circuits in the more heavilypopulated areas influence the azimuth.
The average of the distances inkil ometers from the transmitter site tothe receive test point locations.
Standard Deviation
34
The standard deviationdistances about thedistance.
of the pathassumed mean

---- ---- ---- -- - -- ------~~-----------
An example ioutput is : shown in Figure 11 for Cut 5, which includes the
population weighting factors from the test point data file.
NEW VALSUM TEST· 7:20 AM FRI., 13 MAR., 1987 T:MIDB L:UKR1 R:O Cut:5Case:2 Main Region Antenna Name: SRMOOE2
Ci rcuit 10 Weight Latitude Longitude Azimuth Distance10074 50 48.00 23.00 334.88 2173.9010014 63 48~80 22.50 335.34 2268.6010346 63 49.00 25.00 339.78 2196.7010098 75 50.80 24.10 340.61 2404.3010109 63 48.00 26.50 341.19 2048.6010110 75 45.20 29.50 344.21 1674.2010381 75 50.00 27.00 344.45 2239.7010124 25 51.80 27.00 346.18 2427.6010131 75 48.25 29.00 346.46 2008.0010136 50 46.28 30.44 347.76 1767.2010380 75 50.00 29.00 348.02 2194.2010125 50 51.60 29.00 349.24 2365.6010132 75 49.00 31.00 351.14 2051.6010379 75 50.00 31.00 351.75 2160.7010126 63 51.90 31.00 352.75 2368.3010137 50 47.00 33.00 354.49 1808.1010133 75 49.00 33.00 355.26 2029.0010122 50 44.50 33.80 355.60 1525.1010378 75 51.00 33.00 355.89 2250.2010121 75 52.50 34.00 357.92 2411.4010134 63 49.00 35.00 359.45 2020.2010127 75 51.00 35.00 359.53 2242.6010138 63 46.50 35.22 359.90 1742.2010384 63 47.75 35.50 .55 1881.2010128 75 50.50 37.00 3.28 2191.6010135 75 49.00 37.00 3.65 2025.4010139 75 46.90 37.00 4.28 1792.8010341, 63 49.00 39.00 7.80 2044.50
Total azimuth range: 32.92 degreesGeometric center: 351.83 degrees from true northAzimuth weighted by distance: 351.56 degrees from true northAzimuth weighted by population: 352.21 degrees from true northAzimuth weighted by distjpop: 351.97 degrees from true northMean distance: 2082.63 ki lometersStandard deviation: 236.73 kilometers
Fi gure 11. An example circuit output table for program VALSUM Cut 5.
4.2 Required Power Gain TableThe first summary table of ionospheric propagation data shows the
requi red power gain as obtained by the user-selecteq cut (described in Section
3.4). The required power gains in decibels are presented as a function of
elevation angle and frequency. When entries are duplicated, only the largest
35

value is printed. Negative values of required gain indicate that there is
excess in relative to 90 percent reliability of achieving the minimum required
signal-to-noise ratio used in IONCAP. If an actual transmit antenna pattern
was used in IONCAP, then the requi red power gai ns are in terms of decibel s
relative to the pattern assumptions used in IONCAP.
The tabl e presents the el evati on angle requi rements for all seasons and
sunspot numbers for each test point in the specified listening area. An
exampl e output is shown in Fi gure 12. As may be seen, the azimuthal spread is
suppressed in this output fonnat. If the azimuthal dependence is desired, the
user must request the tables for takeoff and azimuth angle.
NEW VALSUM TEST 7:20 AM FRI., 13 MAR., 1987 T:MIDB L:UKRI R:O Cut:5Case:2 Main Region Antenna Name: SRMODE2
Highest/90% Required Power Gains for Best Frequency for All Time BlocksFrequency
Angle 7.20 11.85 15.35 21.65 6.07 9.70 13.70 17.72 25.88 Angle Maximum# # # # # # # # # # = Frequency
selected17 -10 -19 -19 -15· -18 17 -1016 -10 -17 -19 -18 -18 16 -1015 -13 -19 -18 -18 -21 15 -1314 -13 -21 -21 -20 -21 14 -1313 -10 -14 -14 -17 -21 13 -1012 -10 -13 -14 -12 -20 12 -1011 -10 -11 -16 -15 -20 11 -1010 -10 -11 -15 -12 -16 10 -10
9 -10 -10 -18 -14 -15 9 -108 -10 -10 -16 -14 -16 8 -107 -10 -10 -16 -16 -17 7 -106 -11 -15 6 -115 -13 5 -134 -10 4 -103 -10 3 -102 -10 2 -101 10 0
***** 23777 14632 0 0 18290 14632 0 0Number of Times per Frequency
Total Number of Samples: 59144SSN Mean SO Upper Decile Upper Decile
(calculated) (actual)10 -15.7 7.00 -6.7 101.0
120 -20.8 4.99 -14.4 101.0Both -18.2 6.59 -9.8 101.0
Figure 12. An example required power gain and elevation angle table for alltime blocks for program VALSUM.
36

The table in Figure 12 presents data for all time blocks or hours,
dependi ng on the requested cut number. If II mu ltiple li tables were requested by
the user, subsequent tables are output for each time block specified in the
VALSUM input. These time-block-dependent tables allow the user to determine
the gain requirement for various broadcast schedules. For example, if high
required gains are encountered in the time block from 1700 to 2000 hours, the
required gain values may be reduced substantially if a frequency change is
allowed at 1800 hours.
The user is provided with a quick summary of the highest requi red gains
as a function of takeoff angle at the far right of the table in Figure 12. At
the bottom of the table below the frequency columns the user is provided with
the number of occurrences when the frequency was found to be the best. Also
at the bottom of the table the total sample size is given. This number may be
greater than the number of visible entries in the table since only the highest
required gains are presented.
A separate table is given below the required gain table for ill time
blocks in cuts 2 through 5. This table, as may be seen in the example of
Figure 12, presents the mean, standard deviation and upper decile for,the low,
hi gh, and combi ned sunspot numbers. In cuts 2 through 5, the upper deci 1e
va.lue for both sunspot numbers is the limiting value for the required gain
values shown in the table above. In other words, no gain values will be shown
that exceed the upper decile of the required gains. When a higher value is
found, it is,printed as the limiting value by VALSUM.
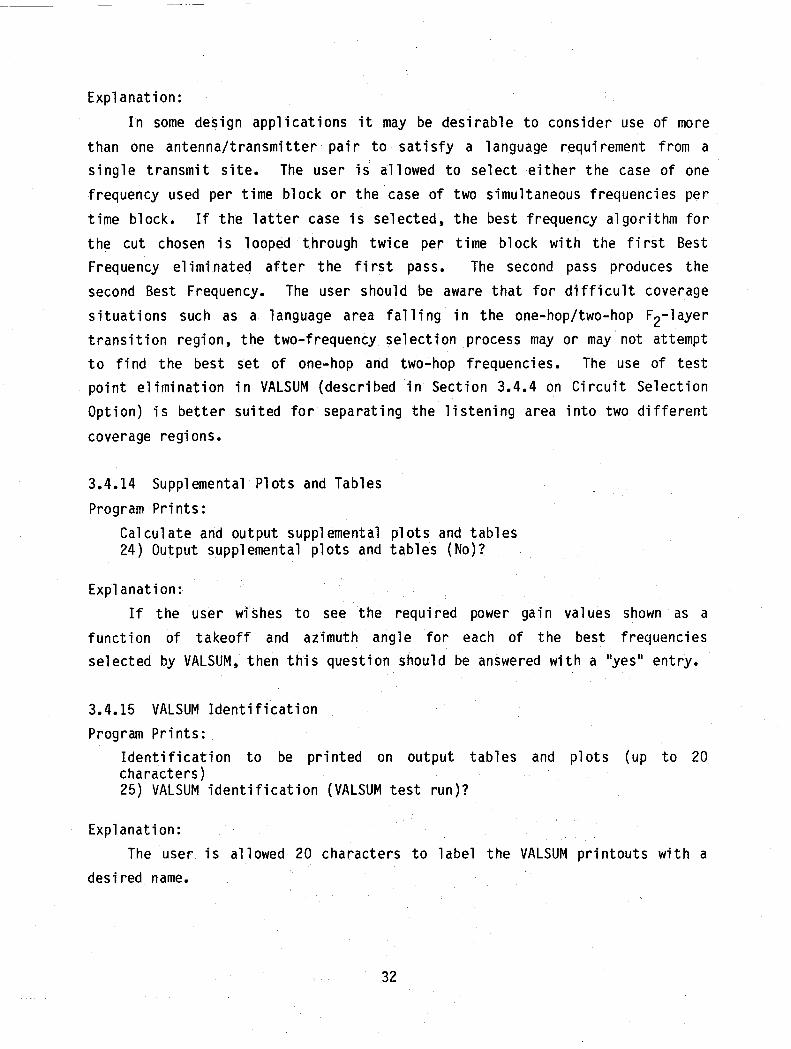
Another table is shown below the required power gain tables for
individual time blocks (multiple table option). This table, as shown in
Fi gure 13, gi ves the Best Frequency found for each month and sunspot number
during that time block and for' the assumptions corresponding to the user
requested required gain cut.
, 37
----- ---- ----------
-10-10
-10-10-10~10
-10 *;.10-10-10-17-13-17-13-12-10-10-10-10
, -12-12-13-10-10-10
2928272625242322212019181716151413121110
987654321o
Angle Maximum# = Frequency
selected
o
-10-11-16-15-18-18-20~17
-12, -15
-12-14-14-16
o 018290 0 0Number of Times per Frequency
Tota1 Number of Sampl es: 7624
o
7:20 AM FRI. , 13 MAR., 1987 T:MIDB L:UKRI R:O Cut:5Antenna Name: SRMOOE2
Power Gains for Best Frequency by Time BlockTime: 1 to 5 UTFrequency
7.20 11.85 15.35 21.65 6.07 9.70 13.70 17.72 25.88# # # # # # # # #
-10-10
-10-10 -10-10-10 -16-10 -20-10 -24-10 -17-10 -19-18 -17-13 -19-17 -21-13 -18-15 -13-10 -11-10 -11-10 -10:"10 -10-12-12'-13-10-10-10
***** 9145
2928272625242322212019181716151413121110987654321o
Angle
NEW VALSUM TESTCase:2 Main Region
Hi ghest/90% Requi red
10120
Sunspot Number7.209.70
3
Best Frequenci esMonth
47.20
11.85
27.209.70
17.207.20
Figure 13. An example required power gain and elevation angle table for anindividual time block from program VALSUM.
38

If the user requested that a second Best Fr~quency be found for each time
block, then separate tables, as described above, are printed out for the
second Best Frequency.
4.3 Best Frequency For All Time Blocks
The Best Frequency table (see Figure 14) .is printed automatica.lly. and
shows the Best Frequency for each time block, month, and sunspot number. The
Best Frequency is dependent on the required gain cut selected by the user.
Cuts 1 through 3 will depict the Case 1 Best Frequency while Cuts 4 and 5 will
show the Case 2 Best Frequen.cJ',~ If a second Best Frequency is, requested, a
separate table is produced showing the second Best Frequencies.
NEWVAl:SUM TtSTCase:2 Main Region
SSN = 10
7:20AM FRIo, 13 MAR., 1987 T:MIDB L:UKR1 R:O Cut:5Antenna Name: SRMODE2Best Frequencies for All Time Blocks
SSN = 120
BlkHr12
JAN.7..207.20 .
APR.7.207.20
. JULY7.207.20
OCT.7.207.20
JAN.'7.207.20
APR.9.70
13.70
JULY11.8515.35
OCT.9.70
11.85
Figure 14. An ex~mple best fre(juency table from program VALSUM.
4.4 Circuits Having Highest Required Gain
The circuit I[)s having the highest 'rJequiredgain for the Best Frequency
algorithm selected by the user (he., Cuts 1-3 u.se Case 1, and Cuts 4 and 5
use Case 2) are shown in tabular form for the time blocks, months, and sunspot
numbers. 'An example table is shown in Figure 15. This table is useful in the
process of editing out troublesome points when coverage is being res~rictedto
onlY 'a' ,portion of the lfsteningarea. It also indicates when thegafn
requirement is being dtivenbya single point or a few points in the, listening
area. The, circuits having the, highest required gain may vary depending on the
Best Frequency algorithm being used and if a second Best Frequency has been'
requested ;,
39

NEW VALSUM TESTCase:2 Main Region
7:20 AM FRI., 13 MAR., 1987 T:MIDB L:UKR1 R:O Cut:5Antenna Name: SRMODE2
Circuits Having Highest Required Gain by Time Blockfor Best Frequency
Hours JAN.1 to 51 10122
14 to 211 10074
SSN = 10
APR.1013910074 10014
SSN = 120
JULY1034710074 10014
OCT.1034710074 10014
Hours JAN. APR. JULY OCT.1 to 5 10122 10122 10347 10122
14 to 21 10074 10014 10122 10122 10074 10014
Figure 15. An example ci rcuits with highest requi red gain table from programVALSUM.
4.5 Summary of Highest Required Gains
This table is related to the previous table (Section 4.4) and gives theactual required power gain for the circuits having the highest required
, ,
gain. the table, as shown in Figure 16, is also presented in terms of. monthsand sunspot numbers. However, the entries in decibels of required gain aregiven for each hour within all time blocks specified by the user.
INEW~VALSUM_TESTCasi:2 Main Region
7:20 AM FRI., 13 MAR., 1987 T:MIDB L:UKR1 R:O Cut:5Antenna Name: SRMODE2Summary of Highest Required Gains
for Best Frequency
SSN = 10 SSN = 120
Bl k Hr JAN.1 4 -15.001 5 -12.002 14 -4.002 15 -13.002 16 -13.002 17 -14.002 18 -15.002 19 -16.00
APR.-11.00
2.007.002.00
-11.00-13.00-14.00-15.00
JULY1.007.00
12.0011.00-9.00
-10.00-11.00-12.00
OCT.-12.00-3.00-1.00
-12.00-13 .. 00-14 .. 00..15.00-16 .. 00
JAN.-17.00-14.00
2.00...13.00...15.00-16.00-18 .. 00-18 .. 00
APR.-14.00~12.00
-15.00-17 .. 00-19 .. 00":20.00-22.00-17 .. 00
JULY-9.0022 .. 00
-14.00-15.00-17.00-18.00...20.00-21 .. 00
OCT...15.00-14 .. 00-8.00
-10.00-11.00-12.00-13.00-14.00
Figure 16. An example highest required gain summary table from program vALSUM ..
40
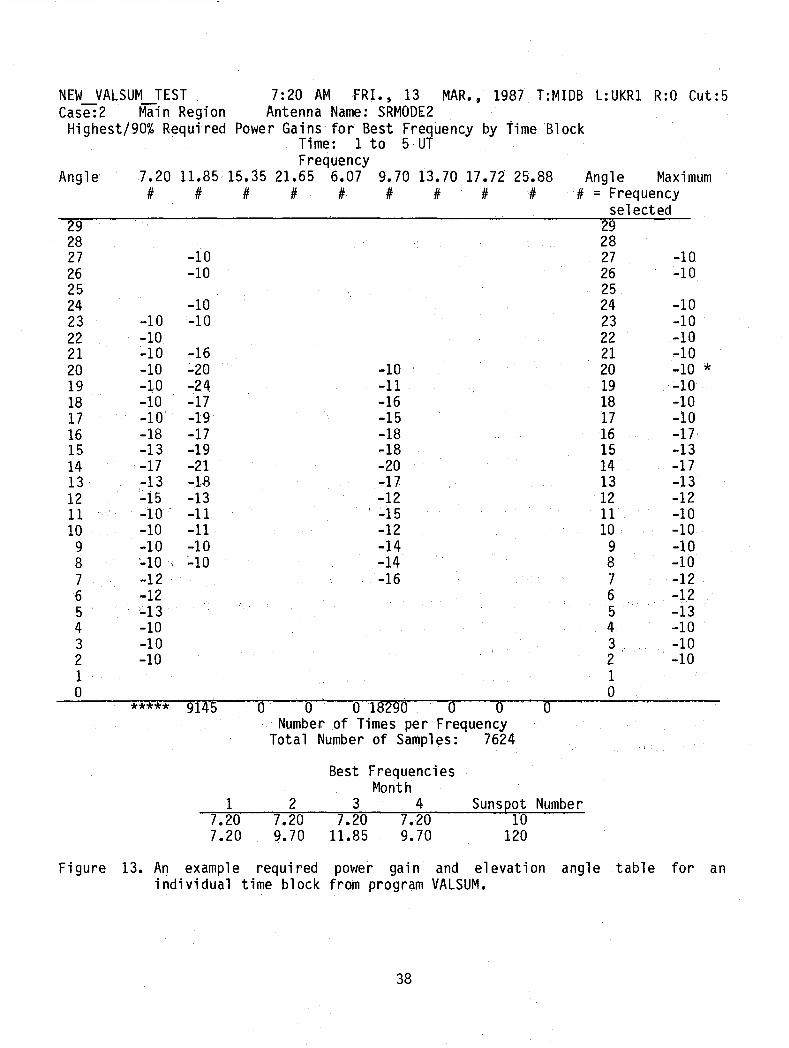
4.6 Distribution of Most Probable Modes
For each specified circuit, the total number of occurrences of a
particular mode as the most probable is shown for each hour period, month,
sunspot number, 'and Best Frequency. This table allows the user to determine
if mixed modes are being predicted for the listening area. The table also
shows the percent of the total hours each mode is requi red for the combi ned
1istening area. For each mode, the maximum range of takeoff angles is given
along with the average value. An example of this table is shown in Figure 17.
NEW VALSUMTEST 7:20AM FRI., 13 MAR., 1987 T:MIDB L:UKR1 R:O Cut:5Case:2 Main Region Antenna Name: SRMODE2
Distribution of Most Probable Modes for Best Frequency
4.7 Occurrences of Frequency/Takeoff Angle
The number of occurrences that a particular frequency and takeoff angle
are required over the full collection of hours, months, and sunspot numbers
for all ci rcuits specified by the user is shown in an example table given in
Fi gure 18. Thi s tabl e is useful in descri bi ng the range of takeoff angl es
41

that must be accommodated by the antenna in order to excite the least-loss
ionospheric modes. The percent of the time and locations for which a
particular angle is required is shown to the far right of the table. Also,
the percent of the time a particular frequency band is required is shown atthe bottom of the table below each frequency band column. It should be notedthat the frequency distribution is bivariant since only low and high sunspotnumbers have been used in the analysis.
NEW VALSUM TEST 7:20 AM FRI., 13 MAR. , 1987 T:MIDB L:UKR1 R:OCut:5Case:2 Main Region Antenna Name: SRMODE2
Occurrences of Frequencies/Takeoff Angles for All Hours at Best Frequency
Frequency (MHz)Angle 7.20 11.85 15.35 21.65 6.07 9.70 13.70 17.72 25.88 Angle %
Occurrencesper Angle
# # # # # # # # # # = Frequency selected23 251 25 23 .522 1040 50 22 1.821 2054 100 50 21 3.720 2692 100 50 100 50 20 5.119 2142 50 100 50 50 19 4.018 1439 338 125 50 125 18 3.517 1227 614 363 275 201 17 4.516 1238 827 376 464 588 16 5.915 2378 726 613 713 539 15 8.414 4511 840 903 615 388 14 12.313 6363 1453 1190 1465 1492 13 20.212 7508 2145 1668 2396 1491 12 25.711 12019 3106 1792 3168 1804 11 37.010 14677 2706 2344 3497 2720 10 43.99 20409 4448 2366 2942 2254 9 54.88 17799 2918 1703 2067 1916 8 44.67 12825 1854 989 488 964 7 28.96 6448 751 6 12.25 1239 5 2.14 100 4 .23 351 3 .62 175 2 .31 10 0
-20.6 40.2 24.7 0.0 0.0 30.9 24.7 0.0 0.0% Occurrences per Frequency
Total Number of Samples: 59144
Figure 18. An eXillnple frequency/takeoff angle table from program VALSUM.
42

4.8 Spill~Over Region
If the user has specified a spill-over region, then all of the tables
previously described will be produced for the set of specified circuits in the
spill-over region. The Best ,or Second Best Frequency used to find the
required gain values in the spill-over region are the same as those found for
the specifi e? cut number used in ana lyzi ng the primary 1i steni ng area. The
user cannot specify a spill-over region if a primary target area has not been
previously defined in VALSUM.
4.9 Supplemental Plots and Tables
If the, user selected the Supplemental Plots and Tables option, azimuth
angle vs. takeoff angle plot and the set of output tables will be generated,
one table for each Best Frequency as shown in the Best Frequency table. The
table presents the required power gain values as a function of azimuth and
takeoff angle. The azimuths are shown relative to the geometric center of the
1i steni ng area as seen from the transmitter site. These tables are very
useful in determini ng if a part i cul ar antenna pattern is adequate in terms of
beam position for the intended listening area. An example of this table is
giveni n Figure 19.<~
-10-10-10-10-10-10
-10-10-10-10-10-10-10-10
-"18-16':10-16-13"';10-17 -17 -16-17 -19 '-10-10-10-10-10-16-13-15-14-19-12 -10-10-10-10-10-10
-18-17-10-10-14-19-15-15-13 -10-10-10-10-16-13-15-14-12-17 -10-10-10-10-10-10
-22-19-10-17-18-15-22-19~20-18-10-15-19-16-16-13 -10-10
-17-15~16~15-13-20-23-22-19-21-18-14-10-10-10-10-10
-15-r3~14-15-12...;16
-19-18-10-15-16-15-15-13
-10
-10 -17-14-10-15-13-14-19-17-18-13-17-10-16-10-10-10-10
-10
-10
-7-6-5-4-3-2-1o1234567
Azim
NEW VALSUM T:E'ST 7:20 AM FRIo, 13 MAR., 1987 T:MIDB L:UKRI R:O Cut:5Case: 2 Ma'i n Regi on Antenna Name: SRMOOE2
Antenna pattern of maximum requi red gai n for best frequency at 7.20 MHzMaximum cut-off gain set to -9.77 dBAzimuth of 0 degi sequa1 to bearl ng of 351.8 deg
Ta keoff Angl e . ,2'3 4 5 6 '7 8 9 10 1112 13 14 15 16 17 18 19 20 21 22 23 24
Figure 19. An example azimuth angle vs. takeoff angle plot from program VALSUM.
43
5. CONCLUSIONS
The Validation Summary (VALSUM) program provides a means for ascertaining
and validating antenna performance parameters for HF broadcast caverage. The
technique is a statistical reduction of point-to-point circuit analyses
produced by the NTIA/ITS Ionospheric Communication Analysis and Prediction
(IONCAP) program. The VALSUM user is provided with two alternative ways of
dev; si ng a "best" frequency broadcast schedule so that design parameters for
the transmit antenna can be developed from a collection of receive points over
a given time block, month, and sunspot number sequence. A vari ety of output
table options are available from VALSUM for determining the range and
di stribution of takeoff angles, azimuth angles, requi red power gain, and the
frequencies needed to provide a desired level of coverage over a specified
area.
6. REFERENCES
CCIR (1984), Antenna Diagrams, ITU, Geneva, Switzerland.
Kuester, Nancy A. (1987), Gai n Eval uation for an Ideali zed Curtai n ArrayAntenna, NTIA Report 87-215, May.
Teters, L.R., J.L. Lloyd, G.W. Haydon, and D.L. Lucas (1983), Estimating thePerformance of TelecOOlmunication Systems Using the IonosphericTransmission Channel; Ionospheric Communications Analysis and PredictionProgram .User l s Manual, NTIA Report .. 83-127, July,. (NTIS Order No.PB84-11121O; manual and computer program on magnetic tape, NTIS Order No.PB8 5-225084).
VOA (1985), Voi ce of Ameri ca Engi neeri ng Standard 16775.01; Hi gh Frequency(Shortwave) Broadcast System Design; Chapter 1: ReqUirements Definition,Voice of America, Office of Engineering and Technical Operations,Washington, D.C., July 31. .
VOA (1985), Voice of America Engineeri ng Standard 16775.02; Estimating thePerformance of TelecOOlmunication Systems Using the IonosphericTransmission Channel ; Ionospheric Communications Analysis and PredictionProgram User's .Manual, NTIA Report 83-127, Voice of America"Office ofEngineering and Technical Operations, Washington, D.C.
7. ACKNOWLEDGMENTS
The development of the IONCAP Summary Program was sponsored by the
USIA/Voice of America. Mr. George Lane and Mr. David Loudin of the Voice of
America and Mr. Mike Toia, formerly of the Voice of America, were. instrumental
in devel opi ng the requirements, the al gori thms, and the input/output
structures for the HF broadcast system design and validation programs.
44

APPENDIX A. EXAMPLE DIALOG BETWEEN PROGRAM SKVVOA AND A USER
Institute for Telecommunication Sciences
Ionospheric Communications Analysis and Prediction ProgramVoice of America
Version 1.0
Thu 19 Feb 1987 14:01:00
Choose from the menu:H = HelpD = Program DescriptionC = Concise DialogV = Verbose DialogE = Edit DataS = Summary of DataP = Process Last Data Set EnteredQ = Quit
Menu (Verbose)?
TRANSMITTER CHARACTERISTICS
Transmitter site nameTNGR = TangierUDRN = UdornPTRC = Puerto RicoCRSN = Sri LankaBOTS = Botswana
1) Transmitter site name (TNGR)? MIDB
Type site lat (followed by carriage return) and site lon (return)for each of the sites. Enter the reference site location first.
Limits are- ON <= lat <= 90NOS <= lat <= 90SOW <= lon <= 180WOE <= lon <= 180E
The default hemispheres are Nand E. The Sand Wlocations can be specifiedby adding an S to the latitude value or adding an Wto the longitude value.Inputs of the form X,V,Z imply degrees, minut,es and seconds. Inputs of theform X.V imply decimal degrees.
1) Transmitter site lat ( 43.0000 deg N or 43 0 0 dms N)? 30.831) Transmitter site lon ( 26.0000 deg E or 26 0 0 dms E)? 35.27
Power delivered to transmitting antenna (betwl:!en2) power delivered to transmitting antenna (
Main beam direction toward receiver
45
.10 and 1000.0 kW)1.00 kW)? 354

Y=YesN=No3) Main beam direction toward receiver (Yes)? N
Bearing from reference site.Enter in degrees clockwise from north,i.e. north = 0, east = 90, south = 180, west = 270.Answer can be in deCimal degrees(X.Y) or in deg. min. and seC. (X,Y,Z), andmust be between 0.0 and 360.0 degrees
4) Bearing ( 0.0 deg)? 334.9
Antenna name (up to 8 characters)5) Antenna name (BOTSl11 )? VALTEST
SYSTEM CHARACTERISTICS
Antenna configurations:L = List current set of antenna configurationsD = Delete an antenna configurationA = Add an antenna configurationC = Change an antenna configurationN = No change10) Antenna configuration (Add)?
Up to 12 frequencies (between 6 and 26 MHz)(A carriage return exits this mode)
Frequency ( 6.1)? 6.1Number of horizontal bays ( 1 to 14)
Number of bays ( 4)?
Curtain excitationMode
1 +002 0+03 00+4 ++05 +0+6 0++7 +-08 +09 0+-
10 +++11 ++12 +-+13 +--
Curt~in excitation ( I)? 10
Horizontal slew angle from the normal to the arrayThe 15 slew angles are:
-30 30-25 25-21 21-17 17-13 13
46

------------------ - - --~-------------
-9 9-5 5o
Horizontal slew angle ( O)?
Frequency at which the antenna is designed between 8.00 and 20.00 MHzAntenna design frequency ( 8.75 MHz~?
Height above ground of lowest stack ( 1.00 to 100.0 m)One-half wavelength stack height above ground at 8.75 MHz is 17.13 meters
Lowest stack height above ground (17.13 m)?Frequency ( 6.1)? 9.7Number of bays ( 4)?Curtain excitation (10)? 4Horizontal slew angle ( O)?Antenna design frequency ( 8.75 MHz)?Lowest stack height above ground (17.13 m)?Frequency ( 9.7)? 13.7Number of bays ( 4)?Curtain excitation ( 4)? 10Horizontal slew angle ( O)?Antenna design frequency (19.00 MHz)?Lowest stack height above ground ( 7.89 m)?Frequency ( 13.7)? 17.72Number of bays ( 4)?Curtain excitation (10)? 4Horizontal slew angle ( O)?Antenna design frequency (19.00 MHz)?Lowest stack height above ground ( 7.89 m)?Frequency ( 17.7)? 25.88Number of bays ( 4)?Curtain excitation ( 4)? 1 .Horizontal slew angle ( O)?Antenna design frequency (19.00 MHz)?Lowest stack height above ground ( 7.89 ~)?
Frequency ( 25.9)?10) Antenna configuration (Add)? L
Antenna configuration(s)Lowest
Oper Design Elem HorizFreq Freq Ht Excite Slew(MHz) (MHz) (m) Bays Mode (deg)
1) 6.1 8.75 17.13 4 10 02) 9.7 8.75 17.13 4 4 03) 13.7 19.00 7.89 4 10 04) 17.7 19.00 7.89 4 4 05) 25.9 19.00 7.89 4 1 0
10) Antenna configuration (Add)? N
AM time of day to begin analysis and predictions(between 01QO and 2400 hours UT)11) AM start time (0100)? QI00
AM time of day to end analysis and predictions
47

(between 0100 and 2400 hours UT)12) AM end time (1200)? 0500
PM time of day to begin analysis and predictions(between 0100 and 2400 hours UT)13) PM start time (1300}? 1400
PM time of day to end analysis and predictions(between 0100 and 2400 hours UT)14) PM end time (2400)?2100
DATA BASE PARAMETERS
Broadcast languageThe first four characters of the language are entered; for example,
POll = PolishENGL = English
21) Language (POLl)? UKR1
Language area under which to catagorize data base (4 characters)ex. ENG2 = English to Africa
22) Language area (TEST)? MIDB
Sector beginning bearing ( 0.0 to 360.0 deg)23) Sector beginning bearing (334.9 deg)? 334.9
Sector ending bearing ( 0.0 to 360.0 deg)24) Sector ending bearing (359.9 deg)? 7.8
Sector beginning range ( 0.0 to 10000 km)25) Sector beginning range (1525. km)? 1524.7
Sector ending range (1526. to 12000 km)26) Sector ending range (2427. km)? 2427.0TEST POINT 10 10124 is not in the new sector limits
Modify TEST POINT ID listA = AddC = ChangeD = DeleteL = Li stN = No change
27) TEST POINT 10 list (A)? N
Do you want a summary of the input data (Y or N)? Y
TRANSMITTER CHARACTERISTICS
1) Transmitter site name:
2) Power delivered to transmitting antenna:3) Main beam direction toward receiver antenna:4) Bearing:5) Antenna name:
48
MIOB30.8 N 35.3 E
. 354.0 kWNo
334.9VAL TEST

- ------------ - - - - - ----------------
ooooo
HorizSlew(deg)
104
1041
ExciteMode
44444
Bays17.1317.13
7.897.897.89
8.758.75
19.0019.0019.00
DesignFreq(MHz)
OperFreq(MHz)
1) 6.102) 9.703) 13.704) 17.725) 25.88
SYSTEM CHARACTERISTICS10) Antenna configurations:
LowestElem
Ht(m)
11) AM start time:12) AM end time:13) PM start time:14) PM end time:
100500
14002100
Great circleDistance
Beari ng fromRef site
(deg E of N)355.6344.2347.7359.9354.5341.2346.4335.3359.4355.2351.1339.8351. 7348.0344.4340.6359.5355.9349.2352.7357.9
4.3.5
7.83.6
( km)1524.71674.01766.81741.61807.72048.32007.62268.32019.62028.52051.22196.32160.12193.72239.22403.92241.92249.62365.12367.72410.71792.21880.62043.72024.7
UKR1MIDB334.9 deg
7.8 deg1525. km2427. km
Longitude(deg)
33.8000 E 33,48, 0 E29.5000 E 29,30, 0 E30.4400 E 30,26,24E35.2200 E 35,13,12E33.0000 E 33, 0, 0 E26.5000 E 26,30, 0 E29.0000 E 29, 0, 0 E22.5000 E 22,30, 0 E35.0000 E 35, 0, 0 E33.0000E 33, 0, 0 E31.0000 E 31, 0, 0 E25.0000 E 25, 0, 0 E31.0000 E 31, 0, 0 E29.0000 E 29, 0, 0 E27.0000 E 27, 0, 0 E24.1000 E 24, 6, 0 E35.0000E 35, 0, 0 E33.0000 E 33, 0, 0 E29.0000 E 29, 0, 0 E31.0000 E 31, 0, 0 E34.0000 E 34, 0, 0 E37.0000 E 37, 0, 0 E35.5000 E 35,30, 0 E39.0000 E 39, 0, 0 E37.0000 E 37, 0, 0 E
Site Latitude
DATA BASE PARAMETERS21) Broadcast language:22) Language area:23) Sector beginning azimuth:24) Sector ending azimuth:25) Sector beginning range:26) Sector ending range:27) TEST POINT IDS:
(deg)10122 44.5000 N 44,30, 0 N10110 45.2000 N 45,12, 0 N10136 46.2800 N 46,16,48 N10138 46.5000 N 46,30, 0 N10137 47.0000 N 47, 0, 0 N10109 48.0000 N 48, 0, 0 N10131 48.2500 N 48,15, 0 N10014 48.8000 N 48,48, 0 N10134 49.0000 N 49, 0, 0 N10133 49.0000 N 49, 0, 0 N10132 49.0000 N 49, 0, 0 N10346 49.0000 N 49, 0, 0 N10379 50.0000 N 50, 0, 0 N10380 50.0000 N 50, 0, 0 N10381 50.0000 N 50, 0, 0 N10098 50.8000 N 50,48, 0 N10127 51.0000 N 51, 0, 0 N10378 51.0000 N 51, 0, 0 N10125 51.6000 N 51,36, 0 N10126 51.9000 N 51,54, 0 N10121 52.5000 N 52,30, 0 N10139 46.9000 N 46,54, 0 N10384 47.7500 N 47,45, 0 N10347 49.0000 N 49, 0, 0 N10135 49.0000 N 49, 0, 0 N
49

10128 50.5000 N 50,30, 0 N 37.0000 E 37, 0, 0 E
Do you want to process this data (Y or N)? Y
Choose from the menu:H = Helpo = Program DescriptionC = Concise DialogV = Verbose DialogE = Edit DataS = Summary of DataP = Process Last Data Set EnteredQ = Quit
Menu (Edit)?
Question number? 10
Antenna configurations:L = List current set of antenna configurationso = Delete an antenna configurationA = Add an antenna configurationC = Change an antenna configurationN = No change
10) Antenna configuration (Add)? 0Antenna configuration? 5
10) Antenna configuration (Add)? 0Antenna configuration? 4
10) Antenna configuration (Add)? 0Antenna configuration? 3
10) Antenna configuration (Add}? 0Antenna configuration? 2,
10) Antenna configuration (Add)? CAntenna configuration? 1
Up to 12 frequencies (between 6 and 26 MHz)(A carriage return exits this mode)
Frequency ( 6.1)? 7.2Number of horizontal bays (1 to 14}
Number of bays ( 4)?
Curtain excitationMode1 +002 0+03 00+4 ++05 +0+6 0++7 +-08 +09 0+-
50
2190.9 3.3

10 +++11 ++12 +-+13 +--
Curtain excitation (10)? 4
Horizontal slew angle from the normal to the arrayThe 15 slew angles are:
-30 30-25 25-21 21-17 17-13 13-9 9-5 5o
Horizontal slew angle O)?
Frequency at which the antenna is designed between 8.00 and 20.00 MHzAntenna design frequency ( 8.75 MHz)?
Height above ground of lowest stack ( 1.00 to 100.0 m)One-half wavelength stack height above ground at 8.75 MHz is 17.13 meters
Lowest stack height above ground (17.13 m)?10) Antenna configuration (Add)?
Frequency ( 7.2)? ll.85Number of bays ( 4)?Curtain excitation ( 4)? 1Horizontal slew angle ( O)?Antenna design frequency ( 8.75 MHz)?Lowest stack height above ground (17.13 m)?Frequency ( 11.9)? 15.35Number of bays ( 4)?Curtain excitation ( I)? 4Horizontal slew angle ( 0)1Antenna design frequency (19.00 MHz)?Lowest stack hei ght above ground ( 7.89 m)?Frequency ( 15.4)? 21.65Number of bays ( 4)?Curtain excitation ( 4)?Horizontal slew angle ( O)?Antenna design frequency (19.00 MHz)?Lowest stack height above ground ( 7.89 m)?Frequency ( 21.7)?
10) Antenna configuration (Add)? LAntenna configuration(s)
LowestOper Design Elem HorizFreq Freq Ht Excite Slew(MHz) (MHz) (m) Bays Mode (deg)
51

10) Antenna configuration (Add)? N
Question number?
Menu (Concise)? S
TRANSMITTER CHARACTERISTICS
1) Transmitter site name:
2) Power delivered to transmitting antenna:3) Main beam direction toward receiver antenna:4) Bearing:5) Antenna name:
MIDB30.8 N 35.3 E354.0 kWN334.9
VALTEST
oooo
HorizSlew(deg)
4144
ExciteMode
4444
Bays17d317.137.897.89
8.758.75
19.0019.00
DesignFreq(MHz)
OperFreq(MHz)
1) 7.202) 11.853) 15.354) 21.65
SYSTEM CHARACTERISTICS10) Antenna configurations:
LowestElem
Ht(m)
11) AM start time:12) AM end time:13) PM start time:14) PM end time:
DATA BASE PARAMETERS21) Broadcast language:22) Language area:23) Sector beginning azimuth:24) Sector ending azimuth:25) Sector beginning range:26) Sector ending range:
100500
14002100
UKRIMIDB334.9 deg
7.8 deg1525. km2427. km
52

27) TEST PO INT IDS:Great circle Bearing from
Site Latitude Longitude Distance Ref site(deg) (deg) (km) (deg E of N)
10384 47.7500 N 47~45~ 0 N 35.5000 E 35~30~ 0 E 1880.6 .510128 50.5000 N 50~30~ 0 N 37.0000 E 37~0~OE 2190.9 3.310135 49.0000 N 49 ~ 0 ~ 0 N 37.0000 E 37~ O~ 0 E 2024.7 3.610139 46.9000 N 46~54~ 0 N 37.0000 E 37~0~OE 1792.2 4.310347 49.0000 N 49 ~ 0 ~ 0 N 39.0000 E 39 ~ O~ 0 E 2043.7 7.810014 48.8000 N 48~48~ 0 N 22.5000 E 22~30~ 0 E 2268.3 335.310346 49.0000 N 49 ~ 0 ~ 0 N 25.0000 E 25~ O~ 0 E 2196.3 339.810098 50.8000 N 50~48~ 0 N 24.1000 E 24~ 6 ~ 0 E 2403.9 340.610109 48.0000 N 48~ 0 ~ 0 N 26.5000 E 26~30~ 0 E 2048.3 341.210110 45.2000 N 45~12~ 0 N 29.5000 E 29~30~ 0 E 1674.0 344.210381 50.0000 N 50~ 0 ~ 0 N 27.0000 E 27 ~ 0, 0 E 2239.2 344.410131 48.2500 N 48~15~ 0 N 29.0000 E 29 ~ 0, 0 E 2007.6 346.410136 46.2800 N 46~16~48 N 30.4400 E 30~26,24 E 1766.8 347.710380 50.0000 N 50 ~ O~ 0 N 29.0000 E 29~ O~ 0 E 2193.7 348.010125 51.6000 N 51~36~ 0 N 29.0000 E 29 ~ 0, 0 E 2365.1 349.210132 49.0000 N 49, 0, 0 N 31.0000 E 31, 0, 0 E 2051.2 351.110379 50.0000 N 50, 0, 0 N 31.0000 E 31, 0, 0 E 2160.1 351.710126 51.9000 N 51,54, 0 N 31.0000 E 31, 0 ~ 0 E 2367.7 352.710137 47.0000 N 47, 0, 0 N 33.0000 E 33, 0, 0 E 1807.7 354.510133 49.0000 N 49, 0, 0 N 33.0000 E 33, 0,. 0 E 2028.5 355.210122 44.5000 N 44~30~ 0 N 33.8000 E 33~48~ 0 E 1524.7 355.610378 51.0000 N 51~ 0, 0 N 33.0000 E 33~ O~ 0 E 2249.6 355.910121 52.5000 N 52~30~ 0 N 34.0000 E 34~ 0 ~ 0 E 2410.7 357.910134 49.0000 N 49, 0, 0 N 35.0000 E 35 ~ 0 ~ 0 E 2019.6 359.410127 51.0000 N 51 ~ 0 ~ 0 N 35.0000 E 35 ~ 0, 0 E 2241.9 359.510138 46.5000 N 46,30~ 0 N 35.2200 E 35,13~12 E 1741.6 359.9
Do you want to process this data (Y or N)? Y
Menu (Edit)? Q
53


APPENDIXB. SOURCE CODE FOR AN EXAMPLE PROGRAM TO CREATE AN IONCAP ANTENNAFILE
PROGRAM PATTRN
FORTRAN 77
FILE NA.ME:HID:LANGUAGE:
MANAGEMENT INFORMATION
SYSTEM NAME: PATTRNLOAD MODULE: PATTRNCPU TYPE: CYBER 840COMPILER VERSION: FORTRAN 77
CCC*********************************************************************CCCCCCCCC*********************************************************************
PURPOSE
CHANGE HISTORY
MNEMONIC LISTING
SUBPROGRAM USAGE
TECHNICAL INFORMATION
DAZEL - computes distance and bearing between xmtr and receiverGAIN - computes power gain dBiMAKDAT - write binary antenna pattern to TAPE26
This program creates antenna patterns to be used in IONCAP.The input to PATTERN is TAPE55 and the bi nary output is stored onTAPE26 which is the name of the antenna file for IONCAP.
CCCCCCCC*********************************************************************CCCC See purpose.CC*********************************************************************CCCCCCCC*********************************************************************CCCC*********************************************************************CCCC PARAMETERS:C NoneCCC COMMON BLOCKS:C ANTDATC NOSTAK - NUMBER OF VERTICAL STACKS
55

----------
C STKSPM -SPACI NG .. BETWEEN STACKSC NUMBAY - NUMBER OF BAYSC BAYSPM - SPACING BETWEEN BAYSC DIPLNM - LENGTH OF DIPOLE RADIATORC RRSPM - SPACING BETWEEN RADIATORS AND REFLECTING SCREENC STKHTM - HEIGHT OF LOWEST STACK ABOVE GROUNDC STKRAT - CURRENT RATIO FOR STACKSC BAYPHS - RELATIVE PHASE FOR THE BAYSC BAYRAT -CURRENT RATIO FOR THE BAYSC OFMHZ - ANTENNA OPERATING FREQUENCYC DFMHZ - ANTENNA DESIGN FREQUENCYC VSLEW - VERTICAL SLEW ANGLEC HSLEW - HORIZONTAL SLEW ANGLEC AZELC ZTLAT - latitude (decimal degrees north of equator) of point TC ZTLON - longitude (decimal degrees east of prime (Greenwich)C meridian) of point TC ZTHT ,- height (meters above mean sea level) of point TC ZRLAT - latitude (decimal degrees north of equator) of point RC ZRLON - longitude (decimal degrees east of prime meridian of point RC ZRHT - height (meters above mean sea level) of point RC ZTAZ - azumuth (decimal degree~ clockwise from north) at T of RC ZRAZ - azimuth (decimal degrees clockwise from north) at R of TC ZTELV - elevation angle (decimal degrees above horizontal at TC of straight line between T and RC ZRELV ... elevation angle (decimal degrees above horizontal at R)C of straight line between T and RC ZTAKOF - take-off angle (decimal degrees above horizontal at T)C of refracted ray between T and R (assumed 4/3 earth radius)C ZRAKOF - take-off angle (decimal degrees above horizontal at R)C of refracted ray between T and R (assumed 4/3 earth radius)C ZD -straight line distance (kilometers) between T and RC ZDGC - great circle distance (kilometers) between T and RCC HELPC GAl NAR - antenna patternCCC*********************************************************************C************************-*********************************************C EXECUTABLE CODEC*********************************************************************CC
DIMENSION SPACE(2), XLEN(2), RLAT(50),+ RLONG(50), GAINS(91)
INTEGER IBAND{12,6), IPHASE{14,8), ISRATIO(6,13)CHARACTER SKYDAT*6COMMON/ANTDAT/NOSTAK,STKSPM,NUMBAY,BAYSPM,DIPLNM,RRSPM,+ STKHTM,STKRAT,BAYPHS,BAYRAT,OFMHZ,nFMHZ~VSLEW,HSLEW
COMMON/AZEL/ ZTLAT,ZTLON,ZTHT,ZRLAT,ZRLON.ZRHT~ZTAZ,ZRAZ,
* ZTELV,ZRELV,ZD,ZDGC,ZTAKOF,ZRAKOFCOMMON/HELP/GAINAR(30,91)
C
56

C
REAL STKRAT(14), BAYPHS(14), BAYRAT(14)DATA SPACE/17.13,7.89/,XLEN/8.57,3.94/,NOSTAK/6/DATA ISRATIO/l,I,O,O,O,O,O,O,I,I,O,O,O,O,O,O,I,I,I,l,I,I,O,0,+ 1,1,0,0,1,1,0,0,1,1,1,1,1,1,-1,-1,0,0,1,1,0,0,-1,-1,+ 0,0,1,1,-1,-1,1,1,1,1,1,1,1,1,1,1,-1,-1,1,1,-1,-1,1,1,+ 1,1,-1,-1,-1,-1/DATA IPHASE/0,0,0,0,0,0,0,0,0,0,0,0,0,0,0,0,31,31,0,77,77,+ 109,109,0,155,155,186,186,0,47,56,103,0,139,185,195,242,+ 0,278,324,334,381,0,47,81,128,0,200,246,281,327,0,399,446,+ 480,527,0,47,105,152,0,260,306,365,411,0,519,566,624,671,+ 0,47,129,176,0,318,365,447,494,0,636,683,765,812,0,90,152,+ 242,0,375,465,527,617,0,750,840,903,993,0,90,180,270,0,444,+ 534,624,714,0,888,978,1068,1158/
CCC
DATA BAYRAT/l.,I.,I.,I.,I.,I.,I.,I.,I.,I.,I.,I.,I.,I./DATA ZRHT/O./,ZTHT/O.O/DATA SKYDAT/ ' TAPE55 1
/
CC
OPEN (I,FILE='OUTPUT ' )JFIRST = 0JFLAG = 0
C OPEN INPUT FILE AND READ DATAC
OPEN (55,FILE=SKYDAT,IOSTAT=IOS,ERR=2000)C5 READ (55, I (F7 .2,X,F8.2,X,I3,X,I3,X,Il,X,F5.2)' ,END=3000,ERR=3001,
+ IOSTAT=IOS) ZTLAT,ZTLON,NBAND,NPOINT,IVALID,BEARDO 10 I=I,NBANDREAD (55,'(6I5)')(IBAND(I,J),J=I,6)
10 CONTINUEDO 20 I=I,NPOINT
READ (55,'(F7.2,X,F8.2)') RLAT(I), RLONG(I)20 CONTINUE
CCC CALCULATE ANTENNA PATTERNS FOR EACH RECEIVER SITE
IF (IVALID .EQ. 0) THENLOOP = 1
ELSELOOP = NPOINT
ENDIF
DO 1000 KOUNT = 1, LOOPCC DETERMINE AZIMUTH
ZRLAT = RLAT(KOUNT)ZRLON = RLONG(KOUNT)CALL DAZEL(O)
C CALCULATE GAINS FOR EACH FREQUENCYIBEG = 1DO 40 I=I,NBAND
57
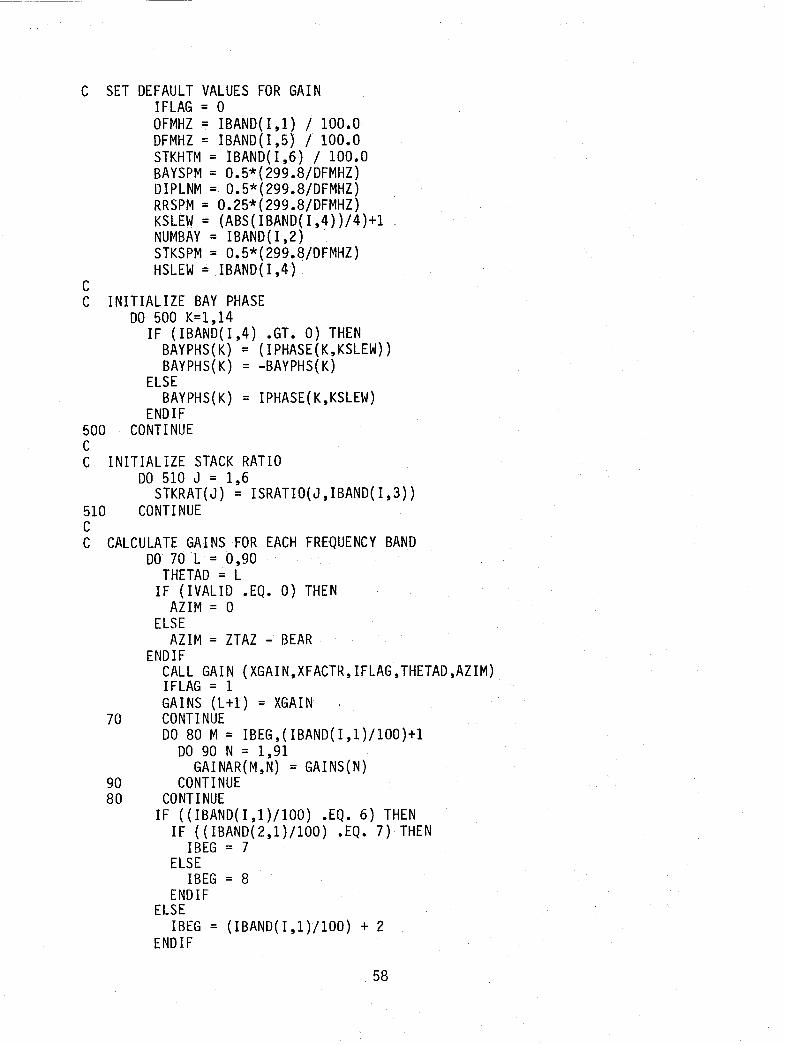
C SET DEFAULT VALUES FOR GAINIFLAG = 0OFMHZ = IBAND(I,l) / 100.0DFMHZ = IBAND(I,5) / 100.0STKHTM = IBAND(I,6) / 100.0BAYSPM = 0.5*(299.8/DFMHZ)DIPLNM = 0.5*(299.8/DFMHZ)RRSPM = 0.25*(299.8/DFMHZ)KSLEW.= (ABS(IBAND(I,4))/4)+1NUMBAY = IBAND(I,2)STKSPM = 0.5*(299.8/DFMHZ)HSLEW = IBAND(I,4)
70
9080
510CC CALCULATE GAINS FOR EACH FREQUENCY BAND
DO 70 L = 0,90THETAD = L
IF (IVALID .EQ. 0) THENAZIM = 0
ELSEAZIM = ZTAZ - BEAR
ENDIFCALL GAIN (XGAIN,XFACTR,IFLAG,THETAD,AZIM)IFLAG = 1GAINS (L+1) = XGAINCONTINUEDO 80 M= IBEG,(IBAND(I,1)/100)+1
DO 90 N= 1,91GAINAR(M,N) = GAINS(N)
CONTINUECONTINUE
IF ((IBAND(I,1)/100) .EQ. 6) THENIF ((IBAND(2,1)/100) .EQ. 7) THEN
IBEG = 7ELSE
IBEG = 8ENDIF
ELSEIBEG = (IBAND(I,1)/100) + 2
ENDIF
500CC INITIALIZE STACK RATIO
DO 510 J = 1,6STKRAT(J) = ISRATIO(J,IBAND(I,3))
CONTINUE
CC INITIALIZE BAY PHASE
DO 500 K=1,14IF (IBAND(I,4) .GT. 0) THEN
BAYPHS(K) = (IPHASE(K,KSLEW))BAYPHS(K) = -BAYPHS(K)
ELSEBAYPHS(K) = IPHASE(K,KSLEW)
ENDIFCONTINUE
58

40 CONTINUEIF (IBEG .LT. 30) THEN
DO 100 M= IBEG,30DO 110 N = 1,91
GAINAR(M,N) = GAINS(N)110 CONTINUE100 CONTINUE
ENDIFIF (JFIRST .EQ. 0) THEN
OPEN (88,FILE='TAPE26 1 ,FORM=IUNFORMATTED',ERR=2000,IOSTAT=IOS,+ ACCESS='SEQUENTIAL ' )
REWIND(88)ENDIF
CALL MAKDAT (JFIRST)JFIRST = 1
1000 CONTI NUEGOTO 5
C3001 WRITE (l;1 (IIERROR #11,15, II READING FROM SKYDAT II ) I) lOS3000 CLOSE(55)
CLOSE(88)CC
STOP2000 WRITE (l,I(IIERROR #11,15,11 OPENING TAPE55 11 )') lOS
STOPEND
SUBROUTINE DAZEL(MODE)
C*********************************************************************
FORTRAN 77
FILE NAME:HID:LANGUAGE:
MANAGEMENT INFORMATION
SYSTEM NAME: PATTRNLOAD MODULE: DAZELCPU TYPE: CYBER 840COMPILER VERSION~ FORTRAN 77
CCCCCCCCc*********************************************************************
PURPOSE·
input lat and lon of end pointreturn distance and azimuth to end pt with elevationsinput bearing (azimuth) of endpointreturn lat and lon of end point with elevations
TECHNICAL INFORMATION
o
1
Two modes--
CCCCCCCCC*********************************************************************CCCC See purpose.CC*********************************************************************
59
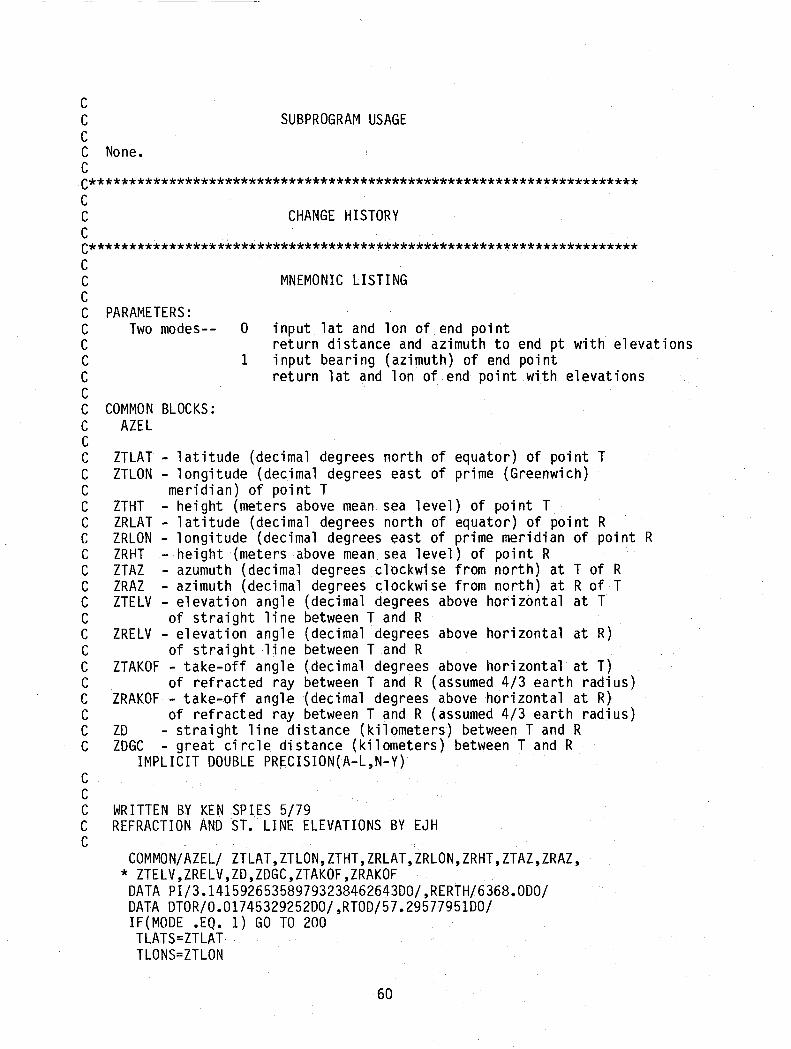
T of RR of Tat T
CHANGE HISTORY
MNEMONIC LISTING
SUBPROGRAM USAGE
input 1at and 10n of end pointreturn distance and azimuth to end pt with elevationsinput bearing (azimuth) of end pointreturn 1at and 10n of end point with elevations
1
- latitude (decimal degrees north of equator) of point T- longitude (decimal degrees east of prime (Greenwich)meridian) of point T
ZTHT - height (meters above mean sea level) of point TZRLAT - latitude (decimal degrees north of equator) of point RZRLON - longitude (decimal degrees east of prime meridian of point RZRHT - height (meters above mean sea level) of poi nt RZTAZ - azumuth (decimal degrees clockwise from north) atZRAZ - azimuth (decimal degrees clockwise from north) atZTELV - elevation angle (decimal degrees above horizontal
of straight line between T and R- elevation angle (decimal degrees above horizontal at R)of straight line between Tand R- take-off angle (decimal degrees above horizontal at T)of refracted ray between T and R (assumed 4/3 earth radius)- take-off angle (decimal degrees above horizontal at R)of refracted ray between T and R (assumed 4/3 earth radius)
ZD - straight line distance (kilometers) between T and RZDGC - great circle distance (kilometers) between T and R
IMPLICIT DOUBLEPRECISION(A-L,N-Y)
CCCC None.CC*********************************************************************CCCC*********************************************************************CCCC PARA~lETERS:
C Two modes-- 0CCCCC COMMON BLOCKS:C AZELCC ZTLATC ZTLONCCCCCCCCCC ZRELVCC ZTAKOFCC ZRAKOFCCC
CCC WRITTEN BY KEN SPIES 5/79C REFRACTION AND ST. LINE ELEVATIONS BY EJHC
COMMON/AZEL/ ZTLAT,ZTLON,ZTHT,ZRLAT,ZRLON,ZRHT,ZTAZ,ZRAZ,* ZTELV,ZRELV,ZD,ZDGC,ZTAKOF,ZRAKOF
DATA PI/3.141592653589793238462643DO/,RERTH/6368.0DO/DATA DTOR/0.01745329252DO/,RTOD/57.29577951DO/IF(MODE .EQ. 1) GO TO 200TLATS=ZTLATTLONS=ZTLON
60
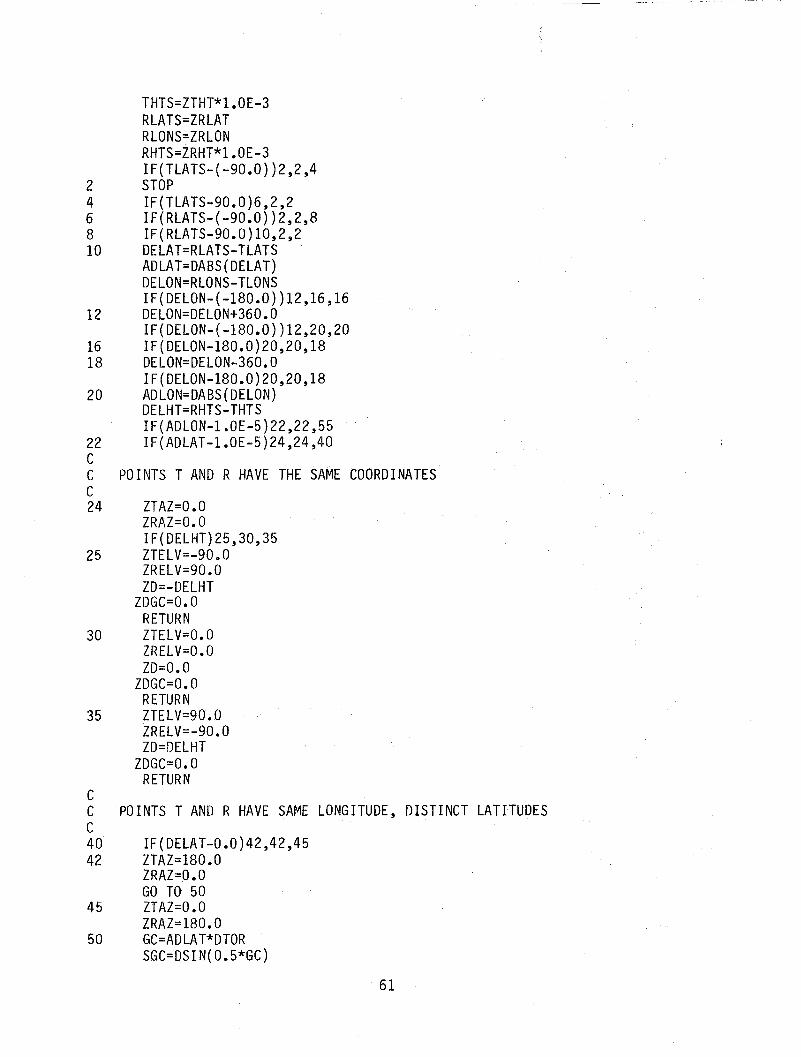
THTS=ZTHT*I.0E~3
RLATS=ZRLATRLONS=ZRLONRHTS=ZRHT*I.0E-3IF(TLATS-(-90.0))2,2,4
2 STOP4 IF(TLATS-90.0)6,2,26 IF(RLATS-(-90.0))2,2,88 IF(RLATS-90.0)10,2,210 DELAT=RLATS-TLATS
ADLAT=DABS(DELAT)DELON=RLONS-TLONSIF(DELON-(-180.0))12,16,16
12 DELON=DELON+360.0IF(DELON-(-180.0))12,20,20
16 IF(DELON-180.0)20,20,1818 DELON=DELON-360.0
IF(DELON-180.0)20,20,1820 ADLON=DABS(DELON)
DELHT=RHTS-THTSIF(ADLON-l.0E-5)22,22,55
22 IF(ADLAT-l.0E-5)24,24,40CC POINTS T AND R HAVE THE SAME COORDINATESC24 ZTAZ=O.O
ZRAZ=O.OIF(DELHT)25,30,35
25 ZTELV=-90.0ZRELV=90.0ZD=-DELHT
ZDGC=O.ORETURN
30 ZTELV=O.OZRELV=O.OZD=O.O
ZDGC=O.ORETURN
35 ZTELV=90.0ZRELV=-90.0ZD=DELHT
ZDGC=O.ORETURN
CC POINTS T AND R HAVE SAME LONGITUDE, DISTINCT LATITUDESC40 IF(DELAT-0.0)42,42,4542 ZTAZ=180.0
ZRAZ=O.OGO TO 50
45 ZTAZ=O.OZRAZ=180.0
50 GC=ADLAT*DTORSGC=DSIN(0.5*GC)
61

D=DSQRT(DELHT*DELHT+4.0*(RERTH+THTS)*(RERTH+RHTS)*SGC*SGC)ZD=D
GO TO 140CC POINTS T AND R HAVE DISTINCT LONGITUDESC55 IF(DELON-0.O)56,56,6056 WLAT=RLATS*DTOR
ELAT=TLATS*DTORGO TO 65
60 WLAT=TLATS*DTORELAT=RLATS*DTOR
CC CALCULATE AZIMUTHS AT POINTS WAND EC65 SDLAT=DSIN(0.5*ADLAT*DTOR)
SDLON=DSIN(0.5*ADLON*DTOR)SADLN=DSIN(ADLON*DTOR)CWLAT=DCOS(WLAT)CELAT=DCOS( ELAT)P=2.0*(SDLAT*SDLAT+SDLON*SDLON*CWLAT*CELAT)SGC=DSQRT(P*(2.0-P))SDLAT=DSIN(ELAT-WLAT)CWAZ=(2.0*CELAT*DSIN(WLAT)*SDLON*SDLON+SDLAT)/SGC
SWAZ=SADLN*CELAT/SGCWAZ=DATAN2(SWAZ,CWAZ)*RTOD
CEAZ=(2.0*CWLAT*DSIN(ELAT)*SDLON*SDLON-SDLAT)/SGCSEAZ=SADLN*CWLAT/SGCEAZ=DATAN2(SEAZ,CEAZ)*RTOD
110 EAZ=360.0-EAZIF(DELON-0.O)lll,111,115
111 ZTAZ=EAZZRAZ=WAZGO TO 120
115 ZTAZ=WAZZRAZ=EAZ
CCC COMPUTE THE STRAIGHT LINE DISTANCE AND GREAT CIRCLE ANGLE BETWEEN T AND RC120 D=DSQRT(DELHT*DELHT+2.0*(RERTH+THTS)*(RERTH+RHTS)*P)
ZD=DCGC=1.0-P
GC=DATAN2(SGC,CGC)CC COMPUTE GREAT CIRCLE DISTANCE AND ELEVATION ANGLESC140 ZDGC=GC*RERTH142 IF(DELHT .GE. 0) GOTO 145
AHT=THTSBHT=RHTSGO TO 150
145 AHT=RHTSBHT=THTS
62

150 SAELV=0.5*{D*D+DABS(DELHT}*{RERTH+AHT+RERTH+BHT}}/(D*{RERTH+AHT}}ARG=DMAX1{0.ODO,(1.0DO-SAELV*SAELV}}
AELV=DATAN2{SAELV,DSQRT{ARG}}BELV=(AELV-GC}*RTODAELV=-AELV*RTOD
C COMPUTE TAKE-OFF ANGLES ASSUMING 4/3 EARTH RADIUSR4THD=RERTH*4.0/3.0GC=0.75*GCSGC=DSIN{0.5*GC}P=2.0*SGC*SGCAALT=R4THD+AHTBALT=R4THD+BHTDA=DSQRT{DELHT*DELHT+2.0*AALT*BALT*P}SAELV=0.5*{DA*DA+DABS(DELHT}*{AALT+BALT}}/(DA*AALT}
ARG=DMAX1(0.ODO,{1.0DO-SAELV*SAELV})ATAKOF=DATAN2(SAELV,DSQRT(ARG}}BTAKOF=(ATAKOF-GC}*RTODATAKOF=-ATAKOF*RTODIF(DELHT-0.O)151,155,155
151 ZTELV=AELVZRELV=BELVZTAKOF=ATAKOFZRAKOF=BTAKOFRETURN
155 ZTELV=BELVZRELV=AELVZTAKOF=BTAKOFZRAKOF=ATAKOFRETURN
CC COMPUTE END POINT GIVEN DISTANCE AND BEARINGC200 TLATR=ZTLAT*DTOR
TLONR=ZTLON*DTORTAZR=,ZTAZ*,oTORGC=ZDGC/RERTHCOLAT=PI/2.0 - TLATRCOSCO=DCOS(COLAT}SINCO=DSIN(COLAT}COSGC=DCOS(GC}SINGC=DSIN(GC}COSB=COSCO*COSGC + SINCO*SINGC*DCOS(TAZR}ARG=DMAX1(O.ODO,(1.0DO-COSB*COSB}}B=DATAN2(DSQRT(ARG},COSB}ARC=(COSGC-COSCO*COSB}/(SINCO*DSIN(B})ARG=DMAX1(0.ODO,(1.0DO-ARC*ARC}}RDLON=DATAN2(DSQRT(ARG},ARC}ZRLAT=(PI/2.0 - DABS(B}}*RTODDRLAT=ZRLATZRLAT=DSIGN(DRLAT,COSB}ZRLON=ZTLON+(DABS(RDLON)*RTOD}IF(ZTAZ .GT. 180} ZRLON=ZTLON-(DABS(RDLON}*RTOD}THTS=ZTHT*1.0E-3RHTS=ZRHT*1.0E-3
63

DELHT=RHTS-THTSSGC=DSIN{O.5*GC)D=DSQRT{DELHT*DELHT+4.0*{RERTH+THTS)*{RERTH+RHTS)*SGC*SGC)GO TO 142ENDSUBROUTINE MAKDAT{JFIRST)
CC*********************************************************************
This subroutine writes a binary antenna pattern to TAPE26.
COMMO N BL OC KS :HELP
GAINAR - array of gain values to be written to TAPE26
FORTRAN 77
FILE NAME:HID:LANGUAGE:
PURPOSE
CHANGE HISTORY
MNEMONIC LISTING
SUBPROGRAM USAGE
TECHNICAL INFORMATION
MANAGEMENT INFORMATION
fi rst patternpattern has already been written
PARAMETERS:JFIRST - 0 =
1 =
SYSTEM NAME: PATTRNLOAD MODULE: MAKDATCPU TYPE: CYBER 840COMPILER VERSION: FORTRAN 77
CCCCCCCCC*********************************************************************CCCCCC*********************************************************************CCCC See purpose.CC*********************************************************************CCCC NoneCC*********************************************************************CCCC*********************************************************************CCCCCCCCCCCCCC*********************************************************************C*********************************************************************
64

C EXECUTABLE CODEC*********************************************************************CCCC
DIMENSION XFQS(3),XFQE(3),YNH(3),YNL(3),YND(3),+ YETA(3),TEY(3,4),COND(3),DIEL(3),ARRAY(30,91),AEFF(30),+ TOAZ(3),AREFF(30)
COMMON/HELP/GAINAR(30,91)CHARACTER LABANT(2,3)*6
CC
DATA NAill ,JTSANT/ll ,XFQS/1.,1. ,1.1 ,XFQE/30. ,30. ,30.1,+YNH/O.,O.,O.I,YNL/O.,O.,O.I,YND/O.,O.,O./,YETA/O.,O.,0.1,+TEY/12*0.I,COND/.Ol,.01,.01/,DIEL/10.,10.,10.1,+TOAZ/O.,O.,O.I,+AEFF/30*0.I,AREFF/30*-4.8/
DATA LABANT/6*1 'IDATA (ARRAY(I,I),I=I,91)1
+ -20.0,-14.0,-11.0,-7.6,-5.4,-4.0,-3.2,-2.5,-1.8,-1.6,+ -1.3,-1.1,-.9,-.6,-.5,-.4,-.2,-.1,0,0,0,0,0,0,0,0,+ -.1,-.2,-.2,-.2,-.3,-.3,-.4,-.5,-.5,-.6,-.7,-.8,-.8,+ -.9,-1.,-1.1,-1.2,-1.4,-1.5,-1.6,-1.8,-1.9,-2.,-2.1,+ -2.3,~2.4,~2.6,~2.7,-2.9,-3.1,-3.2~-3.4,-3.6,-3.7,
+ -3.9,-4.2,-4.4,-4.7,-5.0,-5.4,-5.7,-6.0,-6.4,-6.7,+ -7.1,-7.5,-7.9,-8.4,-8.8,-9.3,-9.8,-10.4,-10.9,-11.4,-12.,+ -12.6,-13.2,-13.9,-14.6,-15.4,-16.2,~17.2,-18.2,
+ -19.6,-21.9/CCC
IF (JFIRST .EQ. 0) THENCC RECEIVER ANTENNA PATTERNSC
DO 20 I = 2,30DO 30 J = l,91
ARRAY(I,J) = ARRAY(l,J)30 CONTINUE20 CONTINUE
LABANT( 1,1 )= ISWWHIpiC
C
WRITE (88) NA,JTSANT,(XFQS(ITY),XFQE(ITY),LABANT(I,ITY),+ LABANT(2,ITY),YNH(ITY),YNL(ITY),YND(ITY),TOAZ(ITY),+ (TEY(ITY,K),K=I,4),COND(ITY),DIEL(ITY),ITY=I,3),+ ((ARRAY(I,J),I=I,30),J=1,91),(AREFF(I),I=I,30)
ENDIFCC TRANSMITTER ANTENNA PATTERNSC
LABANT(I,I) = ICONS17 1
c
65

WRITE (88) NA,JTSANT,(XFQS(ITY),XFQE(ITY),LABANT(1,ITY),+ LABANT(2,ITY),YNH(ITY),YNL(ITY),YND(ITY),TOAZ(ITY),+ (TEY(ITY,K),K=1,4),COND(ITY),DIEL(ITY),ITY=1,3),+ ((GAINAR(I,J),I=1,30),J=1,91),(AEFF(I),I=1,30)
RETURNENDSUBROUTINE GAIN(XGAIN,FACTOR,IFLAG,THETAD,PHID)
PARAMETERS:XGAIN - POWER GAIN IN dBi CALCULATED WITHIN THE SUBROUTINEFACTOR - INTEGRATION FACTOR WHICH CAN BE CALCULATED IN GAIN OR
PASSED BY USERIFLAG - FLAG TO DETERMINE IF FACTOR IS TO BE PASSED INTO GAIN
OR CALCULATED WITHIN GAINIFLAG = 0, FACTOR IS TO BE CALCULATEDIFLAG = 1, FACTOR IS PASSED IN
THETAD - ANGLE ABOVE THE HORIZON IN DEGREES
FORTRAN 77
FILE NAME:HID:LANGUAGE:
PURPOSE
CHANGE HISTORY
MNEMONI~ LISTING
SUBPROGRAM USAGE
TECHNICAL INFORMATION
MANAGEMENT INFORMATION
SYSTEM NAME: PATTRNLOAD MODULE: GAINCPU TYPE: CYBER840COMPILER VERSION: FORTRAN 77
CC*********************************************************************CCCCCCCCC*********************************************************************CCCC This subroutine calculates the gain of a curtain antennaC (documented in NTIA report)CC*********************************************************************CCCC See purpose.CC*********************************************************************CCCC DBLTRAP - calculates a double integral in theta and phi using aC simple trapizoidal rule approximation.CC*********************************************************************CCCC*********************************************************************CCCCCCCCCCCC
66
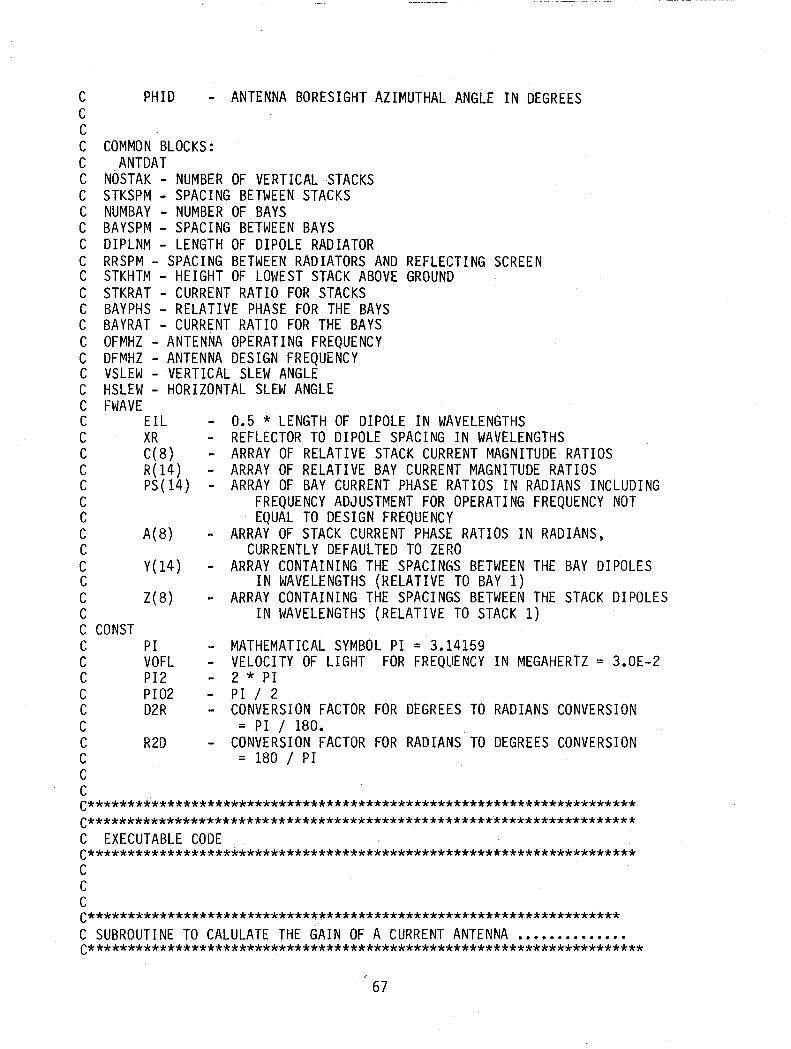
- ANTENNA BORESIGHT AZIMUTHAL ANGLE IN DEGREES
- MATHEMATICAL SYMBOL PI = 3.14159- VELOCITY OF LIGHT FOR FREQUENCY IN MEGAHERTZ = 3.0E-2- 2 * PI- PI / 2- CONVERSION FACTOR FOR DEGREES TO RADIANS CONVERSION
= PI / 180.- CONVERSION FACTOR FOR RADIANS TO DEGREES CONVERSION
= 180 / PI
- 0.5 * LENGTH OF DIPOLE IN WAVELENGTHS- REFLECTOR TO DIPOLE SPACING IN WAVELENGTHS- ARRAY OF RELATIVE STACK CURRENT MAGNITUDE RATIOS- ARRAY OF RELATIVE BAY CURRENT MAGNITUDE RATIOS- ARRAY OF BAY CURRENT PHASE RATIOS IN RADIANS INCLUDING
FREQUENCY ADJUSTMENT FOR OPERATING FREQUENCY NOTEQUAL TO DESIGN FREQUENCY
- ARRAY OF STACK CURRENT PHASE RATIOS IN RADIANS,CURRENTLY DEFAULTED TO ZERO
- ARRAY CONTAINING THE SPACINGS BETWEEN THE BAY DIPOLESIN WAVELENGTHS (RELATIVE TO BAY 1)
- ARRAY CONTAINING THE SPACINGS BETWEEN THE STACK DIPOLESIN WAVELENGTHS (RELATIVE TO STACK 1)
R2D
A(8)
Y(l4 )
Z(8)
PHID
PIVOFLPI2PI02D2R
COMMON BLOCKS:ANTDAT
NOSTAK - NUMBER OF VERTICAL STACKSSTKSPM - SPACING BETWEEN STACKSNUMBAY - NUMBER OF BAYSBAYSPM - SPACING BETWEEN BAYSDIPLNM - LENGTH OF DIPOLE RADIATORRRSPM - SPACING BETWEEN RADIATORS AND REFLECTING SCREENSTKHTM - HEIGHT OF LOWEST STACK ABOVE GROUNDSTKRAT - CURRENT RATIO FOR STACKSBAYPHS - RELATIVE PHASE FOR THE BAYSBAYRAT - CURRENT RATIO FOR THE BAYSOFMHZ - ANTENNA OPERATING FREQUENCYDFMHZ - ANTENNA DESIGN FREQUENCYVSLEW - VERTICAL SLEW ANGLEHSLEW - HORIZONTAL SLEW ANGLEFWAVE
ElLXRC(8)R(l4 )PS(14)
CCCCCCCCCCCCCCCCCCCCCCCCCCCCCCCCCC CONSTCCCCCCCCCCC*********************************************************************C*********************************************************************C EXECUTABLE CODEC*********************************************************************CCCC*******************************************************************C SUBROUTINE TO CALULATE THE GAIN OF A CURRENT ANTENNA ••••••••••••••C**********************************************************************
67

CCOMMON/CONST/ PI,VOFL,PI2,PI02,D2R,R2DDIMENSION BAYRAT(14),STKRAT(14),BAYPHS(14)COMMON/ANTDAT/NOSTAK,STKSPM,NUMBAY,BAYSPM,DIPLNM,RRSPM,1 STKHTM,STKRAT,BAYPHS,BAYRAT,OFMHZ,DFMHZ,VSLEW,HSLEWCOMMON/FWAVE/EIL,XR,C,R,PS,A,Y,Z,WAVE,BETADIMENSION C(8),R(14),PS(14),A(8),Y(14),Z(8)
C CONSTANTSWAVE = VOFL /OFMHZBETA = PI2 / WAVEEL = DIPLNM * BETAY(l) = 0.0H = STKHTM * BETAXR = RRSPM * BETADO 30 I = 1,NOSTAK
Z(I) = STKSPM * BETA *FLOAT(I-1) + HA(I) = 0.0C(I) = STKRAT(I)
30 CONTINUEDO 40 I = 1,NUMBAY
PS{I) = D2R * BAYPHS{I) * OFMHZ / DFMHZR{I) = BAYRAT{I)IF (I.EQ.1) GO TO 40Y{I) = BETA * FLOAT{I-1) * BAYS PM
40 CONTINUEElL = EL / 2.0 .IF (IFLAG .GT. 0) GO TO 200
TSTEPD = 1.0PSTEPD = 1.0TZD = 0.0PZO = -90.0TFD = 90.0PFD = 90.0CALL DBLTRAP{DINTGL,TSTEPD,PSTEPD,TZD,PZD,TFD,PFD)FACTOR = 4.0 * PI / DINTGL
200 CONTINUETHETA = THETAD * D2RPHI = PHID * D2RXGAIN = F2 {THETA, PHI)IF (XGAIN • EQ .0.0) XGAIN = 1.E-10XGAIN = 10 * ALOGI0{ABS{XGAIN * FACTOR))
901 FORMAT{Tl,E9.3,Tll,E9.3,T22,E9.3)1000 FORMAT{EI0.4)999 FORMAT{6F7.2)
RETURNEND
c***********************************************************************BLOCK DATA CONSTNT
C***********************************************************************COMMON/CONST/ PI,VOFL,PI2,PI02,D2R,R2DDATA PI,PI2,PI02 / 3.14159265359, 6.283185308, 1.570796327/DATA D2R,R2D,VOFL / .017453293, 7.2957795, 2.997925E2/END
C********************************************************************
68

FORTRAN 77
FILE NAME:HID:LANGUAGE:
MANAGEMENT INFORMATION
SYSTEM NAME: PATTRNLOAD MODULE: DBLTRAPCPU TYPE: CYBER840COMPILER VERSION: FORTRAN 77
SUBRQUTINE DBLTRAP(DINTGL,TSTEPD,PSTEPD,TZD,PZD,TFD,PFD)Cc*********************************************************************cCCCCCCCC*********************************************************************CC PURPOSECC This subroutine calculates a double integral in theta and phiC using a simple trapezoidal rule approximation.CC*********************************************************************CC TECHNICAL INFORMATIONCC See purpose.CC*********************************************************************CC SUBPROGRAM USAGECC F2 - calculates the integrand.CC*********************************************************************CC CHANGE HISTORYCC*********************************************************************CC MNEMONIC LISTINGCC PARAMETERS: n 94 7C DINTGL INTEGRATION RESULT CALCULATED IN DBLTRAPC TSTEPD - THETA STEP SIZE IN DEGREESC PSTEPD PHI STEP SIZE IN DEGREESC TZD THETA LOWER LIMIT OF INTEGRATION IN DEGREESC PZD PHI LOWER LIMIT OF INTEGRATION IN DEGREESC TFD THETA UPPER LIMIT OF INTEGRATION IN DEGREESC PFD PHI UPPER LIMIT OF INTEGRATION IN DEGREESCCC COMMON BLOCKS:C CONSTC PI - MATHEMATICAL SYMBOL PI = 3.14159C VOFL VELOCITY OF LIGHT FOR FREQUENCY IN MEGAHERTZ = 3.0E-2C PI2 2 * PIC PI02 PI / 2
69

- CONVERSION FACTOR FOR DEGREES TO RADIANS CONVERSION= PI / 180.
- CONVERSION FACTOR FOR RADIANS TO DEGREES CONVERSION= 180 j PI
R2D
D2RCCCCCCC*********************************************************************C*********************************************************************C EXECUTABLE CODEC*********************************************************************CCC
EXTERNAL F2COMMON/CONST/ PI,VOFL,PI2,PI02,D2R,R2DTHETAZ = TZD * D2RPHIZ = PZD * D2RPSTEP = PSTEPD * D2RTSTEP = TSTEPD * D2RTHETAF = TFD * D2RPHIF = PFD *D2RTINT = 0.0T =THETAZNTSTEPS = ~NT(ABS((THETAF - THETAZ) /TSTEP))NPSTEPS = INT(ABS((PHIF - PHIZ) j PSTEP))DO 80 IP1 = 1,NTSTEPS+1
I = IP1 - 1P = PHIZ + PSTEP
PINT = 0.0DO 90 J= 1,NPSTEPS-1PINT = PINT + F2(T,P)
P = P + PSTEP90 CONTINUE
PINT = PINT * PSTEPPINT = PINT + (PSTEPj2.) * (F2(T,P) + F2(T,PHIZ))IF (I.EQ.O .OR. I.EQ.NTSTEPS) GO TO 91TINT = TINT + TSTEP * PINT *COS(T)GO TO 92
91 TINT = TINT t TSTEP * PINT * COS(T) / 2.092 CONTINUE .
T = T + TSTEP80 CONTINUE
oINTG L = TI NTRETURNEND
C************************************************************************FUNCTION F2(THETA,PHI)
C*********************************************************************
MANAGEMENT INFORMATIONccCC SYSTEM NAME:C LOAD MODULE:
PATTRNF2
FI LE NAME:HID:
70

C CPU TYPE: CYBER840 LANGUAGE: FORTRAN 77C COMPILER VERSION: FORTRAN 77CC*********************************************************************CC PURPOSECC This function calculates the integrant of equation(10), NTIA ReportCC*********************************************************************CC TECHNICAL INFORMATIONCC See purpose.CC*********************************************************************
PARAMETERS:THETA - takeoff angle in radiansPHI - azimuthal angle in radians
CHANGE HISTORY
MNEMONIC LISTING
SUBPROGRAM USAGE
- MATHEMATICAL SYMBOL PI = 3.14159- VELOCITY OF LIGHT FOR FREQUENCY IN MEGAHERTZ = 3.0E-2- 2 * PI- PI / 2- CONVERSION FACTOR FOR DEGREES TO RADIANS CONVERSION
= PI / 180.- CONVERSION FACTOR FOR RADIANS TO DEGREES CONVERSION
= 180 / PI
- 0.5 * LENGTH OF DIPOLE IN WAVELENGTHS- REFLECTOR TO DIPOLE SPACING IN WAVELENGTHS- ARRAY OF RELATIVE STACK CURRENT MAGNITUDE RATIOS- ARRAY OF RELATIVE BAY CURRENT MAGNITUDE RATIOS- ARRAY OF BAY CURRENT PHASE RATIOS IN RADIANS INCLUDING
FREQUENCY ADJUSTMENT FOR OPERATING FREQUENCY NOTEQUAL TO DESIGN FREQUENCY .
- ARRAY OF STACK CURRENT PHASE RATIOS IN RADIANS,CURRENTLY DEFAULTED TO ZERO
A(8)
R2D
FWAVEElLXRC(8)R(14)PS(14)
COMMON BLOCKS:CONST
PIVOFLPI2PI02D2R
CCCC NoneCC*********************************************************************CCCC*********************************************************************CCCCCCCCCCCCCCCCCCCCCCCCCCCC
71
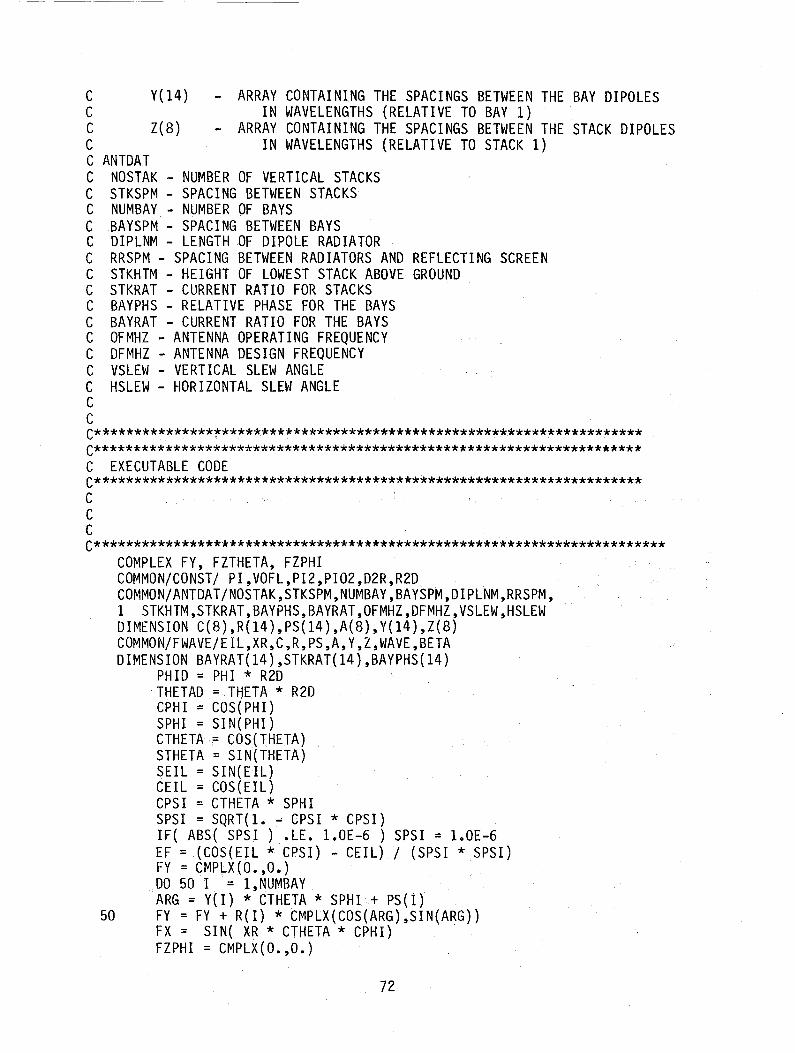
--------
- ARRAY CONTAINING THE SPACINGS BETWEEN THE BAY DIPOLESIN WAVELENGTHS (RELATIVE TO BAY 1)
- ARRAY CONTAINING THE SPACINGS BETWEEN THE STACK DIPOLESIN WAVELENGTHS (RELATIVE TO STACK 1)
Y(14)
Z(8)
50
CCCCC ANTDATC NOSTAK - NUMBER OF VERTICAL STACKSC STKSPM - SPACING BETWEEN STACKSC NUMBAY - NUMBER OF BAYSC BAYSPM - SPACING BETWEEN BAYSC DIPLNM- LENGTH OF DIPOLE RADIATORC RRSPM - SPACING BETWEEN RADIATORS AND REFLECTING SCREENC STKHTM - HEIGHT OF LOWEST STACK ABOVE GROUNDC STKRAT - CURRENT RATIO FOR STACKSC BAYPHS - RELATIVE PHASE FOR THE BAYSC BAYRAT - CURRENT RATIO FOR THE BAYSC OFMHZ - ANTENNA OPERATING FREQUENCYC OF MHZ - ANTENNA DESIGN FREQUENCYC VSLEW - VERTICAL SLEW ANGLEC HSLEW - HORIZONTAL SLEW ANGLECCC***************~*****************************************************
C*********************************************************************C EXECUTABLE CODEC*********************************************************************CCCC************************************************************************
COMPLEX FY, FZTHETA, FZPHICOMMON/CONST/ PI,VOFL,PI2,PI02,D2R,R2DCOMMON/ANTDAT/NOSTAK,STKSPM,NUMBAY,BAYSPM,DIPLNM,RRSPM,1 STKHTM,STKRAT,BAYPHS,BAYRAT,OFMHZ,DFMHZ,VSLEW,HSLEWDIMENSION C(8),R(14),PS(14),A(8),Y(14),Z(8)COMMON/FWAVE/EIL,XR,C,R,PS,A,Y,Z,WAVE,BETADIMENSION BAYRAT(14),STKRAT(14),BAYPHS(14)
PHID = PHI * R2DTHETAD = THETA * R2DCPHI = COS(PHI)SPHI = SI N( PHI)CTHETA,= COS(THETA)STHETA = SIN(THETA)SElL = SIN(EIL)CEIL = COS(EIL)CPSI = CTHETA * SPHISPSI = SQRT( 1... CPSI * CPSI)IF( ABS( SPSI ) .LE. 1.0E-6 ) SPSI = 1.0E-6EF = (COS(EIL * CPSI) - CEIL) / (SPSI * SPSI)FY = CMPLX(O.,O.)DO 50 I = I,NUMBAYARG = Y(I) *CTHETA * SPHI+ PS(I)FY = FY + R(I) * CMPLX(COS(ARG),SIN(ARG))FX = SIN( XR * CTHETA * CPHI)FZPHI = CMPLX(O.,O.)
72

DO 60 I =l,NOSTAKFZPHI = FZPHI + C(I) * SIN(Z(I)* STHETA) *
1 CMPLX(COS(A(I)),SIN(A(I)))60 CONTINUE
FZTHETA = FZPHI * STHETA * SPHIFZPHI = FZPHI * CPHIF2 = EF * EF * FX * FX * FY * CONJG(FY)
1 * (FZTHETA * CONJG(FZTHETA) + FZPHI * CONJG(FZPHI))1111 FORMAT(T1,F7.2,T10,F7.2,T20,E10.4,'+I' ,E10.4,T45,E9.3,T56,E9.3,
1 T65,E9.3,'+I',E9.3,T87,E9.3,'+I' ,E9.3,T109,E9.3,'+I' ,E9.3)1110 FORMAT(T5,'THETA ' ,T15,'PHI ' ,T30,'F',T50,'EF ' ,T61,'FX ' ,T80,'FY',
1 T99,'FZTHETA ' ,Tl14,'FZPHI ' )RETURNEND
73


APPENDIXC. SOURCE CODE FOR ONE POSSIBLE IMPLEMENTATION OF PROGRAM VALDPR
$EMA lIONI$FILES (0,2)
PROGRAM VALDPR(), Validation data processor <870325.1033>
C*********************************************************************
This program creates a data base from IONCAP output that can be used byVALSUM.
FORTRAN 77
of hour
that have been processed
FI LE NAME:HID:LANGUAGE:
PURPOSE
SUBPROGRAM USAGE
TECHNICAL INFORMATION
MANAGEMENT INFORMATION
SYSTEM NAME: VALDPRLOAD MODULE: VALDPRCPU TYPE: HPIOOOCOMPILER VERSION: FORTRAN 77
LGBUF - HP buffer commandGETLN - reads block of data from tapeRD COMMENT - reads comments from tapeTODAY - HP routine for dateRD INDX - reads data base index of tapesOPNVM - HP routine to open VMA fileLURQ - HP routine to lock tape driveVAL HOUR - determines data base locationWR OAT - writes data to fileCLSVM - HP routine to close VMA file
CCCCCCCCC*********************************************************************CCCCCCC NOTE: The IONCAP output processed by this program has all blank linesC removed.C*********************************************************************CCCC See purpose.CC*********************************************************************CCCCCCCCCCCCCCC*********************************************************************cC CHANGE HISTORYCC*********************************************************************CC MNEMONIC LISTINGC
75

--- ---
C PARAMETERS:C NoneCC COMMON BLOCKS:$INCLUDE INDX VALUES$Include /voa/valsum/calc/ionema$INCLUDE NUM$1 NCLUDE VALUES$INCLUDE INDX NUMC -C*********************************************************************C*********************************************************************C EXECUTABLE CODEC*********************************************************************C
LOGICAL EXIST, VALIDREAL FRQS(12)INTEGER*2 TBUF(5120), NAME(3), IARL(2), IDXNAM(6), IHRS(24),+ IFRQS(12),INDX FRQS(12)INTEGER IDATE(14) -INTEGER*4. CIRCARR(400), CIRCID, CIROLD
CHARACTER LINE*79,CMODE*2,MONCH*3,ILAT*1,TSITE*4,+ ILON*l,JLAT*l,JLON*l, DBNAME*4,STRING*80
DATA CIROLD/10000/DATA TSITE/'TNGR ' /DATA IARL/7,8/DATA IDXNAM/ ' IN:BM:VM' /DATA NAME/' OB'/DATA ISC/'JG'/,ICR/'VM ' /
C Use HP system routine to set large buffer for tape
CALL LGBUF(TBUF,5120)
50 CALL GETLN(LINE,CIRCARR,LINKNO,XD1,X02,IDATE,INOX FRQS,IFRQ TOTAL,+ TSITE,*150,*100) - -GOTO 50
100 CALL RD COMMENT(LINE,IHRS)GOTO 200
! Read the comment lines in IONCAP output
150 WRITE(l, I(/!" The tape is an IONCAP tape but not for VALSUM")')
STOP
C Use HP routine to get today's date
200 CALL TOOAY(IDATE)
C Ask for name of data base to be createdWRITE (1, I ("Data base name (4 characters)? _") I)READ (1,'(A4)') DBNAME .
76

------ -- - - ---- --------~_.__._.-
CC Read index file and determine if this tape is part of an existing data baseC
CALL RD_I NDX (DBNAME, IFRQ_TOTAL, INDXJRQS)CC Rewrite index file
OPEN (22,FILE='VALND2::VM ' ,ERR=1000,IOSTAT=IOS,USE='NONEXCLUSIVE')OPEN (23,FILE='VALTMP::VM ' ,ERR=1001,IOSTAT=IOS,USE='NONEXCLUSIVE ' )
READ (23,'(A80)',END=250,ERR=1002,IOSTAT=IOS) STRINGWRITE (22,'(A80)') STRINGGOTO 15
C Use HP routine to OPEN VMA data base file
15
250 CLOSE (22)CLOSE (23,STATUS='DELETE')IOPTN = 2
READ (DBNAME(I:2),'(A2)') NAME(I)READ (DBNAME(3:4),'(A2)') NAME(2)CALL OPNVM(NAME,IERR,IOPTN,ISC,ICR)
IF (IERR .NE. 0) THEN
WRITE (l,I("Error #",15," OPENing data base ",3A2)1) IERR, NAME
STOP
ENDIF
C OPEN circuit index file
IDXNAM(I) = NAME(I)
IDXNAM(2) = NAME(2)
C Use HP routine to LOCK tape drive to this program
CALL LURQ(I,IARL,I)
C OPEN FILE WHICH CONTAINS CIRCUIT INDEX. THE FIRST LINE OF THISC CONTAINS THE CREATION DATE, THE SECOND LINE CONTAINS THE XMTR LATC AND LON. THE 3RD LINE CONTAINS THE NUMBER OF CIRCUITS. THE FOLLOWINGC LINES CONTAIN THE CIRCUIT IDS - EX. TNGRI000l.C
OPEN (99,FILE=IDXNAM,IOSTAT=IOS,ERR=5000,USE='NONEXCLUSIVE ' )CC READ INDEX FILEC
NCIR = 0READ (99,'(A2)',END=7,ERR=1098) IDUMMYREAO (99,'(A2)',END=7,ERR=1098) IOUMMYREAD (99,'(I5)',END=7,ERR=1098) NCIRREAD (99,'(A2)' ,END=7,ERR=1098) IOUMMYREAD (99, I (A2) I,END=? ,ERR=1098) IOUMMY
77

7 IF (NCIR .NE. 0) THENDO .5 I=l,NCIR
READ (99,'(4X,I5)I,END=1098,ERR=1098) CIRCARR(I)5 CONTINUEREWIND (99)ENDIF
CC LINKNO IS INITIALIZED TO NUMBER OF CIRCUITS CURRENTLY IN THE FILEC
LINKNO = NCIRLINKLOC = LINKNOGOTO 350
C NOW POSITIONED AT FIRST LINE OF A PAGE OF IONCAP OUTPUTC Locate start of IONCAP output tables
325 CALL GETLN(LINE,CIRCARR,LINKNO,XDl,XD2,IDATE,INDX FRQS,IFRQ TOTAL,+ TSITE,*350,*100) --GOTO 325
C Now positioned at first data line of IONCAP output
350 CALL GETLN(LINE,CIRCARR,LINKNO,XDl,XD2,IDATE,INDX FRQS,IFRQ TOTAL,+ TSITE,*900) - -
C There are two output tables of results per page of IONCAP output.C ITP is used to make sure both tables are used.
lTP = 0
READ(LINE(13:15),'(A3)') MONCHIF(MONCH.EQ.'JAN ' ) MONIN=lIF(MONCH.EQ.'APR ' ) MONIN=2IF(MONCH.EQ.'JUL ' ) MONIN=3IF(MONCH.EQ.'OCT 1
) MONIN=4
READ(LINE(40:42),'(I3)') ISUN
IF(ISUN.EQ.IO) ISIN=lIF(ISUN~EQ.120) ISIN=2
CALL GETLN(LINE,CIRCARR,LINKNO,XDl,XD2,IDATE,INDX FRQS,IFRQ TOTAL,+ TSITE,*900) - -
READ(LINE(3:11),'(A4,I5)') TSITE,CIRCID
C The circuit 10 should be used to create an index of test pointsC stored in the data base.
C If CIRCID has changed, increment INDEX
IF(CIRCID.NE.CIROLD) THEN
LINKNO = LINKNO + 1
78

~- - - ~~ ~- - ~~ ~ - ~ - -----------------_ .. _--.
LINKLOC = LINKNOCIRCARR(LINKLOC) = CIRCIDCIROLD=CIRCID
C Check for duplicate circuit 10DO I=1,LINKNO-1
IF (CIRCARR(I) .EQ. CIRCID) THENLINKNO = LINKNO - 1LINKLOC = I
ENDIFEND DO
ENDIF
IF(LINE(45:52).NE. ' AZIMUTHS') GOTO 900CALL GETLN(LINE,CIRCARR,LINKNO,XD1,XD2,IDATE,INDX FRQS,IFRQ TOTAL,+ TSITE,*900) - -
READ(LINE(1:79),9000) XD1,ILAT,XD2,ILON,XLAT,JLAT,XLON,JLON,AZ,DST
9000 FORMAT(2X,F5.2,X,A1,2X,F6.2,X,A1,3X,F5.2,X,A1,2X,F6.2,X,A1,4X,& F6.2,20X,F7.1)
160 CALL GETLN(LINE,CIRCARR,LINKNO,XD1,XD2,IDATE,INDX FRQS,IFRQ TOTAL,+ TSITE,*900) - -
IF(LINE(67:71).NE. ' FREQ I) GOTO 160
READ( LINE(1:3),'(I3)') NOW TIME
ITP = ITP+1
READ(LINE(2:55),'(I2,3X,F4.1,12F5.1)1) ITIM,FMUF,(FRQS(I),I=1,12)CC Save frequencies as integer values
DO I = 1,12IFRQS(I) = NINT(FRQS(I)*100)
END DO
C Find the correct index for hour location in the data base IVALDTCALL VAL HOUR( ITIM, ITIM INDX,IHRS,NUM HRS)WRITE(1,~) ITIM,MONIN,ISIlr,LINKLOC,CIRClrD,XLAT,XLON
IF( MONIN .EQ. 1 ) THEN ! Save xmtr lat &lon, rcvr lat &lon, az dist
IF (ILAT .EQ. 'S') XD1 =-XD1IF (ILON .EQ. IWI) XD2 =-XD2TLOC(l) = XD1TLOC(2) = XD2IF (JLAT .EQ. 'SI) XLAT =-XLATIF (JLON .EQ. 'WI) XLON =-XLONRLOC(1,LINKLOC) = XLATRLOC(2,LINKLOC) = XLONBEAR(LINKLOC) = AZ
79
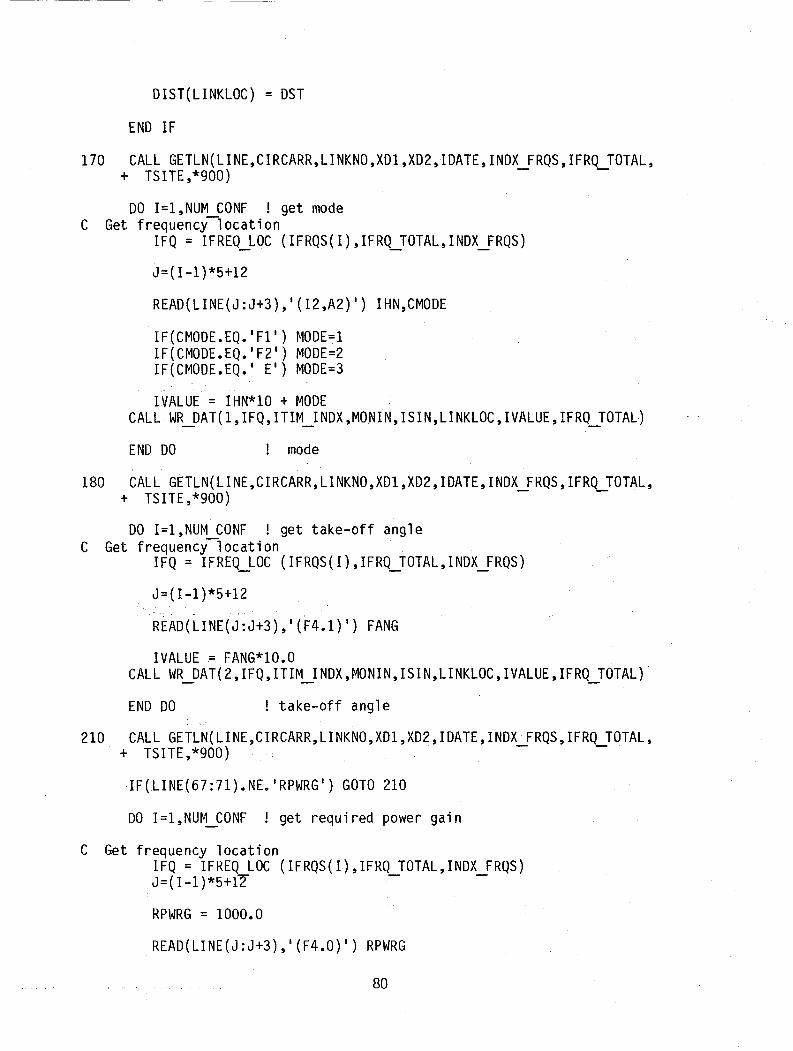
DIST(LINKLOC) = DST
END IF
170 CALL GETLN(LINE,CIRCARR,LINKNO,XD1,XD2,IDATE,INDX FRQS,IFRQ TOTAL,+ TSITE,*900) - -
DO I=l,NUM CONF ! get modeC Get frequency-location
IFQ = IFREQ_LOC (IFRQS(I),IFR~TOTAL,INDX-fRQS)
J=(I -1 )*5+12
READ(LINE(J:J+3),'(I2,A2)') IHN,CMODE
IF(CMODE.EQ.'F1 1) MODE=l
IF(CMODE.EQ.'F2 1) MODE=2
IF(CMODE.EQ.' E' ) MODE=3
IVALUE = IHN*10 + MODECALL WR-YAT( 1, IFQ, ITIM_I NDX ,MONIN, ISIN, LINKLOC, IVALUE, IFR~TOTAL)
END DO ! mode
180 CALL GETLN(LINE,CIRCARR,LINKNO,XD1,XD2,IDATE,INDX FRQS,IFRQ TOTAL,+ TSITE,*900) - -
DO I=l,NUM CONF ! get take-off angleC Get frequency-location
IFQ = IFRE~OC (IFRQS(I),IFR~TOTAL,INDX-fRQS)
J=(I-1)*5+12
READ(LINE(J:J+3),'(F4.1)') FANG
IVALUE = FANG*10.0CALL WR_DAT(2,IFQ,ITIM_INDX,MONIN,ISIN,LINKLOC,IVALUE,IFR~TOTAL)
END DO ! take-off angle
210 CALL GETLN(LINE,CIRCARR,LINKNO,XD1,XD2,IDATE,INDX FRQS,IFRQ TOTAL,+ TSITE,*900) - -
IF(LINE{67:71)~NE.'RPWRG') GOTO 210
DO I=l,NUM_CONF ! get required power gain
C Get frequency locationIFQ = IFREQ LOC (IFRQS(I),IFRQ TOTAL,INDX FRQS)J=( 1-1)*5+12 --
RPWRG = 1000.0
READ(LINE(J:J+3),'(F4.0)') RPWRG
80
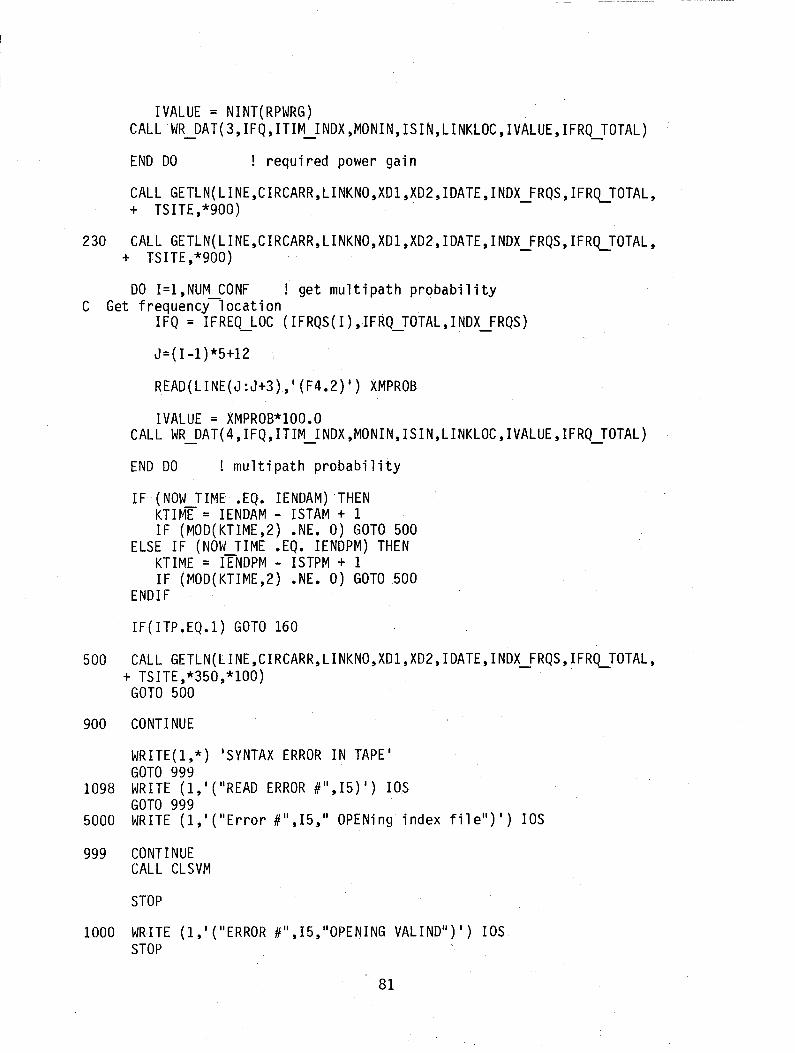
IVALUE = NINT(RPWRG)CALL WR-PAT(3,IFQ,ITIM__INDX,MONIN,ISIN,LINKLOC,IVALUE,IFRQ__TOTAL)
END DO ! required power gain
CALL GETLN(LINE,CIRCARR,LINKNO,XD1,XD2,IDATE,INDX FRQS,IFRQ TOTAL,+ TSITE,*900) -- --
230 CALL GETLN(LINE,CIRCARR,LINKNO,XD1,XD2,IDATE,INDX FRQS,IFRQ TOTAL,+ TSITE,*900) -- --
DO I=l,NUM CONF ! get multipath probabilityC Get frequency--location
IFQ = IFRE~LOC (IFRQS(I),IFRQ__TOTAL,INDX-fRQS)
J=(I-1)*5+l2
READ(LINE(J:J+3),' (F4.2)') XMPROB
IVALUE = XMPROB*100.0CALL WR__DAT(4,IFQ,ITIM__INDX,MONIN,ISIN,LINKLOC,IVALUE,IFR~TOTAL)
END DO ! multi path probability
IF (NOW TIME .EQ. IENDAM) THENKTIME = IENDAM - ISTAM + 1IF (MOD(KTIME,2) .NE. 0) GOTO 500
ELSE IF (NOW TIME .EQ. IENDPM) THENKTIME = IENDPM - ISTPM + 1IF (MOD(KTIME,2) .NE. 0) GOTO 500
ENDIF
IF(ITP.EQ.1) GOTO 160
500 CALL GETLN(LINE,CIRCARR,LINKNO,XD1,XD2,IDATE,INDX FRQS,IFRQ TOTAL,+ TSITE,*350,*100) -- --
GOTO 500
900 CONTI NUE
WRITE(l,*) 'SYNTAX ERROR IN TAPE'GOTO 999
1098 WRITE (l,'C'READ ERROR #",15)1) lOSGOTO 999
5000 WRITE (1,1 ("Error #",15, II OPENi ng index fi 1ell) I) lOS
999 CONTI NUECALL CLSVM
STOP
1000 WRITE (l,'("ERROR #1,15,"0PENING VALIND")') lOSSTOP
81

1001 WRITE (l,'("ERROR #1,15,"0PENING VALTMplI)I) lOSSTOP
1002 WRITE (l,'("ERROR #1,15,"READING FROM VALTMplI)I) lOSSTOPEND
$EMA IIONISUBROUTINE GETLN(LC,CIRCARR,LINKNO,XD1,XD2,IDATE,INDX FRQS,+ IFRQ__TOTAL,TSITE,*,*) --
C*********************************************************************
FORTRAN 77
FI LE NAME:HID:LANGUAGE:
PURPOSE
CHANGE HISTORY
SUBPROGRAM USAGE
TECHNICAL INFORMATION
MANAGEMENT INFORMATION
This routine reads an 80 character from tape
SYSTEM NAME: VALDPRLOAD MODULE: GETLNCPU TYPE: HP1000COMPILER VERSION: FORTRAN 77
CCCCCCCCC*********************************************************************CCCCCC*********************************************************************CCCC See purpose.CC*********************************************************************CCCC*********************************************************************CCCC*********************************************************************CC MNEMONIC LISTINGCC PARAMETERS:C LC - character string read from tapeC CIRCARR - array of ci rcuit idsC LINKNO - circuit numberC XD1 - circuit latitutdeC XD2 - circuit longitudeC IDATE - dateC INDX FRQS - frequencies in data baseC IFRQ--TOTAL - total number of frequenciesC TSITE - xmtr site nameC
82

C COMMON BLOCKS:$Include /voa/valsum/calc/ionema$INCLUDE NUM$INCLUDE VALUES
COMMON /TSTUF/ TBLOC,IREC,ITB,ITLU,IEOF,IBFCC*********************************************************************C*********************************************************************C EXECUTABLE CODEC*********************************************************************C
CHARACTER*80 TBLOC(128), IFMT*80, TSITE*4INTEGER*4 CIRCARR(400)CHARACTER*79 LCINTEGER IDATE(14),INDX-fRQS(12)
IREC=IREC+1
IF(IREC.GT.IBF) THEN
READ(ITLU,END=987,ERR=50) TBLOC
50 LEN = ITLOG()
IBF = LEN/80
IREC=l
! HP function to tell how many characters from READ
ENDIF
100 LC=TBLOC(IREC) (2:80)
C The •METHOD 20 1,1 i ne i ndi cates the start of an output page
IF(LC(33:41).EQ.'METHOD 20 1) RETURN 1
C The 'COMMENT· line indicates the start of the COMMENTs from IONCAP
IF( LC(1:?) .EQ. 'COMMENT· ) RETURN 2
RETURN
987 CONTI NUE
C Write circuit index file
WRITE (99,'(7A2,lA1)')(IDATE(I),I=1,8)WRITE (99,'(F6.2,X,F7.2)') XD1, XD2WRITE (99,1(215)1) LINKNO, IFRQ TOTALWRITE (99,1(413)1) ISTAM, IENDAM, ISTPM, IENDPMWRITE ( IFMT ,101) IFRQTOTAL
101 FORMAT C (I ,II, 114) 1)-WRITE (99,IFMT) (INDX-fRQS(I),I=l,IFR~TOTAL)
83

! HP routine to close VMA file
+END DOCALL CLSVMCLOSE (99)
DO I=l,LINKNOWRITE (99,'(A4,I5,F6.1,2X,F7.1)')TSITE(1:4),CIRCARR(I),BEAR(I),
DIST( I)
STOP 'EOF'1000 WRITE (LUT,I(IIERROR #11,15,11 OPENING VALIND II ) I) lOS
STOP1001 WRITE (LUT,I("ERROR #",15," OPENING VALTMplI)I) lOS
STOP1002 WRITE (LUT,'("ERROR #",15," READING FROM VALTMp lI )') lOS
ENDBLOCK DATA
COMMON /TSTUF/ TBLOC,IREC,ITB,ITLU,IEOF,IBF$INCLUDE NUM
CHARACTER*80 TBLOC(128)
DATA IREC/O/ ,ITB/O/ ,ITLU/7/ ,IEOF/O! ,IBF/O/
DATA NUM-?ARAM /4/, NUM~ON /4/, NUM__SSN /2/
END
$EMA /ION/SUBROUTINE WR DAT( IPARAM,IFREQ,IHR,IMON,ISSN,ICKT,IVALUE,
+ IFRQJOTAL)-
C*********************************************************************
FORTRAN 77
FI LE NAME:HID:LANGUAGE:
MANAGEMENT INFORMATION
SYSTEM NAME: VALDPRLOAD MODULE: WR OATCPU TYPE: HP100lJCOMPILER VERSION: FORTRAN 77
CCCCCCCCC*********************************************************************
PURPOSE
TECHNICAL INFORMATION
Locate the correct location in the IVALDT file to write the parameter'svalue. By using a single dimensioned file the program can make use ofa variable number of f~equencies
(IFRQ_TOTAL) and hours (NUM_HRS).
ccCCCCCCC*********************************************************************CC
84

CC See purpose.CC*********************************************************************CC SUBPROGRAM USAGECC NoneCC*********************************************************************CC CHANGE HISTORYCC*********************************************************************
whose value is to be written to IVALDT
MNEMONIC LISTING
no. of the parameter- frequency number- hour number- month numbe r- sunspot number- ci rcuit number- value of parameter to be written
PARAMETERS:IPARAMIFREQIHRIMONISSNICKTIVALUE
CCCCCCCCCCCCC COMMON BLOCKS:$Include /voa/valsum/calc/ionema$INCLUDE NUMCC*********************************************************************C*********************************************************************C EXECUTABLE CODEC*********************************************************************C
INTEGER*4 IREC,DCKTNUM FQ = 12DCKT = ICKTIREC = IPARAM+NUM PARAM*( (IFREQ - 1)+NUM FQ*( (IHR - 1) +
& NUM HRS*(TIMON - 1) + NUM~ON*( (TSSN - 1) + NUM_SSN*(& (DCKT - 1) )))))
IVALDT(IREC) = IVALUE
RETURN
END$EMA /ION/
SUBROUTI NE RD_I NDX (DBNAME, IFRQ_TOTAL, INDXJRQS)C
LOGICAL EXIST, VALIDCHARACTER DBNAME*4, DBASE*4? IDUMMY*1INTEGER*2 HRS(24), INDXJRQS(12)
C
85

C*********************************************************************
This subroutine reads the index file which contains a description of all ofthe VALSUM data bases and determines if the new data is part of anotherdata base.
FORTRAN 77
FI LE NAME:HID:LANGUAGE:
PURPOSE
MANAGEMENT INFORMATION
SYSTEM NAME: VALSUMLOAD MODULE: RD INDXCPU TYPE: HPIOoCfCOMPILER VERSION: FORTRAN 77
CCCCCCCCC*********************************************************************CCCCCCCc*********************************************************************cC TECHNICAL INFORMATIONCC See purpose.CC*********************************************************************CC SUBPROGRAM USAGECC*********************************************************************CC CHANGE HISTORY
~*********************************************************************MNEMONIC LISTING
PARAMETERS:DB NAME - name of data base for new dataIFRQ TOTAL - total number of configurationsINDX FRQS - frequenci es in data base
cCCCCCCCC COMMON BLOCKS:C$INCLUDE LU$INCLUDE INDX NUM$INCLUDE INDX-VALUES$INCLUDE NUM--$1 NCLUDE VALUESCC*********************************************************************C*********************************************************************C EXECUTABLE CODEC*********************************************************************C
EXIST = .FALSE.
86

OPEN (22,FILE='VALND2::VM ' ,ERR=1000,IOSTAT=IOS,USE='NONEXCLUSIVE')OPEN (23,FILE='VALTMP::VM ' ,ERR=1001,IOSTAT=IOS,USE='NONEXCLUSIVE ' )
C5 DO 10 1=1,3
READ (22,'(Al)',END=100) IDUMMY10 CONTINUEC
READ (22,'(A4,2X,A4,2X,A8,2X,A4,3X,Il,2X,F5.1,IX,F5.1,IX,F5.1,IX,+ F7.1,IX,F7.1)') DBASE,XXSITE,ANTNAME,NLANG,NVALID,ZBEAR,+ BAZM,EAZM,BDST,EDST
DO 20 1=1,5READ (22,1 (Al)') IDUMMY
20 CONTINUEREAD (22,I(I2,X,I2,IX,I2,X,I2,3X,I2,3X,AI2,F7.1,X,F8.1)')
+ IBEGHRA,IENDHRA,IBEGHRP,IENDHRP,N__CONF,IND__DATE,TLAT,TLONGC
CCALL HOURS( IBEGHRA, IENDHRA, IBEGHRP, IENDHRP ,HRS, tLHRS)
DO 25 I = 1,3READ (22,'(Al)') IDUMMY
25 CONTINUEDO 30 I = I,N CONF
READ(22,1 (T5,5X,I2,5X,I2,3X,I3,4X,I5,5X,I5) I ,END=22,ERR=21)+ (NEWCONF(I,J),J=I,6)
30 CONTINUEIF (DBASE .EQ. DBNAME) THEN
EXIST = .TRUE.CALL MATCH (VALID)IF (.NOT. VALID) THEN
WR ITE (l, I (IIData base parameters and tape parameters do not II,+ II match - PROGRAM ABORTED II )')
STOPENDIF
C Determine if duplicate frequenciesDO L = I,NUM CONFDO J = I,N CONFIF (ICONFIG(L,I) .EQ. NEWCONF(J,I)) THENWRITE (1, I (IIDUPLICATE FREQUENCY - PROGRAM ABORTED II ) I)STOPENDIFEND DOEND DO
C Determine if too many frequenciesIFRQ TOTAL = NUM CONF + N CONFIF (TFRQ TOTAL .GT. 12) THEN
WRITE--(I,'(IIToo many frequencies - PROGRAM ABORTEDII)I)STOP
ELSEC Set frequency ~efaults
J = 0DO K = N CONF+l,IFRQ TOTALJ = J + T -NEWCONF(K,I) = ICONFIG(J,I)END DO
87

-------
DO K = 1,IFRQ TOTALINDX FRQS(K) 7 NEWCONF(K,l)END DO
C Write new data to indx fileCALL WRITE NEW INDX(DBNAME,NEWCONF,IFRQ TOTAL)
ENDIF ! addi ng-to data base -ELSE
C Write old dataCALL WRITE OLD INDX (DBASE)
ENDIFGOTO 5
100 IF (.NOT. EXIST) THENC Write new data to index file
CALL WRITE NEW INDX(DBNAME,ICONFIG,NUM CONF)IFRQ TOTAL-= NUM CONF -DO K-= 1,IFRQ TOTALINDX FRQS(K) ~ ICONFIG(K,l)
END 00-ENDIFCLOSE(22)CLOSE(23)RETURN
1000 WRITE (1,1 ("ERROR #",15," OPENING VALIND")I) lOSSTOP
1001 WRITE (1,1 ("ERROR #",15," OPENING VALTMplI)I) lOSSTOP
21 WRITE (1,1 ("ERROR #",15," READING FROM VALIND")I) lOSSTOP
22 WRITE (1, I("EOF READING FROM VALIND") I)STOPENDSUBROUTINE WR ITE_NEW_I NDX (DBNAME, NEWCONF , IFRCLTOTAL)
C
FORTRAN 77
FILE NAME:HID:LANGUAGE:
PURPOSE
TECHNICAL INFORMATION
MANAGEMENT INFORMATION
SYSTEM NAME: VALDPRLOAD MODULE: WRITE NEW INDXCPU TYPE: HPlOOOCOMPILER VERSION: FORTRAN 77
CHARACTER IDUMMY*l, DBNAME*4INTEGER NEWCONF(12,6)
C*********************************************************************CCCCCCCCC*********************************************************************CCCC This subroutine writes the index file for the VALSUM program withC information for a new file.Cc*********************************************************************CC
88
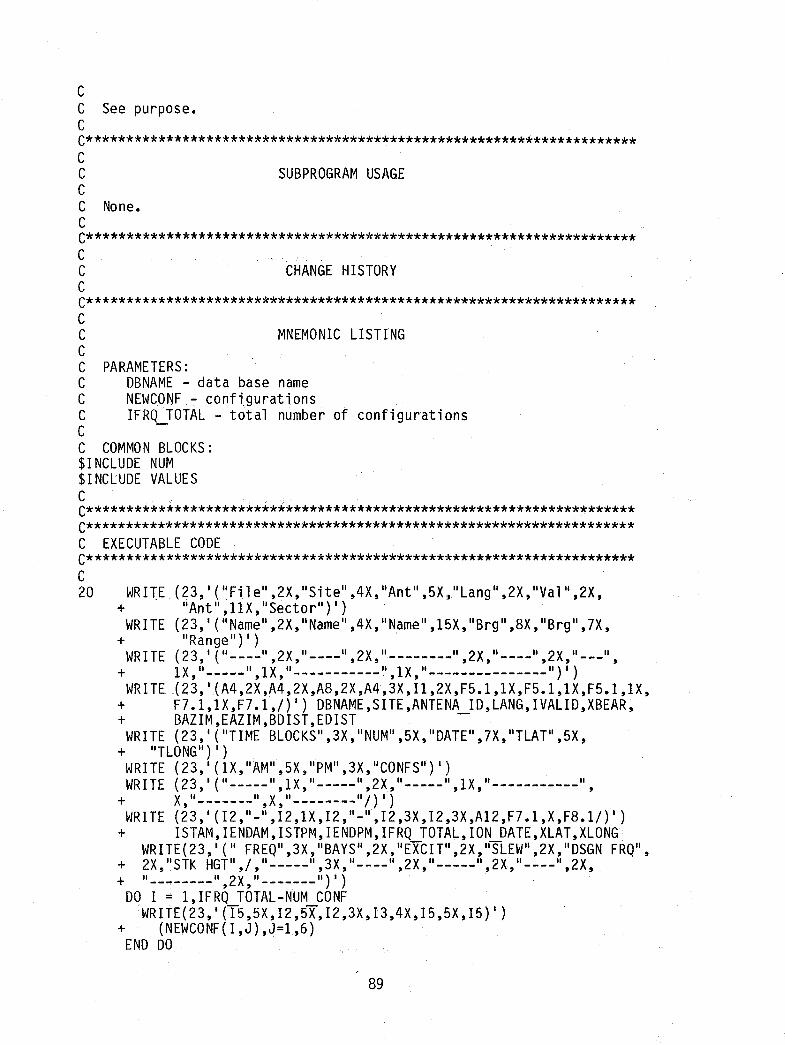
CC See purpose.CC*********************************************************************CC SUBPROGRAM USAGECC None.CC*********************************************************************
CHANGE HISTORY
MNEMONIC LISTING
of configurations
PARAMETERS:DBNAME - data base nameNEWCONF : configurationsIFR~TOTAL - total number
CCCC*********************************************************************CCCCCCCCC COMMON BLOCKS:$INCLUDE NUM$1 NCLUDE VALUESCC*********************************************************************C*********************************************************************C EXECUTABLE CODEC*********************************************************************C20 WRITE (23, I ("Fi.l e" ,2X, "Site" ,4X, "Ant" ,5X:, II Langll ,2X,uVal" ,2X,
+ IAnt l ,llX,ISector")I)WRITE (23,1 (INamel,2X,INamel,4X,INamel,15X,IBrgl,8X,"Brg",7X ,
+ "Range") I)WRITE (23,1 (" 1,2X,I 1,2X,I 1,2X,I ",2X,I ",
+ 1X,I-----",lX,I-----------I,lX,"---------------")I)WR ITE( 23, '(A4 ,2X ,A4, 2X ,A8 ,2X ,A4,3X, 11 ,2)( ,F5.1, IX, F5.1, IX ,F5.1, IX,
+ F7.1,lX,F7.1,j)') DBNAME,SITE,ANTENA ID,LANG,IVALID,XBEAR,+ BAZIM,EAZIM,BDIST,EDIST --
WRITE (23,' ("TIME BLOCKSI ,3X,INUW,5X,IDATEI ,7X,ITLAT",5X,+ "TLONG") I) .... .
WRITE (23, I(lX,IAM" ,5X,"PW ,3X,"CONFS 1f) I)
WRITE (23,1 (1-----I,lX,I-----1,2X,"-----I,lX,I-----------",+ X,I-------",X,I--------"j)I)
WR ITE (23,' (12, II -" , I2,1 X, I2, II -" , I2, 3X , 12 ,3X ,A12, F7.1, X, F8 .11) I )+ ISTAM,IENDAM,ISTPM,IENDPM,IFRQ TOTAL, ION DATE,XLAT,XLONG
WRITE(23, I(" FREQ" ,3X, "BAYS" ,2X, "EXCIT" ,2X, "SLEW" ,2X, "DSGN FRQ",+ 2X "STK HGT" j "-----" 3X "----" 2X "-----" 2X "----" 2X, " " " " "+ 1__ ... 1,2X,I ")I)
DO I = 1,IFRQ TOTAL-NUM CONFWRITE(23,' (T5,5X,12,5X,12,3X,13,4X,15,5X,15) I)
+ (NEWCONF( I ,J) ,J=1,6)END DO
89

DO I = 1,NUM CONFWRITE(23,'~I5,5X,I2,5X,I2,3X,I3,4X,I5,5X,I5)1)
+ (ICONFIG(I,J),J=1,6)END DORETURN
CENDSUBROUTINE WRITE__OLD__INDX(DBASE)
CCHARAcTER IDUMMY*l, DBASE*4
C*********************************************************************
This subroutine writes the data which was previously in the index file.
FORTRAN 77
FI LE NAME:HID:
LANGUAGE:
PURPOSE
SUBPROGRAM USAGE
TECHNICAL INFORMATION
MANAGEMENT INFORMATION
SYSTEM NAME: VALDPRLOAD MODULE: WRITE OLD INDXCPU TYPE: HPIOOOCOMPILER VERSION: FORTRAN 77
CCCCCCCCC*********************************************************************CCCCCC*********************************************************************CCCC See purpose.CC*********************************************************************CCCC None.CC*********************************************************************
CHANGE HISTORYCCCC********k************************************************************CC MNEMONIC LISTINGCC PARAMETERS:C None.CC COMMON BLOCKS:$INCLUDE INDX NUM$INCLUDE INDX--VALUESC --C*********************************************************************C*********************************************************************
90

(23,'("F;le",2X,"S;te",4X,"Ant",5X~"Lang",2X,"Val",2X,
"Ant" ,1lX, "Sector")')(23,1("Name",2X,"Name"~4X,IIName",15X,IIBrg",8X,IIBrg",7X,
"Range")')(23 '("----",2x "----" 2X "--------" 2X "----" 2X 11---", . , " "",lX,"-----II,IX,"-----------",IX,"---------------")')(23,'(A4~2X,A4,2X,A8,2X,A4,3X,Il,2X,F5.1,IX,F5.1,IX,F5.1,IX,
F7.1,IX,F7.1,/)') DBASE,XXSITE,ANTNAME,NLANG,NVALID,ZBEAR,BAZM,EAZM,BDST,EDST
WRITE (23,'("TIME BLOCKS",3X,IINUM lI ,5X,"DATE",7X,"TL.AT",5X,+ "TLONGII) I)
WRITE (23,'(IX,"AM II ,5X,"PM",3X,"CONFS")')WRITE (23,1 (1I-----",IX,"-----",2X,"-----",IX,"-----------",
+ X,"-------II,X,II--------"/)I)WR ITE (23, I (I 2, II -" , I2,IX, 12 , II - II , I2,3X, 12 ,3X,A12 , F7•1,X,F8. 11 ) I )
+ IBEGHRA,IENDHRA,IBEGHRP,IENDHRP,N CONF,IND DATE,TLAT,TLONGWRITE(23, I(II FREQII ,3X, "BAYS" ,2X, "Excffll ,2X, II SLEW ,2X, IIDSGN FRQII,
+ 2X,uSTK HGTII,I ,11-----" ,3X,II----" ,2X,II-----'. ,2X,II----" ,2X,+ "--------",2X,"-------II)')
DO I = 1, NCONFWR ITE (23";'"' (15,5X, 12 ,5X, 12 ,3X, 13 ,4X,15,5X~ 15) I)
+ (NEWCONF(I,J),J=I,6)END DORETURN
WRITE+
WRITE+
WRITE+
WRITE++
C EXECUTABLE CODEC*********************************************************************C20
CENDFUNCTIONIFREQJOC (IFRQ, IFRtLTOTAL, INDXJRQS)
c
This routine determines where the frequenc;les run with IONCAP arestored in the data base.
FORTRAN 77
FI LE NAME:HID:LANGUAGE:
PURPOSE
MANAGEMENT INFORMATION
SYSTEM NAME: VALDPRLOAD MODULE:CPU TYPE: HPI000COMPILER VERSION: FORTRAN 77
INTEGER IFRQS(12),INDX FRQS(12)C*********************************************************************CCCCCCCCC*********************************************************************CCCCCCC**********~**********************************************************
CCCC See purpose.C
TECHNICAL INFORMATION
91
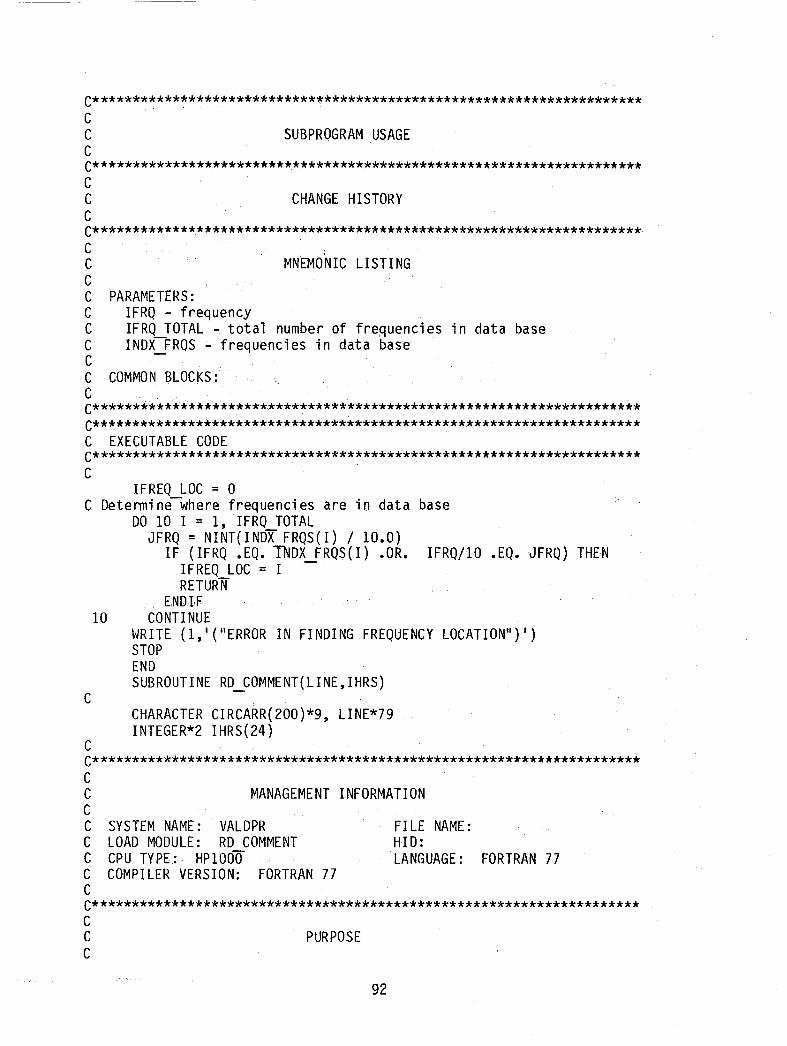
C****************************~****************************************
cC SUBPROGRAM USAGECC*********************************************************************CC CHANGE HISTORYCC*********************************************************************
in data base
MNEMONIC LISTING
PARAMETERS:IFRQ - frequencyIFRQ TOTAL - total number of frequenciesINDX FRQS - frequencies in data base
CCCCCCCCC COMMON BLOCKS:C ..C*********************************************************************C*********************************************************************C EXECUTABLE CODEC*********************************************************************C
C
IFREQ LOC = 0C Determine--where frequencies are in data base
DO 10 I = 1, IFRQ TOTALJFRQ = NINT( I NDX FRQS(I) / 10.0)
IF (IFRQ .EQ. TNDX FRQS(I) .OR. IFRQ/IO .EQ. JFRQ) THENIFREQ LOC = I --RETURN
ENDIF10 CONTINUE
WRITE (l,'("ERROR IN FINDING FREQUENCY LOCATION")')STOPENDSUBROUTINE RD__COMMENT(LINE,IHRS)
CHARACTER CIRCARR(200)*9, LINE*79INTEGER*2 IHRS(24)
CC*********************************************************************
FORTRAN 77
FI LE NAME:HID:LANGUAGE:
PURPOSE
MANAGEMENT INFORMATION
SYSTEM NAME: VALDPRLOAD MODULE: RD COMMENTCPU TYPE.: HP1000COMPILER VERSION: FORTRAN 77
CCCCCCCCC*********************************************************************CCC
92

C This subrout i nereads the comments from the IONCAP tape.CC*********************************************************************CC TECHNICAL INFORMATIONCC See purpose.CC*********************************************************************CC SUBPROGRAM USAGECC GETLN - reads a line of data from the IONCAP tape - line 59.CC*********************************************************************CC CHANGE HISTORYCC*********************************************************************CC MNEMONIC LISTINGCC PARAMETERS:C NoneCC COMMON BLOCKS:C$1 NCLUDE NUM$INCLUDE VALUESCC*********************************************************************C*********************************************************************C EXECUTABLE CODEC*********************************************************************C
KOUNT = 0CC Decode 1st comment line
GOTO 105 CALL GETLN (LINE,CIRCARR, LINKNO,XDI ,XD2, IDATE ,*100,*10)10 IF (LINE{11:14) .EQ. 'DATE ' ) THENC Read date
ION DATE{I:12) = LINE{21:32)C Read xmtr--site name and coordinates
ELSE IF (LINE{II:18).EQ.'TRANSMIT ' ) THENSITE(I:4) = LINE{31:34)READ (LINE{47:55),'{F9.5)') XLATREAD (LINE(67:76),'(FI0.5)') XLONG
. C Read antenna name, validation type, bearing, and number of configuratiqnsELSE IF (LINE(l1:20) .EQ. 'ANTENNA 10 1
) THENANTENA 10(1:8) = LINE(22:29)READ (TINE(46:46), I( II) I) IVALIDREAD (LINE(61:65),'(F5.1)') XBEARREAD (LINE(79:79),'{Il)') NUM__CONF
93

C Read configuration - frequency, number of bays, excitation, slew angleELSE IF (LINE(11:17) .EQ. 'ANTENNA ' ) THEN
KOUNT = KOUNT + 1READ (LINE(23:27),'(I5)') ICONFIG(KOUNT,l)READ (LINE(34:35),' (12)') ICONFIG(XOUNT ,2)READ (LINE(42:43),'(I2)') ICONFIG(KOUNT,3)READ (LINE(50:52),'(I3)') ICONFIG(KOUNT,4)READ (LINE(63:67),'(I5)') ICONFIG(KOUNT,5)READ (LINE(74:78),'(15)') ICONFIG(KOUNT~6)
C Read AM and PM starting and; endi ng hoursELSE IF (LINE(11:19) .EQ. 'STARTHRAM ' ) THEN
READ (LINE(21:22),'(I2)') ISTAMREAD (LINE(33:34),'(I2)') IENDAMREAD (LINE(47:48),'(I2')'') ISTPMREAD (LINE(59:60),'(I2)') IENDPM
CALL HOURS( ISTAM, IENDAM, ISTPM, IENDPM, IHRS, NUM~RS)
C Read language name ' _ELSE IF '(LINE(11:18) .EQ. 'LANGUAGE') THEN
LANG = LINE(31:34)C Read sector beginning and ending distance and azimuth
ELSE IF (LINE(l1:16) .EQ. 'SECTOR') THENREAD (LINE(32:36),'(F5.1)') BAZIMREAD (LINE (40:44),'(F5.1)') EAZIMREAD (LINE(56:62),'(F7.1)') BDISTREAD (LINE(66:72),'(F7.1)') EDIST
ENDIFC i ~
GOTO 5100 RETURN
ENDSUBROUTINE'MAfCH(VALID)
CLOGICAL VALID
FORTRAN 77
FILE NAME:HID:LANGUAGE:
PURPOSE
MANAGEMENT INFORMATION
SYSTEM NAME: VALDPRLOAD MODULE: MATCHCPU TYPE: HP1000COMPILER VERSION: FORTRAN 77
CC*********************************************************************CCCCCCCCC*********************************************************************CCCC This subroutine determines if the new tape and an existing data ba$e match.Cc*********************************************************************CC TECHNICAL INFORMATION
94

MNEMONIC LISTING
PARAMETERS:VALID - set to true if tape and data base match
C"C See purpose.CC*********************************************************************CC SUBPROGRAM USAGECC*********************************************************************CC CHANGE HISTORYCC*********************************************************************CCCCCCC COMMON BLOCKS:C$INCLUDE NUM$1 NCLUDE VALUES$INCLUDE INDX NUM$INCLUDE INDX--VALUESC -- .C*********************************************************************C*********************************************************************C EXECUTABLE CODEC*********************************************************************C
cVALID = •FALSE.
IF (SITE .EQ. XXSITE .AND. NINT(XLAT) .EQ. NINT(TLAT) .AND.+ ISTAM .EQ. IBEGHRA .AND. IENDAM .EQ. lENDHRA .AND. ISTPM .EQ.+ IBEGHRP.AND. IENDPM .EQ. IENDHRP .AND. NINT(XLONG) .EQ.+ NINT(TLONG) .AND. ANTENA 10 .EQ. ANTNAME .AND. IVALID .EQ.+ NVALID .AND. NINT(XBEAR)--.EQ. NINT(lBEAR) .AND. LANG .EQ. NLANG+ .AND. BAlIM .EQ. BAlM .AND. EAlIM .EQ. EAlM .AND. BDIST .EQ.+ BDST .AND. EDIST .EQ. EDST .AND. NUM HRS .EQ. fU1RS) THEN
cC Data base name is VALID
VALID = .TRUE.ENDIF
CRETURNENDSUBROUTINE VAL__HOUR (IHOUR,NEW__LOC,IHRS,NHRS)
CINTEGER IHRS(24)
C*********************************************************************CC MANAGEMENT INFORMATIONCC SYSTEM NAME: VALDPR FILE NAME:
95

This routine determines where the hours run with IONCAP are stored in thedata base.
FORTRAN 77HID:LANGUAGE:
PURPOSE
TECHNICAL INFORMATION
FORTRAN 77
LOAD MODULE:CPU TYPE: HPI000COMPILER VERSION:
CCCCC*********************************************************************CCCCCCC*********************************************************************CCCC See purpose.CC*********************************************************************
CHANGE HISTORY
SUBPROGRAM USAGE
MNEMONIC LISTING
PARAMETERS:ISTRT - starting hour of hour looplEND - ending hour of hour loopLOOPBEG - location,tobegin hour loop in data baseLOOPEND -location to end. hour loop in data base
CCCC*********************************************************************CCCC*********************************************************************CCCCCCCCCC COMMON BLOCKS:CC***********************.******.****************************************C****************************************.*****************************C EXECUTABLEtODEC*****************************************************.****************CC
10
C
C
Determine number of hours to be calculatedDO 10 I = I,NHRS
IF (IHOUR .EQ. IHRS(I)) THENNEW LOC = I
ENDIFCONTINUERETURNENDSUBROUTINE HOURS (ISTAM, IENDAM, ISTPM, IENDPM, IHRS, NUMHRS)
INTEGER IHRS(24)
96
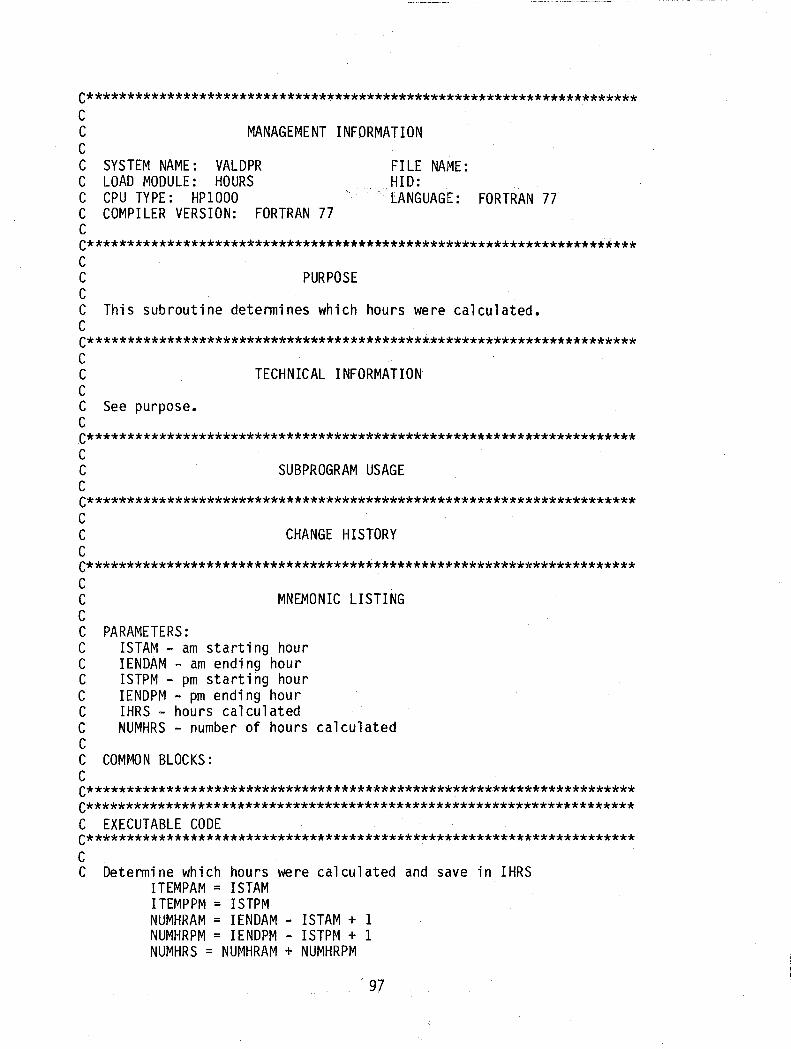
C*********************************************************************
This subroutine determines which hours were calculated.
FORTRAN 77
FILE NAME:HID:LANGUAGE:
calculated
PURPOSE
CHANGE HISTORY
MNEMONIC LISTING
SUBPROGRAM USAGE
TECHNICAL INFORMATION
MANAGEMENT INFORMATION
PARAMETERS:ISTAM - am starting hourIENDAM - am ending hourISTPM - pm starting hourIENDPM - pm ending hourIHRS ~ hours calculatedNUMHRS - number of hours
SYSTEM NAME: VALDPRLOAD MODULE: HOURSCPU TYPE: HPIOOOCOMPILER VERSION: FORTRAN 77
CCCCCCCCC*********************************************************************CCCCCC*********************************************************************CCCC See purpose.CC*********************************************************************CCCC*********************************************************************CCCC*********************************************************************CCCCCCCCCCCC COMMON BLOCKS:CC*********************************************************************C*********************************************************************C EXECUTABLE CODEC*********************************************************************CC Determine which hours were calculated and save in IHRS
ITEMPAM = ISTAMITEMPPM = ISTPMNUMHRAM = IENDAM ISTAM + 1NUMHRPM = IENDPM ISTPM + 1NUMHRS = NUMHRAM + NUMHRPM
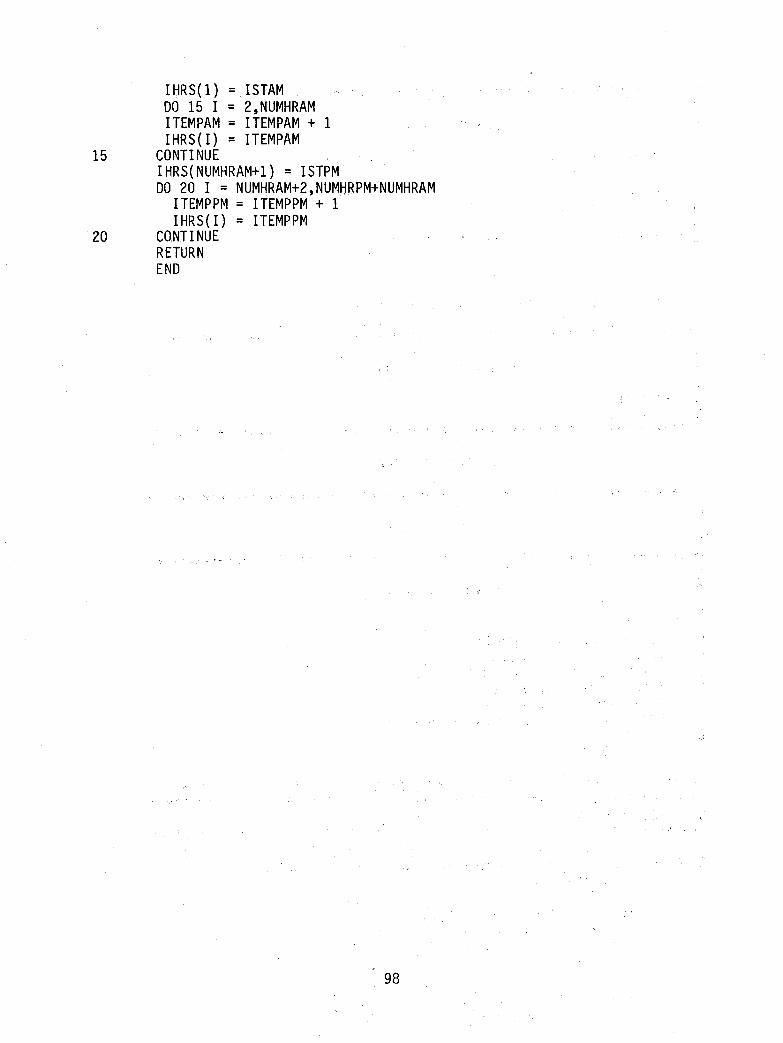
IHRS(l) = ISTAMDO 15 I = 2,NUMHRAMITEMPAM = ITEMPAM + 1IHRS(I) = ITEMPAM
15 CONTINUEIHRS(NUMHRAM+1) = ISTPMDO 20 I :: NUMHRAM+2,NUMHRPM+NUMHRAM
ITEMPPM = ITEMPPM + 1IHRS(I) = ITEMPPM
20 CONTINUERETURNEND
98

APPENDIX D. EXAMPLE DIALOG BETWEEN PROGRAM VALSUM AND A U~ER
Institute for Telecommunication Scientes
Ionospheric Communications Analysis and Prediction ProgramVALSUM
Voice of AmericaVersion 1.0
Wed 04 Mar 1987 13:13:49
Data set name. (must be 6 alpha characters)Entering an existing data set name will cause the program. to use the data setfor default values and to replace it with new data.Entering a new data name will cause the program to use program defined defaults
and to create a new data setData set name ? TESTS2
Choose from the menu:H = HelpD = Program DescriptionC =.Concise DiaJogV = Ve rbose Oi alogE = Edi t Data' .S = Su'mmary of' DataP = Process Last Data Set EnteredQ = Quit
~1enu (Verbose)?
DATA BASE PARAMETERS
Transmitter site nameTNGR = Tangi erUDRN = UdornPTRC = Puerto RicoCRSN = Sri LankaBTSW = Botswana
1) Transmitter site name (MIDB)?
Language area used for IONCAP executionThe first four characters of the language are entered; for example,
PO LI = Po 1ishENGL = English
2) Language area (UKR1)?
99

LowestBoresi ght Oper Design Elem Horiz
Ant Valid Bearing Freq Freq Ht Excite SlewName Level (deg EofN) (MHz) (MHz) (m) Bays Mode (deg)
1) SRMODE2 1 352.0 7.20 8.75 17.13 4 4 011.85 8.75 17.13 4 1 015.35 19.00 7.89 4 4 021.65 19.00 7.89 4 4 06.07 8.75 17.13 4 10 09.70 8.75 17 .13 4 4 0
13.70 19.00 7.89 4 10 017.72 19.00 7.89 4 4 025.88 19.00 7.89 4 1 0
Transmitter antenna number is to be chosen from the list of available IONCAP data3) Transmitterantenl1a (I)?
Circuit selection optionL = Broadcast language: all circuits of a particular language are chosen
from the TEST POINT data baseS = Sector: The points contained within a specified range
of azimuth and distance are chosen4) Circuit selection option (Language)?
Broadcast languageLanguage area to be studied is specified. This area may be a subset of the languagearea specified in IONCAP for the chosen antenna. The four character code oflanguage is entered. Any points that do not have data will be displayed.5) Language (UKR1)?
Modify TEST POINT 10 listA = AddC = Changeo = DeleteL = ListN = No change
10) TEST POINT 10 list (A)? LTEST POINT ID(s) Bearing Range
(deg E of N) (km)1) 10122 355.8 1524.22) 10110 344.4 1672.23) 10136 347.9 1765.44) 10138 .1 1741.65) 10139 4.4 1792.76) 10137 354.6 1807.07) 10384 .7 1880.78) 10109 341.3 2046.19) 10074 335.0 2170.8
10) 10131 346.6 2006.011) 10014 335.4 2265.512) 10347 7.9 2044.613) 10135 3.8 2025.114) 10134 359.6 2019.515) 10133 355.4 2027.9
100
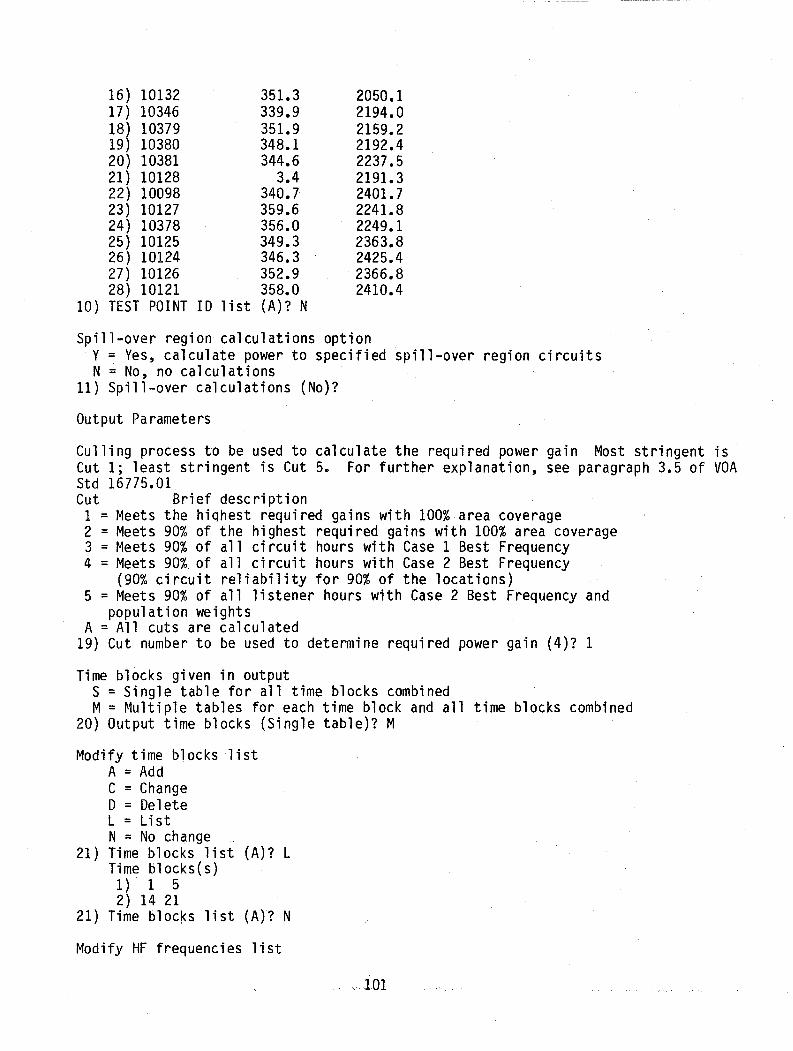
16) 10132 351.3 2050.117) 10346 339.9 2194.018) 10379 351.9 2159.219) 10380 348.1 2192.420) 10381 344.6 2237.521) 10128 3.4 2191.322) 10098 340.7 2401. 723) 10127 359.6 2241.824) 10378 356.0 2249.125) 10125 349.3 2363.826) 10124 346.3 2425.427) 10126 352.9 2366.828) 10121 358.0 2410.4
10) TEST POINT ID 1i st (A)? N
Spill-over region calculations optionY = Yes, calculate power to specified spill-over region circuitsN = No, no calculations
11) Spill-over calculations (No)?
Output Parameters
Culling process to be used to calculate the required power gain Most stringent isCut 1; least stringent is Cut 5. For further explanation, see paragraph 3.5 of VOAStd 16775.01Cut Brief description1 = Meets the hiqhest required gains with 100% area coverage2 =Meets 90% of the highest required gains with 100% area coverage3 = Meets 90% of all circuit hours with Case 1 Best Frequency4 = Meets 90% of all circuit hours with Case 2 Best Frequency
(90% circuit reliability for 90% of the locations)5 = Meets 90% of all listener hours with Case 2 Best Frequency and
population weightsA = All cuts are calculated
19) Cut number to be used to determine required power gain (4)? 1
Time blocks given in outputS = Single table for all time blocks combinedM= Multiple tables for each time block and all time blocks combined
20) Output time blocks (Single table)? M
Modify time blocks listA = AddC = ChangeD = DeleteL = ListN = No change
21) Time blocks list (A)? LTime blocks(s)
1) 1 52) 14 21
21) Time blocks list (A)? N
Modify HF frequencies list
101

A = AddD = DeleteL = Li stN = No change
22) Transmitter frequency (N)? LFrequencies
1) 7.202) 11.853) 15.354) 21.655) 6.076) 9.707.) 13.708) 17.729) 25.88
22) Transmitter frequency (N)? DFrequency? 5
22) Transmitter frequency (N)?
Number of transmitter frequencies to be considered per time block1 = Singl e frequency per time block (only the best frequency is pri nted)2 = Two frequencies per time block (the best and second best frequencies are
printed)23) Number of frequencies per time block (I)? 2
Calculate and output supplemental plots and table.s24) Output supplemental plots and tables (No)? Y
Identification to be printed on output tables and plots(up to 20 characters)
25) VALSUM identification (NEW_VALSUM.:....TEST)?
Modi fy sunspot number 1istA = AddD = DeleteL = Li stN = No change
26) Sunspot number (N)? LSunspotnumber(s)1) 10.002) 120.0
26) Sunspot number (N)? N
Modify month listA = AddD = Del eteL = Li stN = No change
27) Month number (N)? LMonth(s)
1) January2) April3) July4) October
102

27) Month numbe~ (N)? N
Do you want a summary of the input data (Y or N)? Y
VALSUM SUMMARY
DATA BASE PARAMETERS1) Transmitter site name: MIOB2) Language area: UKR13) Transmitter antenna: 14) Circuit selection option: Language5) Language: UKR110) TEST POINT 10 list:
TEST POINT IO(s) Bearing Range(deg E of N) (km)
1) 10122 355.8 1524.22) 10110 344.4 1672.23) 10136 347.9 1765.44) 10138 .1 1741.65) 10139 4.4 1792.76) 10137 354.6 1807.07) 10384 .7 . 1880.78) 10109 341.3 2046.19) 10074 335.0 2170.8
10) 10131 346.6 2006.011) 10014 335.4 2265.512) 10347 7.9 2044.613) 10135 3.8 2025.114) 10134 359.6 2019.515) 10133 355.4 2027.916) 10132 351.3 2050.117) 10346 339.9 2194.018) 10379 351.9 2159.219) 10380 348.1 2192.420) 10381 344.6 2237.521) 10128 3.4 2191. 322) 10098 340.7 2401.723) 10127 359.6 2241.824) 10378 356.0 2249.125) 10125 349.3 2363.826) 10124 346.3 2425.427) 10126 352.9 2366.828) 10121 358.0 2410.4
11) Spill-over calculations: No
Output Parameters19) Cut number to be used to determine requi red power gai n: 120) Output hours: Multiple table21) Time blocks(s):
1) 1 52) 14 21
22) Transmitter frequency:Frequency Band(s):
103

1) 7.202) 11.853) 15.354) 21.655) 6.07 deleted6) 9.707) 13.708) 17.729) 25.88
23) Number of frequencies per time block:24) Output supplemental plots and tables:25) VALSUM identification:26) Sunspot number(s):
1) 10.002) 120.0
27) Month number:Month(s):1) January2) April3) July4) October
Do you want to process this data (Y or N)? N
104
2Yes
NEW VALSUM TEST
FORM NTIA-29 U.S. DEPARTMENT OF COMMERCE(4-80) NAT'L. TELECOMMUNICATIONS AND INFORMATION ADMINISTRATION
BIBLIOGRAPHIC DATA SHEET
1. PUBLICATION NO. 2. Gov't Accession No. 3. Recipient's Accession No.
NTIA Report 87-2204. TITLE AND SUBTITLE 5. Publication Date
User's Guide for the HF Broadcast Antenna Design July 1987and Validation Summary Programs 6. Performing Organization Code
NTIA/ITS. S47. AUTHOR(S) 9. Project/Task/Work Unit No.
Eldon J. Haakinson, Susan L. Rothschi 1d, John R. Godwin 91044738. PERFORMING ORGANIZATION NAME AND ADDRESS
National Telecommunications and Information Admin.Institute for Telecommunication Sciences 10. Contract/Grant No.
325 BroadwayBoulder, CO 8030311, Sponsoring Organization Name and Address 12. Type of Report and Period Covered
Voice of America330 Independence Ave, S.W.Washington, D.C. 20547 13.
14. SUPPLEMENTARY NOTES
15. ABSTRACT (A 200-word or less factual summary of most significant information. If document includes a significant bibliography or literaturesurvey, mention it here.)
A series of programs have been developed by the Institute for Telecommunicatio~
Sciences (ITS) that assist the Voice of America (VOA) to plan and operate highfrequency (HF) broadcast stations. The VOA has specific bands available for useand has particular reception areas to cover. Because of the long distance betweenthe broadcast transmitter and the reception areas, the primary mode of communicatio~
is via HF sky wave. Since the ionosphere, which supports HF sky wave, varies withtime of day, season of the year, frequency, and sunspot number, the HF broadcastantenna design and validation summary programs must calculate the best frequencyand the required antenna power gain and pattern for the various conditions thatapply to a particular broadcast scenario. This document will guide the userthrough the use of the programs, provide samples of the input to each program, andgive examples of each program's output.
16. Key Words (Alphabetical order, separated by semicolons)
curtain array antennas; HF broadcast; ionospheric propagation
17. AVAILABILITY STATEMENT 18. Security Class. (This report) 20. Number of pages
IKl UNLIMITED. unclassified 10919. Security Class. (This page) 21. Price:
D FOR OFFICIAL DISTRIBUTION.unclassified
'I< u.s. C\overnment Printing Office: 1980-678·495/529


![[HF] FREEWEIGHT PRODUCTS - HOIST Fitness · [hf] flat bench hf-5163 [hf] 7-position folding f.i.d. bench hf-5167 new! warranty new! warranty [hf] 7-position f.i.d. olympic bench hf-5170](https://static.fdocuments.net/doc/165x107/5b5909d87f8b9ad0048c899a/hf-freeweight-products-hoist-fitness-hf-flat-bench-hf-5163-hf-7-position.jpg)