User's Guide for Business Content Sales
26
BaanBIS Decision Manager 2.0 User’s Guide for Business Content Sales
Transcript of User's Guide for Business Content Sales

BaanBIS Decision Manager 2.0
User's Guide for Business Content Sales

A publication of:
Baan Development B.V.P.O.Box 1433770 AC BarneveldThe Netherlands
Printed in the Netherlands
© Baan Development B.V. 2001.All rights reserved.
The information in this documentis subject to change withoutnotice. No part of this documentmay be reproduced, stored ortransmitted in any form or by anymeans, electronic or mechanical,for any purpose, without theexpress written permission ofBaan Development B.V.
Baan Development B.V.assumes no liability for anydamages incurred, directly orindirectly, from any errors,omissions or discrepanciesbetween the software and theinformation contained in thisdocument.
Document Information
Code: U7557A USGroup: User DocumentationEdition: ADate: March, 2001

i
User's Guide for Business Content Sales
1 Overview of BaanBIS Decision Manager 1-1Definitions, acronyms, and abbreviations 1-4
2 Sales Business Content 2-1The data warehouse content for Sales 2-1Universe data 2-2Analysis area: Sales order process analysis 2-4Analysis area: Sales delivery performance 2-5Dimensions 2-6The OLAP cubes for sales 2-10The Delivery Performance cube 2-10The Sales Order Process cube 2-11
3 Examples of Sales performance analysis 3-1
Table of contents

Table of contents
User's Guide for Business Content Salesii

User's Guide for Business Content Salesiii
BaanBIS Decision Manager is a decision support solution that you can use toextract and analyze key data from your business management system. You canalso use BaanBIS Decision Manager to obtain the information that you need tosupport your decisions and to take measures in time to avoid bottlenecks in yourbusiness processes. For example, you can use Decision Manager for varioustypes of sales performance analyses, production performance analyses, andinventory data analyses.
For each area that you want to analyze, the Business Ccontent defines what datais extracted from the source system and how Decision Manager presents the datato you for further analyses. When you install Decision Manager, the BusinessContent is predefined for a number of areas.
This manual describes the Decision Manager 2.0 Business Content for Sales. Themanual describes the data that you can use for performance analysis of thevarious aspects of sales, and provides some examples of business managementquestions that can be answered by a specific type of analysis.
Chapter 1, �Overview of BaanBIS Decision Manager,� briefly describes theDecision Manager concepts and components and explains the function of theBusiness Contents in the Decision Manager solution.
Chapter 2, �Business Content for Sales,� provides a functional description of thedata that is available for the analysis of your sales performance.
Chapter 3, �Examples of Sales Performance Analysis,� describes some exampleanalysis that you can carry out based on the Business Content for Sales.
About this document

About this document
User's Guide for Business Content Salesiv
User's Guide for Business Content Sales1-1
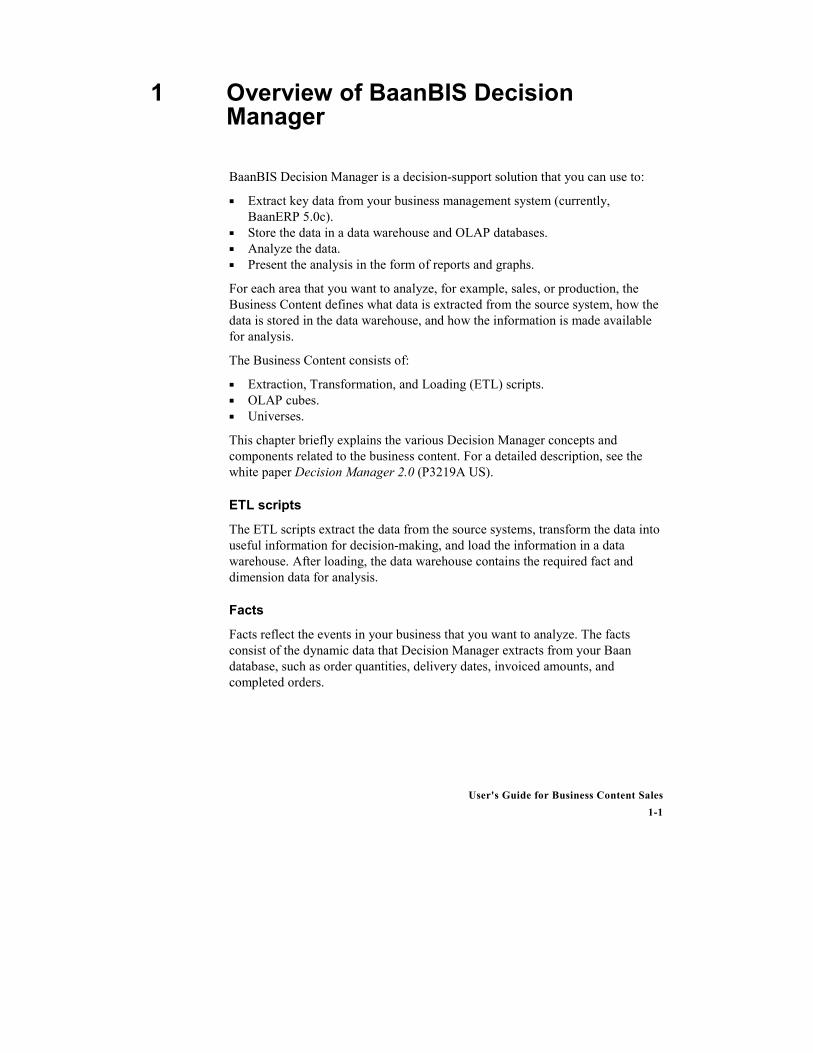
BaanBIS Decision Manager is a decision-support solution that you can use to:
� Extract key data from your business management system (currently,BaanERP 5.0c).
� Store the data in a data warehouse and OLAP databases.� Analyze the data.� Present the analysis in the form of reports and graphs.
For each area that you want to analyze, for example, sales, or production, theBusiness Content defines what data is extracted from the source system, how thedata is stored in the data warehouse, and how the information is made availablefor analysis.
The Business Content consists of:
� Extraction, Transformation, and Loading (ETL) scripts.� OLAP cubes.� Universes.
This chapter briefly explains the various Decision Manager concepts andcomponents related to the business content. For a detailed description, see thewhite paper Decision Manager 2.0 (P3219A US).
ETL scripts
The ETL scripts extract the data from the source systems, transform the data intouseful information for decision-making, and load the information in a datawarehouse. After loading, the data warehouse contains the required fact anddimension data for analysis.
Facts
Facts reflect the events in your business that you want to analyze. The factsconsist of the dynamic data that Decision Manager extracts from your Baandatabase, such as order quantities, delivery dates, invoiced amounts, andcompleted orders.
1 Overview of BaanBIS DecisionManager
Overview of BaanBIS Decision Manager
User's Guide for Business Content Sales1-2
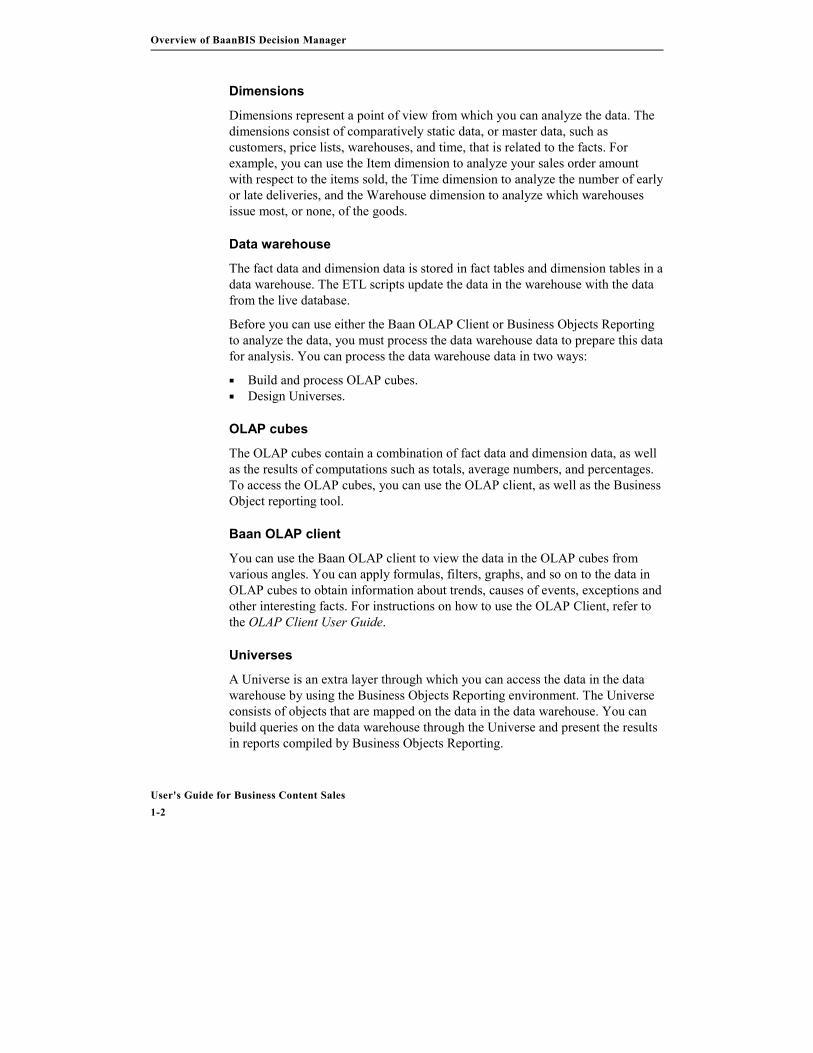
Dimensions
Dimensions represent a point of view from which you can analyze the data. Thedimensions consist of comparatively static data, or master data, such ascustomers, price lists, warehouses, and time, that is related to the facts. Forexample, you can use the Item dimension to analyze your sales order amountwith respect to the items sold, the Time dimension to analyze the number of earlyor late deliveries, and the Warehouse dimension to analyze which warehousesissue most, or none, of the goods.
Data warehouse
The fact data and dimension data is stored in fact tables and dimension tables in adata warehouse. The ETL scripts update the data in the warehouse with the datafrom the live database.
Before you can use either the Baan OLAP Client or Business Objects Reportingto analyze the data, you must process the data warehouse data to prepare this datafor analysis. You can process the data warehouse data in two ways:
� Build and process OLAP cubes.� Design Universes.
OLAP cubes
The OLAP cubes contain a combination of fact data and dimension data, as wellas the results of computations such as totals, average numbers, and percentages.To access the OLAP cubes, you can use the OLAP client, as well as the BusinessObject reporting tool.
Baan OLAP client
You can use the Baan OLAP client to view the data in the OLAP cubes fromvarious angles. You can apply formulas, filters, graphs, and so on to the data inOLAP cubes to obtain information about trends, causes of events, exceptions andother interesting facts. For instructions on how to use the OLAP Client, refer tothe OLAP Client User Guide.
Universes
A Universe is an extra layer through which you can access the data in the datawarehouse by using the Business Objects Reporting environment. The Universeconsists of objects that are mapped on the data in the data warehouse. You canbuild queries on the data warehouse through the Universe and present the resultsin reports compiled by Business Objects Reporting.

Overview of BaanBIS Decision Manager
User's Guide for Business Content Sales1-3
Business Objects Reporting
You can use Business Objects Reporting to access and print reports of theinformation in a data warehouse and in the OLAP cubes. The available BusinessObjects Reporting user manuals describe how you can define queries to analyzethe data and to build reports.
Figure 1 shows how the various Decision Manager components are related.For a detailed description of this architecture, see the white paper DecisionManager 2.0 (P3219A US).
Data-warehouse
BAAN V
OLAPcube Universe
OLAP Client
Business ObjectsReporting
Figure 1 High-level Decision Manager 2.0 architecture overview.

Overview of BaanBIS Decision Manager
User's Guide for Business Content Sales1-4
Definitions, acronyms, and abbreviationsTerm DescriptionBusiness Content A set of dimension and fact definitions, extraction
schemes, cubes and Universes that define the dataavailable for analysis of a particular business area.
Business Intelligence The total concept of data visualization and analysis.Business Objectsreporting
A set of applications for interactive reporting provided byBaan partner Business Objects, a business intelligencevendor.
Data warehouse An integrated collection of data used in the support ofmanagement�s decision needs. The data warehousedata consists of the fact data and the dimension datadefined by the business content of various businessareas.
Decision Manager An end-to-end solution based on an open BusinessIntelligence framework that contains best-of-breedcomponents. Decision Manager also delivers ready-to-implement Business Content, designed to analyze keybusiness processes in an enterprise.
Dimension A point of view from which you can look at and analyzeyour data, for example time, product, or customer.
Fact Numeric information about a business area that isextracted from your business management system andthat is available in the data warehouse, for example,turnover, total costs, and spent hours.
OLAP Online Analytical Processing: a category of softwaretechnology that enables analysts and managers to gaininsight into data through fact, consistent, and interactiveaccess. OLAP provides a wide variety of possible viewsof the information.OLAP functionality is characterized by dynamicmultidimensional analysis of consolidated enterprisedata that reflects the real dimensionality of the enterpriseas understood by the user.
Baan OLAP Client A browser based, hyperrelational OLAP client thatprovides the business user with an overview andanalytical support in addition to enterprise decisionmodels. Using hyperdrill technology, the users cannavigate intuitively between tactical and operationalinformation needs.
OLAP cube A set of related facts and dimensions. The cube is thecentral metadata object recognized by OLE DB forOLAP.
Universe A semantic layer that consists of classes and objectsthrough which you can access the data in the datawarehouse. The objects in the Universe map to data inthe data warehouse, and enable you to build queries onthe data warehouse.

User's Guide for Business Content Sales2-1
The Sales business content is related to the sales order history. In salesperformance analysis, you can analyze the following aspects related to sales:
� Sales turnover.The quantities and amounts related to invoiced orders.
� Sales process.The flow of order intake, order cancellations, and order invoices.
� The sales delivery performance.Various measures made available to track the adherence of actual deliveriesto the planned dates.
This chapter describes the content of the data warehouse, Universe data, and theOLAP cubes from a functional point of view and explains how you can use theSales Business Content for sales performance analysis.
For a detailed technical description of the design of the data warehouse and theOLAP cubes, see the metadata.
The data warehouse content for SalesSeveral facts and dimensions are available for sales performance analysis. Thefacts are the quantities and amounts of interest related to the aspects previouslymentioned. The dimensions define the aggregation levels on and angles fromwhich you can analyze the sales performance data.
The data warehouse contains several dimension tables and two tables that containthe sales history facts:
� The DW_SLS_History fact table contains the measures on order linetransaction level.
� The DW_SLS_Orderlines_Final fact table contains aggregated measures onorder line level. This table is derived from the DW_SLS_HISTORY table.
2 Sales Business Content

Sales Business Content
User's Guide for Business Content Sales2-2
Universe dataA Universe is created to make the data warehouse dimension and fact contentavailable in the Business Objects reporting environment.
The amounts are available in the home currency, local currency, reportingcurrency and the data warehousing currency. The home currency, local currency,and reporting currency are derived from the currencies rates used inBaanERP 5.0. The data-warehousing currency is used to consolidate amountsthat originate from several BaanERP 5.0 installations in the data warehouse.
The manner in which the various amounts related Facts are presented in the datawarehouse is explained in the following section.
Selection of the currencies from BaanERP for the DW currencies
Scenario1
Scenario2
Scenario3
Scenario4
BaanERP Company
Reference Currency EUR EUR USD USD
Local Currency USD USD USD USD
Reporting Currency 1 HFL EUR HFL EUR
Reporting Currency 2 EUR HFL EUR HFL
DM 2.0 � DW Logic Result inDW
Result inDW
Result inDW
Result inDW
HC (Home Currency) Pick up the HC of theLogistics Company (=Ref.Currency)
EUR EUR USD USD
LC (Local Currency) Pick up the Local Currencyof the Business Unit (EU) USD USD USD USD
RC(Reporting Currency)
Pick up the ReportingCurrency 1. However, ifReporting currency 1 =Reference Currency (HC),then in such case pick up orReporting currency 2
HFL HFL HFL EUR
NOTE

Sales Business Content
User's Guide for Business Content Sales2-3
You might notice that in Scenarios 1 and 2, the selection of the Reporting, Local,and Reporting 1 and 2 currencies seem appropriate. However, only if theReference currency and the Local currency are both the same, such as inScenarios 3 and 4, would you have a limitation of getting only one of the twoavailable Reporting currencies in the DW. This problem can be solved by aminor customization effort at implementation time.
NOTE
Sales Business Content
User's Guide for Business Content Sales2-4
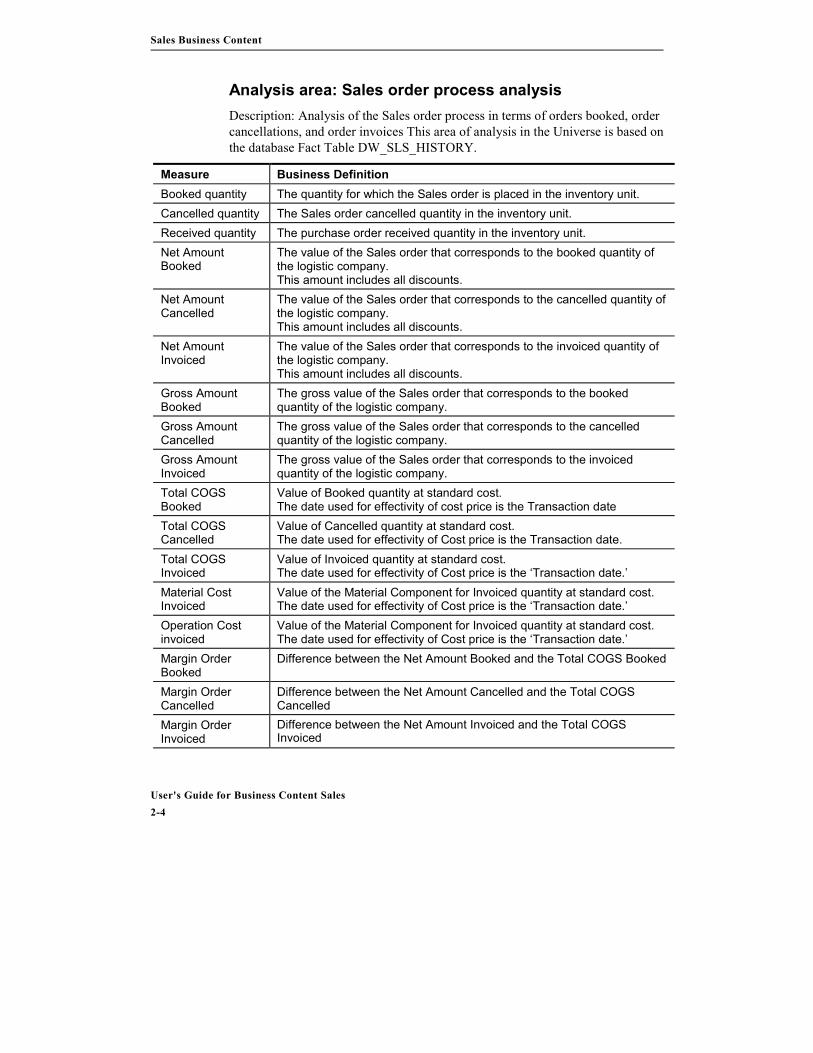
Analysis area: Sales order process analysisDescription: Analysis of the Sales order process in terms of orders booked, ordercancellations, and order invoices This area of analysis in the Universe is based onthe database Fact Table DW_SLS_HISTORY.
Measure Business DefinitionBooked quantity The quantity for which the Sales order is placed in the inventory unit.Cancelled quantity The Sales order cancelled quantity in the inventory unit.Received quantity The purchase order received quantity in the inventory unit.Net AmountBooked
The value of the Sales order that corresponds to the booked quantity ofthe logistic company.This amount includes all discounts.
Net AmountCancelled
The value of the Sales order that corresponds to the cancelled quantity ofthe logistic company.This amount includes all discounts.
Net AmountInvoiced
The value of the Sales order that corresponds to the invoiced quantity ofthe logistic company.This amount includes all discounts.
Gross AmountBooked
The gross value of the Sales order that corresponds to the bookedquantity of the logistic company.
Gross AmountCancelled
The gross value of the Sales order that corresponds to the cancelledquantity of the logistic company.
Gross AmountInvoiced
The gross value of the Sales order that corresponds to the invoicedquantity of the logistic company.
Total COGSBooked
Value of Booked quantity at standard cost.The date used for effectivity of cost price is the Transaction date
Total COGSCancelled
Value of Cancelled quantity at standard cost.The date used for effectivity of Cost price is the Transaction date.
Total COGSInvoiced
Value of Invoiced quantity at standard cost.The date used for effectivity of Cost price is the �Transaction date.�
Material CostInvoiced
Value of the Material Component for Invoiced quantity at standard cost.The date used for effectivity of Cost price is the �Transaction date.�
Operation Costinvoiced
Value of the Material Component for Invoiced quantity at standard cost.The date used for effectivity of Cost price is the �Transaction date.�
Margin OrderBooked
Difference between the Net Amount Booked and the Total COGS Booked
Margin OrderCancelled
Difference between the Net Amount Cancelled and the Total COGSCancelled
Margin OrderInvoiced
Difference between the Net Amount Invoiced and the Total COGSInvoiced

Sales Business Content
User's Guide for Business Content Sales2-5
Analysis area: Sales delivery performanceDescription: Analysis of sales order delivery performance in terms of variousmeasures related to adherence of the sales order to the delivery.
Measure DescriptionOrder line qty Ordered quantity on a sales order line (Order Booked � Order
cancelled), expressed in the inventory unit of the item.Delivered qty Delivered quantity on a sales order line, expressed in the inventory unit
of the item.On time qty Quantity on a sales order line that is delivered in time (delivery date =
planned delivery date), expressed in the inventory unit of the item.Late qty Quantity on a sales order line that is delivered late (delivery date >
planned delivery date), expressed in the inventory unit of the item.Early qty Quantity on a sales order line that is delivered early (delivery date <
planned delivery date), expressed in the inventory unit of the item.Order line Amount Ordered amount on a sales order line (Order Booked - Order
cancelled).Invoiced Amount Invoiced amount on a sales order line.Number of daysOrder Line Early
Positive number of days between the latest delivery date on a salesorder line and the Target delivery date, for order lines that are deliveredcompletely (delivered quantity >= ordered quantity).Target Delivery Date is defined as the minimum of current planneddelivery date for an order line.
Number of daysOrder Line Late
Positive number of days between the Target delivery date and the latestdelivery date on a sales order line, for order lines that are deliveredcompletely (delivered quantity >= ordered quantity).Target Delivery Date is defined as the minimum of current planneddelivery date for an order line.
Order lead time Number of days between order date and latest delivery date on a salesorder line, for order lines that are delivered completely (deliveredquantity >= ordered quantity)
Number ofdeliveries
Number of partial deliveries deliveries on a sales order line
On time order count Number of order lines that are delivered completely and on time(delivered quantity >= ordered quantity and days late = days early = 0).
Early order count Number of order lines that are delivered completely and early (deliveredquantity >= ordered quantity and days early > 0).
Late order count Number of order lines that are delivered completely and late (deliveredquantity >= ordered quantity and days late > 0).

Sales Business Content
User's Guide for Business Content Sales2-6
Delivered orderlines
Number of order lines that are delivered. (Can be partly or completelydelivered.)
No of linescompletelyDelivered
Number of order lines that are delivered completely (delivered quantity>= ordered quantity).
Number of lineswith One Delivery
Number of lines for which the Last delivery date is the same as the Firstdelivery date.
Time to ship BackOrders
If a completely delivered order is late and the first delivery date is beforethe planned delivery date:Difference between last delivery date and the planned delivery date forfirst delivery of a Sales order line.If a completely delivered order is late and the first delivery date is afterthe planned delivery date:Difference between last delivery date and the first delivery date.
Late order withBack Order
Count of order lines that have time to ship back orders as positive.
DimensionsThe Universe will expose the following dimensions. Several dimensions areavailable for analysis of Sales related information. Each dimension contains therelationships to aggregate the Inventory information based on relevantcharacteristics. For example, item dimension contains information to aggregateinformation based on the item characteristics such as item type, item group, andwarehouse.

Sales Business Content
User's Guide for Business Content Sales2-7
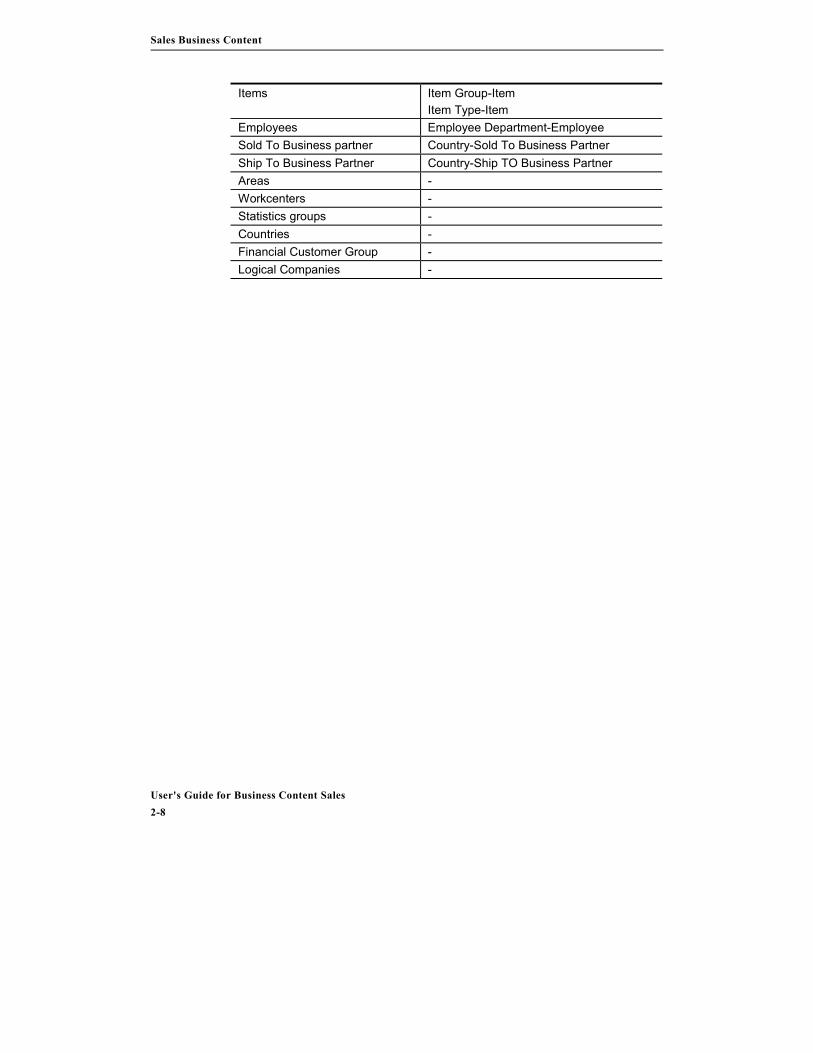
The available dimensions that are of interest for sales performance analysis are:
� Dimensions specific to universe Sales Order Process
Dimension LevelsSales order date prefix -Sales order number -Sales order position -Sales order sequence -Purchase order Number -Purchase order Position -Sales Return Order -Sales Return Order position -Sales Unit -Sales Price unit -Manufacturer -Product Class -Product Line -LOB -Invoice Number -Invoice Company -Ship To Address -Home currency -Local currency -Reporting currency -Data Warehouse currency -Sales Order origin -Sales Order Type -Transaction Date Year � Quarter � Month � DateOrder date Year � Quarter � Month � DateActual delivery date Year � Quarter � Month � DatePlanned delivery Date Year � Quarter � Month � DateReleased Date Year � Quarter � Month � DateInvoice Date Year � Quarter � Month � DatePlanned Receipt Date Year � Quarter � Month � DateDepartment Department type �DepartmentWarehouses Warehouse type-Warehouse
Sales Business Content
User's Guide for Business Content Sales2-8
Items Item Group-ItemItem Type-Item
Employees Employee Department-EmployeeSold To Business partner Country-Sold To Business PartnerShip To Business Partner Country-Ship TO Business PartnerAreas -Workcenters -Statistics groups -Countries -Financial Customer Group -Logical Companies -
Sales Business Content
User's Guide for Business Content Sales2-9
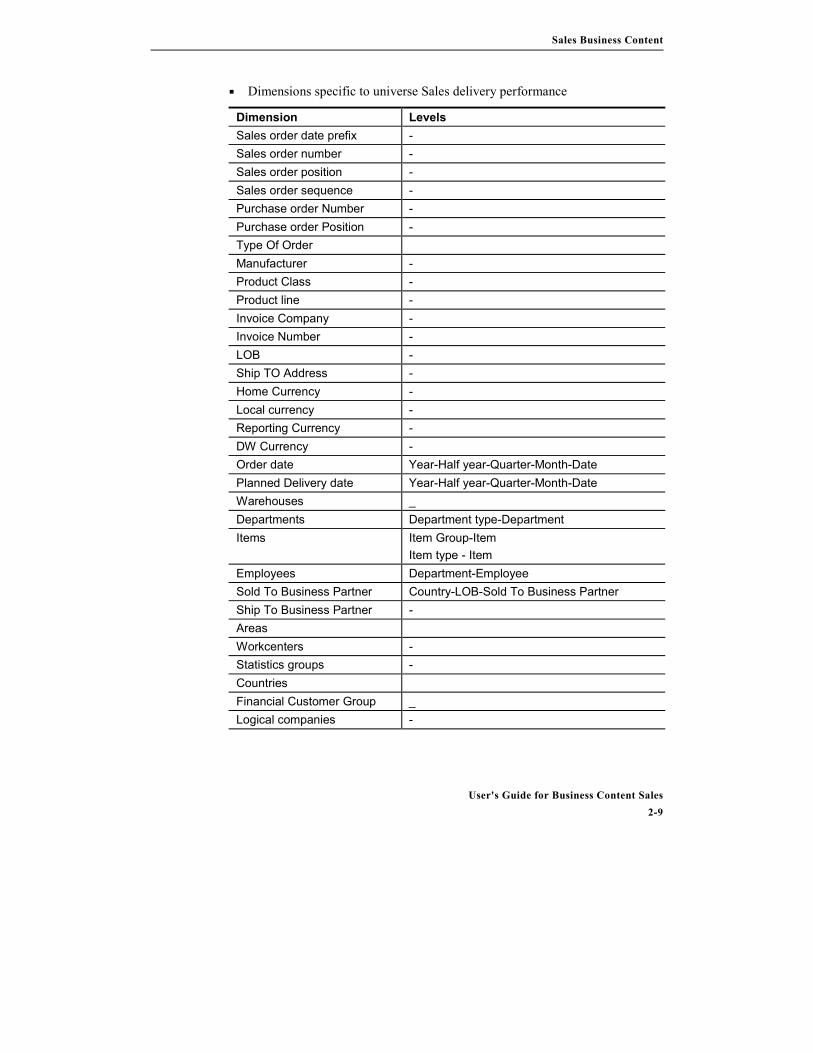
� Dimensions specific to universe Sales delivery performance
Dimension LevelsSales order date prefix -Sales order number -Sales order position -Sales order sequence -Purchase order Number -Purchase order Position -Type Of OrderManufacturer -Product Class -Product line -Invoice Company -Invoice Number -LOB -Ship TO Address -Home Currency -Local currency -Reporting Currency -DW Currency -Order date Year-Half year-Quarter-Month-DatePlanned Delivery date Year-Half year-Quarter-Month-DateWarehouses _Departments Department type-DepartmentItems Item Group-Item
Item type - ItemEmployees Department-EmployeeSold To Business Partner Country-LOB-Sold To Business PartnerShip To Business Partner -AreasWorkcenters -Statistics groups -CountriesFinancial Customer Group _Logical companies -

Sales Business Content
User's Guide for Business Content Sales2-10
The OLAP cubes for salesThree OLAP cubes are available for sales. Each cube contains measures anddimensions. The following sections describe the measures and dimensions ofthese three cubes.
The Delivery Performance cubeThe Delivery Performance cube contains measures to analyze the deliveryperformance related to sales. The following table describes the measures.
Delivery Performance cube dataMeasure DescriptionOrder line qty See data warehouse content for Sales.Delivered qty See data warehouse content for Sales.On time qty See data warehouse content for Sales.Late qty See data warehouse content for Sales.Early qty See data warehouse content for Sales.Total lead time Sum of order lead time.Days late See data warehouse content for Sales.Days early See data warehouse content for Sales.Late qty % Percentage of delivered quantity that has been delivered late (late
qty/delivered qty).On time qty % Percentage of delivered quantity that has been delivered on time
(on time qty/delivery qty).Early qty % Percentage of delivered quantity that has been delivered early
(early qty/delivered qty).Average number oflines with one delivery
Number of order lines with one delivery (all deliveries on one day)divided by the number of order lines with at least one delivery.
Average number ofdeliveries per order line
Number of deliveries/number of order lines with at least onedelivery.
Average late delivery Days late/late order count (number of late orders).Average early delivery Days early/early order count (number of early orders).Average lead time Total lead time/number of order lines that are delivered completely
(delivered quantity >= ordered quantity).Timeliness Number of completed order lines delivered in time or early/number
of completed order lines.Completeness Number of completed order lines/number of order lines with at
least one delivery.Average Time Tocomplete Back Orders
Time to Ship Back Orders /Complete Delivered Count.

Sales Business Content
User's Guide for Business Content Sales2-11
Delivery Performance analysis dimensions
The available dimensions for delivery performance analysis are:
Dimension LevelsBusiness Partner All � External Business- Partner-Country �LOB-BPItems All - ItemGroup - ItemWarehouses All - Country - WarehousePlannedDeliveryDate All - Year - Quarter - Month - DaySalesOffice All � Country - Sales OfficeSales Order Type All � Sales Order TypeSales Order Origin All � Sales Order OriginSales Stat Group All � Statistics GroupSales Representative All � Sales RepresentativeSales Normal Return Order All � Normal Return Order Type
The Sales Order Process cubeYou can use the Sales Order Process cube to analyze the sales order processconsisting of order intake procedures, order cancellation procedures, and orderdelivery procedures. The following table describes the measures that areavailable to use the Sales Order Process cube:
Sales Order Process cube dataMeasure DescriptionBooked quantity Quantity booked in sales order intake procedures.Cancelled quantity Quantity cancelled in sales order cancellation procedures.Invoiced quantity Quantity invoiced in sales order delivery/invoicing
procedures.Open quantity Quantity that must still be delivered at a certain moment in
time (Booked quantity � Cancelled quantity � Invoicedquantity).
Net Bookedamount
Net amount booked in sales order intake procedures.This amount includes all discounts.
Net Cancelledamount
Net amount cancelled in sales order cancellation procedures.This amount is inclusive of all discounts.

Sales Business Content
User's Guide for Business Content Sales2-12
Net Invoicedamount
Net amount invoiced in sales order delivery/invoicingprocedures.This amount includes all discounts.
Net Open amount Amount that must still be invoiced at a certain moment intime (Booked amount � Cancelled amount � Invoicedamount).This amount is inclusive of all discounts.
Gross AmountBooked
Gross amount booked in sales order intake procedures.
Gross AmountCancelled
Gross amount cancelled in sales order cancellationprocedures.
Gross AmountInvoiced
Gross amount invoiced in sales order delivery/invoicingprocedures.
Total COGSBooked
Total cost of goods sold related to booked quantity.
Total COGSCancelled
Total cost of goods sold related to cancelled quantity.
Total COGSInvoiced
Total cost of goods sold related to invoiced quantity.
Material CostInvoiced
Material component of total cost of goods sold related toinvoiced quantity.
Operation costInvoiced
Operation component of total cost of goods sold relatedto invoiced quantity.
PercentageMaterial COGS
Material cost invoiced*100/ total COGS invoiced
PercentageOperation COGS
Operation cost invoiced*100/ total COGS invoiced
Cost open orders TOGS related to open order quantity.Margin ordersBooked
Margin related to booked quantity (net booked amount �total COGS booked).
Margin ordersCancelled
Margin related to cancelled quantity (net cancelledamount � total COGS cancelled).
Margin ordersInvoiced
Margin related to invoiced quantity (net invoiced amount� total COGS invoiced).
Margin Openorders
Margin related to open order quantity (net open amount �cost open orders).
Sales growth % Growth percentage of net invoiced amount from oneperiod to previous period.

Sales Business Content
User's Guide for Business Content Sales2-13
Sales order process analysis dimensions
Dimension LevelsOrderOrigin All OrAll-OrderOriginBusiness Partner All-ExternalBP �Country-LOB-Business PartnerSales Office All � Country � Sales OfficeSalesRepresentative All - SalesRepresentativeItems All - Item Group - ItemWarehouse All � Country - WarehouseTransaction Date All - Year - Half Year - Quarter - Month - DaySales Stat Group All � Statistics GroupSales OrderType All � Sales Order TypeSales Normal Return Order All � Normal Return Order Type

Sales Business Content
User's Guide for Business Content Sales2-14

User's Guide for Business Content Sales3-1
This chapter describes some analyses that you can carry out based on theBusiness Content described in the previous chapter.
Several measures and dimensions are available for Sales performance analysis.In the areas of Sales delivery performance, and Sales order process, variousquestions are provided as examples.
The questions show several examples of the capabilities of the Business Contentfor Sales. Thanks to the flexibility of the OLAP environment and the reportingenvironment, many other questions and issues can be clarified with help ofBusiness Content. Because these environments work extensively with thedimension concept, you can easily produce the information on the level that yourequire.
The Universe enables you to create both single company and multicompanyreports. The standard report contains data from multiple companies. With respectto amounts, use the reporting currency (DWC) measures in a multi companyreport.
To create a single company report, select the Company number selected objectin the query panel. If you run a query or refresh a report, you are prompted toselect a company number from a list. The report then only contains data for theselected company, and the selected company number is shown in the report.
In which areas of delivery do I perform better or worse than in theprevious analysis?
You can use several measures to measure the delivery performance, for example,the percentage of orders that are delivered on time and the percentage of ordersthat are delivered complete. To find out the areas where the performance is betteror worse than at a previous analysis, you must use the Item dimension, theWarehouse dimension, or the Company dimension. You can use reports orOLAP views that show the delivery performance by item group, by warehouse,or by company, to answer your question.
3 Examples of Sales performanceanalysis
EXAMPLE

Examples of Sales performance analysis
User's Guide for Business Content Sales3-2
Does my delivery performance for key customers showimprovement?
To see the trend of delivery performance, you must use the Time dimension. TheTime dimension, can make the delivery performance available by year, month,week, or any other time unit. The Customer dimension enables you to see theinformation per customer or per group of customers.
How fast can I deliver specific items on average?
Measuring the order lead-time is useful to obtain information about yourresponsiveness. The Average Lead Time measure is available for this. To reportor analyze the lead-time figures by item or group of items, use the Itemdimension in this perspective.
What product/market combinations show the most promising orworrying figures?
Turnover measurements are available for reporting and for OLAP Analysis. Acombination of these measurements and the Item and Customer dimensioninformation enables you to view the turnover per item or item group, bycustomer or by line of business, and by area or by country. In addition, you canadd the Time dimension to your report to obtain a picture of the trends.
What items contribute the most to our result?
Margin figures are available that are derived from the turnover figures. You caneasily report on item level or item group level by combining the margin figureswith the Item dimension information.
How does my order portfolio look over time?
Analysis of how the order portfolio moves over time can be interesting. You cansee the quantities and amounts to be delivered at a certain moment in time. If thisquantity increases over time, problems in your delivery processes can emerge.You can use the open order quantity and the open order amount measures toreport the order portfolio.
Who are my top sales representatives?
You can combine the turnover and margin measurements with the Employeedimension. This results in performance figures for each sales representative.
EXAMPLE
EXAMPLE
EXAMPLE
EXAMPLE
EXAMPLE
EXAMPLE