User Manual - University of Houston–Downtown
61
UHD eIntelligence Version 4.2 User Manual Teaching Technology & Learning Center University of Houston-Downtown
Transcript of User Manual - University of Houston–Downtown

UHD eIntelligence Version 4.2
User Manual
Teaching Technology & Learning Center
University of Houston-Downtown

THE BASICS

eIntelligence is UHD’s Business Intelligence software. This software allows UHD decision-makers to easily access data (student, applicant, course, etc.) and summarize it in meaningful ways to make informed university decisions. Note: Data in eIntelligence is refreshed on a regular basis. Historic data may change slightly due to changes and corrections made to the source data (e.g. Banner).
Information derived from this system should be used for internal decision-making only. For official statistics or information for public use, please contact the Office of Institutional Research.
Log in to eIntelligence
1. Open an Internet Explorer browser window.
Please note: eIntelligence will work in Firefox, but not Chrome
2. The following URL will access login Page:
https://eintelligence.uhd.edu/Argos/
3. Click Log into eIntelligence.
4. If you do not get an automatic pop-up window promptingyou to login, you may also use the Login button located atthe top left of the eIntelligence window.
5. The first time you use eIntelligence, you need todownload and install a program. You must beadministrator of your computer in order to installprograms.
6. The eIntelligence login dialog box will appear. If your browser is not configured properly, you will be showninstructions to download the tools needed to run eIntelligence.
7. Enter your UHD username and password.Within the login dialog box, there areseveral options you may configure tomeet your needs.
WHAT IS eINTELLIGENCE?
LOG IN TO eINTELLIGENCE

Note for Users with Double Monitors: When logging in to eIntelligence via Remote Desktop, you may find that EI is displayed on your second screen and the login screen is not visible during your remote session.
The eIntelligence Windows
1. Select your view of the eIntelligence dashboard by clicking on the
down arrow listed to the right. 2. You will see several data blocks depending on your permissions. Some
of these include: 1. Executive Dashboard 2. Applicant Information
3. Enrollment Information 4. Course Information 5. Applicant Cohort
6. Daily Course Information
3. Double-click the data block you wish to access.
For example, to compare data at the applicant level, double-click Applicant Information.
4. The data block will execute and you may now analyze/compare its data.
THE eINTELLIGENCE STRUCTURE

DEFINITION: A data block is a multidimensional table that allows users to find what is important and relevant to a particular question or need. Data blocks allow for the exploration of alternate scenarios to present valuable information more effectively and quickly for the user. The following table explains the current data blocks:
Data Block Data That Can Be Found Example Query
Executive Dashboard
High level summary information of student registration, with historic data by day
How many students have registered for Fall 2010 compared to Fall 2009 enrollment at the same point in time?
Applicant Information
UHD applicant information How many undergraduates applied to UHD as
transfers for Spring2008?
Enrollment Information
Information about specific enrolled students or general UHD enrollment.
How many female students at UHD are biology majors?
Course Information
Information about specific courses or general UHD courses.
What proportion of students take day classes vs. night classes?
Applicant Cohort
Total stats on applicants and students for the semester
How many students have paid for Fall 2009 compared to how many had paid at the same point?
in time for Fall2008?
Daily Course Information
Track detailed enrollment numbers against previous semesters or at
Is the online enrollment 25 days before the first day of Summer I 2011 higher or lower than the same point in time for Summer I2010?
After logging on, click on the “View Modes” icon and select Large Icon, Small Icon, or List View.
After making this selection, eIntelligence will remember your preference for future logins.
WHAT ARE DATA BLOCKS?
SELECTING HOW TO VIEW MODULES
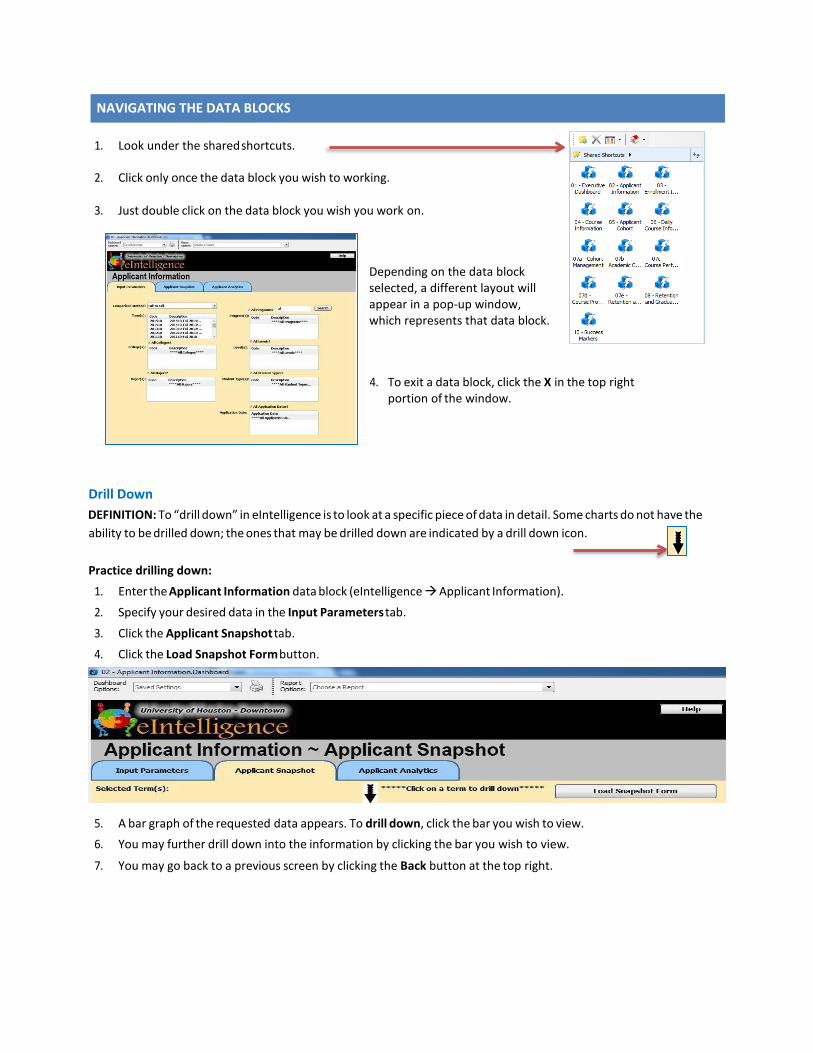
1. Look under the shared shortcuts.
2. Click only once the data block you wish to working.
3. Just double click on the data block you wish you work on.
Depending on the data block selected, a different layout will appear in a pop-up window, which represents that data block.
4. To exit a data block, click the X in the top right portion of the window.
Drill Down DEFINITION: To “drill down” in eIntelligence is to look at a specific piece of data in detail. Some charts do not have the ability to be drilled down; the ones that may be drilled down are indicated by a drill down icon.
Practice drilling down:
1. Enter the Applicant Information data block (eIntelligence Applicant Information). 2. Specify your desired data in the Input Parameters tab.
3. Click the Applicant Snapshot tab. 4. Click the Load Snapshot Form button.
5. A bar graph of the requested data appears. To drill down, click the bar you wish to view. 6. You may further drill down into the information by clicking the bar you wish to view.
7. You may go back to a previous screen by clicking the Back button at the top right.
NAVIGATING THE DATA BLOCKS

EXECUTIVE DASHBOARD

The Executive Dashboard is a snapshot of certain data that is always available just one click away. Note: Data in eIntelligence is refreshed on a regular basis. Historic data may change slightly due to changes and corrections made to the source data (e.g. Banner). Note: In the Executive Dashboard and Daily Course the current day’s data will represent the data as of the current day’s morning snapshot. Previous days’ data will represent the end of that day’s snapshot. Note: You cannot currently download the data from the Executive Dashboard data block.
Operate Executive Dashboard 1. Double-click the Executive Dashboard data block.
2. The Daily Statistics tab looks at where we are now for the current semester
compared to the same point in time or to a date of your choice of the equivalent semester in prior years.
3. When you first start the Daily Statistics data make your selection for term1.
The system will automatically select the current date for term 1. Terms 2 and 3 will differ by one year. Select the dates for comparison and click the “Load” button.
Note: REG SCH – Registered Semester Credit Hours. New field will not show data prior to November 2011.
EXECUTIVE DASHBOARD

1. In the Statistics tab, in the “Enter Number of Terms” field, input the number of terms you wish to compare. Note: Maximum number of terms will change based on the term type you select.
2. From the “Select Term Type” drop-down menu, select which specific terms to compare.
3. Click the “Load” button and the data will populate in the following three areas: a. Total Stats(Undergrad/Grad) b. Undergraduate Stats c. Graduate Stats
4. If you wish to view charts of this data as a daily summary, click the Daily Summary Charts tab. For more
detailed information, click the Daily Detail tab.
5. 6. The Statistics tab looks at where we are now for current semester compared against census day of the
equivalent semester in prior years.

SNAPSHOTS ADMISSIONS, ENROLLMENT AND COURSESNAPSHOTS

The process to create graphical snapshots of data is slightly different between the two data blocks. The Applicant Information data block is shown below:
Create Snapshot Form in the Applicant Information Data Block
1. First, decide the “Comparison Method” you would like to employ. The choices offered are:
• Fall to Fall – Shows only Fall terms • Spring to Spring – Shows only Spring terms • Spring to Fall – Shows only Fall and Spring terms • Term order – Shows all types of terms (Fall, Spring, Summer and Winter)
2. Select the term(s) you wish to see.
To select more than one term, hold down the CTRL button on your keyboard and click each one separately.
3. In the following boxes, identify which specific data you would like to view. The choices offered are:
• College(s) • Major(s) • Program(s) • Level(s) – Undergraduate, Graduate • Student Type(s) – Undeclared, New Freshman, Transfer, Continuing, etc. • Application Date – limit the applications to only those received by a certain date
Please note: There is a checkbox above each section that allows you to choose all.
APPLICANT SNAPSHOT
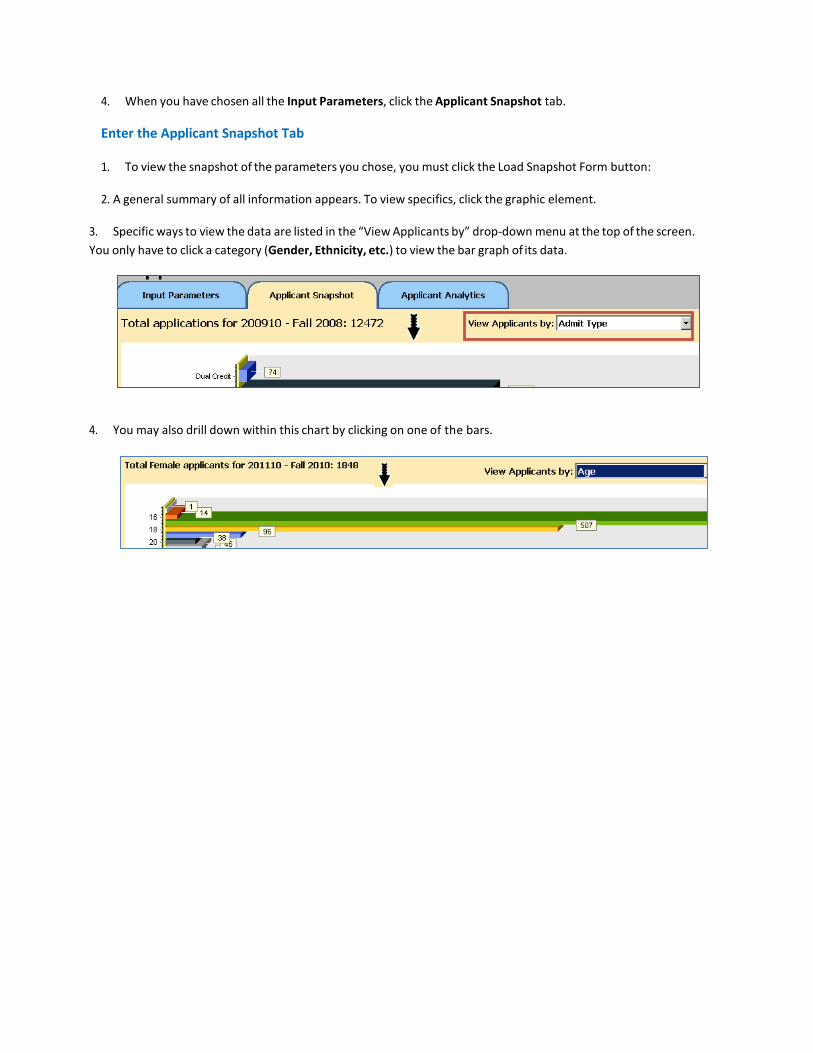
4. When you have chosen all the Input Parameters, click the Applicant Snapshot tab.
Enter the Applicant Snapshot Tab
1. To view the snapshot of the parameters you chose, you must click the Load Snapshot Form button:
2. A general summary of all information appears. To view specifics, click the graphic element.
3. Specific ways to view the data are listed in the “View Applicants by” drop-down menu at the top of the screen. You only have to click a category (Gender, Ethnicity, etc.) to view the bar graph of its data.
4. You may also drill down within this chart by clicking on one of the bars.

The Enrollment Information data block looks like this:
Create Snapshot Form in the Enrollment Data Block
1. Open the Enrollment Data Block and choose which Record Set you wish to use in analyzing enrollment data. • Official: data as of the reporting day for the university (20thday). • Current: data as of the end of the semester for prior semesters. When a semester is in progress, it is data as
of the prior day (the system is refreshed each night).
2. Next, decide which “Comparison Method” to employ. The choices offered are: • Fall to Fall – Shows only Fall terms • Spring to Spring – Shows only Spring terms • Spring to Fall – Shows only Fall and Spring terms • Term order – Shows all types of terms (Fall, Spring, Summer and Winter)
3. Select the terms you wish to see. To select more than one term, hold down the CTRL button on your keyboard and click each one separately.
ENROLLMENT AND COURSE SNAPSHOT

the Select Chart: drop-down to filter by ethnicity, gender and student type.
4. In the following sections, identify which specific data you would like to view. The choices offered are: • College • Department(s) • Level(s) – Undergraduate, Graduate • Student Type(s) – Undeclared, New Freshman, Transfer, etc. • Major(s) • Program(s)
To select more than one term, hold down the CTRL button on your keyboard and click each one separately. There is a checkbox above each section that allows you to choose all.
Enter the Enrollment Snapshot Tab
1. Click the Enrollment Snapshot tab.
2. Now click the Load Enrollment Snapshot button at the top right. The graphs will populate.
3. These graphs depict the data you
requested, such as an Enrollment by Student Type bar graph, a Enrollment by Ethnicity pie chart, and more. You may filter data using the drop-downs in the blue left menu.
4. Now click the Multi-
Term Enrollment Snapshot tab.
5. Click the Load Multi-Term Enrollment Snapshot button. The graph area will populate with data. You may use

What is the breakdown of applicants by ethnicity?
1. Log into eIntelligence and expand the eIntelligence folder from the explorer tree on the left side of the screen.
2. Since we wish to look at applicants, click the Applicant Information data block.
3. Click the Quick View button.
4. Choose the Comparison Method and term(s).
5. To answer this question, we will not need to change any of the other fields.
6. Click the Applicant Snapshot tab.
7. In the Applicant Snapshot tab, click the Load Snapshot Form button. The graphical data will appear.
8. Drill down to view the details of the applicants listed.
9. Click the “View Applicants by” drop-down at the top right of the screen, and choose Ethnicity.
10. The bar graph details the breakdown of applicants by Ethnicity.
11. To drill down and view details on a certain ethnicity, click the graphical element you wish to view, and select another detail from the “View Applicants by” drop-down.
What is the breakdown of applicants (who applied by the posted application deadline for UHD)by ethnicity?
1. Log into eIntelligence and expand the eIntelligence folder from the explorer tree on the left side of the screen.
2. Since we wish to look at applicants, click the Applicant Information data block.
3. Click the Quick View button.
4. Choose the Comparison Method and term(s).
5. In the Application Date field, uncheck the All
Application Dates checkbox.
6. Select the application deadline date for the term or terms you are comparing.
7. We will not need to change any of the other
fields.
EXAMPLES OF SNAPSHOT QUERIES

8. Click the Applicant Snapshot tab.
9. In the Applicant Snapshot tab, click the Load Snapshot Form button. The graphical data will appear.
10. Drill down to view the details of the applicants listed.
11. Click the “View Applicants by” drop-down at the top right of the screen, and choose Ethnicity.
12. The bar graph details the breakdown of applicants by Ethnicity.
13. To drill down and view details on a certain ethnicity, click the graphical element you wish to view, and select another detail from the “View Applicants by” drop-down.
What is the distribution by ethnicity and gender of our new students?
1. Log into eIntelligence and expand the eIntelligence folder from the explorer tree on the left side of the screen.
2. Since we wish to look at enrollment data, click the Enrollment Information data block.
3. Click the Quick View button.
4. Choose the Comparison Method and term(s) you wish to view.
5. For this question, we will not need to change any of the other fields. Click the Enrollment Snapshot tab and then the Load Snapshot Form button.
6. Click on the paging arrows to view student type “UG NEW FTIC.”
7. To see the distributions of other groups of students, click the “All
Student Types Select” drop-down and choose between: • UG New College Transfers • UG Continuing • UG Returning • UG High School Students • UG Other • New Masters • Masters Continuing • Masters Returning

Applicant Snapshot Questions:
1. In the Fall of 2007, how many College of Public Service Females applied?
2. In the Spring of 2009, how many White – Non – Hispanic students were accepted on probation?
Enrollment Snapshot Questions: 1. Compare Spring 2007, 2008 and 2009. Have the number of Black-Non-Hispanic students continued to
increase? If so, what was the enrollment for each of the 3 semesters?
2. In the Spring of 2009, how many students were enrolled in College of Business?
Course Snapshot Questions:
1. Between the Spring 2007, Spring 2008, and Spring 2009 which colleges had an increase in the number of course offerings?
2. Between Spring 2008 and Spring 2009, which Science and Technology department had a decrease in
enrollment (CMS, ET, or SCI)?
Expanded Practice
1. What was the enrollment by student type for “UG New FTIC” students in Fall2008?
2. Name the most enrolled age group and its student amount in Spring 2009.
SNAPSHOT PRACTICE QUESTIONS
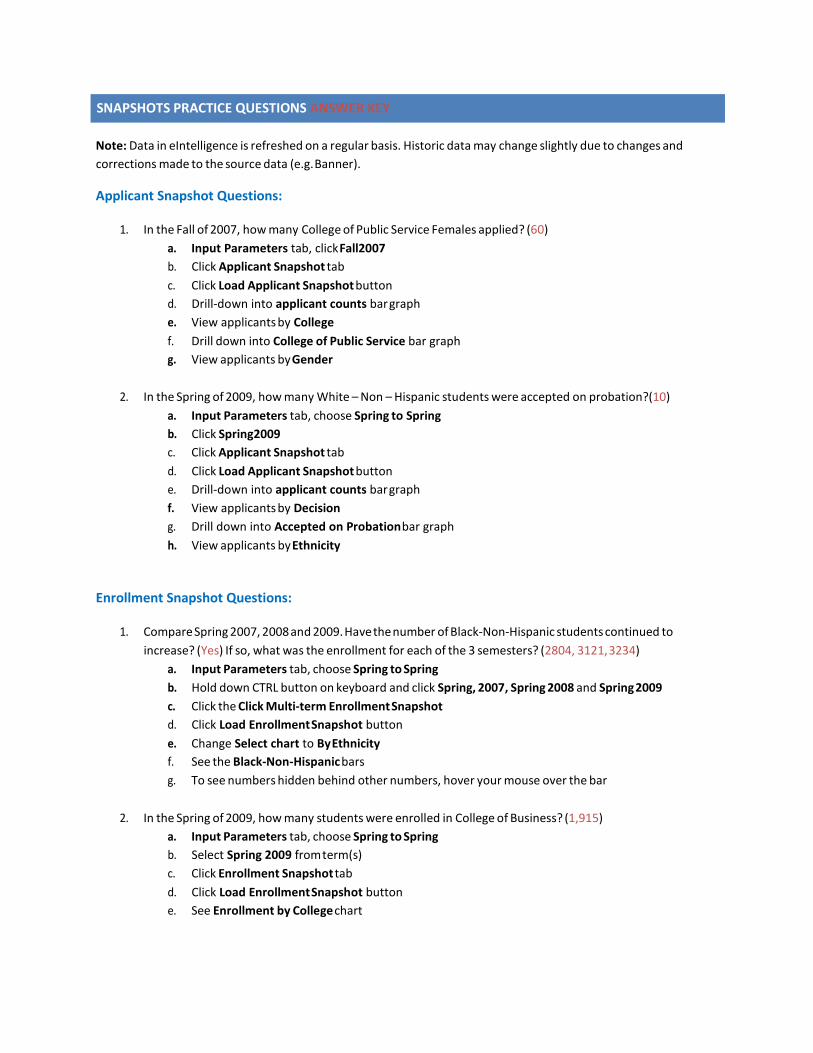
Note: Data in eIntelligence is refreshed on a regular basis. Historic data may change slightly due to changes and corrections made to the source data (e.g. Banner).
Applicant Snapshot Questions:
1. In the Fall of 2007, how many College of Public Service Females applied? (60) a. Input Parameters tab, click Fall2007 b. Click Applicant Snapshot tab c. Click Load Applicant Snapshot button d. Drill-down into applicant counts bar graph e. View applicants by College f. Drill down into College of Public Service bar graph g. View applicants by Gender
2. In the Spring of 2009, how many White – Non – Hispanic students were accepted on probation?(10)
a. Input Parameters tab, choose Spring to Spring b. Click Spring2009 c. Click Applicant Snapshot tab d. Click Load Applicant Snapshot button e. Drill-down into applicant counts bar graph f. View applicants by Decision g. Drill down into Accepted on Probation bar graph h. View applicants by Ethnicity
Enrollment Snapshot Questions:
1. Compare Spring 2007, 2008 and 2009. Have the number of Black-Non-Hispanic students continued to increase? (Yes) If so, what was the enrollment for each of the 3 semesters? (2804, 3121, 3234)
a. Input Parameters tab, choose Spring to Spring b. Hold down CTRL button on keyboard and click Spring, 2007, Spring 2008 and Spring 2009 c. Click the Click Multi-term Enrollment Snapshot d. Click Load Enrollment Snapshot button e. Change Select chart to By Ethnicity f. See the Black-Non-Hispanic bars g. To see numbers hidden behind other numbers, hover your mouse over the bar
2. In the Spring of 2009, how many students were enrolled in College of Business? (1,915)
a. Input Parameters tab, choose Spring to Spring b. Select Spring 2009 from term(s) c. Click Enrollment Snapshot tab d. Click Load Enrollment Snapshot button e. See Enrollment by College chart
SNAPSHOTS PRACTICE QUESTIONS ANSWER KEY

Course Snapshot Questions:
1. Between the Spring 2007, Spring 2008, and Spring 2009 which colleges had an increase in the number of course offerings? (PS, ST, UC)
a. Input Parameters tab, choose Spring to Spring b. Hold down CTRL button on keyboard and click Spring, 2007, Spring 2008 and Spring 2009 c. Click Course Snapshot tab d. Click Load Course Snapshot button e. See Courses By College graph
2. Between Spring 2008 and Spring 2009, which Science and Technology department had a decrease in
enrollment (CMS, ET, or SCI)?(ET) a. Input Parameters tab, choose Spring to Spring b. Hold down CTRL button on keyboard and click Spring 2008 and Spring2009 c. Click Course Snapshot tab d. Click Load Course Snapshot button e. In the top left Course by College area, click one of the bars in the ST set f. See the Enrollment by Department area
Expanded Practice
1. What was the enrollment by student type for “UG New FTIC” students in Fall 2008? (973) a. Open the Enrollment Information data block b. In the Input Parameters tab, click Fall2008 c. Click the Enrollment Snapshot tab d. Click Load Enrollment Snapshot button e. See the Enrollment by Student Type area
2. Name the most enrolled age group and its student amount in Spring 2009. (“25-30,” 3,404)
a. Open the Enrollment Information data block b. In the Input Parameters tab, choose Spring to Spring c. Click Spring2009 d. Click the Enrollment Snapshot tab e. Click Load Enrollment Snapshot button f. See the Enrollment by Age pie chart

ANALYTICS APPLICANT, ENROLLMENT, COURSE ANALYTICS AND DAILY COURSE INFORMATION

Choose Input Parameters in the Applicant Information Data Block
1. First, decide the “Comparison Method” you would like to employ. The choices offered are: • Fall to Fall – Shows only Fall terms • Spring to Spring – Shows only Spring terms • Spring to Fall – Shows only Fall and Spring terms • Term order – Shows all types of terms (Fall, Spring, Summer and Winter)
2. Select the term(s) you wish to see.
To select more than one term, hold down the CTRL button on your keyboard and click each one separately.
3. In the following boxes, identify which specific data you would like to view. The choices offered are: • College(s) • Major(s) • Level(s) – Undergraduate, Graduate • Student Type(s) – Undeclared, New Freshman, Transfer, Continuing, etc.
Please note: There is a checkbox above each section that allows you to choose all.
Enter the Applicant Analytics Tab
1. To view multiple applicant data categories at once within a numerical table format, click the Applicant Analytics tab.
2. In the Applicant Analytics area, click the Load Applicant Information button to generate the data.
Please note: You will be viewing the data that was selected on the Input Parameters tab.
3. You may click-and-drag categories from the top of the screen to various sections of the table. The “hot spots” you may drag categories into are indicated by red boxes (A & B) in the following screenshot:
Click and drag these
categories to “hot spots” found in the
table below.
APPLICANT ANALYTICS
B.
A.{
A. Columns: area for data categories you would like to see listed as the column headers B. Rows: area for data categories you would like to see listed as the row headers
Note: After dragging the categories to the hotspots, the “+” sign must be clicked to expand the data to see the individual values.
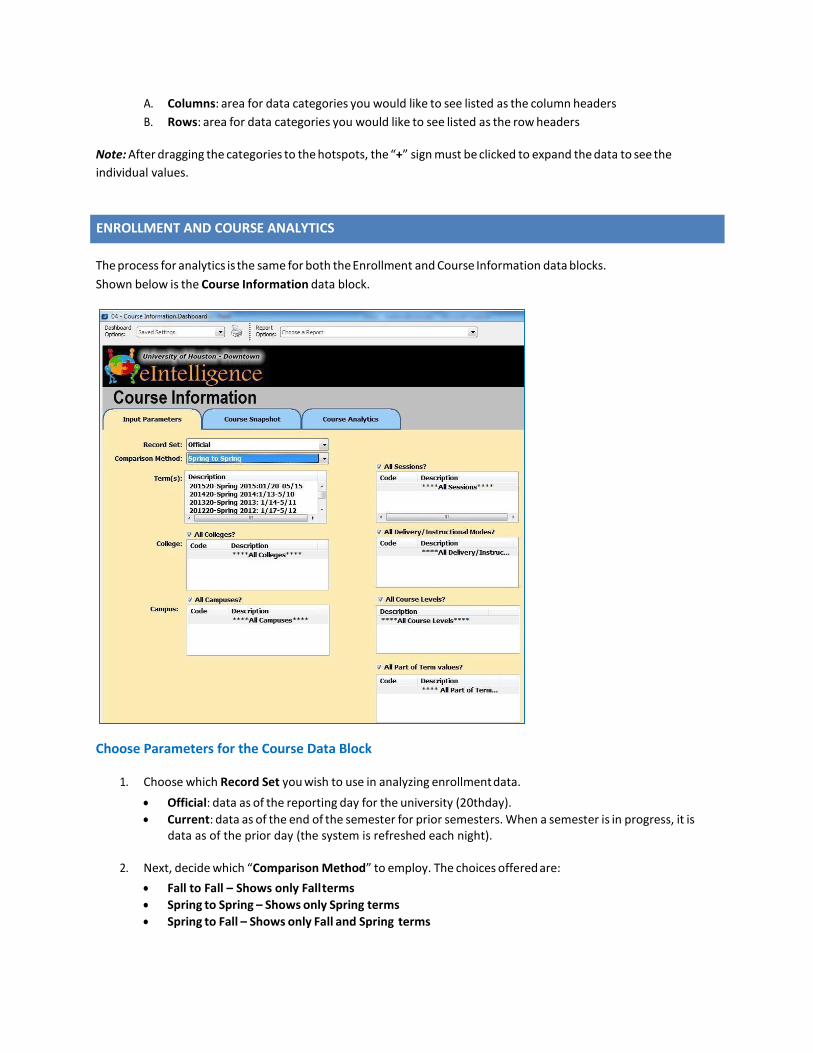
The process for analytics is the same for both the Enrollment and Course Information data blocks. Shown below is the Course Information data block.
Choose Parameters for the Course Data Block
1. Choose which Record Set you wish to use in analyzing enrollment data.
• Official: data as of the reporting day for the university (20thday). • Current: data as of the end of the semester for prior semesters. When a semester is in progress, it is
data as of the prior day (the system is refreshed each night).
2. Next, decide which “Comparison Method” to employ. The choices offered are: • Fall to Fall – Shows only Fall terms • Spring to Spring – Shows only Spring terms • Spring to Fall – Shows only Fall and Spring terms
ENROLLMENT AND COURSE ANALYTICS

• Term order – Shows all types of terms (Fall, Spring, Summer and Winter)
3. Select the term(s) you wish to see.
4. In the following sections, identify which specific data you would like to view. The choices offered are: • College • Campus • All Sessions? • All Delivery/Instructional Modes? • All Course Levels? • All Part of Term Values?
To select more than one term, hold down the CTRL button on your keyboard and click each one separately. There is a checkbox above each section that allows you to choose all.
Enter the Analytics Tab
1. To analyze enrollment data within a numerical table format, click the Course Analytics tab.
2. Then click the Load Enrollment Information button to generate the data. Please note: you will be viewing the data that was selected on the Input Parameters tab.
A. Columns: area for data categories you would like to see listed as the column headers B. Rows: area for data categories you would like to see listed as the row headers
Please note: After dragging the categories to the hotspots, the “+” sign must be clicked to expand the data to see the individual values.
Click and drag these categories to “hot spots” found in the
table below.
{

How many current undergraduate students started at UHD as FTIC? (First Time in College— this student type is comprised of students who are new to higher education. This cohort of students is used for external reporting of retention and graduation rates)
1. Log into eIntelligence and expand the eIntelligence folder from the explorer tree on the left side of the
screen.
2. Since we wish to look at enrollment data, click the Enrollment Information data block.
3. Click the Quick View button.
4. Choose the Comparison Method and terms you wish to view.
5. Click the Enrollment Analytics tab.
6. Click the Load Enrollment Information button.
7. Drag the Student Type dimension back to dimensions area. Drag the dimension Admit Type Original to the row hotspot.
8. For the sake of this example,
you are interested in New Freshmen and New Freshmen International.
You may place a filter on it to see only them, or you can add % to see them as part of the whole.
How full are the online classes?
1. Log into eIntelligence and expand the eIntelligence folder from the explorer tree on the left side of the screen.
2. Since we wish to look at course data, click the Course Information data block.
3. Click the Quick View button.
4. Choose the comparison method and terms you wish to view.
5. Click the Course Analytics tab, and then the Load Course
Information button.
6. Drag Delivery Mode dimension down to the row hotspot.
7. Scroll to the right to find the Avg Pct Seats Filled column.
How many applications where received by the posted FTIC deadline for Fall 2012 compared to the same point in time (relative to the start of the
EXAMPLES OF ANALYTIC QUERIES

fall semester) the previous year?
1. Log into eIntelligence and expand the eIntelligence folder from the explorer tree on the left side of the screen.
2. Since we wish to look at applicants, click the Applicant Information data block.
3. Click the Quick View button.
4. Choose the Comparison Method, Fall to Fall, and term(s), 2011 and Fall 2012 for the Terms on the Input Parameters tab.
5. To answer this question, we will not need to change any of the other fields.
6. Click the Applicant Analytics tab.
7. The Posted deadline is 6/1/12 (based on the Admissions website). The equivalent date the year before is
5/27/11. These are the dates that will enter for Application Date and Second Application Date. The third
8. Click Load Applicant Information.
9. We will find a difference of 1,356applicants.
Application date will remain, “No term selected”.

Choose Input Parameters in the Daily Course Information Data Block
1. Choose which Record Set you wish to use in analyzing enrollment data. • Official: data as of the reporting day for the university (20thday). • Current: data as of the end of the semester for prior semesters. When a semester is in progress, it is
data as of the prior day (the system is refreshed each night). Note: Only the current record set will be available for the Daily Course Information.
2. Next, decide which “Comparison Method” to employ. The choices offered are: • Fall to Fall – Shows only Fall terms • Spring to Spring – Shows only Spring terms • Spring to Fall – Shows only Fall and Spring terms • Term order – Shows all types of terms(Fall, Spring, Summer and Winter)
3. Select the Term(s) and Term Date(s). You can select multiple dates in one semester or similar dates in different semesters. To allow for easier comparison, the dates as well as the index (how far the date is
DAILY COURSE ANALYTICS

from the start of classes) are both included on the Input Parameters Screen.
4. In the following sections, identify which specific data you would like to view. The choices offered are: • College • Campus • All Part of Term values? • All Sessions? • All Delivery/Instructional Modes? • All Course Levels?
To select more than one term, hold down the CTRL button on your keyboard and click each one separately. There is a checkbox above each section that allows you to choose all.
Note: In the Executive Dashboard and Daily Course the current day’s data will represent the data as of the current day’s morning snapshot. Previous days’ data will represent the end of that day’s snapshot.
Note: Occasionally there may be a date for which there is not data in Daily Course Information, this is due to Banner being down for maintenance and so a snapshot was not able to be taken that day.

Is the online enrollment 25 days before the first day of Summer I 2011 higher or lower than the same point in time for Summer I2010?
1. Log into eIntelligence and expand the eIntelligence folder from the explorer tree on the left side of the
screen.
2. Since we wish to look at daily course data, click the Daily Course Information data block.
3. Click the Quick View button.
EXAMPLES OF DAILY COURSE QUERIES
6. Click the Load Course Information button.

7. Drag the Delivery Mode dimension to the row hotspot.

8. Click the Measure Manager icon to change viewable measures. Use the disable all button to set all measures to disable status. Next, enable the Stu Cred Hrs and Percent by COLUMN measures by clicking the corresponding box until you see a green check mark. Click the Accept button.
9. View results based on selected criteria.

Applicant Analytics Questions:
Intro questions:
1. In the Fall of 2009, how many Hispanic females applied at UHD?
2. In the Spring of 2008, what was the total number of students who had the Academic Standing of “Good Standing?” What age range had the largest number of students in “Good Standing?”
Advanced questions:
1. How many applicants were there in the Spring of 2008?
2. What percentage of students applied for Graduate school in the Fall2009?
3. Comparing the Fall of 2008 and the Fall of 2009, which semester had the highest percentage of females with a completed Application Status?
4. For the Fall of 2007 and the Fall of 2008, what percent of female Hispanic students did not register for
classes after applying?
Enrollment Analytics Questions:
1. In the Fall of 2008, which major was declared most often?
2. In the Fall of 2007, what percentage of Hispanic students did not receive Financial Aid from the total number of students enrolled?
Course Analytics Questions:
1. In the Fall of 2009, how many courses were in rooms filled 51 – 75% of the time?
2. In the Fall of 2008, how many courses were held on Friday?
Daily Course Analytics Questions:
1. Comparing the first day of class for Fall 2009 to the first day of class for Fall 2010, which Session type had an increase in enrollment?
ANALYTICS PRACTICE QUESTIONS

2. How many enrollments occurred for Fall 2011 between April 25thand May 10th?
Expanded Practice
1. In Fall 2009, which ethnicity has the most 25-30-year-old applicants?
2. How many courses had their seats 76-100% filled in Spring 2007?
Note: Data in eIntelligence is refreshed on a regular basis. Historic data may change slightly due to changes and corrections made to the source data (e.g. Banner).
Applicant Analytics Questions:
Intro questions:
1. In the Fall of 2009, how many Hispanic females applied at UHD? (2,497) a. Input Parameters tab, choose Fall2009 b. Click the Applicant Analytics tab c. Click the Load Applicant Information button d. Drag the Ethnicity dimension into the row hotspot e. Drag the Gender dimension into the row hotspot f. Expand the + beside Hispanic
2. In the Spring of 2008, what was the total number of students who had the Academic Standing of “Good
Standing?” (1,068) What age range had the largest number of students in “Good Standing?” (25-30) a. Input Parameters tab, choose Spring 2008 b. Click the Applicant Analytics tab c. Click the Load Applicant Information button d. Drag the Academic Standing dimension to the row hotspot (for answer#1) e. Drag the Age Range dimension into the row hotspot
ANALYTICS PRACTICE QUESTIONS ANSWER KEY

f. Expand the + beside Good Standing
Advanced questions:
1. How many applicants were there in the Spring of 2008? (5,277) a. Input Parameters tab, choose Spring2008 b. Click the Applicant Analytics tab c. Click the Load Applicant Information button
2. What percentage of students applied for Graduate school in the Fall of 2009? (1.34%)
a. Input Parameters tab, choose Fall2009 b. Click the Applicant Analytics tab c. Click the Load Applicant Information button d. Drag the Level dimension to the row hotspot e. Next to the FX button, click the Sum button f. In the dialog box that appears, expand the Headcount option by clicking the plus g. Place an X beside Value and a checkmark beside Percents by COLUMN h. Click Accept (green checkmark)
3. Comparing the Fall of 2008 and the Fall of 2009, which semester had the highest percentage of females
with a completed Application Status? (Fall 2008 - .72%) a. Input Parameters tab, choose Fall 2008 and Fall2009 b. Click the Applicant Analytics tab c. Click the Load Applicant Information button d. Drag the Gender dimension to the row hotspot e. Drag the App Status dimension to the row hotspot f. Next to the FX button, click the Sum g. In the dialog box that appears, expand the Headcount option by clicking the plus. h. Place an X beside Value and a checkmark beside Percents by COLUMN i. Click Accept (green checkmark)
4. For the Fall of 2007 and the Fall of 2008, what percent of female Hispanic students did not register for
classes after applying? (Fall 2007 – 10.66%, Fall 2008 – 11.59%) a. Input Parameters tab, choose Fall 2008 and Fall2009 b. Click the Applicant Analytics tab c. Click the Load Applicant Information button d. Drag the Ethnicity dimension to the row hotspot e. Drag the Register dimension to the row hotspot f. Drag the Gender dimension to the row hotspot g. Next to the FX button, click the Sum button h. In the dialog box that appears, expand the Headcount option by clicking the plus. i. Place an X beside Value and a checkmark beside Percents by COLUMN j. Click Accept (green checkmark) k. Click the + beside Hispanic l. Click the + beside N (did not register)

Enrollment Analytics Questions:
1. In the Fall of 2008, which major was declared most often? (Accounting) a. Input Parameters tab, choose Fall2008 b. Click the Enrollment Analytics tab c. Click the Load Enrollment Information button d. Drag the Major dimension into the row hotspot e. Click the Credited Hours column title twice to list figures in descending order
2. In the Fall of 2007, what percentage of Hispanic students did not receive Financial Aid from the total
number of students enrolled? (16.27%) a. Input Parameters tab, choose Fall2007 b. Click the Enrollment Analytics tab c. Click the Load Enrollment Information button d. Drag the Ethnicity dimension to the row hotspot e. Drag the Finaid Recip dimension to the row hotspot f. Next to the FX button, click the Sum button g. In the dialog box that appears, expand the Headcount option by clicking the plus. h. Place an X beside Value and a checkmark beside Percent by COLUMN i. Click Accept (green checkmark) j. Click the + beside Hispanic
Course Analytics Questions:
1. In the Fall of 2009, how many courses were in rooms filled 51 – 75% of the room’s capacity? (478) a. Open the Course Information data block b. In the Input Parameters tab, choose Fall2009 c. Click the Course Analytics tab d. Click the Load Course Information button e. Drag the % Room Filled dimension to the left row hotspot f. See the 51-75% row and the Course Count column
2. In the Fall of 2008, how many courses were held on Friday? (68)
a. Open the Course Information data block b. In the Input Parameters tab, choose Fall2008 c. Click the Course Analytics tab d. Click the Load Course Information button e. Drag the Friday dimension to the left hand row hotspot f. See the Course Count column
Daily Course Analytics Questions:

1. Comparing the first day of class for Fall 2009 to the first day of class for Fall 2010, which Session type had an increase in enrollment? (Virtual)
a. Open the Daily Course Information data block b. In the Input Parameters tab, choose Fall 2010 and Fall2009 c. Select Date with index zero d. Click the Course Analytics tab e. Click the Load Course Information button f. Drag the Session dimension to the left hand row hotspot g. Drag Date and Term to the top row hotspot h. See the Current Enrollment column
2. How many enrollments occurred for Fall 2011 between April 25thand May 10th? (5,040)
a. Open the Daily Course Information data block b. In the Input Parameters tab, choose Fall2011 c. Select Date 04/25/2011 and 05/10/2011 d. Click the Course Analytics tab e. Click the Load Course Information button f. See the Current Enrollment column g. Find the different between each number 8284-3208=5,040
Expanded Practice
1. In Fall 2009, which ethnicity has the most 25-30-year-old applicants? (Black/Non-Hispanic) a. Open the Applicant Information data block b. Choose Fall 2009 c. Click the Applicant Analytics tab d. Click the Load Applicant Information button e. Drag the Age Range dimension to the left hand row hotspot f. Drag the Ethnicity dimension to the top green hotspot g. In the workspace area, click the top left plus (+) to expand the Ethnicity data
h. See the 25-30 row and find which ethnicity column has the highest number
2. How many courses had their seats 76-100% filled in Spring 2007? (786) a. Open the Course Information data block

b. From the “Comparison Method” drop-down, choose Spring to Spring c. Choose Spring 2007 d. Click the Course Analytics tab e. Click the Load Applicant Information button f. Drag the % Seats Filled dimension to the left hand row hotspot g. See the Course Count column and the 76-100% row

COHORT TRACKING

The Cohort data block allows you to track through time the cohort you select and look at their progress at UHD.
Cohort Tracking
1. Expand the eIntelligence folder. 2. Double-click the Applicant Cohort data block. 3. In the Input Parameters tab, select the desired the data. For example; Fall 2009 and leave the rest as All. 4. Click the Cohort Tracking tab. 5. Click the “Load Cohort Information” button. It may take a few minutes to load. 6. The default set-up shows one dimension:
• Term1Reg – if enrolled the first term(Y/N)
APPLICANT COHORT DATA BLOCK

ADVANCED TOPICS EXPORTING TO SPREADSHEET, CALCULATED FIELDS, AND MORE

At any time inside the analytics tabs, you may export the visible data (only expanded parts) to a spreadsheet. Simply right click anywhere in the work area and choose Export to Spreadsheet.
Calculations in UHD’s eIntelligence are for more advanced users who wish to create percentages or averages between data items. The following is an example of how to create a calculation in a column.
What is the percentage of male vs female applicants regarding registered hours for Fall2009?
1. Expand the eIntelligence folder from the explorer tree on the left side of the screen.
2. Since we wish to look at the amount of hours registered, click the Enrollment Information data block, and
click the Quick View button.
3. In the Input Parameters tab, choose the parameters you wish to use for the calculation.
4. Click the Enrollment Analytics tab.
5. Click the Load Enrollment Information button at the top right.
6. Drag the Gender dimension into the row hotspot.
7. Down below in the Measures dimension area, click the FX button.
8. Click the “Run calculated measure dialog”
9. Click the Add New Measure button.
10. Name this calculation PCT By Gender.
11. In the left pane, double-click HEADCOUNT.
12. In the right pane, double-click COUNT.
13. Click OK (green checkmark).
14. Next to the FX button, click the Sum button.
EXPORT TO SPREADSHEET
CALCULATIONS

15. In the dialog box that appears, expand the PCT by Gender option by clicking the plus.
16. Place an X beside Value and a
checkmark beside % by group.
17. Now expand the Registered Hours option. Place an X beside Value and a checkmark beside % by c group again.
18. Click OK (green checkmark).
19. Now under each new measure
column you created, you should see the percentage values.

GLOSSARY

eINTELLIGENCE GLOSSARY
Term Definition
% ROOMFILLED Proportion/percentage of seats filled divided by the total number of seats available in the room
% SEATS FILLED Proportion of filled seats divided by the maximum capacity established for the CRN
ACCUPLC ELEM ALG(APEA) Accuplacer Elementary Algebra scores
ACCUPLCREAD(APRC) Accuplacer Reading Comprehension scores
ACCUPLC WRIT(APSS) Accuplacer Sentence Skills scores
ACCUPLC WRIT ESY(APWE) Accuplacer Written Essay scores
ACADEMICSTANDING Rule-based value showing student’s academic progress by term
ACTCOMPOSITE
College entrance exam. Note: Test Scores were not required for admission until 2011. If multiple scores are submitted, the highest is brought into eIntelligence
ACT ENGLISH ACT component test
ACT MATH ACT component test
ACT READING ACT component test
ACTSCIENCE ACT component test
ACT SOCIALSCIENCE ACT component test; In 1989, this component was replaced by the Reading Component.
ADMITTYPE How an incoming applicant’s APPLICATION is classified FORADMITTANCE
ADMITTYPECURRENT Admit Type displayed in a Continuing or Returning Student record
ADMITTYPEORIGINAL Admit Type displayed in Applicant ‘s first application record
AGERANGE Students’ age groups
APPSTATUS Status of student application(e.g., complete, incomplete, decision made)
APPLICANTCOHORT Area that displays data by specific applicant cohort group (e.g., graduation rates by admit term) using dimensions and measures established for cohorts.
APPLICANTCOHORT-COHORT TRACKING Tab within Applicant Cohort that show data based on Input Parameters selected and allows further drill down using dimensions
APPLICANTCOHORT-INPUT PARAMETERS Tab within Applicant Cohort that initially extract groups by admit term, college, level, major, financial aid applicant, gender and student type

APPLICANTINFORMATION Area that displays data by specific applicant groups using snapshots and analytics established for applicants.
APPLICANT INFORMATION- INPUTPARAMETERS
Tab within Applicant Information that initially extract groups by comparison method (e.g., fall to fall), term, level, college, student type and major
APPLICANT INFORMATION- APPLICANTANALYTICS
Tab within Applicant Information displaying data as selected on Input Parameter tab. Can further drill down using dimensions and measures to display greater detail
APPLICANT INFORMATION- APPLICANTSNAPSHOT
Multiple applicant views in graph form. Ability to drill down and display graphs of additional groups in detail
APPLIED TO GRADUATETERM Indicates the term a student has indicated they plan to graduate by the formal application process required by each academic college
ATTRITION TERM Term that the student is not enrolled at UHD
ASTD OVERRIDE Academic standing changed within a term
AVGENROLLMENT A measure created by taking the current enrollment divided by the count of courses
AVG PCT ROOMFILLED
Average percentage of seats filled divided by the total number of seats available in the room. NOTE: This value is set to zero for classes that do not have a room assigned(including online classes)
AVG PCT SEATSFILLED Average percentage of filled seats divided by the maximum capacity established for the CRN
AVG TERM UHDGPA Average UHD GPA by term
AVG TERM TFERGPA Average transfer GPA by term
AVG TERM HRSEARNED Average hours earned by term
AVG TERM HRSATTMPT Average hours attempted by term
BANNER ID Nine digit identification number assigned to applicant/student
BEGIN_TIME Class/Section Start Time
BMV HOLD Indicate whether or not an Applicant or Student has the hold requiring a Meningitis shot on their record
BREAK EVENPOINT (ADJUNCT)
Number of students needed to take the class to offset the average cost (faculty salary only) of a faculty of rank of Adjunct teaching the class. The breakeven point visible in eIntelligence is determined assuming an average faculty salary based on rank and department.

BREAK EVEN POINT (ASSISTANT)
Number of students needed to take the class to offset the average cost (faculty salary only) of a faculty of rank of Assistant Professor teaching the class. The breakeven point visible in eIntelligence is determined assuming an average faculty salary based on rank and department.
BREAK EVENPOINT (faculty salary only) of a faculty of rank of Associate Professor teaching the (ASSOCIATE)
Number of students needed to take the class to offset the average cost class. The breakeven point visible in eIntelligence is determined assuming an average faculty salary based on rank and department.
BREAK EVENPOINT (LECTURER)
Number of students needed to take the class to offset the average cost (faculty salary only) of a faculty of rank of Lecturer teaching the class. The breakeven point visible in eIntelligence is determined assuming an average faculty salary based on rank and department.
BREAK EVENPOINT (PROFESSOR)
Number of students needed to take the class to offset the average cost (faculty salary only) of a faculty of rank of Professor teaching the class. The breakeven point visible in eIntelligence is determined assuming an average faculty salary based on rank and department.
BUILDING The building that corresponds to the room assignment for a specific class (online and many off-campus classes will be TBA)
BUSINESS INTELLIGENCE The process of gathering and analyzing industry information for the purpose of decision making
CAMPUS Campus/off-campus values
CATALOGTERM Academic Catalog a student is following in terms of their graduation requirements
CELLPHONENUMBER Cellular telephone number as provided by applicant/student
CITY City of student’s address
CLASSSIZERANGE Number of students in the course broken into ranges, based on maximum enrollment
CLASSIFICATION Student level (e.g. Freshman)
CLOSEDSECTIONS Section no longer allow student registration when Actual enrollment= Maximum enrollment.
COHORT Group of applicants or students identified and monitored by a term, year or other characteristics
COLLEGE UHD academic divisions, some of who house departments
COMPARISIONMETHOD Data displayed by term/semester-based selection
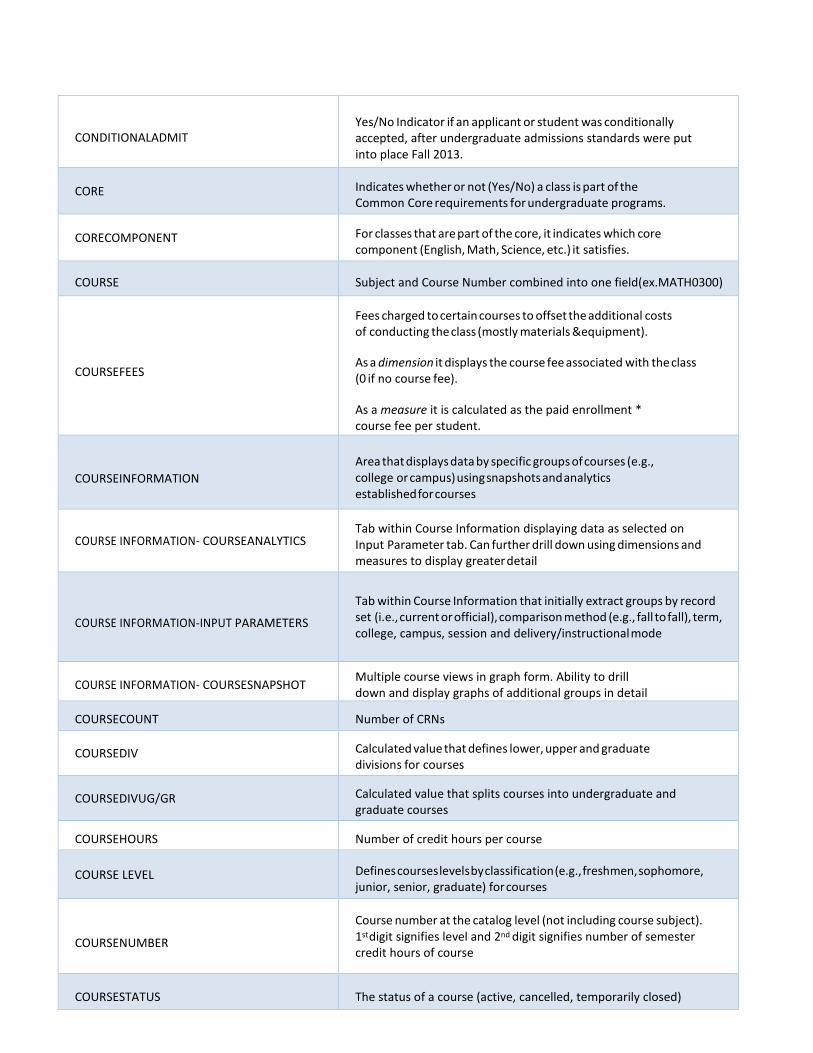
CONDITIONALADMIT Yes/No Indicator if an applicant or student was conditionally accepted, after undergraduate admissions standards were put into place Fall 2013.
CORE Indicates whether or not (Yes/No) a class is part of the Common Core requirements for undergraduate programs.
CORECOMPONENT For classes that are part of the core, it indicates which core component (English, Math, Science, etc.) it satisfies.
COURSE Subject and Course Number combined into one field(ex.MATH0300)
COURSEFEES
Fees charged to certain courses to offset the additional costs of conducting the class (mostly materials &equipment). As a dimension it displays the course fee associated with the class (0 if no course fee). As a measure it is calculated as the paid enrollment * course fee per student.
COURSEINFORMATION Area that displays data by specific groups of courses (e.g., college or campus) using snapshots and analytics established for courses
COURSE INFORMATION- COURSEANALYTICS Tab within Course Information displaying data as selected on Input Parameter tab. Can further drill down using dimensions and measures to display greater detail
COURSE INFORMATION-INPUT PARAMETERS
Tab within Course Information that initially extract groups by record set (i.e., current or official), comparison method (e.g., fall to fall), term, college, campus, session and delivery/instructional mode
COURSE INFORMATION- COURSESNAPSHOT Multiple course views in graph form. Ability to drill down and display graphs of additional groups in detail
COURSECOUNT Number of CRNs
COURSEDIV Calculated value that defines lower, upper and graduate divisions for courses
COURSEDIVUG/GR Calculated value that splits courses into undergraduate and graduate courses
COURSEHOURS Number of credit hours per course
COURSE LEVEL Defines courses levels by classification (e.g., freshmen, sophomore, junior, senior, graduate) for courses
COURSENUMBER
Course number at the catalog level (not including course subject). 1st digit signifies level and 2nd digit signifies number of semester credit hours of course
COURSESTATUS The status of a course (active, cancelled, temporarily closed)
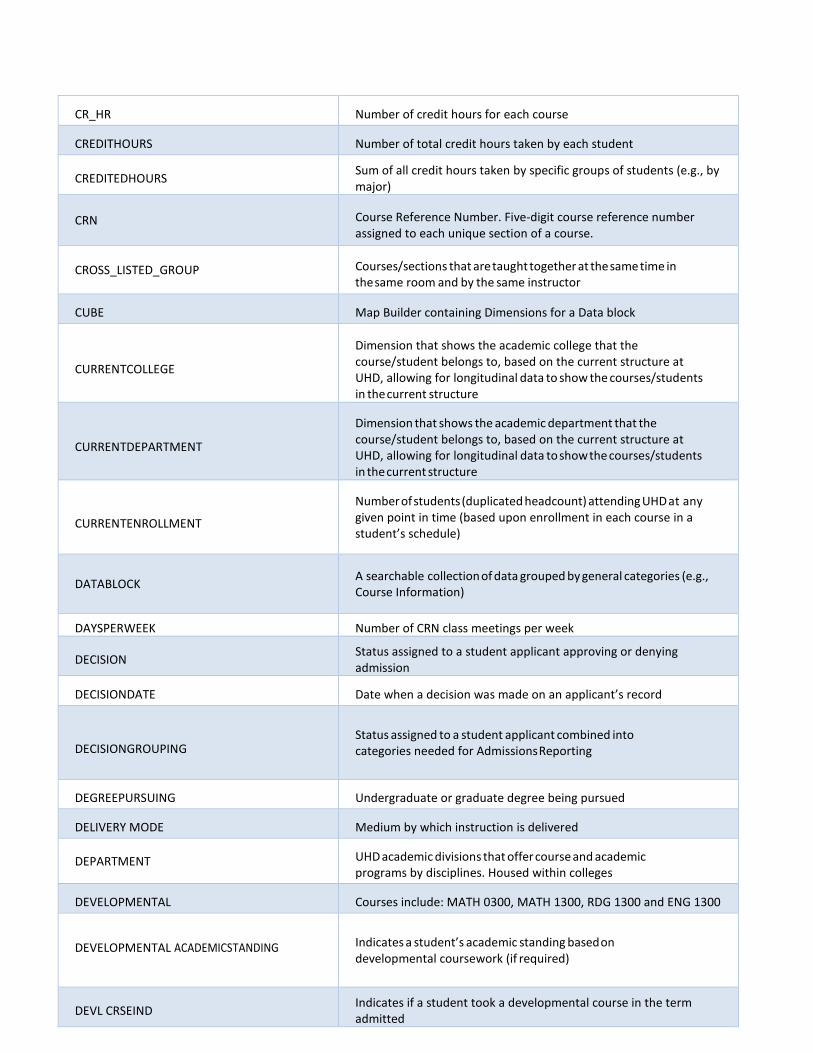
CR_HR Number of credit hours for each course
CREDITHOURS Number of total credit hours taken by each student
CREDITEDHOURS Sum of all credit hours taken by specific groups of students (e.g., by major)
CRN Course Reference Number. Five-digit course reference number assigned to each unique section of a course.
CROSS_LISTED_GROUP Courses/sections that are taught together at the same time in the same room and by the same instructor
CUBE Map Builder containing Dimensions for a Data block
CURRENTCOLLEGE
Dimension that shows the academic college that the course/student belongs to, based on the current structure at UHD, allowing for longitudinal data to show the courses/students in the current structure
CURRENTDEPARTMENT
Dimension that shows the academic department that the course/student belongs to, based on the current structure at UHD, allowing for longitudinal data to show the courses/students in the current structure
CURRENTENROLLMENT
Number of students (duplicated headcount) attending UHD at any given point in time (based upon enrollment in each course in a student’s schedule)
DATABLOCK A searchable collection of data grouped by general categories (e.g., Course Information)
DAYSPERWEEK Number of CRN class meetings per week
DECISION Status assigned to a student applicant approving or denying admission
DECISIONDATE Date when a decision was made on an applicant’s record
DECISIONGROUPING Status assigned to a student applicant combined into categories needed for Admissions Reporting
DEGREEPURSUING Undergraduate or graduate degree being pursued
DELIVERY MODE Medium by which instruction is delivered
DEPARTMENT UHD academic divisions that offer course and academic programs by disciplines. Housed within colleges
DEVELOPMENTAL Courses include: MATH 0300, MATH 1300, RDG 1300 and ENG 1300
DEVELOPMENTAL ACADEMICSTANDING Indicates a student’s academic standing based on developmental coursework (if required)
DEVL CRSEIND Indicates if a student took a developmental course in the term admitted

DIMENSION
Characteristics that represent attributes of a single group or a combination of groups within a data block
DRILL-DOWN Ability to see a specific piece of data in greater detail
EARLY COLLEGE HIGH SCHOOL A yes/no indicator that an applicant is coming to UHD from an Early College High school
ENROLLMENT INFORMATION Area that displays data by specific enrollment groups (e.g., college enrollments by gender) using snapshots and analytics established for enrollment.
ENROLLMENT INFORMATION- ENROLLMENTANALYTICS
Tab within Enrollment Information displaying data as selected on Input Parameter tab. Can further drill down using dimensions and measures to display greater detail
ENROLLMENT INFORMATION- INPUTPARAMETERS
Tab within Enrollment Information that initially extract groups by record set (i.e., current or official), comparison method (e.g., fall to fall), term, student type, college, major and level
ENROLLMENT INFORMATION- MULTI-TERM ENROLLMENT SNAPSHOT
Multiple student enrollment views in graph form using multiple terms. Ability to drill down and display graphs of additional groups in detail
ENROLLMENT INFORMATION- ENROLLMENTSNAPSHOT
Multiple student enrollment views in graph form for a single term. Ability to drill down and display graphs of additional groups in detail
ENROLLEDSIZERANGE Number of students in the course broken into ranges, based on actual enrollment
ETHNICITY
Self-reported race/ethnicity information for students. Beginning in Fall 2010 the question was split into a two-question format. The information is recoded back to one item to enable comparison across time.
EXECUTIVE DASHBOARD Area that displays high-level, at-a-glance and daily detail data using multiple terms for applicants, financial aid, headcount, semester credit hours, registered and paid students.
EXECUTIVE DASHBOARD- STATISTICS Tab within Executive Dashboard that displays applicant, student, graduate student and financial aid statistics by term(s)
EXECUTIVEDASHBOARD- DAILY SUMMARYCHARTS
Tab within Executive Dashboard that displays a daily comparison of headcount and semester credit hour progression by term(s)in graphical form

EXECUTIVE DASHBOARD- DAILYDETAIL
Tab within Executive Dashboard that displays a daily comparison of registered and paid duplicated headcount and semester credit hour progression by term(s) in tabular form
FA AWRD Number of students who have had financial aid offered to them
FAPSTD Number of students who have accepted financial aid awards offered to them
FA_OFF The number of individuals who have been presented with an aid package by financial aid office. This number includes anyone offered aid, regardless of enrollment status.
FILTER Include/exclude specific values or groups from query
FINAIDAPPLICANT An applicant/student who is seeking financial aid.
FINAIDRECIP An applicant/student who is awarded financial aid
FIRST ENROLLTERM First term a student is enrolled at UHD
FIRST GENERATIONCOLLEGE Indicator of if a student is a first generation college student, using definition that both parents have less than a baccalaureate degree.
FIRST / LASTATTEMPT Indicator that lets a person choose if they want to limit selection to only the first attempt (earliest), last attempt (latest), or all attempts at a given course that a student has made.
FIRSTTIMETAKERS Students who are taking a course for the first time
FIXEDTUITION Indicates if a student is part of the fixed rate tuition plan (started Fall 2014)
FRIDAY Fifth weekday
FT ORPT Full or part time students
FUNDINGCODE Code assigned to course based on course content, determines formula funding level from the state
GATEKEEPER
Indicates if a student took a gatekeeper course in the term admitted. ENG 1302, HIST 1305 and MATH 1301 are the gatekeeper courses (these courses are identified as bottleneck courses for UHD’s Quality Enhancement Plan(QEP)
GATOREMAIL UHD assigned email address
GENDER Male, Female or Unknown
GMATRANGE Test score ranges on GMAT test for graduate applicants
GRE QUANTRANGE Test score ranges on GRE Quantitative test for graduate applicants
GRE QUANT RANGE(NEW TEST) Test score ranges on new GRE Quantitative test for graduate applicants
GRE VERBALRANGE Test score ranges on GRE Verbal test for graduate applicants
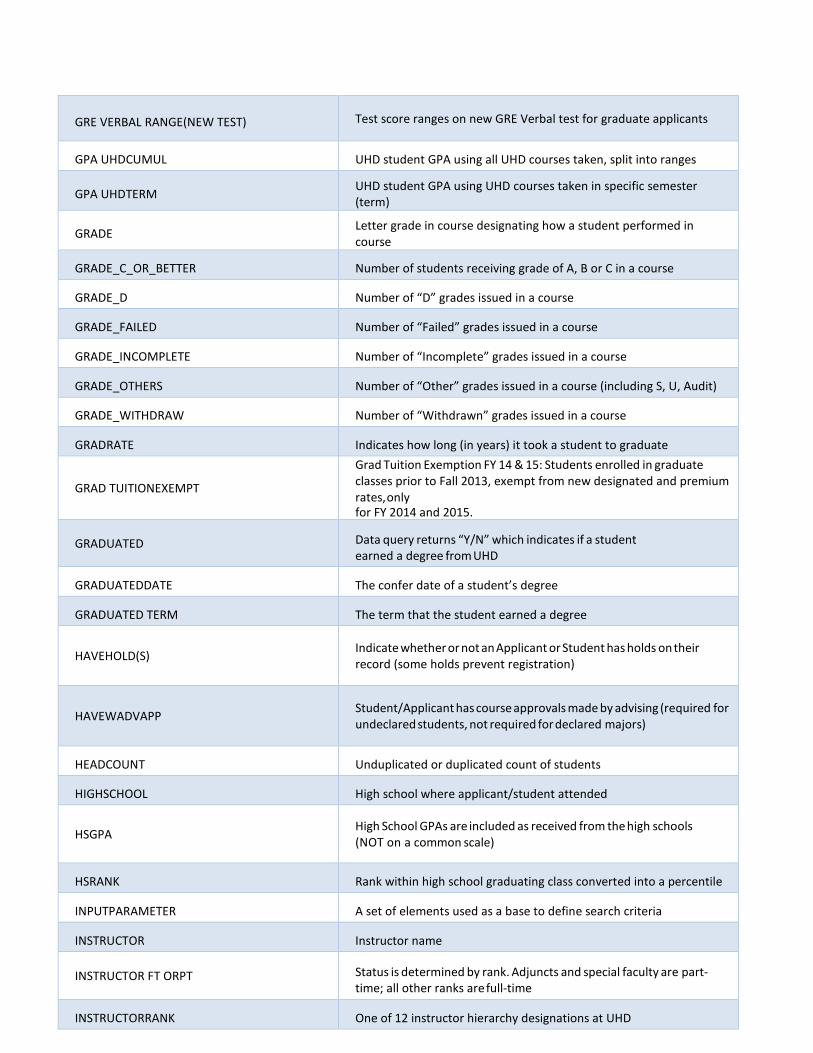
GRE VERBAL RANGE(NEW TEST) Test score ranges on new GRE Verbal test for graduate applicants
GPA UHDCUMUL UHD student GPA using all UHD courses taken, split into ranges
GPA UHDTERM UHD student GPA using UHD courses taken in specific semester (term)
GRADE Letter grade in course designating how a student performed in course
GRADE_C_OR_BETTER Number of students receiving grade of A, B or C in a course
GRADE_D Number of “D” grades issued in a course
GRADE_FAILED Number of “Failed” grades issued in a course
GRADE_INCOMPLETE Number of “Incomplete” grades issued in a course
GRADE_OTHERS Number of “Other” grades issued in a course (including S, U, Audit)
GRADE_WITHDRAW Number of “Withdrawn” grades issued in a course
GRADRATE Indicates how long (in years) it took a student to graduate
GRAD TUITIONEXEMPT
Grad Tuition Exemption FY 14 & 15: Students enrolled in graduate classes prior to Fall 2013, exempt from new designated and premium rates, only for FY 2014 and 2015.
GRADUATED Data query returns “Y/N” which indicates if a student earned a degree from UHD
GRADUATEDDATE The confer date of a student’s degree
GRADUATED TERM The term that the student earned a degree
HAVEHOLD(S) Indicate whether or not an Applicant or Student has holds on their record (some holds prevent registration)
HAVEWADVAPP Student/Applicant has course approvals made by advising (required for undeclared students, not required for declared majors)
HEADCOUNT Unduplicated or duplicated count of students
HIGHSCHOOL High school where applicant/student attended
HSGPA High School GPAs are included as received from the high schools (NOT on a common scale)
HSRANK Rank within high school graduating class converted into a percentile
INPUTPARAMETER A set of elements used as a base to define search criteria
INSTRUCTOR Instructor name
INSTRUCTOR FT ORPT Status is determined by rank. Adjuncts and special faculty are part-time; all other ranks are full-time
INSTRUCTORRANK One of 12 instructor hierarchy designations at UHD

INSTRUCTOR TENURE Tenure status of faculty teaching the course
LEVEL Level at which applicant is applying (undergraduate or graduate)
LOAD APPLICANT INFORMATION Function that retrieves and loads data into applicant analytics
LOADAPPLICANT SNAPSHOT FORM Function that retrieves and loads data into applicant graphical views
LOADCOURSEINFORMATION Function that retrieves and loads data into course analytics
LOADCOURSESNAPSHOT Function that retrieves and loads data into course graphical views
LOAD ENROLLMENT INFORMATION
Function that retrieves and loads data into enrollment analytics
LOAD ENROLLMENT SNAPSHOT
Function that retrieves and loads data into enrollment graphical views using a single term
LOADMULTI-TERM ENROLLMENTSNAPSHOT Function that retrieves and loads data into enrollment graphical views using multiple terms
MAJOR Field of study
MAJOR_CONC
Major Concentration—a more specialized field of study within a major (e.g., Interdisciplinary Studies is a major, Interdisciplinary Studies in Bilingual EC-4 is a major concentration)
MAX_ENROLLMENT Maximum registrations set for each CRN
MAX_XLINK_ENROLLMENT Maximum registration set for a cross listed group of CRNs (if class not cross listed is zero), may be lower than MAX_ENROLLMENT of individual CRNs
MAXIMUM ENRLMT Maximum registrations set for each CRN
MEASURE Comparisons to denote various statistical quantitative and qualitative displays (e.g., by value, column vs. row)
MEASURE MANAGER Houses display choices within each Measure of a Data block
EETING DAYS Course section meeting patterns using days of the week, combined into one field (e.g., M, MW,MWF)
MINOR 1 AND MINOR2 Declared minor field of study
MITC Multi-institutional teaching centers where different colleges/universities offer courses
MONDAY First weekday

MS CJ ONLINEPROGRAM Indicates if an applicant has expressed interest (on Apply Texas) in pursuing the MS in Criminal Justice degree in the online format.
NAME Name of applicant/student (last, first middle)
NEW TSIESSAY Score ranges of new TSI score, introduced Fall 2013
NEW TSIMATH Score ranges of new TSI score, introduced Fall2013
NEW TSIREADING Score ranges of new TSI score, introduced Fall 2013
NEW TSIWRITING Score ranges of new TSI score, introduced Fall 2013
OFFICIALRECORDSET
The official record set is based on data as of 20th day of the full term. This record set includes student and course enrollments in the full term, as well as the Parts of Term that start at the same time as the full term (example: First 8-week).
OPENSECTIONS Course sections that are still available for registrations because the maximum enrollment has not been met
OPEN_CLOSE_IND
Designation indicating sections that are open (maximum enrollment has not been met and is available to accept registrations) or closed (maximum enrollment has been met and is no longer available for registration)
ORIENTATION Indicates whether or not an applicant/student attended New Student Orientation
PAID
Indicates if students (duplicated headcount) have paid registrations. Values include: Y, N or C (“C” indicates registration is temporarily saved but not paid. These registrations will be purged if payment is not received by the 20th class day and the “C” updated to “Y”); in Executive Dashboard it is an unduplicated headcount of paid students
PAID SCH Paid Semester Credit Hours. New field will not show data prior to November2012
PAIDSTUDENTS Number of students (duplicated headcount) who no longer owe a balance for registrations
PART OFTERM Designation of what session a class is taking place in (examples: first 4- week, first 8-week, full term) Note: First used in Spring 2012
PART OF TERM 1 Number of credit hours a student is enrolled in taking place in the full length semester. Note: First used in Spring2012
PART OF TERM41 Number of credit hours a student is enrolled in taking place in the first 4- week term of the semester. Note: First used in Spring 2012

PART OF TERM42 Number of credit hours a student is enrolled in taking place in the second 4- week term of the semester. Note: First used in Spring 2012
PART OF TERM43 Number of credit hours a student is enrolled in taking place in the third 4- week term of the semester. Note: First used in Spring 2012
PART OF TERM44 Number of credit hours a student is enrolled in taking place in the fourth 4-week term of the semester. Note: First used in Spring2012
PART OF TERM81 Number of credit hours a student is enrolled in taking place in the first 8- week term of the semester. Note: First used in Spring 2012
PART OF TERM82 Number of credit hours a student is enrolled in taking place in the second 8- week term of the semester. Note: First used in Spring 2012
PELLRECIPIENT “Y/N” indicator designating a student as being a PELL Grant (need-based award) recipient
PERSONALEMAIL Personal email address, as provided by applicant/student
PHONENUMBER ‘Landline’ telephone number as provided by applicant/student
PREVCOLLEGE Most recent college where applicant was previously enrolled
PREV COLLEGE LEVEL Level (2 year, 4 year) of most recent college where applicant was previously enrolled
PREV COLLEGE CONTROL Control (public, private) of most recent college where applicant was previously enrolled
PROGRAM
Student or applicant designated major and degree combination. This field will also indicate if a student is not seeking a degree from UHD (Program=NON_DEGR) or if a student has been admitted to a college but not yet declared a major(BU_BBA)
RECORDSET
Use of official or current records for query. Official data is of 12thclass day, or certified 20th class day data. After 20th day, no longer refreshes. Current data refreshes every morning with current data. Not available for Applicant Information
RECRUITTYPE Indicates the source of the application
REG Headcount of Registered Students
REGISTER Indicates whether or not an applicant is registered as a student at UHD (Y/N)
REG SCH Registered Semester Credit Hours. New field will not show data prior to November 2011
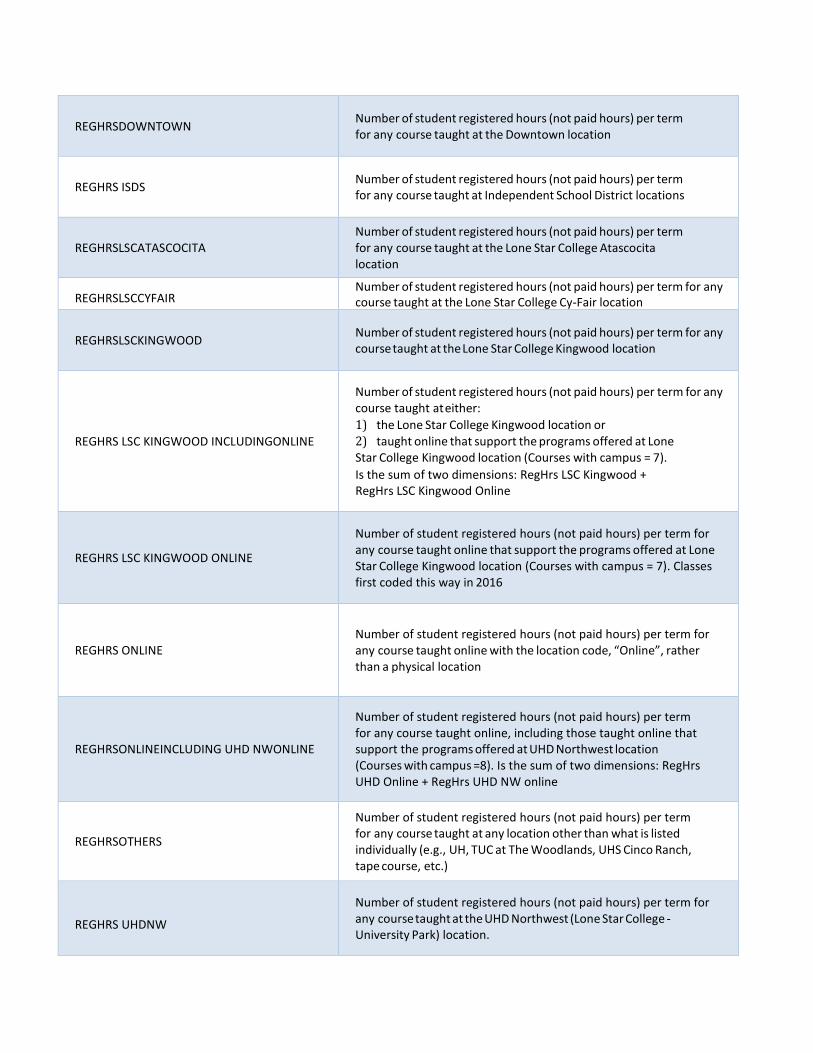
REGHRSDOWNTOWN Number of student registered hours (not paid hours) per term for any course taught at the Downtown location
REGHRS ISDS Number of student registered hours (not paid hours) per term for any course taught at Independent School District locations
REGHRSLSCATASCOCITA Number of student registered hours (not paid hours) per term for any course taught at the Lone Star College Atascocita location
REGHRSLSCCYFAIR Number of student registered hours (not paid hours) per term for any course taught at the Lone Star College Cy-Fair location
REGHRSLSCKINGWOOD Number of student registered hours (not paid hours) per term for any course taught at the Lone Star College Kingwood location
REGHRS LSC KINGWOOD INCLUDINGONLINE
Number of student registered hours (not paid hours) per term for any course taught at either: 1) the Lone Star College Kingwood location or 2) taught online that support the programs offered at Lone Star College Kingwood location (Courses with campus = 7). Is the sum of two dimensions: RegHrs LSC Kingwood + RegHrs LSC Kingwood Online
REGHRS LSC KINGWOOD ONLINE
Number of student registered hours (not paid hours) per term for any course taught online that support the programs offered at Lone Star College Kingwood location (Courses with campus = 7). Classes first coded this way in 2016
REGHRS ONLINE Number of student registered hours (not paid hours) per term for any course taught online with the location code, “Online”, rather than a physical location
REGHRSONLINEINCLUDING UHD NWONLINE
Number of student registered hours (not paid hours) per term for any course taught online, including those taught online that support the programs offered at UHD Northwest location (Courses with campus =8). Is the sum of two dimensions: RegHrs UHD Online + RegHrs UHD NW online
REGHRSOTHERS
Number of student registered hours (not paid hours) per term for any course taught at any location other than what is listed individually (e.g., UH, TUC at The Woodlands, UHS Cinco Ranch, tape course, etc.)
REGHRS UHDNW
Number of student registered hours (not paid hours) per term for any course taught at the UHD Northwest (Lone Star College - University Park) location.

REGHRS UHD NWINCLUDING UHD NWONLINE
Number of student registered hours (not paid hours) per term for any course taught at either: 1) the UHD Northwest (Lone Star College - University Park) location 2) taught online that support the programs offered at UHD Northwest location (Courses with campus=8). Is the sum of two dimensions: RegHrs UHD NW + RegHrs UHD NW online
REGHRS UHD NWONLINE
Number of student registered hours (not paid hours) per term for any course taught online that support the programs offered at UHD Northwest (Lone Star College – University Park) location (Courses with campus = 8). Classes first coded this way in Spring 2013.
REMEDIALIND Indicates if a student took a remedial course in the term admitted.
REMEDIAL To correct or improve deficient skills. Courses taken should a student fail Developmental courses.
REPEAT UHDCOURSE
Indicator (Yes/No) about whether or not a student has repeated a course at UHD, including if repeating a course in the currently enrolled term
REPEAT TRANSFERCOURSE
Indicator (Yes/No) about whether or not a student has repeated a course that is transferred into UHD from another institution, repeating is looked at across all other institutions.
ROOM Location where a course is taught
RESIDENCY Pertains to in-state vs. out-of-state for resident and tuition level purposes
SATCOMPOSITE
College entrance exam. Composite score is comprised of Critical Reading and Math scores. Note: Test Scores were not required for admission until 2011. If multiple scores are submitted, the highest is brought into eIntelligence
SATMATH SAT component test
SATVERBAL SAT component test, now called Critical Reading
SATWRITING SAT component test
SATURDAY Last day of week. One of two weekend days
SCHEDULETYPE The primary type of instruction used in a course (e.g., lecture, lab, seminar, etc.)
SCHOLARSACADEMY Indicator of whether or not a student is a member of UHD Scholars Academy

SESSION Pertains to time of day or week when section is offered (e.g., day, night, virtual)
SITE A code assigned to students who are interested in taking classes primarily at one of our off-site locations or who are online only. “Unassigned” for many of our students.
SIX YEAR GRADUATIONRATE Indicates the term by which a student must graduate to be counted in the six year graduation rate, populated only for those who start as full-time FTIC students.
STATE State as listed on student's mailing address
STUCOUNTINGMETHOD Student Counting Method. Options listed: All attempts (duplicated) or Only latest course taken by student
STU CREDHRS Number of attempted student credit hours
STUDENT LEVEL Level at which student is enrolled (undergraduate, graduate)
STUDENTTYPE Student categories that indicate initial admission and the subsequent student status
STUDENTTYPEGROUPING Student types combined into categories needed for Enrollment Reporting
SUBJECT Course subject code for disciplines/instructional areas
SUNDAY First day of week. One of two weekend days. (designated “U”)
TAB A tag or label displayed across the top of the display that navigates to another area in one click
TERM UHD semester (201020 = Spring2010)
TERM DECLARED Term that an applicant member of a cohort first declared a major
TERM1REG Indicator of whether or not enrolled the semester selected (shows as Y- term or N-term with term being the term selected)
TERM2REG
Indicates whether or not an applicant enrolled in the next long semester (fall, spring) after the term for which they applied. Ex. Applicant term is Fall 2008, indicates whether or not enrolled Spring2009
TERM3REG
Indicates whether or not an applicant enrolled in the third long semester (fall, spring) after the term for which they applied. Ex. Applicant term is Fall 2008, indicates whether or not enrolled Fall 2009
TERM4REG
Indicates whether or not an applicant enrolled in the fourth long semester (fall, spring) after the term for which they applied. Ex. Applicant term is Fall 2008, indicates whether or not enrolled Spring2010

TERM6REG
Indicates whether or not an applicant enrolled in the sixth long semester (fall, spring) after the term for which they applied. Ex. Applicant term is Fall 2008, indicates whether or not enrolled Spring2011
TERM8REG Indicates whether or not an applicant enrolled in the eighth long semester (fall, spring) after the term for which they applied. Ex. Applicant term is Fall 2008, indicates whether or not enrolled Spring 2012
TERM10REG
Indicates whether or not an applicant enrolled in the tenth long semester (fall, spring) after the term for which they applied. Ex. Applicant term is Fall 2008, indicates whether or not enrolled Spring2013
TERM12REG
Indicates whether or not an applicant enrolled in the twelfth long semester (fall, spring) after the term for which they applied. Ex. Applicant term is Fall 2008, indicates whether or not enrolled Spring2014
THURSDAY Fourth weekday (designated “R”)
TIME Time at which the data snapshot was taken(Executive Dashboard)
TRANSFER Indicates transfer student, based on if they have transfer hours articulated.
TSI Status An applicant/student’s status (complete, exempt, not complete) related to the Texas Success Initiative(TSI)
TUESDAY Second weekday
UGGPA Bachelor degree GPA ranges of applicants, from UHD or transfer institution
XLINKENROLLMENT Enrollment in a set of CRNs that are cross listings of the same class. If a class is NOT cross listed the enrollment for that class is used in this dimension
WEDNESDAY Third weekday
WPE INDICATOR Indicates if Writing Proficiency Exam has been completed.
ZIPCODE Five digit number zip codes used in Enrollment Information area
ZIPLOCATION Zip code groupings (not by 5-digit zip codes) used in Applicant, Applicant Cohort and Enrollment Information areas

NOTES