Use of polymerase chain reaction analysis of urinary DNA to detect bladder carcinoma
6
Original article Use of polymerase chain reaction analysis of urinary DNA to detect bladder carcinoma Brian Little, M.D. a, *, Anne Hughes, Ph.D. b , Michael R.A. Young, M.D. a , Aiden O’Brien, M.B. a a Craigavon Area Hospital, Craigavon, Northern Ireland b Belfast City Hospital, Belfast, Northern Ireland Received 29 April 2004; received in revised form 18 October 2004; accepted 19 October 2004 Abstract A cohort of 113 patients underwent prospective evaluation with a panel of seven microsatellites, on chromosomes 9, 13 and 17. Thirty-seven patients had histologically confirmed bladder tumors, 53 patients had a history of previous transitional cell carcinoma of the bladder (TCC) but normal cystoscopies (control Group 1), and 23 patients had no previous history of TCC and normal cystoscopies (control Group 2). Urinary DNA was considered to show a deletion if an allele was reduced by more than 50%, and this was considered diagnostic of bladder carcinoma. The sensitivity of the method was 50%, positive predictive value was 80%, and specificity was 93%. Reducing the threshold for defining allelic loss increases sensitivity, but reduces specificity. The concentration of urinary DNA in the sample did not influence detection rate. The grade and stage of the bladder tumor did not influence the likelihood of detection. This method detects bladder carcinoma with high specificity, and increasing the number of microsatellites used should increase sensitivity. © 2005 Elsevier Inc. All rights reserved. Keywords: Bladder cancer; Transitional cell carcinoma; Detection; Urine 1. Introduction At present, the gold standard for the detection of de novo or recurrent carcinoma of the urinary bladder is cystoscopy with direct visualization of the bladder. Tests of the patient’s urine may also be used to add to the diagnostic process, but as yet none has been sensitive or specific enough to replace cystos- copy. The ideal test for bladder cancer detection should be noninvasive, 100% sensitive and specific, and produce results instantly. Tests that have been used include the bladder tumor antigen (BTA) test, nuclear matrix protein (NMP22), urinary cytology, fluorescent in situ hybridization (FISH) and telom- erase activity [1– 6]. Microsatellite analysis can detect chromosomal dele- tions. Certain chromosomal deletions occur frequently in transitional cell carcinoma of the bladder, such as around the P16/INK4A locus on chromosome 9 and in the region of TP53, both of which are believed to be integral to tumor development [7]. Tumors may slough cells more readily into urine than normal bladder mucosa as a consequence of their increased cell turnover. Extraction of DNA from these exfoliated cells and detection of allelic losses may be a useful marker of tumor presence or recurrence. Markers used should be based around regions of frequent chromo- somal loss in bladder carcinoma, as this will increase the likelihood of tumor detection. The objective of this study was to establish if the allelic ratios produced following polymerase chain reaction amplification of blood and uri- nary DNA with a panel of seven polymorphic amplimers, could be compared to detect chromosomal deletions. Any deletions identified could diagnose the presence of a bladder tumor. The markers used in this study were clustered around regions of frequent loss in transitional cell carcinoma of the bladder. Two markers were used on each of the long and short arms of chromosome 9, one marker adjacent to the Retinoblastoma gene locus on chromosome 13, and two markers adjacent to the TP53 locus on chromosome 17. 2. Materials and methods The Queen’s University of Belfast ethics committee pro- vided ethical approval for this study. From each patient, * Corresponding author. Tel.: 0044-141-2112000; fax: 0044-141- 3376010. E-mail address: [email protected] (B. Little). Urologic Oncology: Seminars and Original Investigations 23 (2005) 102–107 1078-1439/05/$ – see front matter © 2005 Elsevier Inc. All rights reserved. doi:10.1016/j.urolonc.2004.10.009
-
Upload
brian-little -
Category
Documents
-
view
212 -
download
0
Transcript of Use of polymerase chain reaction analysis of urinary DNA to detect bladder carcinoma

A
pnwsion
K
1
rdmncniace
tttTd
3
1d
Original articleUse of polymerase chain reaction analysis of urinary DNA to detect
bladder carcinomaBrian Little, M.D.a,*, Anne Hughes, Ph.D.b, Michael R.A. Young, M.D.a,
Aiden O’Brien, M.B.a
a Craigavon Area Hospital, Craigavon, Northern Irelandb Belfast City Hospital, Belfast, Northern Ireland
Received 29 April 2004; received in revised form 18 October 2004; accepted 19 October 2004
bstract
A cohort of 113 patients underwent prospective evaluation with a panel of seven microsatellites, on chromosomes 9, 13 and 17. Thirty-sevenatients had histologically confirmed bladder tumors, 53 patients had a history of previous transitional cell carcinoma of the bladder (TCC) butormal cystoscopies (control Group 1), and 23 patients had no previous history of TCC and normal cystoscopies (control Group 2). Urinary DNAas considered to show a deletion if an allele was reduced by more than 50%, and this was considered diagnostic of bladder carcinoma. The
ensitivity of the method was 50%, positive predictive value was 80%, and specificity was 93%. Reducing the threshold for defining allelic lossncreases sensitivity, but reduces specificity. The concentration of urinary DNA in the sample did not influence detection rate. The grade and stagef the bladder tumor did not influence the likelihood of detection. This method detects bladder carcinoma with high specificity, and increasing theumber of microsatellites used should increase sensitivity. © 2005 Elsevier Inc. All rights reserved.
Urologic Oncology: Seminars and Original Investigations 23 (2005) 102–107
eywords: Bladder cancer; Transitional cell carcinoma; Detection; Urine
iteuuslwpncdtrbsRm
2
. Introduction
At present, the gold standard for the detection of de novo orecurrent carcinoma of the urinary bladder is cystoscopy withirect visualization of the bladder. Tests of the patient’s urineay also be used to add to the diagnostic process, but as yet
one has been sensitive or specific enough to replace cystos-opy. The ideal test for bladder cancer detection should beoninvasive, 100% sensitive and specific, and produce resultsnstantly. Tests that have been used include the bladder tumorntigen (BTA) test, nuclear matrix protein (NMP22), urinaryytology, fluorescent in situ hybridization (FISH) and telom-rase activity [1–6].
Microsatellite analysis can detect chromosomal dele-ions. Certain chromosomal deletions occur frequently inransitional cell carcinoma of the bladder, such as aroundhe P16/INK4A locus on chromosome 9 and in the region ofP53, both of which are believed to be integral to tumorevelopment [7]. Tumors may slough cells more readily
* Corresponding author. Tel.: �0044-141-2112000; fax: �0044-141-376010.
vE-mail address: [email protected] (B. Little).
078-1439/05/$ – see front matter © 2005 Elsevier Inc. All rights reserved.oi:10.1016/j.urolonc.2004.10.009
nto urine than normal bladder mucosa as a consequence ofheir increased cell turnover. Extraction of DNA from thesexfoliated cells and detection of allelic losses may be aseful marker of tumor presence or recurrence. Markerssed should be based around regions of frequent chromo-omal loss in bladder carcinoma, as this will increase theikelihood of tumor detection. The objective of this studyas to establish if the allelic ratios produced followingolymerase chain reaction amplification of blood and uri-ary DNA with a panel of seven polymorphic amplimers,ould be compared to detect chromosomal deletions. Anyeletions identified could diagnose the presence of a bladderumor. The markers used in this study were clustered aroundegions of frequent loss in transitional cell carcinoma of theladder. Two markers were used on each of the long andhort arms of chromosome 9, one marker adjacent to theetinoblastoma gene locus on chromosome 13, and twoarkers adjacent to the TP53 locus on chromosome 17.
. Materials and methods
The Queen’s University of Belfast ethics committee pro-
ided ethical approval for this study. From each patient,
3ac3ssomwdwcpacl
Pov1aQtwcqTD
fTU�iobfi
muDdPqpcbscoa
ust
tT0tfawabwmaUwcc
3
iSs
uw(cuathNccbTmtcmt((nwmbamttcm
103B. Little et al. / Urologic Oncology: Seminars and Original Investigations 23 (2005) 102–107
mL of peripheral blood was sampled into an EDTA tubend 50 mL of voided urine were taken in a sterile 50 mLentrifuge tube. The specimens were processed within0 min. Patients then underwent cystoscopy, and were clas-ified into three groups. Thirty-seven patients had cysto-copic evidence of bladder tumor, subsequently confirmedn histological analysis of a transurethrally resected speci-en (tumor group). Control Group 1 comprised 53 patientsho had previously had bladder tumors, but now had noetectable bladder abnormality on cystoscopy. This groupas recruited from patients undergoing surveillance cystos-
opy to detect recurrences. Control Group 2 consisted of 23atients with no bladder cancer history, and no bladderbnormality on cystoscopy. This group was undergoingystoscopy for benign conditions, such as the evaluation ofower urinary tract symptoms.
Extraction of DNA from blood was performed using theuregene® DNA extraction kit (Gentra systems, Minneap-lis, MN), according to the manufacturers protocol. Theoided urine specimens were centrifuged at 4000 � g for0 min, to obtain a cell pellet. The urine was then decanted,nd the pellet re-suspended in 300 �L of sterile water. Theiamp® (Qiagen, Sussex, United Kingdom) midi kit filtra-
ion protocol was then used for DNA extraction. Primersere selected for polymorphic microsatellite markers on
hromosomes that are believed to be lost with high fre-uency in transitional cell carcinoma of the urinary bladder.he markers used were: D9S164, D9S171, D9S283,9S285, D13S263, D17S1811 and D17S938.PCR for the chromosome 9 microsatellites were per-
ormed in 5 �L total volume, using template DNA (10 ng)aq polymerase 0.2 U (Applied Biosystems, Warrington,nited Kingdom), 1X Buffer, MgCl2 (2.5 mM), dNTP (200M) and primers (0.5 �M). The PCR conditions were:
nitial denaturation: 95°C for 10 min; followed by 11 cyclesf: 94°C for 30 s, 53°C for 30 s, and 72°C for 30 s; followedy 28 cycles of: 89°C for 30 s, 53°C for 30 s, 72°C for 30 s;nal extension: 72°C for 10 min.
The chromosome 13 and 17 markers were tested in aultiplex reaction. PCR reactions (5 �L) for this multiplex
sed template DNA (10 ng), Taq polymerase (0.25 U),17S938 (0.5 �M), D17S1811 and D13S263 (0.25 �M),NTP (200 �M), 1�l 10X Buffer and 2�l solution Q. AllCR products were then analyzed using an ABI 3100 se-uencer (Applied Biosystems), to establish the relative pro-ortions of each allele in each sample. Urinary DNA wasonsidered to show a deletion if the height of an allele waselow 50% of that predicted by the matched genomic DNAample. Loss of one or more alleles in a urine sample wasonsidered to represent a chromosomal deletion. Detectionf one or more chromosomal deletions was considered di-gnostic of a bladder tumor.
DNA concentration from each urine specimen was eval-ated using the PicoGreen® dsDNA fluorescent detectionystem (Molecular Probes, Cambridge, United Kingdom),
o establish if low urinary DNA concentration was a con- oributing factor to false positive and false negative results.his was performed with reference DNA concentrations of, 50, 200 and 500 ng/mL. For unknown DNA concentra-ions, 2 �L of DNA was diluted with 80 �L of TE Bufferor each well, and 100 �L of PicoGreen solution diluted by
factor of 200 was added to every sample. The samplesere mixed by pipetting up and down. The samples were
llowed to incubate under foil (to prevent dye degradationy ambient light) for 3 min at room temperature. The plateas then inserted into the automated plate reader (Cytofluorultiwell plate reader system 4000, PerSeptive biosystems)
nd a fluorescence reading for each plate well obtained.sing the fluorescence readings from the reference DNAells to generate a graph of fluorescence against DNA
oncentration, the DNA concentration of unknown samplesould be calculated.
. Results
The sample tumor population was subdivided by stagento 30 Stage Ta tumors, three Stage T1 tumors and fourtage T2 or greater tumors. When grade was considered,even were Grade 1, 21 were Grade 2, and nine were Grade 3.
The initial tumor detection rate based on an allele loss inrinary DNA was 49% (18/37 tumors). Positive predictiveas 72% (18/25 positive results), and specificity was 89%
68/76 negative results). An example of an allelic deletiononsistent with detection of a bladder tumor in a voidedrine specimen is shown in Fig. 1, along with an example ofsample that does not exhibit a deletion. Grade and stage of
umor did not statistically significantly influence the likeli-ood of tumors detection (P � 0.14 and 0.09, respectively).o sample from the group who had never had bladder
ancer was positive. False positive rate differed signifi-antly between this group and the group with previousladder cancer, who had eight false positives (P � 0.04).he rate of detection of loss of heterozygosity for eacharker within each patient group is shown in Fig. 2. Three
umors developed within 24 months of the initial cystos-opy, two of which were predicted by a positive result onicrosatellite analysis. If these were included as positive in
he detection data, then sensitivity increased slightly to 50%20/40 tumors), positive predictive value increased to 80%20/25 positive results), and specificity was 93% (68/73egative results). The individuals from control Group 1,hose urine demonstrated the presence of a detectable chro-osomal deletion had a 25% (2/8) chance of developing a
ladder tumor within 24 months. Normal chromosomalnalysis conferred only a 2% risk (1/45) of tumor develop-ent. The results of each marker are shown for each of the
umor samples in Fig. 3. It is noteworthy that only two ofhe samples show losses for all the informative markers onhromosome 9 (samples 18 and 20). Most studies of chro-osome 9 losses in tumors have shown monosomy 9 rates
f 40% to 50%. It is indicative of the limitations of this

mrnb
3trttfsficfoslfiot
ad
3(pymsf
4
ydcau
Ftct ce from
104 B. Little et al. / Urologic Oncology: Seminars and Original Investigations 23 (2005) 102–107
ethod of urinary deletion detection that the monosomyate in this study is only 5%, implying that this method doesot detect all deletions that are present in the underlyingladder tumor.
Reducing the threshold for defining a deletion to a0% reduction in peak height improved the sensitivity ofhe method to 73%, and positive predictive value waseduced only slightly to 63%. However, the specificity ofhe method was substantially reduced to 63%. For thisest, the ROC (Receiver Operating Characteristics) curveor this method was ascertained. This is a plot of theensitivity of a diagnostic test as a function of nonspeci-city (one minus the specificity). The ROC curve indi-ates the intrinsic properties of a test’s diagnostic per-ormance and can be used to compare the relative meritsf competing procedures. Ideally a test under questionhould have a ROC curve that rises sharply from theower values on the x-axis, to quickly attain high speci-cities. The ROC curve for the urinary detection testutlined in this paper is shown in Fig. 4. It can be seen
ig. 1. (A) Example of an allelic deletion detected by Genescan analysis orace is urinary PCR from a bladder tumor patient. The larger allele, on the ronsistent with a deletion indicative of a bladder tumor (marked with a vehe upper trace from genomic PCR is identical compared to the lower tra
hat for this method, increases in sensitivity will produce f
substantive fall in the specificity, as the ROC curveoes not exhibit a sharp rise from the x-intercept.
The mean DNA yield for all the urine samples was1.7 ng/mL. Samples in the lowest quartile of DNA yieldbelow 2.4 ng/mL) did not have a higher incidence of falseositive or false negative results (P � 0.16). Low DNAield cannot therefore account for the incidence of positiveicrosatellite test results that do not correspond to cysto-
copically evident bladder tumor, or for the incidence ofalse negatives.
. Discussion
This method of bladder cancer detection involved anal-sis of DNA from voided urine samples for chromosomaleletions that are known to occur commonly in bladderarcinoma. In the first paper utilizing this technique, Maond co-workers found that microsatellite analysis of therinary sediment was more sensitive than urinary cytology
le PCR reaction. The upper trace is genomic (blood) PCR and the lowere of the urinary PCR trace shows a deletion of more than 50% peak height,row). (B) Example of a trace from a sample exhibiting no deletion, whenurinary PCR.
f a singight sidrtical ar
or detection of bladder carcinoma [8]. They found that

csatsfiaaamwLcMbw
oaistiay8urttleit
psmnpsctm
yiMscwidtmmesawccdShr1w
Feb
105B. Little et al. / Urologic Oncology: Seminars and Original Investigations 23 (2005) 102–107
onventional cytology detected cancer cells in 50% of theamples, but microsatellite analysis showed 95% sensitivity,t one-third of the cost, with no false positives. Continuinghis work, Steiner at al. followed 21 patients with urineamples analyzed with a panel of 20 microsatellite markers,nding that recurrence was detected in 10 of 11 patients,nd in none of the controls. Their one false negative was inpatient with a solitary small pTaG1 tumor [9]. Shigyo et
l. found that loss of allelic heterozygosity (LOH) on chro-osome 9 could be detected in urine of patients with tumorsith 70% frequency [10]. Linn retrospectively looked atOH in the urine of patients with TCC, but did not use anyontrol specimens. His detection rate was 87% [11].ourah’s use of microsatellite analysis in the detection of
ladder cancer found, once again, that specificity was 100%,ith an 83% detection rate [12].When the sensitivity and specificity figures from papers
n the urinary detection of bladder cancer utilizing LOHnalysis are examined in more detail, the results are lessmpressive [8–15]. The average number of patients pertudy was only forty. This is about a third of the number inhe current study. Often, the ‘headline’ rate of detectionncluded tumors that were not found on the first cystoscopyfter LOH was detected, but rather on cystoscopies over aear later. Utilizing these criteria, the mean sensitivity is5%, and specificity is 96%. It could be considered that therinary epithelium is simply exhibiting chromosomal aber-ations that make tumor development more likely, ratherhan predicting the development of a tumor de novo. Onceumors that are detected at times other than the first fol-ow-up cystoscopy after LOH analysis becomes positive arexcluded, the mean sensitivity falls to 83%, and specificitys reduced to 89%. The sensitivity of detection described in
0
2
4
6
8
10
12
14
16
18
20
D9S285 D9S171 D9S175
ig. 2. Percentage of allelic deletions detected for each marker, for each ofach group which exhibited a deletion of that marker; black bars, patients wars, patients who have never had a bladder tumor.
his paper is substantially lower, but the specificity is com- b
arable. It is possible that tumors of very early grade andtage may have a lower incidence of chromosomal losses,aking detection based on this method unworkable. Alter-
atively, increasing the number of markers used could im-rove sensitivity, by improved detection of the chromo-omal losses that are present. One could expecthromosome 9 deletions to be present in 75% of bladderumors; so increasing the density of markers on this chro-osome is most likely to achieve increased sensitivity [7].The reported studies into the use of microsatellite anal-
sis of urinary DNA report substantially different sensitiv-ties for tumor detection, although all report high specificity.
ao, Linn and Mourah used the same markers on chromo-omes 6, 9, 14, 16, 18 and 21, with one homologous onhromosome 4 [8,11,12]. The sensitivities they reportedere similar, ranging from 83% to 95%. Perhaps surpris-
ngly, Mao reported 12% higher sensitivity than Mourahespite using exactly the same 13 markers. Van Rhijn variedhe marker group slightly, using the same markers on chro-osomes 4, 6, 11, and 16, but increased the number ofarkers from four to six on chromosome 9, and used mark-
rs on chromosomes 13 or 21. This produced a lower sen-itivity of 74%, despite using the same number of markerss Linn [13]. These results are interesting because oneould expect that increasing the number of markers on
hromosome 9 would increase sensitivity, as this is thehromosome that most frequently exhibits deletions in blad-er cancer, as discussed above [7]. Indeed, a study byhigyo that used only five markers on chromosome 9 thatad not been used in other studies found a 70% detectionate, only 4% below results from Van Rhijn et al., who used9 markers [10]. Zhang et al. used a group of 13 markers,hich shared only one marker in common with those used
4 D13S263 D17S938 D17S1811
ee groups of patients. Legend: x-axis, marker name; y-axis, percentage ofder tumors; gray bars, patients with a history of bladder tumors; light gray
D9S16
the thrith blad
y Linn et al., however, the sensitivity was almost identical
[lfcou1mrdtt1hLpe
dt
5
tfflpc
R
Ft
Foth
106 B. Little et al. / Urologic Oncology: Seminars and Original Investigations 23 (2005) 102–107
15]. In summary, it would appear that the currently pub-ished work has widely variable marker selection, but someactors appear common to all. The majority of studies con-entrated four to six markers on chromosome 9, and spreadther markers over a number of other chromosomes, butsually had two or three markers on each of chromosomes6–18. Studies reporting higher sensitivities used 13 orore markers. The current study described above has a
educed sensitivity, because it used only seven markers foretection. To increase the sensitivity, utilization of two tohree times the number of markers would be required, andhe spread of chromosomes examined expanded to include1, 16–18 and a selection of others. The current study hadomology with one of the chromosome 9 markers used byinn et al., but otherwise used microsatellites that had notreviously been used for this method, as specific microsat-llite selection did not appear to be an important factor in
Sam
ple
D9S
285
D9S
171
D9S
175
D9S
164
D13
S263
D17
S938
D17
S181
1
Tum
our
grad
e an
d st
age
T1 NI U NI DEL U U U TaG2
T2 NI U U NI NI U U T2G3
T3 U U U DEL NI U NI TaG2
T4 NI NI U U NI U U T1G3
T5 U NI U U U U U TaG3
T6 U U NI U U DEL U TaG1
T7 U U U U U U U T2G3
T8 U U NI U U NI U TaG3
T9 U NI NI U U U NI TaG2
T10 U NI U U U U U TaG2
T11 NI U U NI U U NI TaG2
T12 U NI U NI U U U TaG3
T13 U U U DEL DEL DEL DEL TaG1
T14 DEL NI DEL U U U U TaG2
T15 U U U NI U NI U TaG1
T16 U U U U U NI U TaG1
T17 NI DEL U DEL DEL U U TaG2
T18 DEL DEL NI DEL U U U TaG3
T19 U NI U U U U U TaG2
T20 DEL DEL DEL DEL DEL DEL NI TaG2
T21 U U U U U DEL NI TaG2
T22 U DEL NI DEL U NI DEL TaG2
T23 U U DEL NI U DEL NI TaG2
T24 NI U U U NI U U T1G3
T25 NI U U U U U U TaG1
T26 U U DEL U U NI U TaG2
T27 DEL U U U U U U T2G2
T28 DEL DEL DEL U DEL DEL DEL TaG3
T29 U U U U U U U T2G2
T30 DEL U U NI U U U TaG2
T31 U U NI U U U DEL TaG2
T32 U U U U U U U TaG1
T33 U DEL U U U U U TaG2
T34 NI U DEL U U U U TaG1
T35 U NI U U NI U U T1G2
T36 U U U U U U U TaG2
T37 U U U U U U U TaG2
ig. 3. Results of each marker for the samples from patients with bladder
umors (U, undeleted; NI, noninformative; DEL, deletion detected).etection when compared to the chromosomal location ofhe markers used.
. Conclusion
The challenge remains to develop a noninvasive alterna-ive to cystoscopy. It must be 100% sensitive and specificor bladder tumor, inexpensive, quick and simple to per-orm. So far, no test has fulfilled these criteria. Microsatel-ite analysis is a very specific method, but still has theotential for missed diagnosis and positive results beforelinically evident tumor development.
eferences
[1] Ramakumar S, Bhuiyan J, Besse JA, et al. Comparison of screeningmethods in the detection of bladder cancer. J Urol 1999;161:388–94.
[2] D’Hallewin MA, Baert L. Initial evaluation of the bladder tumourantigen test in superficial bladder cancer. J Urol 1996;155:475–6.
[3] Soloway MS, Briggman V, Carpinito GA, et al. Use of a new tumourmarker, urinary NMP22, in the detection of occult or rapidly recur-ring transitional cell carcinoma of the urinary tract following surgicaltreatment. J Urol 1996;156:363–7.
[4] Sözen S, Biri H Sinik Z, et al. Comparison of the nuclear matrixprotein 22 with voided urine cytology and BTA stat test in thediagnosis of transitional cell carcinoma of the bladder. Eur Urol1999;36:225–9.
[5] Junker K, Werner W, Mueller C, et al. Interphase cytogenetic diag-nosis of bladder cancer on cells from urine and bladder washing. IntJ Oncol 1999;4:309–13.
[6] Droller MJ, Kavaler E, Landman J, et al. Urinary telomerase and itspossible role as a marker for bladder cancer. Keio J Med 1998;47:135–14.
[7] Knowles MA. The genetics of transitional cell carcinoma: progress
0
0.1
0.2
0.3
0.4
0.5
0.6
0.7
0.8
0.9
1
0 0.1 0.2 0.3 0.4 0.5 0.6 0.7 0.8 0.9 1
1-specificity
Sensitivity
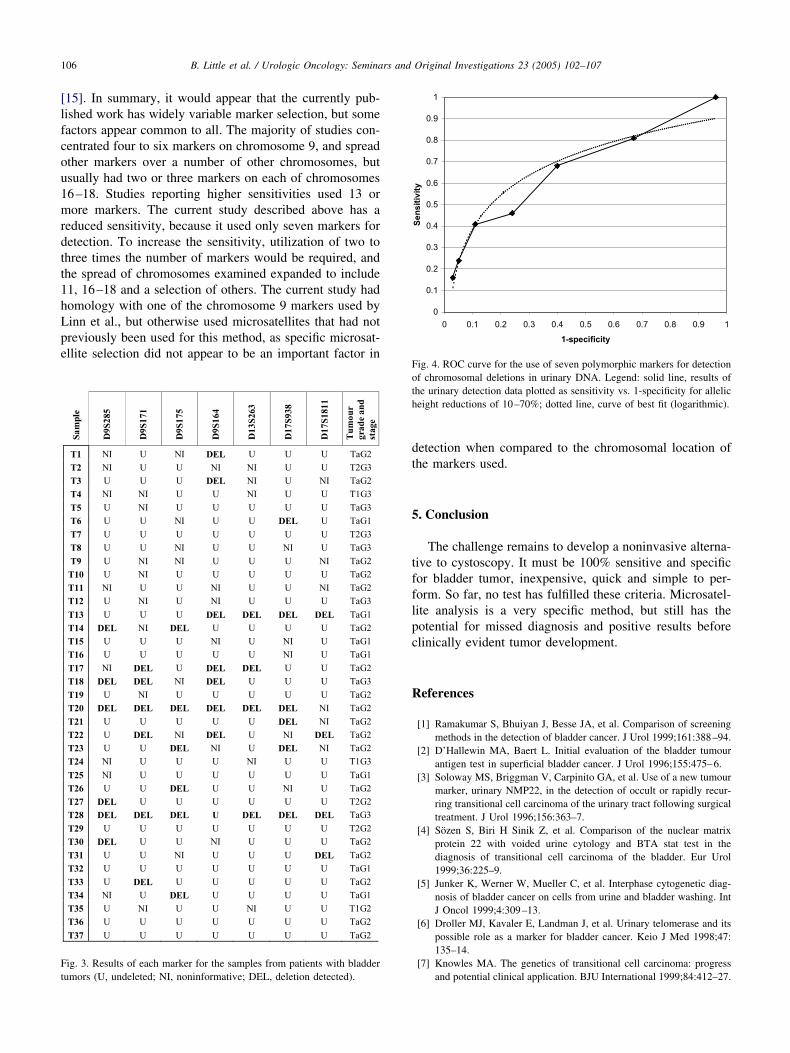
ig. 4. ROC curve for the use of seven polymorphic markers for detectionf chromosomal deletions in urinary DNA. Legend: solid line, results ofhe urinary detection data plotted as sensitivity vs. 1-specificity for alleliceight reductions of 10–70%; dotted line, curve of best fit (logarithmic).
and potential clinical application. BJU International 1999;84:412–27.

[
[
[
[
[
[
107B. Little et al. / Urologic Oncology: Seminars and Original Investigations 23 (2005) 102–107
[8] Mao L, Schoenberg MP, Scicchitano M, et al. Molecular detection ofprimary bladder cancer by microsatellite analysis. Science 1996;271:659–62.
[9] Steiner G, Schoenberg MP, Linn JF, et al. Detection of bladder cancerrecurrence by microsatellite analysis of urine. Nat Med 1997;3:621–4.
10] Shigyo M, Sugano K, Fukayama N, et al. Allelic loss on chromosome 9in bladder cancer tissues and urine samples detected by blunt end singlestrand DNA conformation polymorphism. Int J Cancer 1998;78:425–9.
11] Linn JF, Lango M, Halachmi S, et al. Microsatellite analysis andtelomerase activity in archived tissue and urine samples of bladder
cancer patients. Int J Cancer 1997;74:625–9.12] Mourah S, Cussenot O, Vimont V, et al. Assessment of microsatelliteinstability in urine, in the detection of transitional cell carcinoma ofthe bladder. Int J Cancer 1998;79:629–33.
13] Van Rhijn BWG, Lurkin I, Kirkels WJ, et al. Microsatellite analysis—DNA test in urine competes with cystoscopy in follow-up of superficialbladder carcinoma: a phase II trial. Cancer 2001;92:768–75.
14] Sourvinos G, Kazanis I, Delakas D, et al. Genetic detection of bladdercancer by microsatellite analysis of p16, pRB and p53 tumour sup-pressor genes. J Urol 2001;165:249–52.
15] Zhang J, Zheng S, Fan Z, et al. A comparison between microsatelliteanalysis and cytology of urine for detection of bladder cancer. Cancer
Letters 2001;172:55–8.