USE OF CFD MODELING IN DESIGNING ADVANCED NO · PDF fileUSE OF CFD MODELING IN DESIGNING...
12
The 37 th International Technical Conference on Clean Coal & Fuel Systems, Clearwater, Florida, USA June 3-7, 2012 USE OF CFD MODELING IN DESIGNING ADVANCED NO X CONTROL TECHNOLOGY FOR UTILITY BOILERS Guisu Liu 1 , Baiyun Gong 1 , Brian Higgins 1 , Muhammad Sami 2 1 Nalco Mobotec Inc., 1601 W. Diehl Road, Naperville, IL 60563 2 ANSYS Inc., 1007 Church St., Suite 250, Evanston, IL 60201 ABSTRACT In this paper, a 350 MW tangential coal-fired utility boiler in China was studied using ANSYS FLUENT Computational Fluid Dynamics (CFD) code to evaluate the application of Nalco Mobotec advanced ROFA ® system for NOx reduction. The simulations showed that ROFA, which delivers a large amount of air up to the upper furnace, significantly reduces the NOx through deep staging. Due to enhanced turbulent mixing, CO and LOI are rapidly burned out in the upper furnace. Heat transfer becomes stronger than the baseline case due to mixing. An overall 50%-60% NOx reduction is achieved during performance test. The boiler efficiency has been slightly increased by 0.38%. All these results are the consequence of strong mixing from ROFA system. These results have been validated against the performance testing results in great detail. INTRODUCTION China’s rapid economic growth has led to concerns about environmental protection. The state utilities are facing more aggressive and stringent regulations for SO 2, NOx and particulate matter. In accordance with the new regulations of China State Environmental Protection Administration come into effect on January 1, 2012, the coal-fired boilers have to meet the stringent NOx emissions requirements by January 1, 2014. Therefore, there is an urgent task for the power plants to employ advanced NOx reduction technologies. Existing NOx reduction technologies are typically classified into three categories: low NOx combustion technologies (e.g. Low-NOx Burner, Over-Fired Air, etc), selective non-catalytic reduction (SNCR), and selective catalytic reduction (SCR) technology. In all these technologies, low NOx combustion technologies are low capital cost, and are preferred to be installed in all units. The Nalco Mobotec advanced ROFA ® system is a deep-stage combustion technology to reduce NOx emissions. Meanwhile, the high-speed ROFA air can increase the upper furnace mixing to burn out CO and LOI to improve combustion performance. The ROFA system air flow, air pressure and nozzle position are designed and optimized through CFD simulation to achieve the best NOx reduction performance and combustion performance 1,2,3,4 . ROFA was selected to be implemented on a 350 MW tangential coal-fired utility boiler in China. 1 Liu, G., et al., “CFD Evaluation of ROFA on Limestone Utilization in a Circulating Fluidized Bed”, CIBO Conference, April 2005 2 Higgins, B., et al., “Evaluation of ROFA and Sorbent Injection on NOx and SOx Reduction at Hoosier Energy’s Frank E. Ratts Unit 1”, Coal- Gen, August 20, 2009 3 Higgins, B., Gong, B., Pozzobon, E., Liu, G., “ROFA and Rotamix Systems Reduced NOx below 200 mg/Nm 3 at Elektrownia Opole”, the 35 th International Clean Coal Conference, Clearwater, Florida, June 6-10, 2010 4 Gong, B., Liu, G., Higgins, B., Williamson, T., et al., “CFD-based Design and Installation of Cost-effective ROFA/Rotamix System for NOx Reduction at RPU Silver Lake Unit 4”, ”, the 35 th International Clean Coal Conference, Clearwater, Clearwater, Florida, June 6-10, 2010
Transcript of USE OF CFD MODELING IN DESIGNING ADVANCED NO · PDF fileUSE OF CFD MODELING IN DESIGNING...

The 37th International Technical Conference on Clean Coal & Fuel Systems, Clearwater, Florida, USA June 3-7, 2012
USE OF CFD MODELING IN DESIGNING ADVANCED NOX CONTROL TECHNOLOGY FOR
UTILITY BOILERS
Guisu Liu1, Baiyun Gong
1, Brian Higgins
1, Muhammad Sami
2
1Nalco Mobotec Inc., 1601 W. Diehl Road, Naperville, IL 60563 2ANSYS Inc., 1007 Church St., Suite 250, Evanston, IL 60201
ABSTRACT
In this paper, a 350 MW tangential coal-fired utility boiler in China was studied using ANSYS FLUENT
Computational Fluid Dynamics (CFD) code to evaluate the application of Nalco Mobotec advanced
ROFA® system for NOx reduction. The simulations showed that ROFA, which delivers a large amount of
air up to the upper furnace, significantly reduces the NOx through deep staging. Due to enhanced
turbulent mixing, CO and LOI are rapidly burned out in the upper furnace. Heat transfer becomes stronger
than the baseline case due to mixing. An overall 50%-60% NOx reduction is achieved during
performance test. The boiler efficiency has been slightly increased by 0.38%. All these results are the
consequence of strong mixing from ROFA system. These results have been validated against the
performance testing results in great detail.
INTRODUCTION
China’s rapid economic growth has led to concerns about environmental protection. The state utilities are
facing more aggressive and stringent regulations for SO2, NOx and particulate matter. In accordance with
the new regulations of China State Environmental Protection Administration come into effect on January
1, 2012, the coal-fired boilers have to meet the stringent NOx emissions requirements by January 1, 2014.
Therefore, there is an urgent task for the power plants to employ advanced NOx reduction technologies.
Existing NOx reduction technologies are typically classified into three categories: low NOx combustion
technologies (e.g. Low-NOx Burner, Over-Fired Air, etc), selective non-catalytic reduction (SNCR), and
selective catalytic reduction (SCR) technology. In all these technologies, low NOx combustion
technologies are low capital cost, and are preferred to be installed in all units.
The Nalco Mobotec advanced ROFA® system is a deep-stage combustion technology to reduce NOx
emissions. Meanwhile, the high-speed ROFA air can increase the upper furnace mixing to burn out CO
and LOI to improve combustion performance. The ROFA system air flow, air pressure and nozzle
position are designed and optimized through CFD simulation to achieve the best NOx reduction
performance and combustion performance1,2,3,4
. ROFA was selected to be implemented on a 350 MW
tangential coal-fired utility boiler in China.
1 Liu, G., et al., “CFD Evaluation of ROFA on Limestone Utilization in a Circulating Fluidized Bed”, CIBO Conference, April 2005 2 Higgins, B., et al., “Evaluation of ROFA and Sorbent Injection on NOx and SOx Reduction at Hoosier Energy’s Frank E. Ratts Unit 1”, Coal-
Gen, August 20, 2009 3 Higgins, B., Gong, B., Pozzobon, E., Liu, G., “ROFA and Rotamix Systems Reduced NOx below 200 mg/Nm3 at Elektrownia Opole”, the 35th
International Clean Coal Conference, Clearwater, Florida, June 6-10, 2010 4 Gong, B., Liu, G., Higgins, B., Williamson, T., et al., “CFD-based Design and Installation of Cost-effective ROFA/Rotamix System for NOx
Reduction at RPU Silver Lake Unit 4”, ”, the 35th International Clean Coal Conference, Clearwater, Clearwater, Florida, June 6-10, 2010

In this paper, the details of the project are presented. First, the technology is evaluated through a
Computational Fluid Dynamic (CFD) modeling. The actual performance of ROFA system is also
presented to validate the model predictions.
BOILER INFORMATION
The boiler is a Japanese Mitsubishi company's 1160 t/h subcritical reheat forced circulation furnace built
in 1998. The unit main parameters are as follows: unit capacity: 350MW, main steam flow: 1210 t/h,
main steam temperature: 541℃, main steam pressure: 17.5Mpa, flue gas volume 1,200,000-1,600,00
Nm3/h, exhaust gas temperature: 130-200℃. The boiler is equipped with three induced fans, flue gas
exhausts into the atmosphere through the 200-meter-hige chimney.
The design coal is Shenfu Dongsheng coal, the check coal is Datong coal; The unit usually fires a blended
coal. Blast furnace gas (BFG) and coke oven gas (COG) are often fired as auxiliary fuel. Under normal
circumstances, the amount of blast furnace gas is about 100-200 kNm3/h, and in extreme case the BFG
co-firing capacity is of 350kNm3/h. The baseline NOx is in a wide range of 400-900 mg/Nm
3 with an
average of 650 mg/Nm3. NOx level is lower when co-firing blast furnace gas, and it becomes high when
100% coal firing.
ROFA SYSTEM DESIGN
The ROFA system was installed to reduce NOx through furnace staging. In the meantime, the ROFA
system was designed to increase mixing in the upper furnace for CO and LOI burnout. As shows in Fig. 1,
a ROFA system includes a boosted-pressure ROFA fan, interconnecting air ducting, and air injection
nozzles. The ROFA air is taken from ducts at the outlet of the air preheaters. It is boosted in pressure by
the ROFA fan and delivered through specially located nozzles into the furnace. The air pressure at the
nozzles is optimized as required to achieve mixing as determined during the CFD modeling. All air flow
to the ROFA nozzles is controlled based on a relationship to boiler steam flow to maintain tuned box
pressures as load changes. Additionally, feed-forward and feed-back control strategies can be
implemented to reduce system upsets during load fluctuations.
The ROFA system consists of a variable frequency drive (VFD) controlled centrifugal ROFA fan. The
ROFA fan takes air through an individual duct from the outlet of the air preheater. Each duct has a venturi
flow meter to allow the boiler control system to account for air flow through the ROFA system.
Figure 1: ROFA system design

Extensive on-site investigations were carried out to determine the most efficient and cost effective way to
redirect secondary air to the upper furnace ROFA ports. The ROFA air suction and discharge duct routing
was meticulously engineered as the existing boiler and building structure contained significant duct path
interferences particularly adjacent to the furnace walls.
CFD MODELING
Combustion Model Overview
ANSYS FLUENT has been selected as the CFD code for this project because it is likely the best
commercially available CFD package. Grids (or meshes) used in the CFD simulations are first
constructed using FLUENT’s companion software, GAMBIT. FLUENT then solves for the density,
velocity, temperature, and species (including coal volatiles) concentrations fields of the gas phase and
coal particle properties and combustion within the furnace to steady state. The gas phase conservation
equations are solved using a variable density, quasi-incompressible formulation embedded in an Eulerian
reference frame. These governing equations are the gas phase continuity, momentum, turbulent kinetic
energy, turbulent dissipation, enthalpy, and the species conservation equations for each gas species in the
turbulent combustion model. These conservation laws have been described and formulated extensively in
standard CFD textbooks. A k-ε turbulence model was implemented in our simulations. Standard Eddy-
Breakup (EBU) turbulence combustion model is used. The following two step mechanism was utilized for
coal combustion:
Coal + a O2 → b CO + c CO2 + d H2O + e SO2
CO + 0.5 O2 → CO2
where the stoichiometric coefficients (a, b, c, d, and e) were determined from the fuel proximate and
ultimate analyses. For lower temperatures found in the back-pass, a modification to the carbon monoxide
reaction is also included to more accurately predict CO concentration.
Coal is injected through the burners by specifying a Rosin-Rammler particle size distribution and a
particle velocity slightly less than the gas phase velocity within the primary injectors. Parameters for this
distribution are derived from sieve data collected onsite. Gas phase air flow rates are specified at the
primary, fuel air, auxiliary air and CCOFA, and ROFA ports using appropriate inlet velocities,
temperatures, turbulence intensities.
The CFD model solves the particle/liquid phase (coal, limestone, water/urea, etc.) in a Langrangian
reference frame. The gas phase and particle phase conservation equations are solved separately by
FLUENT in order to make the computation more tractable; however, these two phases are strongly
coupled through iterative updates of the source terms that occur less often than the iterative updates of the
gas phase variables. Particle motion is obtained through solutions of the bulk gas velocity. Turbulent
dispersion of particles was modeled using the stochastic discrete-particle approach.
The CFD model uses different expressions for particle heating and reaction at each stage of the process.
An inert heating law applies when particle temperature is less than the onset temperature for
devolatilization. Particle heating is caused by convective heat transfer from the gas phase and the radiant
flux from the furnace. During devolatilization and char oxidation, the particle energy balance also
includes a heat of devolatilization and heat of combustion, in addition to the convective and radiative heat
transfer rates. Both diffusion and intrinsic kinetics were included in the char oxidation sub-model.
FLUENT NOx submodel involves sophisticated fuel-N conversion pathways. After fuel devolatilization,
fuel-N is partitioned into volatiles-N and char-N. HCN is the dominant nitrogen species in volatile-N
released from coal. Char-N is released into the gas phase at a rate that is proportional to the carbon
burnout rate. Because char-N conversion chemistry is complex, we used a fixed fraction of char-N
directly converted to NO with the rest of N converted to N2. This assumption is often used in literature5.
The gas phase NO can be reduced by CO, on the char surface, or through ammonia/urea injection.
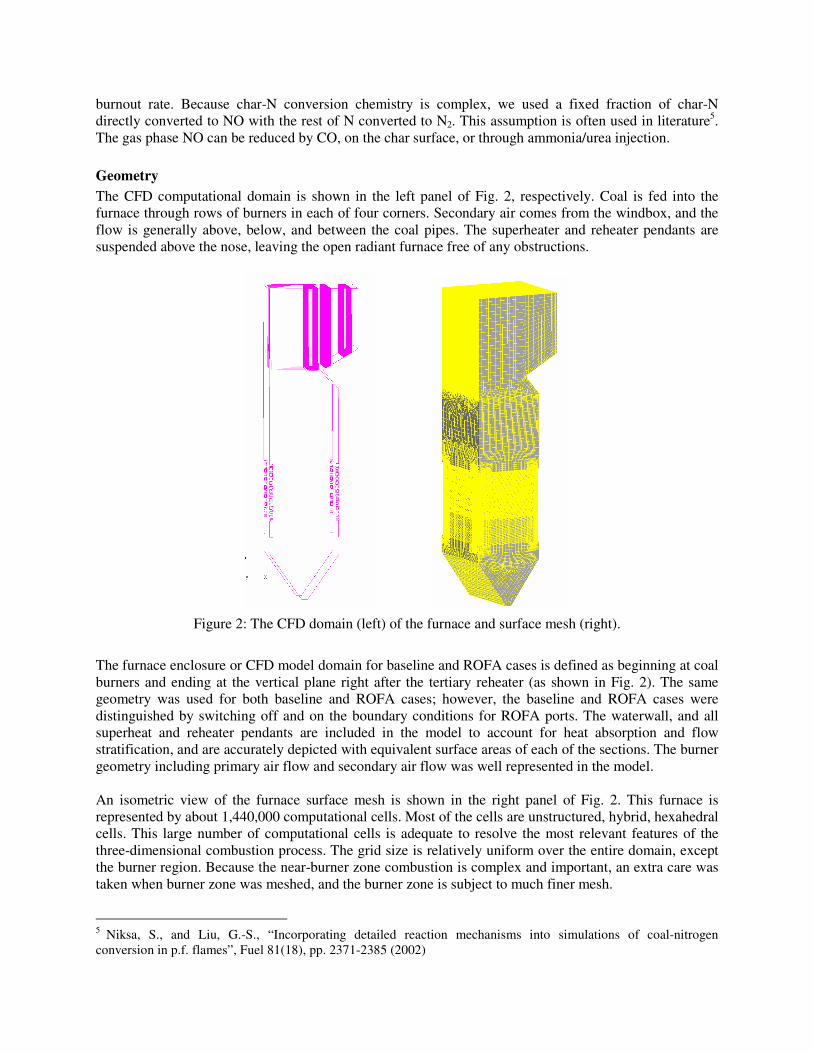
Geometry
The CFD computational domain is shown in the left panel of Fig. 2, respectively. Coal is fed into the
furnace through rows of burners in each of four corners. Secondary air comes from the windbox, and the
flow is generally above, below, and between the coal pipes. The superheater and reheater pendants are
suspended above the nose, leaving the open radiant furnace free of any obstructions.
Figure 2: The CFD domain (left) of the furnace and surface mesh (right).
The furnace enclosure or CFD model domain for baseline and ROFA cases is defined as beginning at coal
burners and ending at the vertical plane right after the tertiary reheater (as shown in Fig. 2). The same
geometry was used for both baseline and ROFA cases; however, the baseline and ROFA cases were
distinguished by switching off and on the boundary conditions for ROFA ports. The waterwall, and all
superheat and reheater pendants are included in the model to account for heat absorption and flow
stratification, and are accurately depicted with equivalent surface areas of each of the sections. The burner
geometry including primary air flow and secondary air flow was well represented in the model.
An isometric view of the furnace surface mesh is shown in the right panel of Fig. 2. This furnace is
represented by about 1,440,000 computational cells. Most of the cells are unstructured, hybrid, hexahedral
cells. This large number of computational cells is adequate to resolve the most relevant features of the
three-dimensional combustion process. The grid size is relatively uniform over the entire domain, except
the burner region. Because the near-burner zone combustion is complex and important, an extra care was
taken when burner zone was meshed, and the burner zone is subject to much finer mesh.
5
Niksa, S., and Liu, G.-S., “Incorporating detailed reaction mechanisms into simulations of coal-nitrogen
conversion in p.f. flames”, Fuel 81(18), pp. 2371-2385 (2002)

Model Inputs
Key inputs for the furnace CFD baseline simulations at full load (350 MW) are listed in Table 1. The coal
proximate and ultimate analysis, fineness are listed in Table 2. Coal flow for full load were provided in
the performance data during testing, and the firing rate (i.e. total heat input) for both cases are calculated
based on the fuel flow and the fuel high heating values. The exit O2 for two cases were also taken from
the performance data during testing and the total air flow (TAF) was calculated based on the
stoichiometric (S.R.) analysis with given fuel flow and exit O2.
Table 1: Baseline System Operating Conditions
Thermal Firing Rate [MWt] 917.0
Load [MWe gross] 350
Excess Air [%] 22
Excess O2 [% dry] 3.84
Excess O2 [% wet] 3.50
Coal Flow [t/h] 138.1
Total Air Flow [t/h] 1322.9
Table 2: Coal Analysis and Fineness
Proximate Analysis
Volatiles Matter [wt % ar] 27.33
Fixed Carbon [wt % ar] 47.67
Moisture [wt % ar] 14.0
Ash [wt % ar] 11.0
HHV [kJ/kg] 23919
Ultimate analysis
C [wt % ar] 60.33
H [wt % ar] 3.62
O [wt % ar] 9.94
N [wt % ar] 0.70
S [wt % ar] 0.41
Fineness
< 297 µm (50 mesh) [wt %] 100
< 149 µm (100 mesh) [wt %] 99.5
< 74 µm (200 mesh) [wt %] 85
Modeling Results
Baseline Validation
The baseline model results are compared with the testing data in Fig. 3. The testing was conducted at nose
elevation for full load 350 MW and mid load 260 MW. Only the full load data is compared here. The x-
axis of the plots in Fig. 3 represents the testing port locations from A at left wall, A1 through A6 on front
wall and B on right side wall. All testing ports are located around nose elevation. There were two
temperature measurements obtained during testing: one by thermocouple at the tip of the HVT probe and
the other by a portable infra-view pyrometer, which measures the maximum and minimum temperatures
around the view port region. Modeled gas temperature, O2, CO and NOx at furnace exit (F.E.) are also

included in the plot. In this case, the furnace exit is between tertiary superheater pendants and second
reheater pendants. No HVT measurements were taken at furnace exit location due to lack of accessible
viewports. Overall, modeling results are in good agreement with the testing data.
In Table 3, the CFD modeled FEGT is almost exactly the same as the OEM design value of 1317 K,
indicating that the heat distribution feature in the furnace and backpass in the model is well captured.
CFD modeled O2 and NOx data at the furnace outlet is also in good agreement with the tested emission
data at the stack for furnace outlet comparison.
Figure 3. Comparison of temperature, O2, CO and NOx between testing and CFD modeling
Comparison at Furnace Exit and Model Outlet
The baseline model results are compared with other data in this section. Two locations are compared. One
is the furnace exit which is typically defined as the vertical plane in between radiant and convective
section of steam tubes. In this case, the furnace exit is between tertiary superheater pendants and second
reheater pendants. The other location is the furnace outlet in CFD which is immediately after the tertiary
reheater pendants. No HVT measurements were taken in these locations due to lack of accessible
viewports. Instead, we used the furnace exit temperature in a design document for furnace exit
comparison and the tested emission data at the stack for furnace outlet comparison.
In Table 3, the OEM design document indicated that at full load the furnace exit gas temperature (FEGT)
is 1317 K. The CFD modeled FEGT are almost exactly the same, indicating that the heat distribution in
the furnace and backpass in the model. CFD modeled O2 and NOx data at the furnace outlet is also in
good agreement with the reported data.
The following conclusions can be drawn from the comparisons.

• CO decreased from baseline to ROFA. As discussed later, even though in the lower furnace a large
amount of CO is formed, it is burnt away rapidly and results in even lower CO at the exit in ROFA
cases. Upper furnace combustion is greatly improved by high turbulent ROFA jets.
• The furnace exit gas temperature decreased about 25°C from baseline to ROFA case. The heat transfer
rate however increased slightly from baseline to ROFA case. This indicates that the heat transfer in
ROFA case is stronger than that in baseline case due to the high turbulence induced by high velocity
ROFA jets and better use of the furnace volume.
• The outlet NOx concentration reduced 56% from baseline, due to air staging.
• LOI also went down in the ROFA case.
Table 3: Comparisons of results between baseline and ROFA case
Baseline Testing CFD Baseline CFD ROFA
Fur. Exit
O2 [%] 3.8 3.8
H2O [%] 7.3 7.3
CO [ppm] 122 129
CO2 [%] 14.1 14.1
Temp [K] 1317 1320 1296
NO [ppm] 323 141
Outlet
O2 [%] 3.5 3.7 3.7
H2O [%] 7.3 7.3
CO ppm [ppm] 58 39
CO2 [%] 14.1 14.1
Temp [K] 1109 1091
NOx [ppm] 307 324 141
NOx Red. [%] - 56
LOI [%] 2.7 1.1
Temperature Distribution
The temperature distributions for seven horizontal planes are shown in Fig. 4. These figures show that the
majority of the combustion occurs in the region well below the nose. In fact, by the ROFA level the
majority of the coal is combusted, though high CO levels still need to be burned out. The maximum flame
temperature in the baseline furnace is about 2100 K. This is also true for the ROFA case but the
temperature is more evenly distributed through the lower furnace as the mass flow in the lower furnace is
approximately 30% less. The temperature distribution also shows that coal ignites soon after being
injected into the furnace. As can been seen from looking into the furnace (and from the control room
furnace camera), the flames are not attached to the coal nozzles (as is usual for T-fired boiler). Fig. 2 and
later illustrations also show how the ROFA jets penetrate deep into the flue gas cross flow.
O2 Distribution
The O2 distribution in the furnace in the left panel of Fig. 5 shows high O2 in the near-wall region of the
furnace that does not quickly mix with the combustion products until well after the nose. These O2
inhomogeneities persist well into the upper furnace. For the ROFA case, the lower furnace is clearly
staged sub-stoichiometrically. This is, of course, the mechanism for NOx reduction. The key to efficient
NOx reduction is the ability to stage sub-stoichiometrically and still burn out the CO before exiting the
furnace. CO burnout requires an evenly mixed O2 concentration in the ROFA case. The O2 at furnace
outlet is more evenly distributed in the ROFA case than in the baseline case, as evidenced in Fig. 6.

Figure 4. Gas temperature of baseline and ROFA. Figure 5. O2 distribution of baseline and ROFA.
CO Distribution
CO is the primary intermediate species during the oxidation of coal. In general, all of the coal carbon that
eventually burns must first be partially oxidized to CO before further oxidized to CO2. In fact, half of the
heat release from combustion occurs during this CO to CO2 oxidation. Therefore CO is as important as O2
to characterize the combustion in furnace. In Fig. 7, the CO is formed but burnt progressively as the flow
moves upwards to the upper furnace in the baseline. Clearly there is much more CO in the ROFA case
below the nose. This is again a desirable effect of staging. The key is to burn it all out before leaving the
furnace. The deep penetration by the ROFA jets is seen to quickly react with CO. Not all the CO is
burned in the model before it exits. Stack CO with ROFA is typically below 20 ppm, and we expect this
to be the case after ROFA is installed in this unit.
Figure 6. Furnace outlet O2 distribution of (left) baseline and (right) ROFA.
NOx Distribution
The CFD analysis can calculate NOx reduction using the chemistry described above. While each coal and
boiler geometry leads to different NOx generation, the fundamentals remain the same. The baseline NOx
model parameters were adjusted within normal ranges to model the measured base case NOx rates and
then these model parameters were fixed when the ROFA case was modeled.

The NOx results of baseline and ROFA are compared in Fig. 8. Clearly the ROFA case shows reduced
NOx. Importantly, the NOx reduction comes directly from affecting the conversion of the fuel-bound
nitrogen. In a staged environment, HCN comes off the coal and preferentially reduces to N2, where in the
baseline case much of the HCN forms NOx. This is particularly evident in the horizontal plane between
the ROFA nozzles and the burners, where the NOx concentrations for the ROFA case are clearly lower
across the entire horizontal plane. Due to air staging of ROFA, the lower furnace is overall reducing. As a
result, the NO concentration is dramatically lower in the entire furnace as shown in the right panel of Fig.
8. Even with the secondary combustion after injection of ROFA air, NO is not increased significantly.
Figure 7. CO distribution of baseline and ROFA. Figure 8. NO distribution of baseline and ROFA.
Turbulent Kinetic Energy
One of the two variables in the turbulence model - kinetic energy is plotted in Fig. 9. Coal combustion is
“mixing limited”. That is, in the open furnace, it is the mixing of the fuel and air that limits the progress
of combustion. Once mixed, combustion occurs quickly at high temperatures. Turbulence is a very
instructive method of gauging mixing. As a fluid body moves, turbulence dissipates through mixing.
Large eddies break into smaller eddies and the smaller eddies break into many more smaller eddies. Each
eddy functions to mix unburned carbon or CO with O2. In Fig. 9, it is obvious that there is significant
kinetic energy in the burner zone in both baseline and ROFA case, but once the coal leaves the burner
zone in the baseline case there is nothing left to continue the mixing. The one exception to this is the nose,
which is why the nose is so important in boiler designs. In the ROFA case, there are not only high levels
of kinetic energy in the upper furnace, but it is clear that the turbulence is dissipated throughout the upper
furnace.
Upper Furnace Temperature Distribution
For tangentially fired boiler, furnace outlet steam temperature is usually biased, this problem is universal.
This is due to the reason of the fluid in one direction of rotation. Overheating discipline and reheater tubes
serious temperature deviation will increase the thermal stress of the pipe and gradually make the tubes
leak, eventually had to replace the pipe. Frequent replacement of the steam pipe cost is expensive.

Figure 9. Kinetic energy of baseline and ROFA.
In ROFA the design, the introduction of air to the upper part of the furnace again can effectively solve this
problem. Figure 10 shows the upper furnace temperature distribution of before and after ROFA. In the
boiler right side of the wall and two and three overheating near region, compared with the early-mode
model, the entire furnace within the flue gas temperature distribution is more uniform. The flue gas
temperature cannot be a good adjustment, but such a comparison also shows that, of ROFA the flexible
design for this problem. A large number of on-site commissioning according to customer needs, so as to
solve the corresponding problem
Figure 10. Upper furnace temperature distribution of baseline and ROFA.
FIELD PERFORMANCE
The entire ROFA installation includes ROFA fan, the air duct, boiler water wall openings, ROFA air
dampers, and control system. The installation took approximately 3-4 months. ROFA air duct installation
is difficult, mainly due to the transformation of the old units, insufficient space on-site construction, and
the larger ROFA duct size. During the unit outage, the boiler water wall openings, ROFA dampers, and

the connection between air duct and dampers were installed. Special attention was paid to the boiler
thermal expansion installation.
Turbulent mixing of the high-speed ROFA airflow enhanced the upper furnace combustion; as a result the
boiler system can be operated in a relatively low oxygen conditions. The original O2 curve was then
corrected. Figure 11 shows the O2 curves before and after ROFA in service. Over the entire range of
steam load, the O2 is reduced by 0.5%-1.5%, due to improved combustion by ROFA. This reduction of O2
has resulted in the increase of thermal efficiency by 0.38%.
Figure 11. The furnace O2 operating curves of baseline and ROFA.
Furnace flue gas temperatures were measured through the front wall viewport (right above nose elevation)
using infra-view pyrometer. Table 4 shows the temperature measurements between ROFA on and off
conditions. The average furnace temperature reduced about 12°C when ROFA is in service. CFD model
predicted the flue gas temperature reduced by 25°C. While there is some discrepancy between prediction
and actual performance, the qualitative trend is consistent. The reduction on flue gas temperature is
caused by enhanced heat transfer due to strong mixing by ROFA air jets.
The ROFA fan is turned on, the NOx concentration decreased significantly, as can be seen from Figs. 12
and 13. When the ROFA air increased from 70 t/h to 380 t/h, the NOx concentration reduced from 680
mg/Nm3 to 300 mg/Nm3. When the ROFA air flow reduced from 380 t/h to 60 t/h, NOx increased from
about 300 mg/Nm3 to 600 mg/Nm
3. In general, ROFA system reduced NOx by 50% to 60% based on
various operating conditions. Similar level of NOx reduction was achieved when co-burning BFG and
COG gas. This is in good agreement with CFD predictions.
The boiler fly ash LOI increased slightly, but remained to below 4.0% limit. The increase of LOI is
thought to be due to lowered O2 from baseline to ROFA case. The CO content measured at the inlet of the
air preheater reduced from about 22 ppm to 2ppm when ROFA is in service. This is consistent with CFD
prediction in Table 3.
Superheater steam temperature deviation from left to right is a common operational problem. Due to
enhanced mixing through ROFA box setting, ROFA improved the steam temperature deviation by
reducing from 20°C to 10°C.

Table 4: Comparisons of Measured Upper Furnace Temperatures
Figure 12. NOx change when ROFA is tuned on. Figure 13. NOx change when ROFA is tuned off.
CONCLUSIONS
A ROFA system has been designed and installed on a 350-MWe tangential coal-fired boiler to reduce
NOx emission. Over 50% NOx reduction was achieved and NOx level remained at or below 300 mg/Nm3
when ROFA is in service. The combustion was improved by reduced CO and reduced furnace O2, and the
boiler efficiency increased by 0.38%. Due to enhanced mixing in upper furnace, the flue gas temperature
became much more uniform with less potential to form slagging at the bottom of superheater platens.6
Nalco and the logo are Registered Trademarks of Nalco Company.
Nalco Mobotec and the logo are Registered Trademarks of Nalco Mobotec, Inc.
Ecolab is a trademark of Ecolab USA Inc.
ROFA and Rotamix are Trademarks of Mobotec AB, used with permission.
© 2012 Ecolab USA Inc. All Rights Reserved.
Condition Infra-view Temperatures Measured Through Front Wall Viewports
F1 F2 F3 F4 F5 F6
ROFA
Out of
Service
Run1 1176 1204 1315 1319 1287 1154
Run2 1209 1256 1338 1333 1226 1129
Run3 1237 1247 1365 1348 1348 1166
Mean 1259
Standard
Deviation 209
ROFA In
service
Run1 1182 1196 1261 1322 1328 1211
Run2 1206 1241 1242 1260 1298 1179
Run3 1206 1223 1292 1307 1312 1186
Mean 1247
Standard
Deviation 146