US#ChinaCollaboraon)on)Cleaner) Coal)Technology)carnegieendowment.org/files/4-David_Mohler-Cleaner...
22
USChina Collabora.on on Cleaner Coal Technology 中美清洁煤技术合作 David Mohler 大卫•墨勒 Vice President—Duke Energy 副总裁——杜克能源 Beijing, October 2012 北京,2012年10月
Transcript of US#ChinaCollaboraon)on)Cleaner) Coal)Technology)carnegieendowment.org/files/4-David_Mohler-Cleaner...
US-‐China Collabora.on on Cleaner Coal Technology 中美清洁煤技术合作
David Mohler 大卫•墨勒
Vice President—Duke Energy 副总裁——杜克能源
Beijing, October 2012 北京,2012年10月
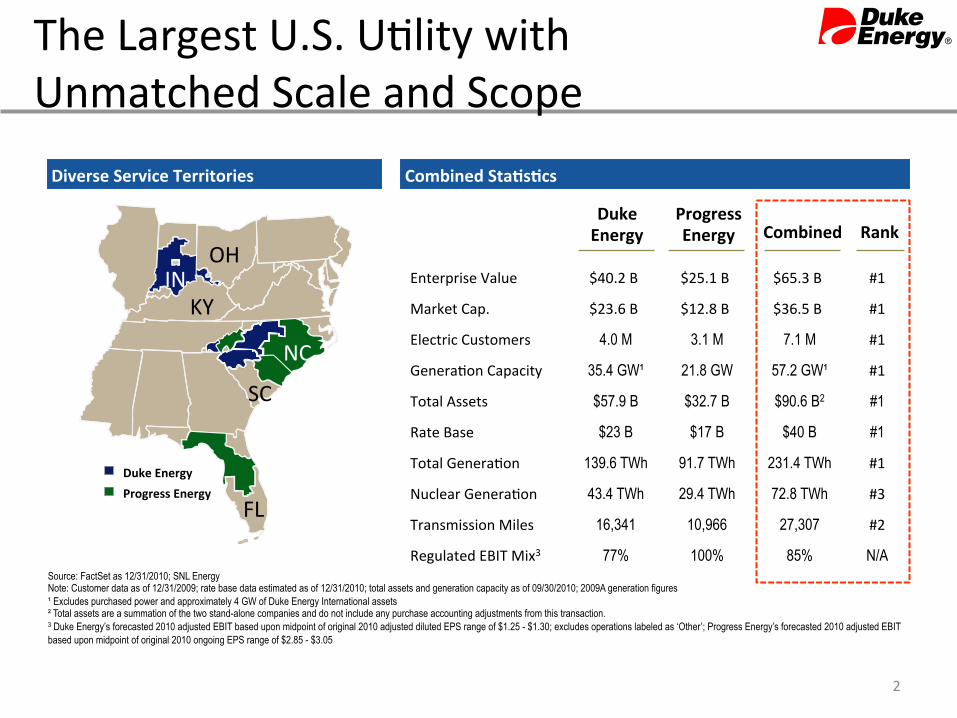
Diverse Service Territories Combined Sta>s>cs
Source: FactSet as 12/31/2010; SNL Energy Note: Customer data as of 12/31/2009; rate base data estimated as of 12/31/2010; total assets and generation capacity as of 09/30/2010; 2009A generation figures ¹ Excludes purchased power and approximately 4 GW of Duke Energy International assets ² Total assets are a summation of the two stand-alone companies and do not include any purchase accounting adjustments from this transaction. 3 Duke Energy’s forecasted 2010 adjusted EBIT based upon midpoint of original 2010 adjusted diluted EPS range of $1.25 - $1.30; excludes operations labeled as ‘Other’; Progress Energy’s forecasted 2010 adjusted EBIT based upon midpoint of original 2010 ongoing EPS range of $2.85 - $3.05
Enterprise Value $40.2 B $25.1 B $65.3 B #1
Market Cap. $23.6 B $12.8 B $36.5 B #1
Electric Customers 4.0 M 3.1 M 7.1 M #1
Genera.on Capacity 35.4 GW¹ 21.8 GW 57.2 GW¹ #1
Total Assets $57.9 B $32.7 B $90.6 B2 #1
Rate Base $23 B $17 B $40 B #1
Total Genera.on 139.6 TWh 91.7 TWh 231.4 TWh #1
Nuclear Genera.on 43.4 TWh 29.4 TWh 72.8 TWh #3
Transmission Miles 16,341 10,966 27,307 #2
Regulated EBIT Mix3 77% 100% 85% N/A
Duke Energy
Progress Energy Combined Rank
IN
NC
SC
FL
OH
KY
Duke Energy Progress Energy
IN
NC
SC
FL
OH
KY
The Largest U.S. U.lity with Unmatched Scale and Scope
2
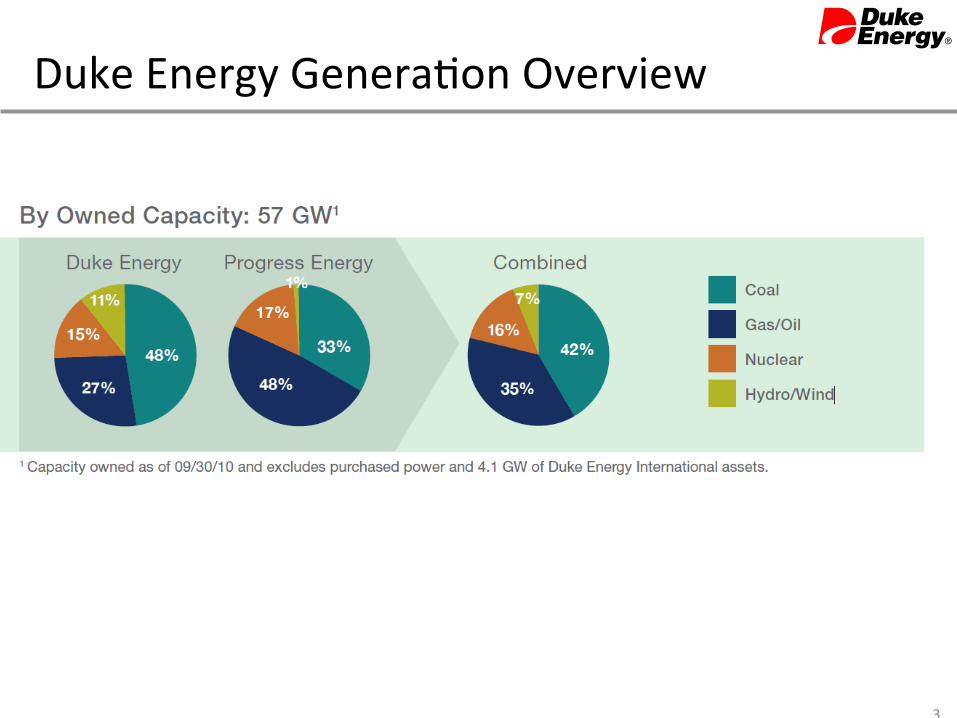
Duke Energy Genera.on Overview
3
4
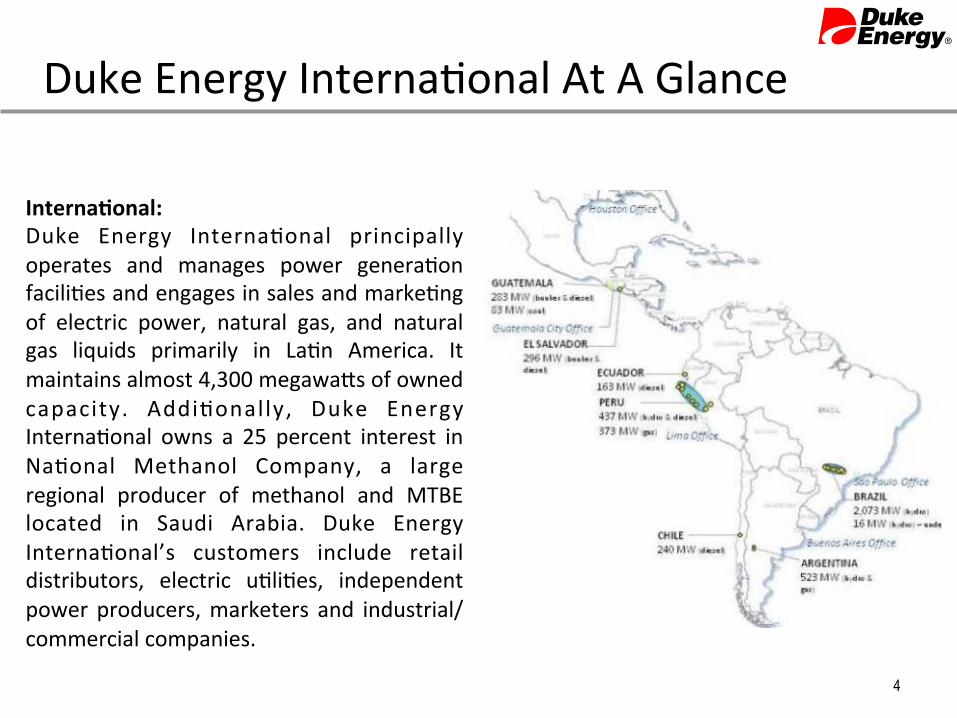
Duke Energy Interna.onal At A Glance
Interna>onal: Duke Energy Interna.onal principally operates and manages power genera.on facili.es and engages in sales and marke.ng of electric power, natural gas, and natural gas liquids primarily in La.n America. It maintains almost 4,300 megawa\s of owned capacity. Addi.onally, Duke Energy Interna.onal owns a 25 percent interest in Na.onal Methanol Company, a large regional producer of methanol and MTBE located in Saudi Arabia. Duke Energy Interna.onal’s customers include retail distributors, electric u.li.es, independent power producers, marketers and industrial/commercial companies.
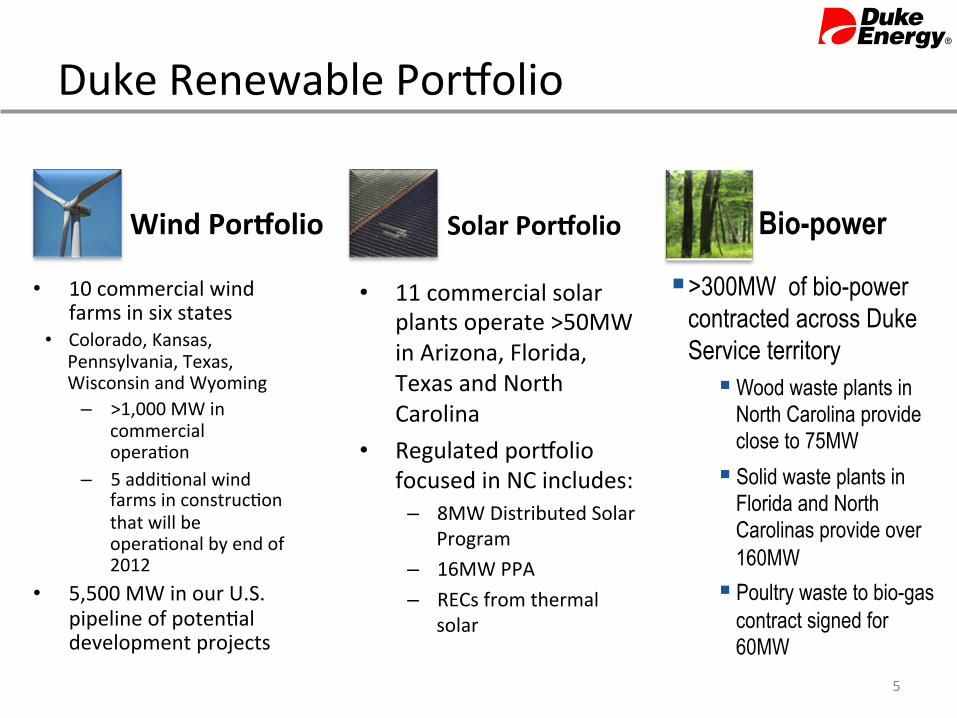
Duke Renewable Por`olio
Wind PorColio
• 10 commercial wind farms in six states
• Colorado, Kansas, Pennsylvania, Texas, Wisconsin and Wyoming
– >1,000 MW in commercial opera.on
– 5 addi.onal wind farms in construc.on that will be opera.onal by end of 2012
• 5,500 MW in our U.S. pipeline of poten.al development projects
Solar PorColio
• 11 commercial solar plants operate >50MW in Arizona, Florida, Texas and North Carolina
• Regulated por`olio focused in NC includes:
– 8MW Distributed Solar Program
– 16MW PPA – RECs from thermal
solar
5
Bio-power
§ >300MW of bio-power contracted across Duke Service territory
§ Wood waste plants in North Carolina provide close to 75MW
§ Solid waste plants in Florida and North Carolinas provide over 160MW
§ Poultry waste to bio-gas contract signed for 60MW
The Landscape Ahead for Duke
• Aging coal fleet—average age of exis.ng units is 45 years
• Increasing and uncertain environmental regula.on
• No clear direc.on on CO2 • US shale gas produc.on and market dynamics fundamentally alters the compe..ve economics—our gas units have been dispatching ahead of our coal units
6

Duke Energy’s Aging Coal Fleet Duke
Midwest Oper. Year MWs
Duke Carolinas
Oper. Year MWs Legacy Progress
Oper. Year MWs
Cayuga 1970/72 1,005 Allen 1957/61 1127 Crystal River 1966/84 2340
Conesville 1973 312 Belews Creek 1974/75 2220 Asheville 1964/71 383
East Bend 1981 414 Buck 1953 256 Lee Steam 1951/1962 417
Gallagher 1958/61 280 Cliffside 1972 556 Mayo 1983 748
Gibson 1975/82 2,845 Lee 1951/59 370 Roxboro 1966/68 1038
Stuart 1970/74 927 Marshall 1965/70
2078 Weatherspoon 1949/52 117
Killen 1982 205 Riverbend 1952/54 454 H B Robinson 1960 179
Miami Fort 1949/78 883
Wabash River 1953/68 668
Beckjord 1952/69 862
Zimmer 1991 605
Average Coal Fleet Age = 45 years

Ozone NAAQS
PM-2.5 NAAQS
'09 '10 '11 '12 '13 '14 '15 '16
CAIR Phase I Seasonal NOx
Cap Began
CAIR Phase I Annual SO2 Cap Began
PM-2.5 NAAQS
Revision Proposed
1-Hour SO2 NAAQS
Revision Final
(estimated attainment date late
2017 or early 2018)
SO2 NAAQS
Hg/HAPS MATS
Hg/HAPs MATS Rule
Final
Hg/HAPS MATS
Compliance With Possible
1-Year Extension
CAIR/Cross State Air Pollution Rule
CAIR Phase I Annual NOx Cap Began
316(b) Cooling Water Rule
Proposed
316(b) Cooling Water Rule Final
316(b) Compliance
1-8 Years After Rule
Final
Effluent Guidelines
Rule Proposed
Water
Effluent Guidelines Rule Final
Effluent Guidelines Compliance 0-5+ Years After Rule
Final
Begin Compliance Requirements
Under Final CCR Rule (ground
water monitoring, double liners,
closure, dry ash conversion)
Coal Combustion Residuals
CCR Management
Rule Proposed
CCR Management
Rule Final
CSAPR Final (implementation uncertain due to
litigation)
CO2
CO2 (PSD/BACT) Regulations
Began
8-Hour Ozone NAAQS
Revision Proposed
PM-2.5 NAAQS Revision
Final
EGU NSPS Rule for CO2
Proposed (takes effect
upon proposal)
8-Hour Ozone NAAQS
Revision Final
Actual dates of future proposed and final
regulations will be dictated by when EPA acts
Increasing and Uncertain Environmental Regula.on “Environmental Train-‐Wreck”

No Clear Direc.on on CO2 • No likelihood of significant ac.on un.l 2013 or beyond
– 2011 mid-‐term elec.ons altered the balance of power • Republicans control over the House • Democrats reduced majority in the Senate, Moderate D’s are key
– Job crea.on and deficit reduc.on are of paramount importance – No poli.cal trac.on for GHG (CO2) emissions controls in the US – Some Senate explora.on of Clean Energy Standard & incremental CCS bill
9
Economy and Jobs
ü Renewable Energy ü Reduce GHGs ü Dev. Infrastructure
ü Enhance US energy security ü Clean Coal Dev ü No New Spending
10
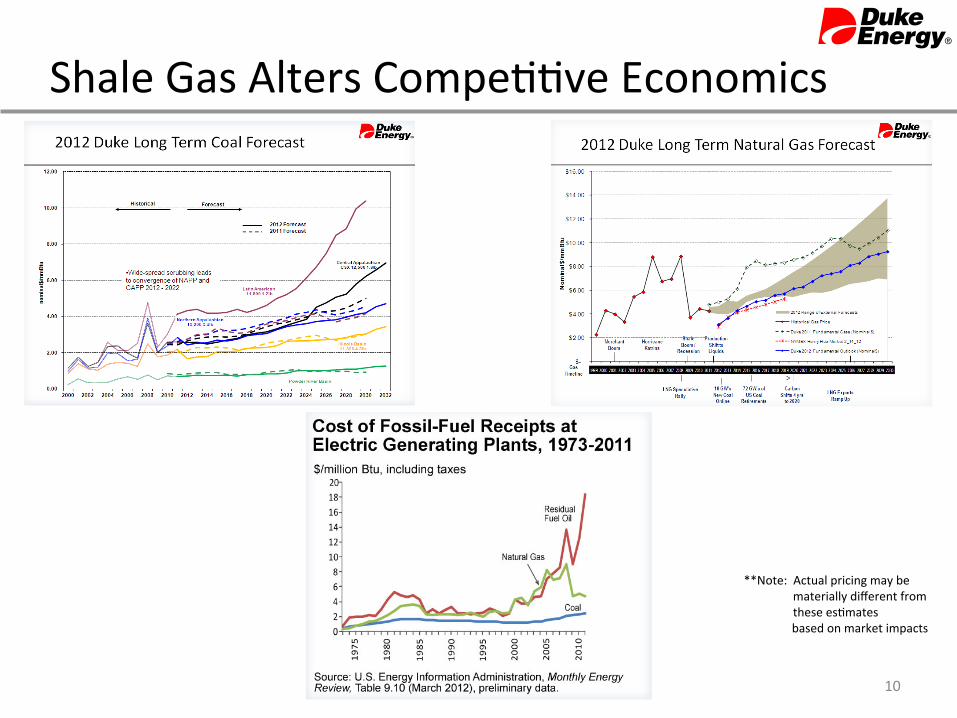
Shale Gas Alters Compe..ve Economics
**Note: Actual pricing may be materially different from these es.mates
based on market impacts
Our Aspira.ons
Ø De-‐carbonize our power generation Ø Help make our communities the most energy ef:icient in the world
“We need to be ready to meet ever-‐higher environmental standards, to embrace the latest technologies and to forge new partnerships—around the corner and around the globe.”
Jim Rogers Chairman, President and CEO
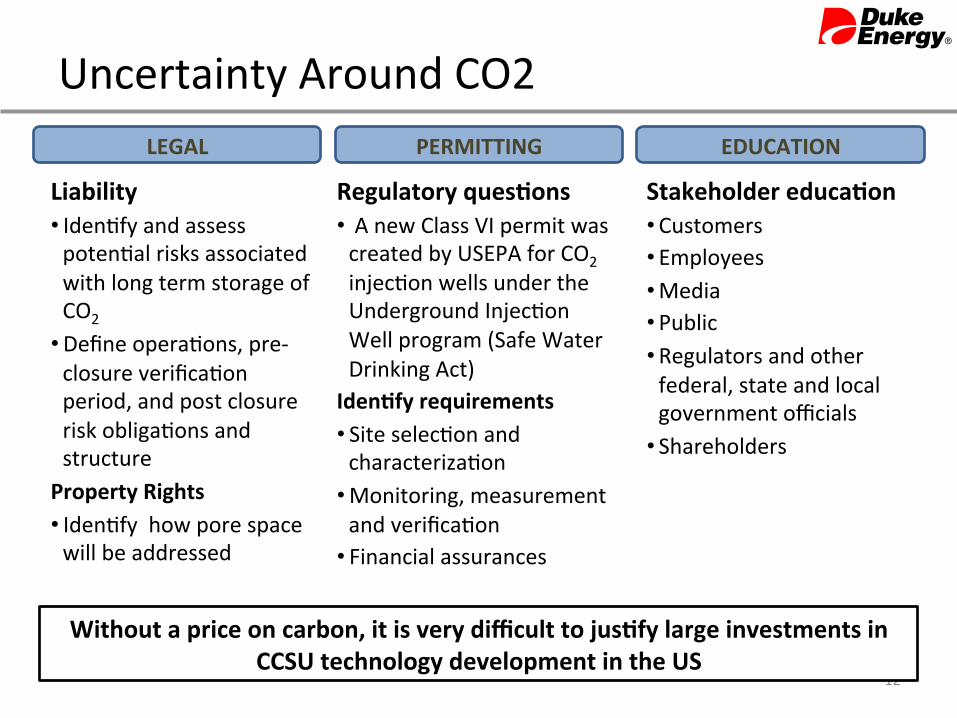
Uncertainty Around CO2
12
LEGAL
Liability • Iden.fy and assess poten.al risks associated with long term storage of CO2
• Define opera.ons, pre-‐closure verifica.on period, and post closure risk obliga.ons and structure Property Rights • Iden.fy how pore space will be addressed
PERMITTING
Regulatory ques>ons • A new Class VI permit was created by USEPA for CO2 injec.on wells under the Underground Injec.on Well program (Safe Water Drinking Act) Iden>fy requirements • Site selec.on and characteriza.on
• Monitoring, measurement and verifica.on
• Financial assurances
EDUCATION
Stakeholder educa>on • Customers • Employees • Media • Public • Regulators and other federal, state and local government officials
• Shareholders
Without a price on carbon, it is very difficult to jus>fy large investments in CCSU technology development in the US

Beyond CCS—Poten.al CO2 Uses • Integrated Circuits, or Chips -‐ CO2 usage can eliminate million gallons
of wastewater and thousands of gallons of corrosive hazardous materials.
• Chemical processes: CO2 can be used to replace sulfuric acid in alkaline water to control pH levels.
• Enhanced oil recovery: CO2 is pumped into an oil well, it is par.ally dissolved into the oil, rendering it less viscous. Considerably more oil can be extracted using this process.
• Greenhouses: Have shown that by using CO2 produc.on yields can increase by 20%.
• Carbona>on: CO2 gas is used to carbonate sov drinks, beers and wine and to prevent fungal and bacterial growth. CO2 can also be used to displace air during canning.
• Algae: Value added products from CO2 recycling. • Working fluid: Working fluid for energy storage or combus.on
turbines 13
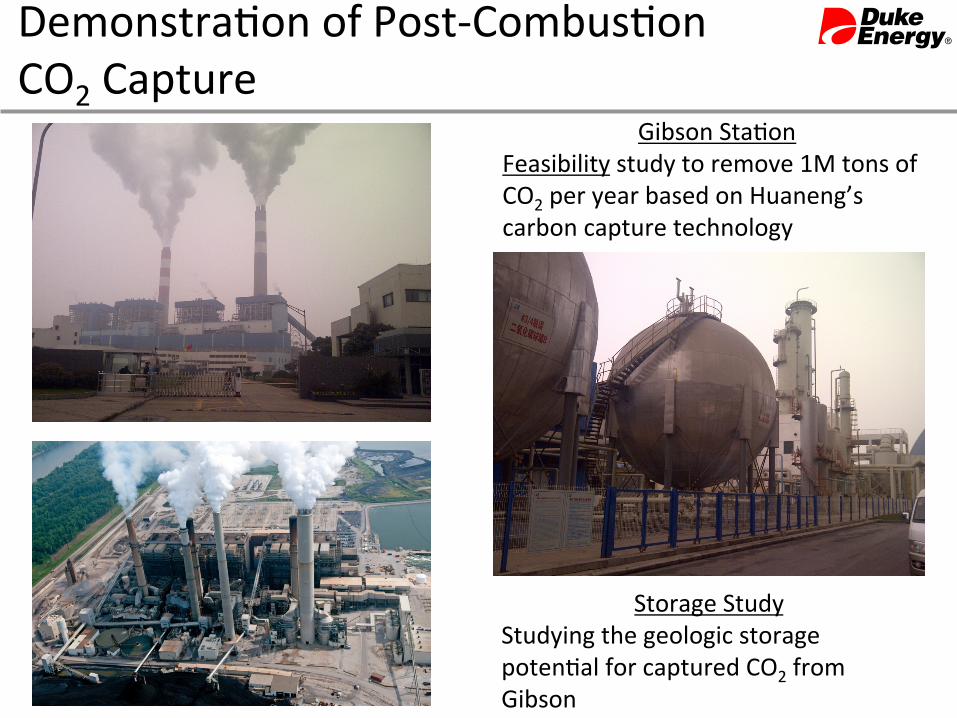
Gibson Sta.on Feasibility study to remove 1M tons of CO2 per year based on Huaneng’s carbon capture technology
Storage Study Studying the geologic storage poten.al for captured CO2 from Gibson
Demonstra.on of Post-‐Combus.on CO2 Capture
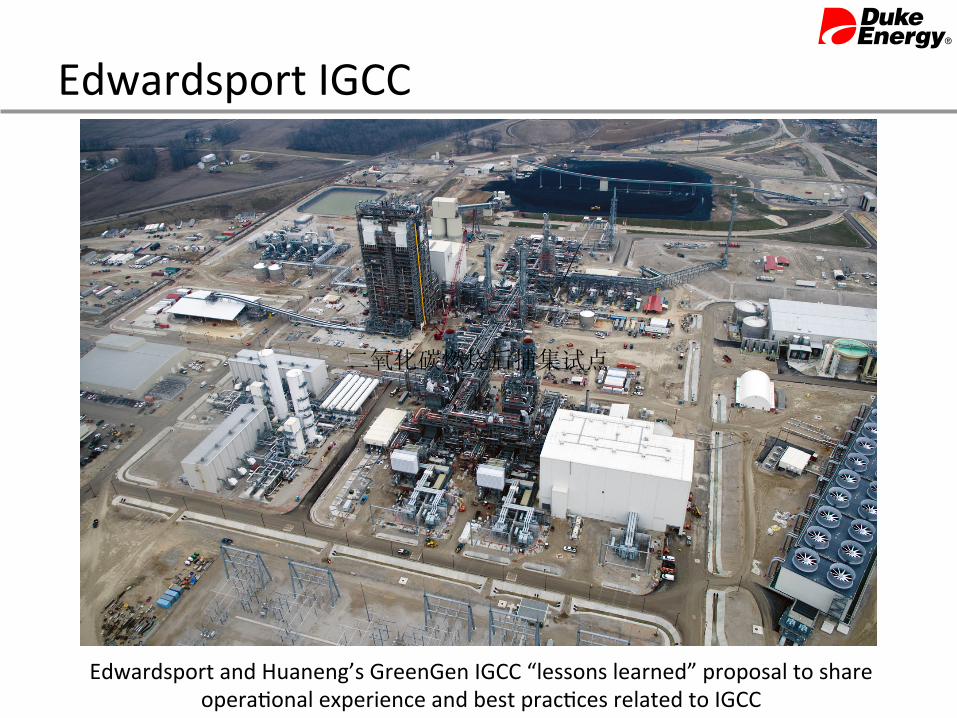
Edwardsport IGCC
Edwardsport and Huaneng’s GreenGen IGCC “lessons learned” proposal to share opera.onal experience and best prac.ces related to IGCC
二氧化碳燃烧后捕集试点
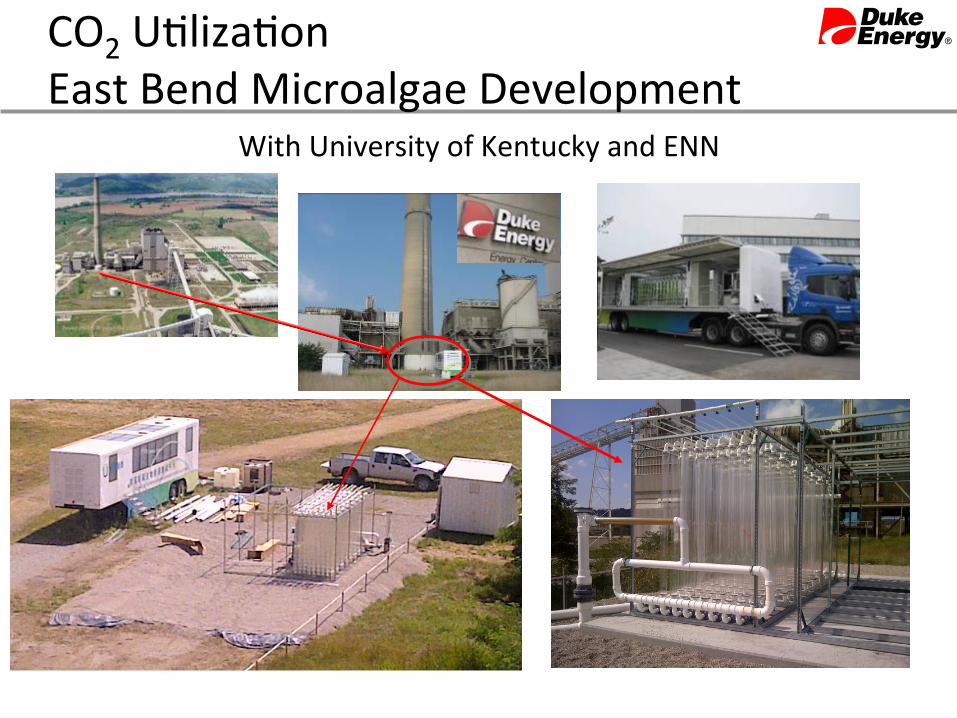
CO2 U.liza.on East Bend Microalgae Development
With University of Kentucky and ENN

APPENDIX
17

Central Plant Technology Strategy
1. Pre-‐Combus>on • Environmental controls used to process and clean the fuel or air intake prior to entering the boiler for combus.on
• Pre-‐combus.on mercury control and coal cleaning to reduce metals from FGD effluent
2. Combus>on • Improved combus.on processes that reduce CO2, NOx, sulfur and par.culate emissions
3. Post-‐Combus>on • Environmental controls used to remove pollutants from flue gas stream; CCS and algae technologies
• Environmental controls used to remove heavy metals from FGD effluent • Chemical / Biological / Physical treatment
• Advanced filtra.on • Zero Liquid Discharge
4. Water Management • Reduc.on and reuse of water throughout cooling water process • Waste water reuse • Cooling technologies
1
2
3
4
Key Objec>ves • Understand emerging trends and poten.al impacts. • Iden.fy and pursue por`olio of opportuni.es to reduce opera.onal and environmental risk. • Leverage and extend corporate central plant assets. Maintain balanced genera.on por`olio – Coal, Gas, Nuclear, Hydro, Renewables. • Reduce environmental footprint of our genera.ng fleet.
Key Focus Areas
5. New Genera>on • Maintain balanced por`olio
• Coal • Natural gas • Nuclear • Renewable energy
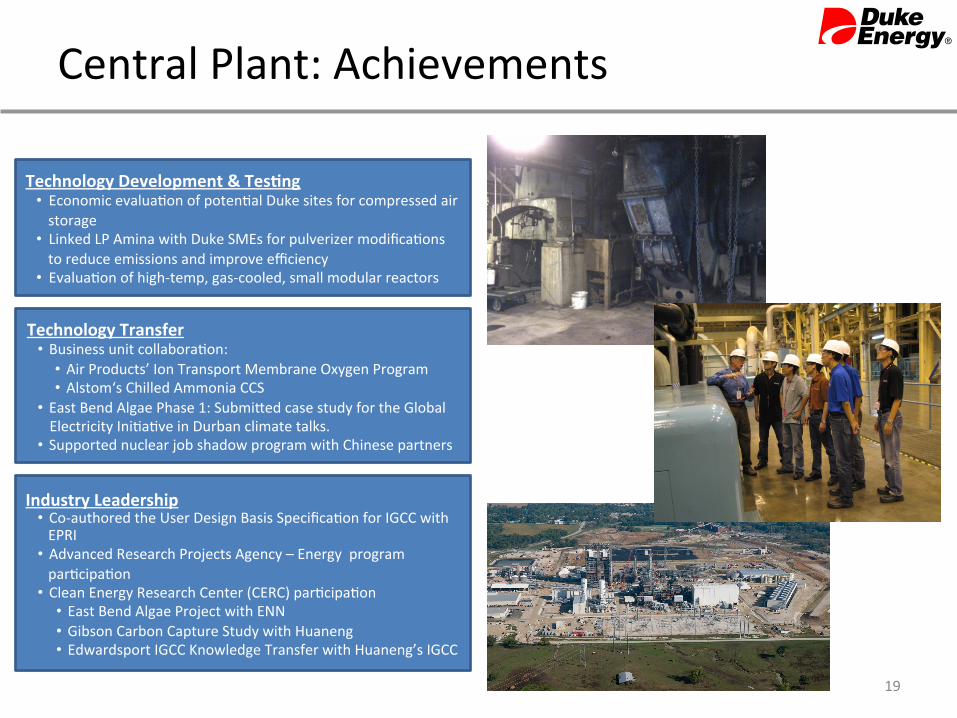
Central Plant: Achievements
19
Technology Development & Tes>ng • Economic evalua.on of poten.al Duke sites for compressed air storage
• Linked LP Amina with Duke SMEs for pulverizer modifica.ons to reduce emissions and improve efficiency
• Evalua.on of high-‐temp, gas-‐cooled, small modular reactors
Technology Transfer • Business unit collabora.on:
• Air Products’ Ion Transport Membrane Oxygen Program • Alstom‘s Chilled Ammonia CCS
• East Bend Algae Phase 1: Submi\ed case study for the Global Electricity Ini.a.ve in Durban climate talks.
• Supported nuclear job shadow program with Chinese partners
Industry Leadership • Co-‐authored the User Design Basis Specifica.on for IGCC with EPRI
• Advanced Research Projects Agency – Energy program par.cipa.on
• Clean Energy Research Center (CERC) par.cipa.on • East Bend Algae Project with ENN • Gibson Carbon Capture Study with Huaneng • Edwardsport IGCC Knowledge Transfer with Huaneng’s IGCC
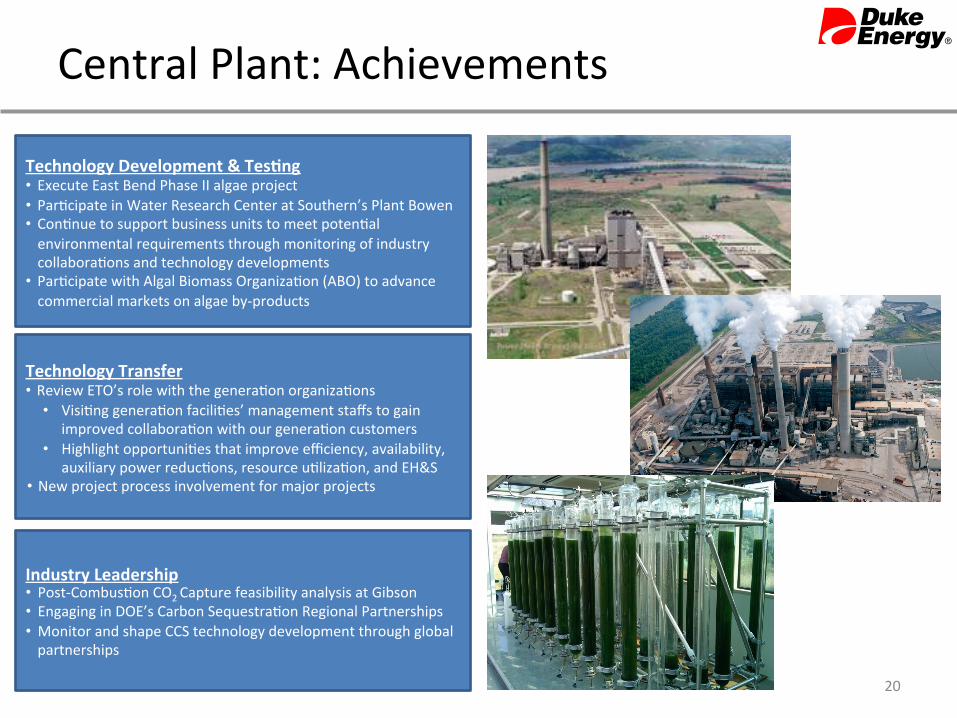
Central Plant: Achievements
20
Technology Development & Tes>ng • Execute East Bend Phase II algae project • Par.cipate in Water Research Center at Southern’s Plant Bowen • Con.nue to support business units to meet poten.al environmental requirements through monitoring of industry collabora.ons and technology developments
• Par.cipate with Algal Biomass Organiza.on (ABO) to advance commercial markets on algae by-‐products
Technology Transfer • Review ETO’s role with the genera.on organiza.ons
• Visi.ng genera.on facili.es’ management staffs to gain improved collabora.on with our genera.on customers
• Highlight opportuni.es that improve efficiency, availability, auxiliary power reduc.ons, resource u.liza.on, and EH&S
• New project process involvement for major projects
Industry Leadership • Post-‐Combus.on CO2 Capture feasibility analysis at Gibson • Engaging in DOE’s Carbon Sequestra.on Regional Partnerships • Monitor and shape CCS technology development through global partnerships
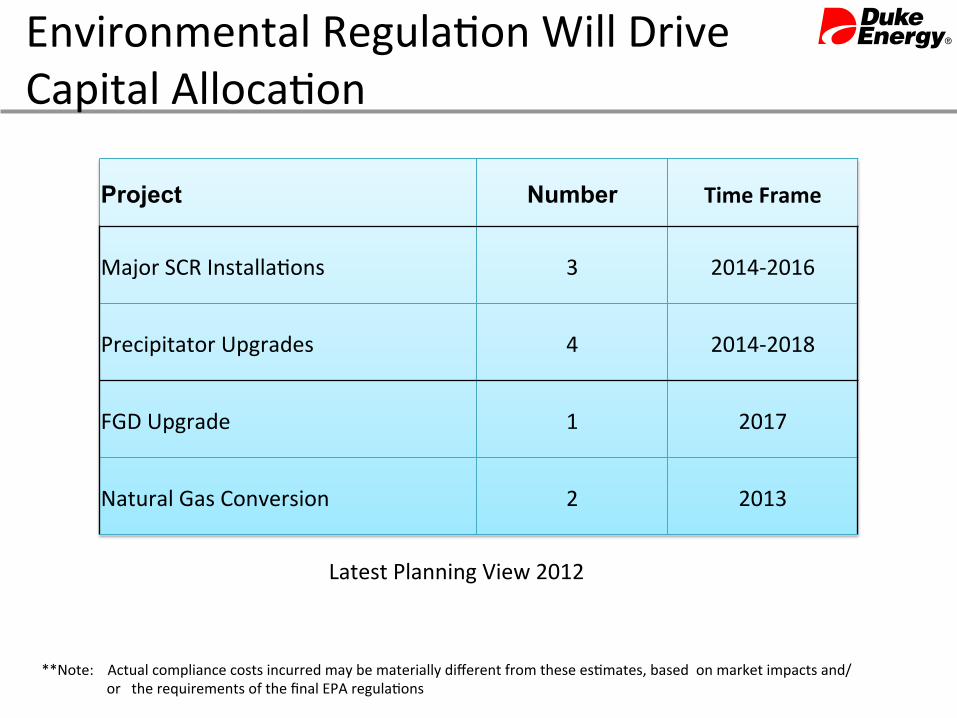
Environmental Regula.on Will Drive Capital Alloca.on
Project Number Time Frame
Major SCR Installa.ons 3 2014-‐2016
Precipitator Upgrades 4 2014-‐2018
FGD Upgrade 1 2017
Natural Gas Conversion 2 2013
**Note: Actual compliance costs incurred may be materially different from these es.mates, based on market impacts and/or the requirements of the final EPA regula.ons
Latest Planning View 2012
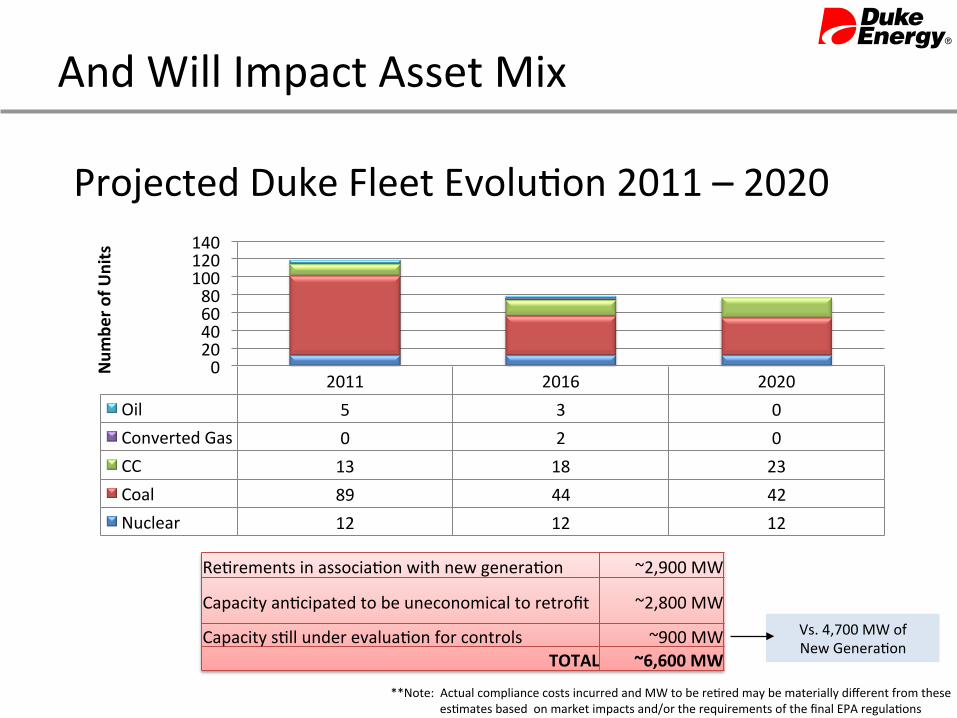
**Note: Actual compliance costs incurred and MW to be re.red may be materially different from these es.mates based on market impacts and/or the requirements of the final EPA regula.ons
Re.rements in associa.on with new genera.on ~2,900 MW
Capacity an.cipated to be uneconomical to retrofit ~2,800 MW
Capacity s.ll under evalua.on for controls ~900 MW TOTAL ~6,600 MW
Vs. 4,700 MW of New Genera.on
2011 2016 2020 Oil 5 3 0 Converted Gas 0 2 0 CC 13 18 23 Coal 89 44 42 Nuclear 12 12 12
0 20 40 60 80 100 120 140
Num
ber o
f Units
And Will Impact Asset Mix
Projected Duke Fleet Evolu.on 2011 – 2020


![Index [carnegieendowment.org]carnegieendowment.org/files/pakistan.indx.FINAL.pdf · Amar Sonar Bangla (My Golden Bengal), 69 ... confrontations with Sharif, 204–6, 210 election](https://static.fdocuments.net/doc/165x107/5ac5aa187f8b9aa0518e1f51/index-sonar-bangla-my-golden-bengal-69-confrontations-with-sharif-2046.jpg)