
© 2010 Joerg Woerner Datamath Calculator Museum - Funky Goods

US Entertainment & Media Outlook
2016 – 2020
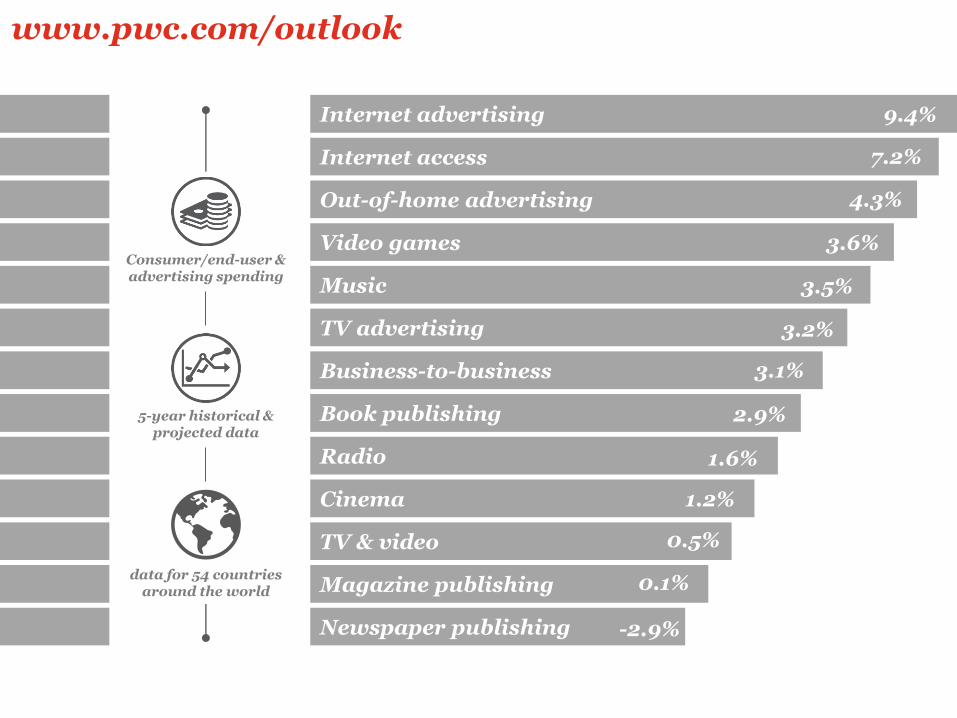
Internet advertising
5-year historical & projected data
www.pwc.com/outlook
Consumer/end-user & advertising spending
data for 54 countries around the world
Internet access
Video games
Business-to-business
TV & video
Radio
Newspaper publishing
Magazine publishing
Cinema
Book publishing
TV advertising
Music
Out-of-home advertising
9.4%
7.2%
4.3%
3.6%
3.5%
3.2%
3.1%
2.9%
1.6%
1.2%
0.5%
0.1%
-2.9%

3
Global insights

Projected industry growth 2016—2020
4.4%A world of differences: capturing attention and value in today’s global multi-speed media landscape
Global E&M Outlook 2016-2020
5
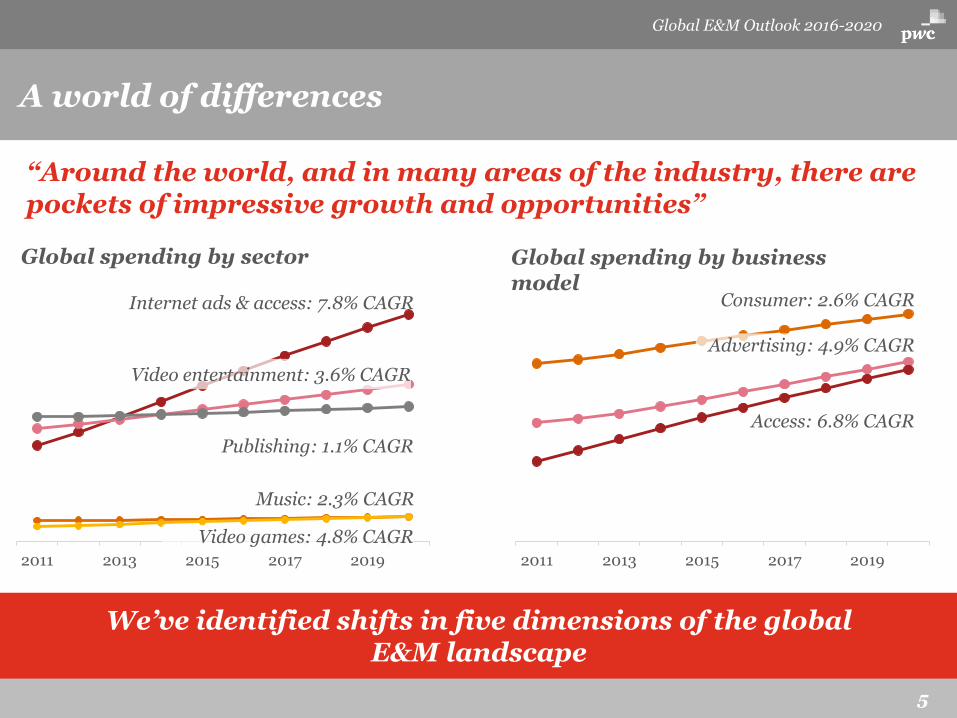
A world of differences
We’ve identified shifts in five dimensions of the global E&M landscape
“Around the world, and in many areas of the industry, there are pockets of impressive growth and opportunities”
2011 2013 2015 2017 2019
Global spending by business model
Consumer: 2.6% CAGR
Advertising: 4.9% CAGR
Access: 6.8% CAGR
2011 2013 2015 2017 2019
Internet ads & access: 7.8% CAGR
Video entertainment: 3.6% CAGR
Publishing: 1.1% CAGR
Music: 2.3% CAGR
Video games: 4.8% CAGR
Global spending by sector
Global E&M Outlook 2016-2020
6
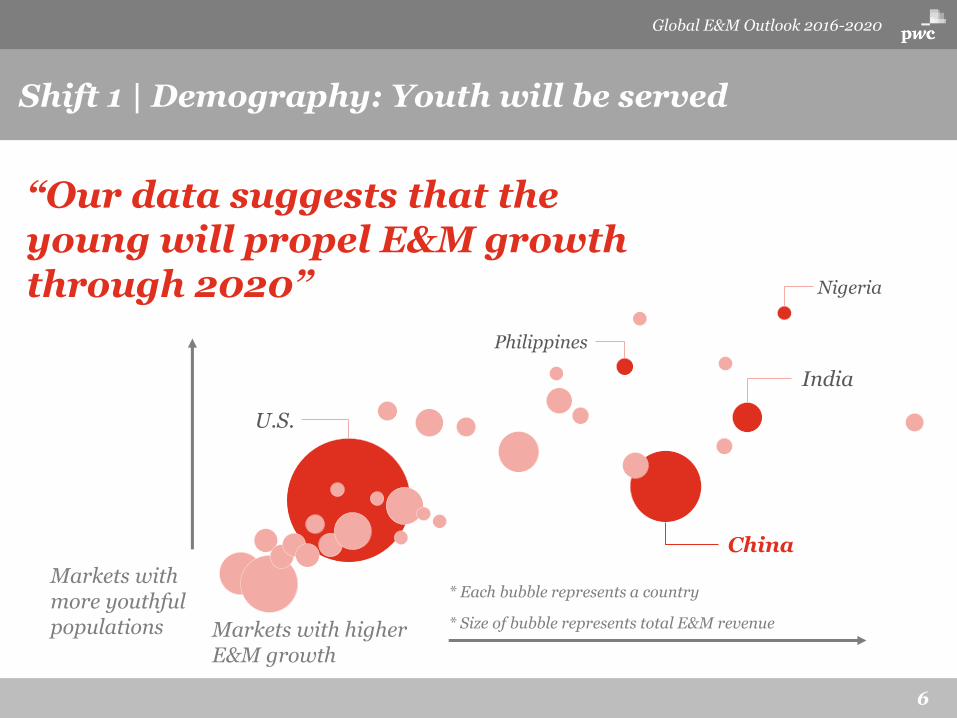
Shift 1 | Demography: Youth will be served
“Our data suggests that the young will propel E&M growth through 2020”
Markets with more youthful populations Markets with higher
E&M growth
U.S.
China
India
Philippines
Nigeria
* Each bubble represents a country
* Size of bubble represents total E&M revenue
Global E&M Outlook 2016-2020
7
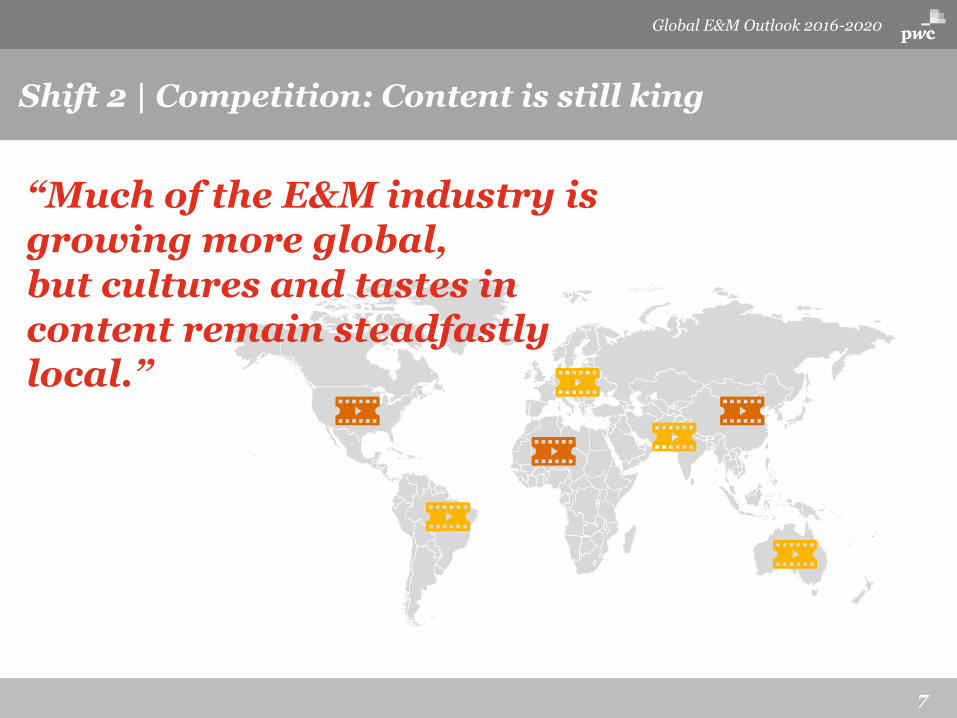
Shift 2 | Competition: Content is still king
“Much of the E&M industry is growing more global,but cultures and tastes in content remain steadfastlylocal.”
Global E&M Outlook 2016-2020
8
Shift 3 | Consumption: The joy of bundles
“The bundle isn’t dead. Not by a long shot. Incumbents are offering their content on an integrated omnichannel basis.”
Consumers are also wanting slim bundles and flexible pricing models
Global E&M Outlook 2016-2020
9
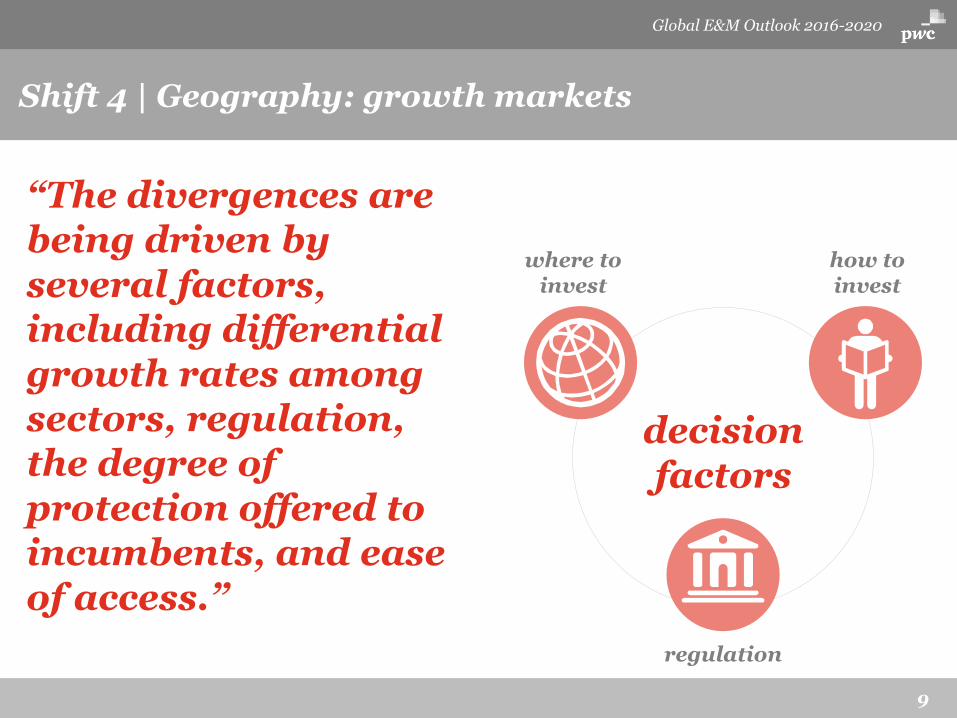
Shift 4 | Geography: growth markets
“The divergences are being driven by several factors, including differential growth rates among sectors, regulation, the degree of protection offered to incumbents, and ease of access.”
where to invest
how to invest
regulation
decision factors

Global E&M Outlook 2016-2020
10
Shift 5 | Business models: Transforming with trust
“In many areas, the growth of technology and digitization acts as a powerful centrifugal force — breaking up existing relationships; pushing large, generalist entities to give way to smaller specialists; and allowing smaller, nimble competitors to run circles around incumbents.”

Global E&M Outlook 2016-2020
11
I’m a media company. Now what?
Global E&M Outlook 2016-2020
“Companies
are now expandingtheir marketing playbooks to include more E&M-likecapabilities.”
MakersContent creators
MaximizersContent distributors
ModuleService providers
Mash-upsMultitaskers
path to market
Source: “Thriving in an Increasingly Digital Ecosystem,” Peter Weill, Stephanie L. Woerner, MIT Sloan Management Review, Summer 2015.
Four ways to play in the evolving media industry
I’m a media company. Now what?
kn
ow
led
ge
of
an
d
con
nec
tio
n t
o c
on
sum
er
Global E&M Outlook 2016-2020
12
I’m a media company. Now what?
Global E&M Outlook 2016-2020
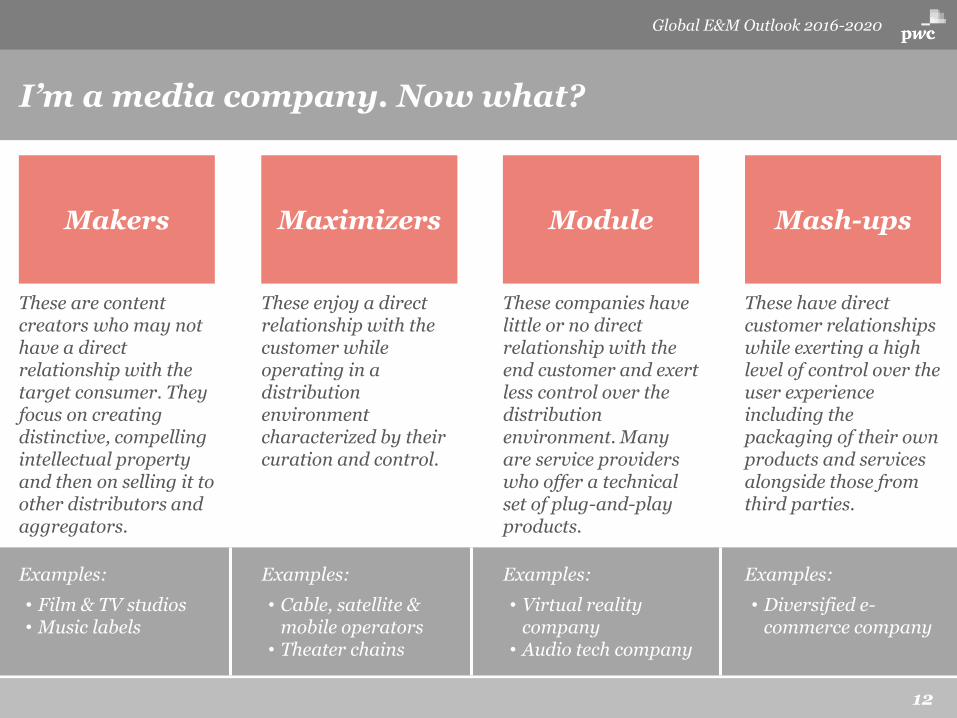
Makers Maximizers Module Mash-ups
I’m a media company. Now what?
These are content creators who may not have a direct relationship with the target consumer. They focus on creating distinctive, compelling intellectual property and then on selling it to other distributors and aggregators.
These enjoy a direct relationship with the customer while operating in a distribution environment characterized by their curation and control.
Examples:
• Cable, satellite & mobile operators
• Theater chains
Examples:
• Film & TV studios• Music labels
These companies have little or no direct relationship with the end customer and exert less control over the distribution environment. Many are service providers who offer a technical set of plug-and-play products.
Examples:
• Virtual reality company
• Audio tech company
These have direct customer relationships while exerting a high level of control over the user experience including the packaging of their own products and services alongside those from third parties.
Examples:
• Diversified e-commerce company

Global E&M Outlook 2016-2020
13
Quadrants
Global E&M Outlook 2016-2020
bigger
faster
Mature Next Wave
Slow Growing
Up & Comers
Average Size
2020 revenue $US bn
Projected Growth
2015-2020 CAGR
US Size US Growth
$766.6
$6.3
$6.3
$50.5
$73.1
3.7%
3.4%
7.8%
8.6%
3.3%
Quadrants
US
Greece
China
Nigeria

Global E&M Outlook 2016-2020
14
Sources of revenue growth
Global E&M Outlook 2016-2020
Key takeaway
Size2020 share of revenue
Growth2015-2020 CAGR
41%
24%
36%
39%
28%
33%Advertising
Access
Consumer
1.9%
7.2%
3.8%
2.5%
6.8%
5.1%
Global
US
Color legend
Sources of revenue growth
Global E&M Outlook 2016-2020
15
Sources of growth: advertising in-depth
Global E&M Outlook 2016-2020
5%
4%
7%
4%
8%
5%
11%
21%
34%
2%
4%
5%
5%
8%
5%
12%
16%
42%
India
Brazil
Russia
France
Germany
UK
Japan
China
US
2015
2020
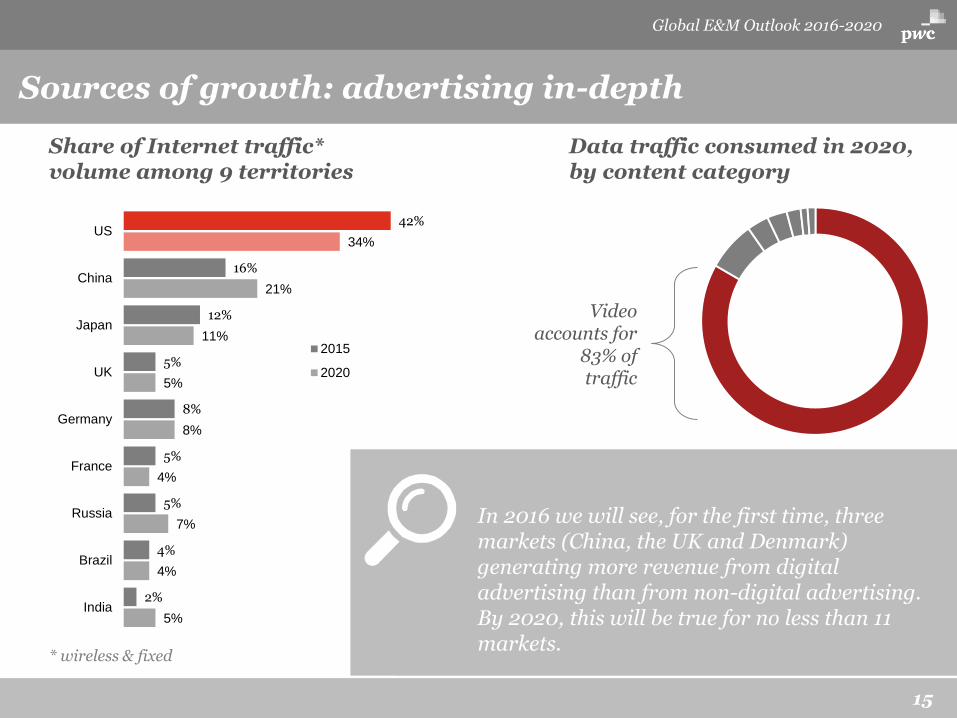
Share of Internet traffic* volume among 9 territories
* wireless & fixed
Data traffic consumed in 2020, by content category
Video accounts for
83% of traffic
In 2016 we will see, for the first time, three markets (China, the UK and Denmark) generating more revenue from digital advertising than from non-digital advertising. By 2020, this will be true for no less than 11 markets.
Global E&M Outlook 2016-2020
16
Sources of growth: advertising in-depth
Global data consumption on mobile devices is projected to grow by a CAGR of 36%
Consumers are engaging with media increasingly on their mobile phones, and even at work. The value of attention / ability to monetize advertising dollars is being challenged, and there is no one perfect metric to assure advertisers of the value they get when you consider the shifting consumer behaviors.
Global E&M Outlook 2016-2020
17
US spending by business model
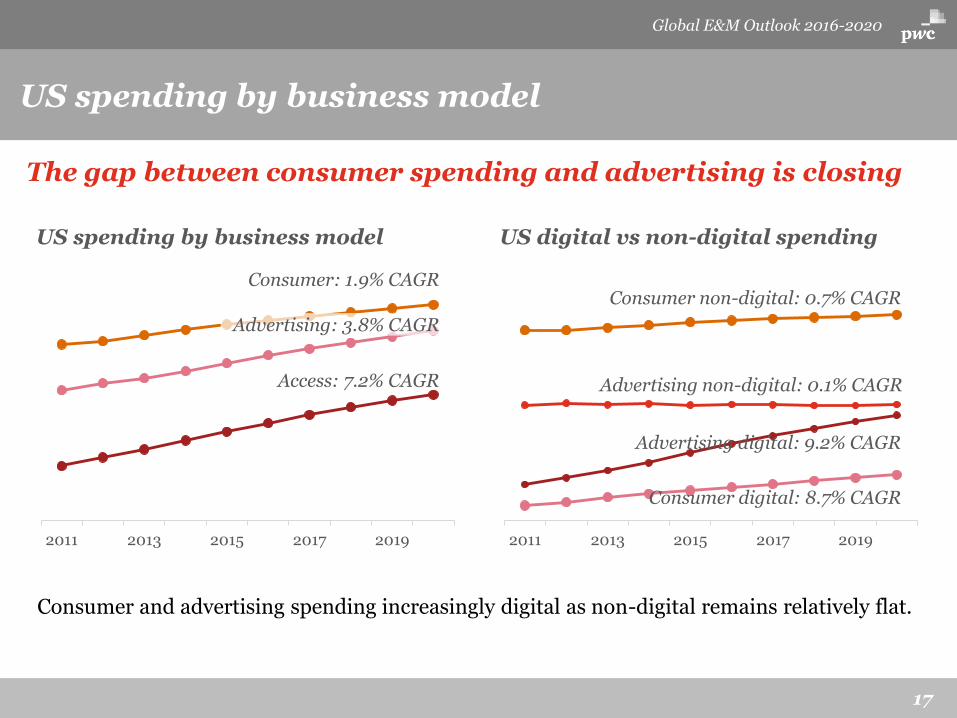
The gap between consumer spending and advertising is closing
2011 2013 2015 2017 2019
US spending by business model
Consumer: 1.9% CAGR
Advertising: 3.8% CAGR
Access: 7.2% CAGR
2011 2013 2015 2017 2019
US digital vs non-digital spending
Consumer non-digital: 0.7% CAGR
Consumer digital: 8.7% CAGR
Consumer and advertising spending increasingly digital as non-digital remains relatively flat.
Advertising non-digital: 0.1% CAGR
Advertising digital: 9.2% CAGR
Global E&M Outlook 2016-2020
18
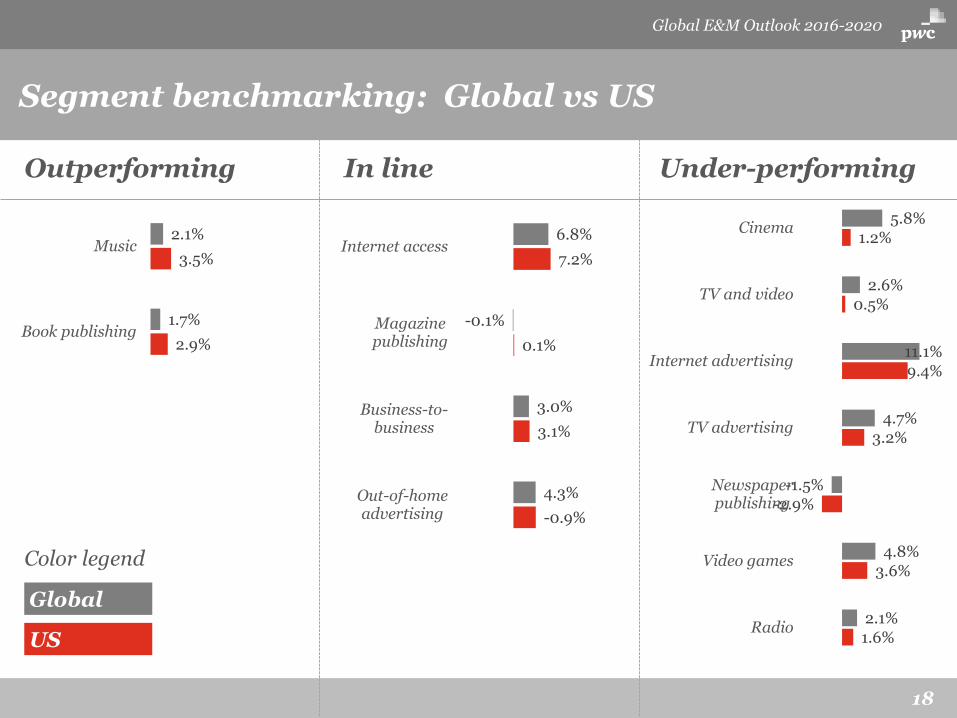
Outperforming Under-performingIn line
Global E&M Outlook 2016-2020
Segment benchmarking: Global vs China
2.9%
3.5%
1.7%
2.1%
Book publishing
Music
-0.9%
3.1%
0.1%
7.2%
4.3%
3.0%
-0.1%
6.8%
Out-of-homeadvertising
Business-to-business
Magazinepublishing
Internet access
1.6%
3.6%
-2.9%
3.2%
9.4%
0.5%
1.2%
2.1%
4.8%
-1.5%
4.7%
11.1%
2.6%
5.8%
Radio
Video games
Newspaperpublishing
TV advertising
Internet advertising
TV and video
Cinema
Global
US
Color legend
Segment benchmarking: Global vs US

Deep dive: Advertising
Global E&M Outlook 2016-2020
20
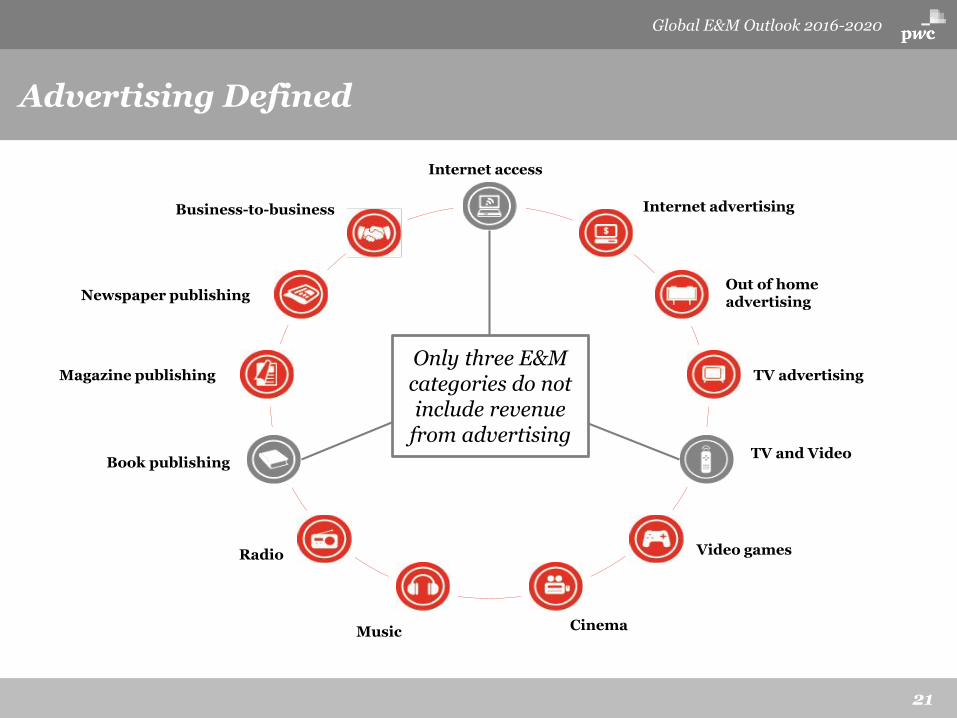
Advertising within the Outlook
MethodologyAdvertising revenue exists in 10 of the 13 segments included in the Outlook. Advertising is reflected in this deep dive across territories and segments. Net advertising figures are reflected, which represent gross advertising revenue less agency commission, discounts and production costs with knowledge-based assumptions used where applicable.
Digital advertising components, such as digital newspaper advertising, digital magazine advertising, digital trade directories and online radio and online TV advertising, are all included within their respective segments and also within Internet advertising. These are removed at a total level to avoid double counting.
Global E&M Outlook 2016-2020
21
Advertising Defined
Internet access
Internet advertising
Out of home advertising
TV advertising
TV and Video
Video games
CinemaMusic
Radio
Book publishing
Magazine publishing
Newspaper publishing
Business-to-business
Only three E&M categories do not include revenue
from advertising

Global E&M Outlook 2016-2020
22
Key themes / trends
Advertising growth is fueled by where consumers are increasingly spending their time – online, particularly mobile experiences
Internet advertising is the largest ad segment, fueled in part by television and video experiences (and ad revenue) moving online
Tracking consumer’s location / experience and delivering ads at the right time throughout the day continues to be an area of innovation
Online ads have not replaced traditional ad revenues (both in total revenue and typical per unit ad rates), driving online subscription model popularity
Immersive and/or live experiences are growing in popularity through eSports, concerts and more creative “hybrid” (physical + digital) ad opportunities
1
2
3
4
5
Global E&M Outlook 2016-2020
What’s new?
23
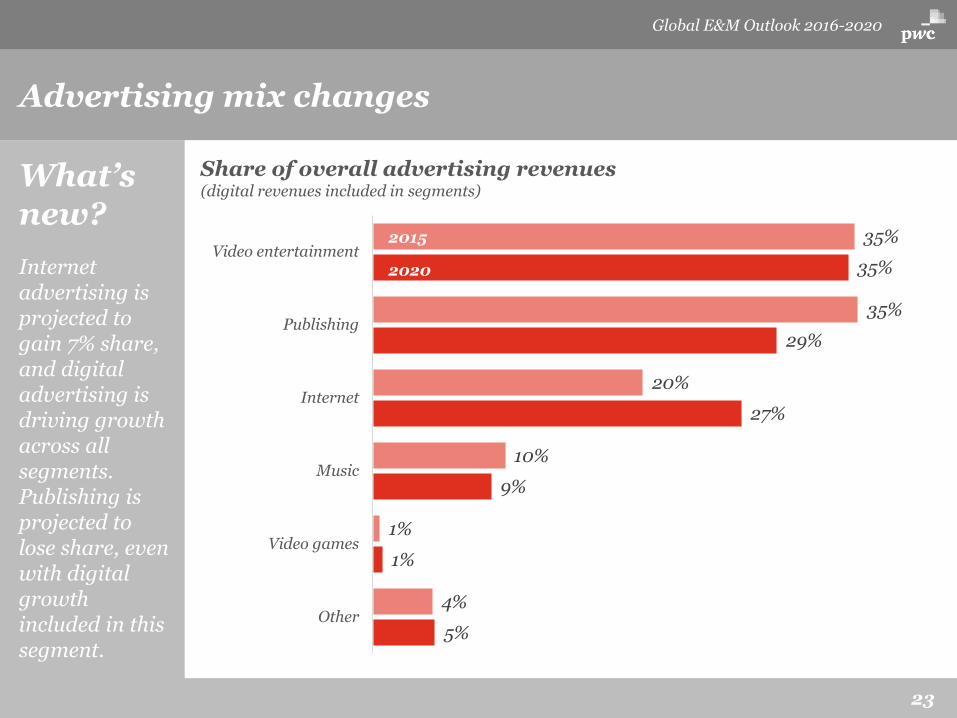
Advertising mix changes
Internet advertising is projected to gain 7% share, and digital advertising is driving growth across all segments. Publishing is projected to lose share, even with digital growth included in this segment.
5%
1%
9%
27%
29%
35%
4%
1%
10%
20%
35%
35%
Other
Video games
Music
Internet
Publishing
Video entertainment
Share of overall advertising revenues (digital revenues included in segments)
2015
2020

Global E&M Outlook 2016-2020
What’s new?
24
Growth drivers in Internet advertising
Even in Internet advertising, traditional business models (classified advertising) are giving way to newer platforms. Video and mobile ads are growing at the fastest rate.
Projected growth in US Internet advertising revenues, by the type of advertisement
Paid Search: Mobile 14.1% CAGR, Wired 3.6% CAGR
Other Display: Mobile 13.7% CAGR, Wired -3.6% CAGR
Display - Video: Mobile 30.3% CAGR, Wired 19.3% CAGR
Classified: 2.7% CAGR
2011 2012 2013 2014 2015 2016 2017 2018 2019 2020
Global E&M Outlook 2016-2020
25
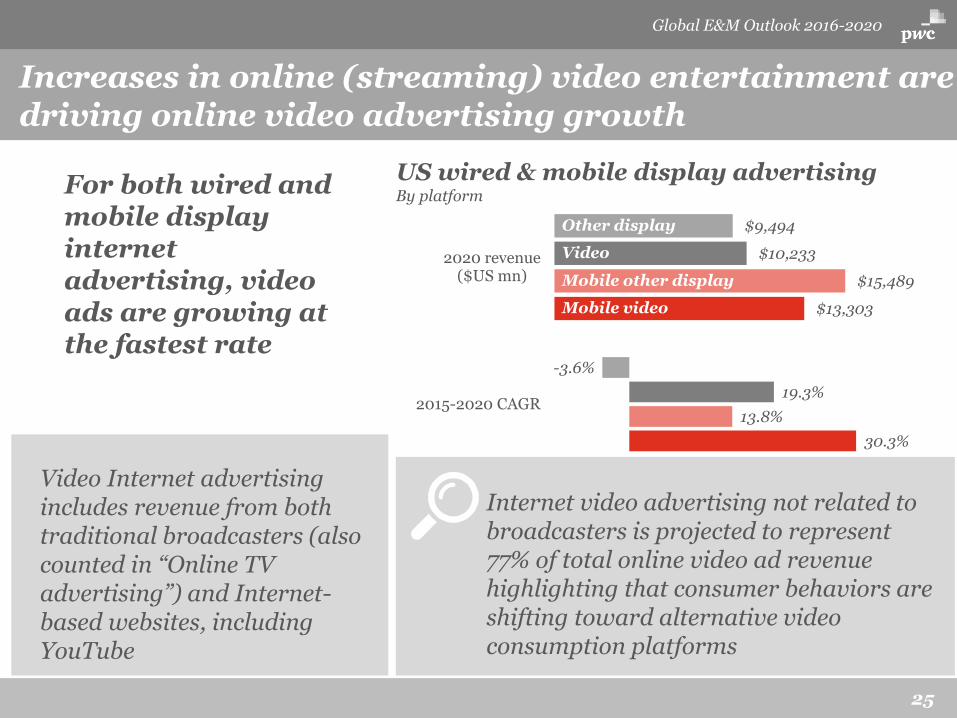
US wired & mobile display advertisingBy platform
Internet video advertising not related to broadcasters is projected to represent 77% of total online video ad revenue highlighting that consumer behaviors are shifting toward alternative video consumption platforms
Video Internet advertising includes revenue from both traditional broadcasters (also counted in “Online TV advertising”) and Internet-based websites, including YouTube
Increases in online (streaming) video entertainment are driving online video advertising growth
For both wired and mobile display internet advertising, video ads are growing at the fastest rate
30.3%
13.8%
19.3%
-3.6%
2015-2020 CAGR
$13,303
$15,489
$10,233
$9,494
2020 revenue($US mn)
Other display
Video
Mobile other display
Mobile video

Global E&M Outlook 2016-2020
What’s new?
26
Ranking countries on advertising
China & Indonesia rank in the top 10 among both the largest and fastest growing advertising markets, making them attractive opportunities.
Country analysis of advertising revenue & growth
Top 10 largest advertising country
Top 10 fastest growing advertising country
Color legend
Countries that sit in both lists
Global E&M Outlook 2016-2020
27
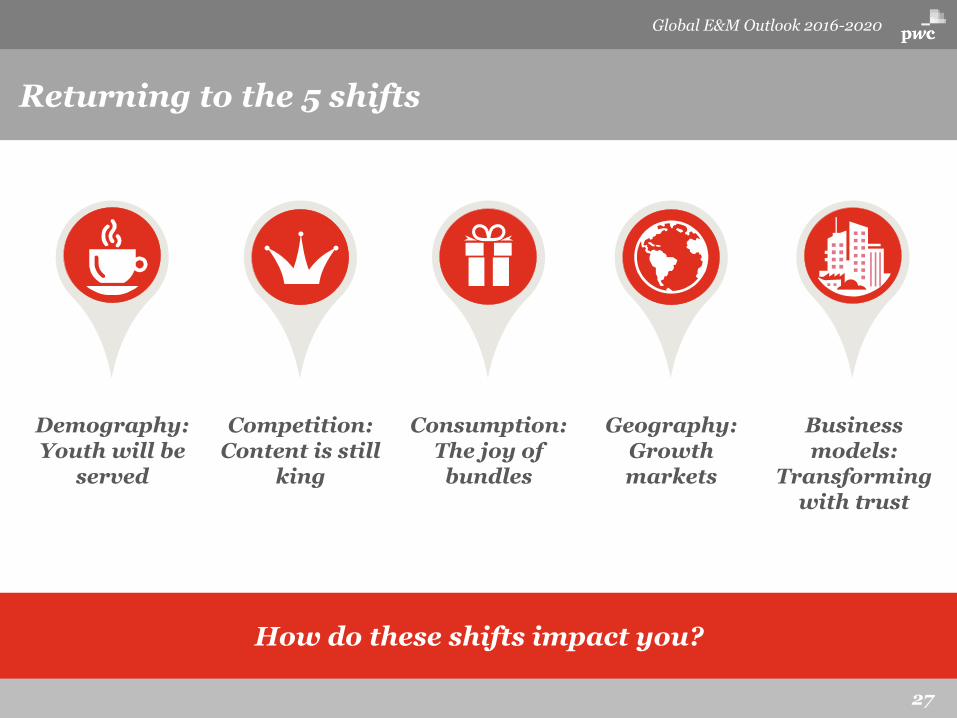
Returning to the 5 shifts
Demography: Youth will be
served
Competition: Content is still
king
Consumption: The joy of
bundles
Geography: Growth markets
Business models:
Transforming with trust
How do these shifts impact you?