
U.S. Department of Education 2010 - Blue Ribbon Schools …€¦ · · 2010-09-09U.S. Department...
24
CA-18 ca18-otay-elementary.doc 1 U.S. Department of Education 2010 - Blue Ribbon Schools Program Type of School: (Check all that apply) [] Charter [X] Title I [] Magnet [] Choice Name of Principal: Mr. Rosario Villareal Official School Name: Otay Elementary School School Mailing Address: 1651 Albany Avenue Chula Vista, CA 91911-5801 County: San Diego State School Code Number*: 382 Telephone: (619) 425-4311 Fax: (619) 425-2018 Web site/URL: http://cvesd.org/otay E-mail: [email protected] I have reviewed the information in this application, including the eligibility requirements on page 2 (Part I - Eligibility Certification), and certify that to the best of my knowledge all information is accurate. Date (Principal‘s Signature) Name of Superintendent*: Mr. Lowell Billings District Name: Chula Vista Elementary School District Tel: (619) 425-9600 I have reviewed the information in this application, including the eligibility requirements on page 2 (Part I - Eligibility Certification), and certify that to the best of my knowledge it is accurate. Date (Superintendent‘s Signature) Name of School Board President/Chairperson: Mr. Russell Coronado I have reviewed the information in this application, including the eligibility requirements on page 2 (Part I - Eligibility Certification), and certify that to the best of my knowledge it is accurate. Date (School Board President‘s/Chairperson‘s Signature) *Private Schools: If the information requested is not applicable, write N/A in the space. The original signed cover sheet only should be converted to a PDF file and emailed to Aba Kumi, Blue Ribbon Schools Project Manager ([email protected]) or mailed by expedited mail or a courier mail service (such as Express Mail, FedEx or UPS) to Aba Kumi, Director, Blue Ribbon Schools Program, Office of Communications and Outreach, U.S. Department of Education, 400 Maryland Ave., SW, Room 5E103, Washington, DC 20202-8173
Transcript of U.S. Department of Education 2010 - Blue Ribbon Schools …€¦ · · 2010-09-09U.S. Department...
CA-18 ca18-otay-elementary.doc 1
U.S. Department of Education
2010 - Blue Ribbon Schools Program
Type of School: (Check all that apply) [] Charter [X] Title I [] Magnet [] Choice
Name of Principal: Mr. Rosario Villareal
Official School Name: Otay Elementary School
School Mailing Address:
1651 Albany Avenue
Chula Vista, CA 91911-5801
County: San Diego State School Code Number*: 382
Telephone: (619) 425-4311 Fax: (619) 425-2018
Web site/URL: http://cvesd.org/otay E-mail: [email protected]
I have reviewed the information in this application, including the eligibility requirements on page 2 (Part I -
Eligibility Certification), and certify that to the best of my knowledge all information is accurate.
Date (Principal‘s Signature)
Name of Superintendent*: Mr. Lowell Billings
District Name: Chula Vista Elementary School District Tel: (619) 425-9600
I have reviewed the information in this application, including the eligibility requirements on page 2 (Part I -
Eligibility Certification), and certify that to the best of my knowledge it is accurate.
Date (Superintendent‘s Signature)
Name of School Board President/Chairperson: Mr. Russell Coronado
I have reviewed the information in this application, including the eligibility requirements on page 2 (Part I -
Eligibility Certification), and certify that to the best of my knowledge it is accurate.
Date (School Board President‘s/Chairperson‘s Signature)
*Private Schools: If the information requested is not applicable, write N/A in the space.
The original signed cover sheet only should be converted to a PDF file and emailed to Aba Kumi, Blue Ribbon Schools Project
Manager ([email protected]) or mailed by expedited mail or a courier mail service (such as Express Mail, FedEx or UPS) to Aba
Kumi, Director, Blue Ribbon Schools Program, Office of Communications and Outreach, U.S. Department of Education, 400
Maryland Ave., SW, Room 5E103, Washington, DC 20202-8173
CA-18 ca18-otay-elementary.doc 2
PART I - ELIGIBILITY CERTIFICATION
The signatures on the first page of this application certify that each of the statements below concerning the
school‘s eligibility and compliance with U.S. Department of Education, Office for Civil Rights (OCR)
requirements is true and correct.
1. The school has some configuration that includes one or more of grades K-12. (Schools on the same
campus with one principal, even K-12 schools, must apply as an entire school.)
2. The school has made adequate yearly progress each year for the past two years and has not been
identified by the state as “persistently dangerous” within the last two years.
3. To meet final eligibility, the school must meet the state’s Adequate Yearly Progress (AYP) requirement
in the 2009-2010 school year. AYP must be certified by the state and all appeals resolved at least two weeks
before the awards ceremony for the school to receive the award.
4. If the school includes grades 7 or higher, the school must have foreign language as a part of its
curriculum and a significant number of students in grades 7 and higher must take the course.
5. The school has been in existence for five full years, that is, from at least September 2003.
6. The nominated school has not received the Blue Ribbon Schools award in the past five years, 2005,
2006, 2007, 2008 or 2009.
7. The nominated school or district is not refusing OCR access to information necessary to investigate a
civil rights complaint or to conduct a district-wide compliance review.
8. OCR has not issued a violation letter of findings to the school district concluding that the nominated
school or the district as a whole has violated one or more of the civil rights statutes. A violation letter of
findings will not be considered outstanding if OCR has accepted a corrective action plan from the district to
remedy the violation.
9. The U.S. Department of Justice does not have a pending suit alleging that the nominated school or the
school district as a whole has violated one or more of the civil rights statutes or the Constitution‘s equal
protection clause.
10. There are no findings of violations of the Individuals with Disabilities Education Act in a U.S.
Department of Education monitoring report that apply to the school or school district in question; or if there
are such findings, the state or district has corrected, or agreed to correct, the findings.
CA-18 ca18-otay-elementary.doc 3
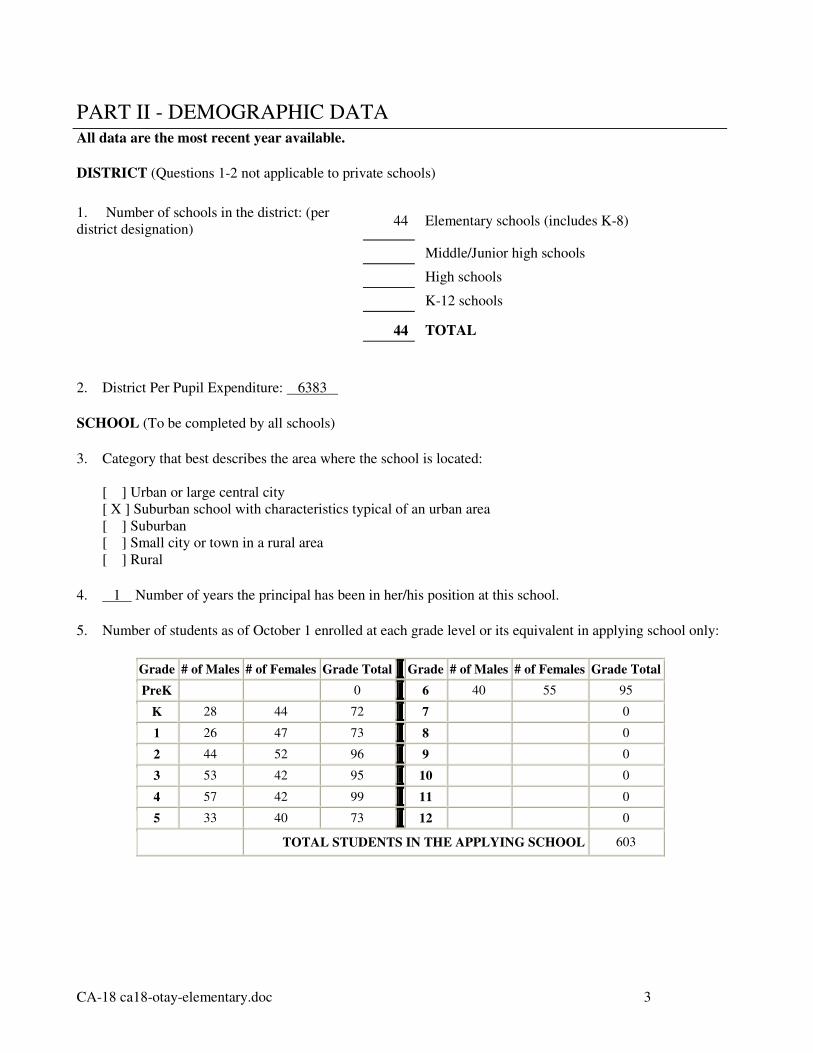
PART II - DEMOGRAPHIC DATA
All data are the most recent year available.
DISTRICT (Questions 1-2 not applicable to private schools)
1. Number of schools in the district: (per
district designation) 44 Elementary schools (includes K-8)
Middle/Junior high schools
High schools
K-12 schools
44 TOTAL
2. District Per Pupil Expenditure: 6383
SCHOOL (To be completed by all schools)
3. Category that best describes the area where the school is located:
[ ] Urban or large central city
[ X ] Suburban school with characteristics typical of an urban area
[ ] Suburban
[ ] Small city or town in a rural area
[ ] Rural
4. 1 Number of years the principal has been in her/his position at this school.
5. Number of students as of October 1 enrolled at each grade level or its equivalent in applying school only:
Grade # of Males # of Females Grade Total Grade # of Males # of Females Grade Total
PreK
0 6 40 55 95
K 28 44 72 7
0
1 26 47 73 8
0
2 44 52 96 9
0
3 53 42 95 10
0
4 57 42 99 11
0
5 33 40 73 12
0
TOTAL STUDENTS IN THE APPLYING SCHOOL 603
CA-18 ca18-otay-elementary.doc 4
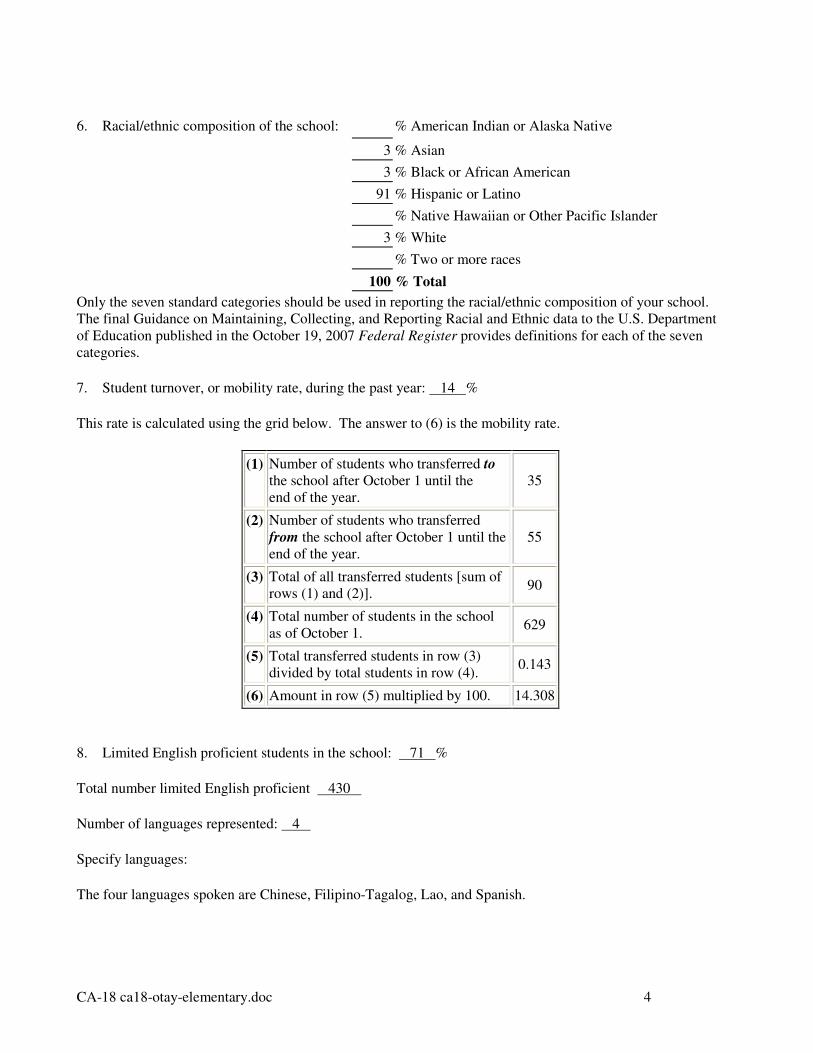
6. Racial/ethnic composition of the school: % American Indian or Alaska Native
3 % Asian
3 % Black or African American
91 % Hispanic or Latino
% Native Hawaiian or Other Pacific Islander
3 % White
% Two or more races
100 % Total
Only the seven standard categories should be used in reporting the racial/ethnic composition of your school.
The final Guidance on Maintaining, Collecting, and Reporting Racial and Ethnic data to the U.S. Department
of Education published in the October 19, 2007 Federal Register provides definitions for each of the seven
categories.
7. Student turnover, or mobility rate, during the past year: 14 %
This rate is calculated using the grid below. The answer to (6) is the mobility rate.
(1) Number of students who transferred to
the school after October 1 until the
end of the year.
35
(2) Number of students who transferred
from the school after October 1 until the
end of the year.
55
(3) Total of all transferred students [sum of
rows (1) and (2)]. 90
(4) Total number of students in the school
as of October 1. 629
(5) Total transferred students in row (3)
divided by total students in row (4). 0.143
(6) Amount in row (5) multiplied by 100. 14.308
8. Limited English proficient students in the school: 71 %
Total number limited English proficient 430
Number of languages represented: 4
Specify languages:
The four languages spoken are Chinese, Filipino-Tagalog, Lao, and Spanish.
CA-18 ca18-otay-elementary.doc 5
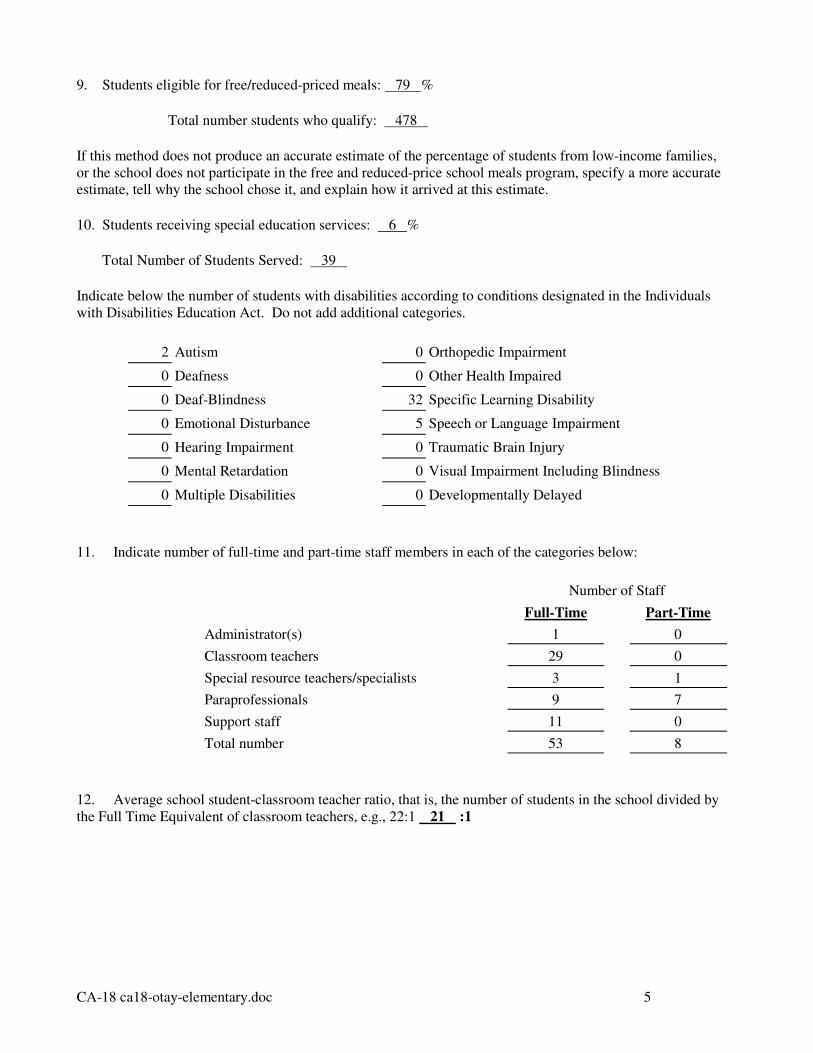
9. Students eligible for free/reduced-priced meals: 79 %
Total number students who qualify: 478
If this method does not produce an accurate estimate of the percentage of students from low-income families,
or the school does not participate in the free and reduced-price school meals program, specify a more accurate
estimate, tell why the school chose it, and explain how it arrived at this estimate.
10. Students receiving special education services: 6 %
Total Number of Students Served: 39
Indicate below the number of students with disabilities according to conditions designated in the Individuals
with Disabilities Education Act. Do not add additional categories.
2 Autism 0 Orthopedic Impairment
0 Deafness 0 Other Health Impaired
0 Deaf-Blindness 32 Specific Learning Disability
0 Emotional Disturbance 5 Speech or Language Impairment
0 Hearing Impairment 0 Traumatic Brain Injury
0 Mental Retardation 0 Visual Impairment Including Blindness
0 Multiple Disabilities 0 Developmentally Delayed
11. Indicate number of full-time and part-time staff members in each of the categories below:
Number of Staff
Full-Time
Part-Time
Administrator(s) 1
0
Classroom teachers 29
0
Special resource teachers/specialists 3
1
Paraprofessionals 9
7
Support staff 11
0
Total number 53
8
12. Average school student-classroom teacher ratio, that is, the number of students in the school divided by
the Full Time Equivalent of classroom teachers, e.g., 22:1 21 :1
CA-18 ca18-otay-elementary.doc 6
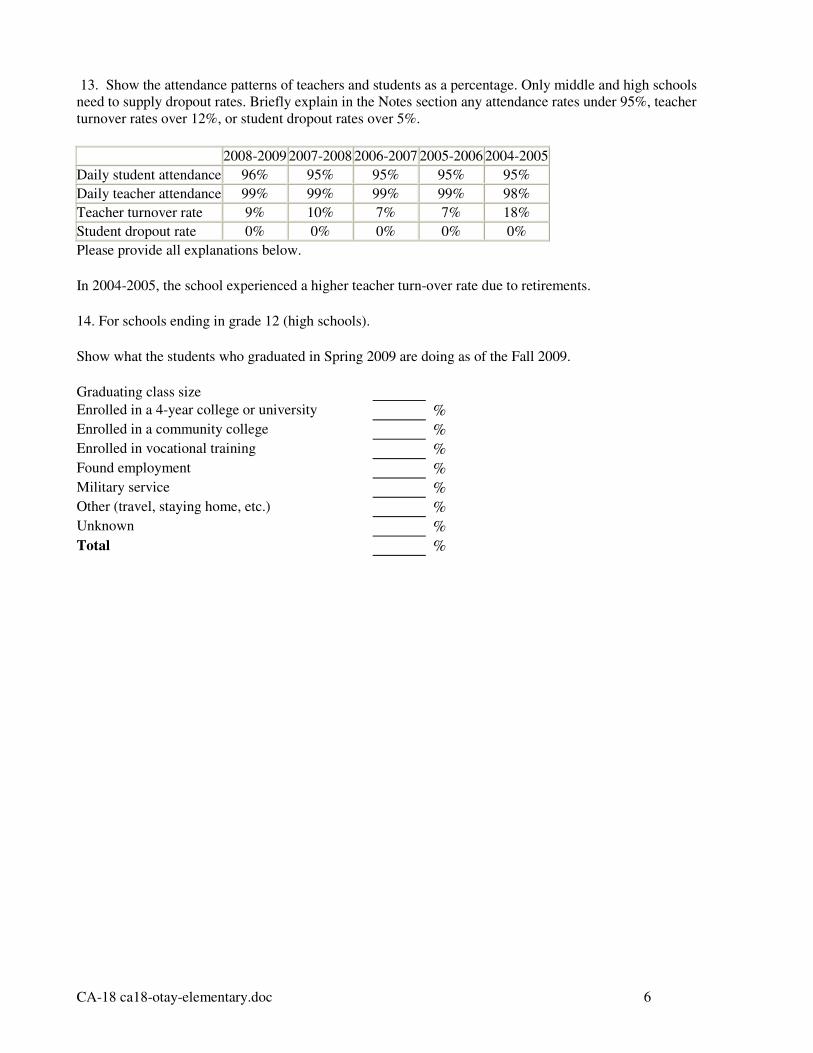
13. Show the attendance patterns of teachers and students as a percentage. Only middle and high schools
need to supply dropout rates. Briefly explain in the Notes section any attendance rates under 95%, teacher
turnover rates over 12%, or student dropout rates over 5%.
2008-2009 2007-2008 2006-2007 2005-2006 2004-2005
Daily student attendance 96% 95% 95% 95% 95%
Daily teacher attendance 99% 99% 99% 99% 98%
Teacher turnover rate 9% 10% 7% 7% 18%
Student dropout rate 0% 0% 0% 0% 0%
Please provide all explanations below.
In 2004-2005, the school experienced a higher teacher turn-over rate due to retirements.
14. For schools ending in grade 12 (high schools).
Show what the students who graduated in Spring 2009 are doing as of the Fall 2009.
Graduating class size Enrolled in a 4-year college or university %
Enrolled in a community college %
Enrolled in vocational training %
Found employment %
Military service %
Other (travel, staying home, etc.) %
Unknown %
Total %
CA-18 ca18-otay-elementary.doc 7
PART III - SUMMARY
“The words, ‘I Can’t’ do not exist at Otay Elementary, and this is what makes us shine above all.” These
words belong to our secretary of 23 years, who has seen firsthand Otay Elementary’s dramatic transformation.
Our school mission reads: “The Otay School Community is committed to providing a safe, nurturing
environment that creates high achieving, innovative thinkers who realize their potential and become self-
confident, life-long learners. Students are viewed as the core of the community. The Otay School Community
provides opportunities for all students and their families to take responsibility for learning and an active role
in their education. We are devoted to the success of all.” Clearly illustrated in our mission is our core belief in
the capacity of all students to be self-sufficient thinkers, problem-solvers and world-changers. We also believe
and thrive on parent and community involvement. Questions from any parent or community member are
greeted with a prompt reply. Parents are welcomed as volunteers and learners. We honor our community
through the delivery of a diverse and robust educational program that is inclusive. A steady stream of
volunteers participates actively in the daily business of running the school. An English as a Second Language
(ESL) class teaches parents to become proficient in the reading, writing, and speaking of English. Parents who
are part of our English Language Advisory Committee (ELAC) take tours of classrooms to see the rigorous
teaching and learning. A family resource center on school grounds, Rayo de Esperanza, services the needs of
parents, from child care to providing access to health care.
Otay Elementary has met many milestones because of this vigorous engagement of all stakeholders. When the
Academic Performance Index (API) started in 1999, Otay’s API was 473. In 2008, it joined the 800 club
(currently it is 824). Three years in a row, 2008-2010, Otay Elementary has been awarded the Title 1
Academic Achievement Award by the state of California. In 2008, the California Association of Bilingual
Education (CABE) Seal of Excellence and the California Distinguished School Award was granted to Otay
Elementary. Other recognitions include the California Business for Education Excellence Foundation Award
(CBEE) and the Just for Kids-California Award (JFTK-CA). All these honors have been made possible by our
commitment to our core beliefs and continually meeting No Child Left Behind (NCLB) academic
benchmarks. Despite what some might perceive as impediments to progress—high poverty, high minority,
and a high percentage of English Learners—the Otay Elementary community continues to rise above the
expectation. Otay Elementary’s community is comprised of 90% Latino, 3% Anglo, 3% African-American,
and 3% Asian students. Seventy-one percent of these students are classified as English Learners and 80%
qualify for the free or reduced meal program. The average educational level of Otay parents is some high
school experience. Many of these students also come from families where gang influences are
prevalent. Regardless, with a committed parent base and a strong teaching cadre, all students can and do
succeed.
Otay Elementary teachers are team players. Through collaboration and mutual respect, we have become an
Accountable Community which places student needs above those of adults, is not afraid to confront conflict,
addresses behaviors not beneficial to the group or students, and uses data to make informed decisions. We
have established a culture where there are no barriers—no limitations; we embody the teaching of S. Gilbert’s
The Land of I Can where you are reminded of what is truly important to help you say “I Can!” Beating the
odds, Otay Elementary is worthy of flying the Blue Ribbon colors.
CA-18 ca18-otay-elementary.doc 8
PART IV - INDICATORS OF ACADEMIC SUCCESS
1. Assessment Results:
Otay Elementary demonstrates great gains in academic achievement for both math and reading (language arts)
over the past five years. In order to better understand our test data, we will briefly explain our state assessment
system. The California Department of Education (CDE) provides API reports as part of its Accountability
Progress Reporting (APR) system. The information that forms the basis for calculating the API comes from
the results of the Standardized Testing and Reporting (STAR) Program which, at the elementary level,
includes assessment results from California Standards Test (CST), California Modified Assessment (CMA)
and California Alternate Performance Assessment (CAPA). Students’ performance levels on the CST, CMA,
or CAPA are assigned a performance level weighting factor of Far Below Basic (FBB), Below Basic (BB),
Basic (B), Proficient (PRO) or Advanced (ADV). The levels of Proficient and Advanced demonstrate
“meeting the standard”. A look at our data tables will confirm that Otay Elementary is worthy of Blue Ribbon
Award status for “meeting the standard” over the years; in fact, we pride ourselves in “exceeding the
standard”.
For math, Otay Elementary rose from 37% proficient and advanced in 2005 to 70% in 2009. Remarkably,
each grade level and subgroup made significant gains over the five years. For example, the percentage of
second graders who were Limited English Proficient (LEP) and Advanced rose steadily over the years: 22%,
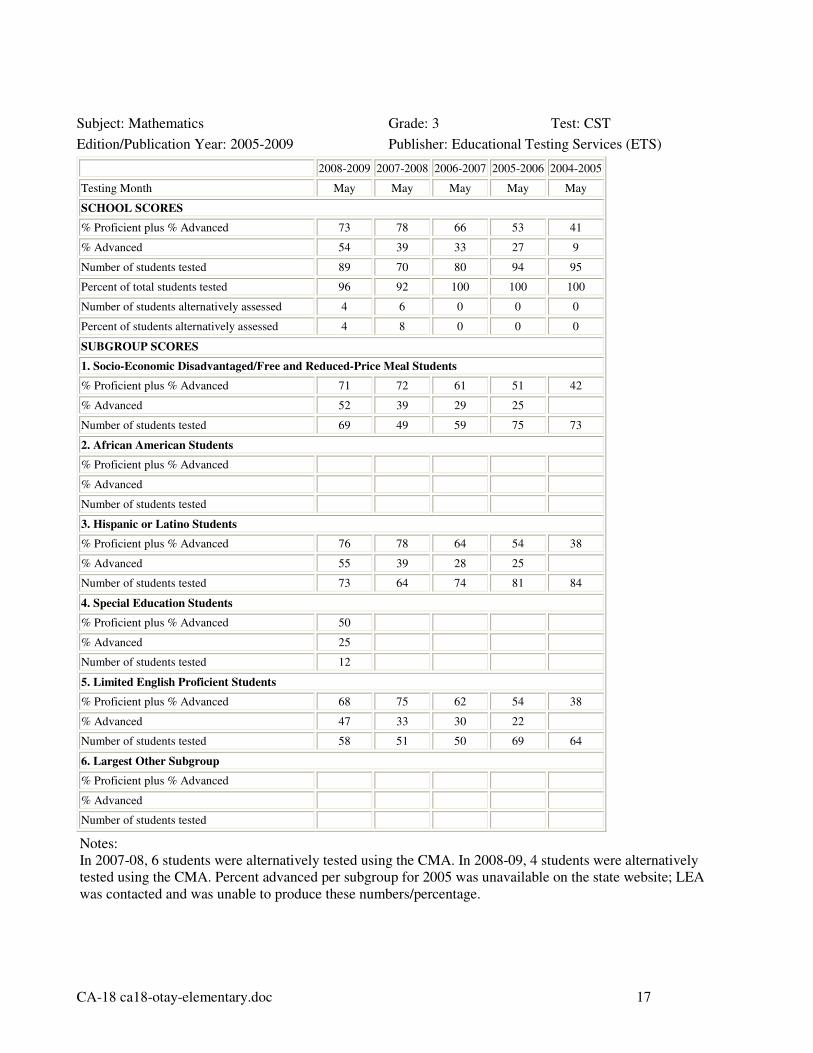
27%, 38% and 39%. Third graders who were also Socio-Economically Disadvantaged (SED) surpassed the
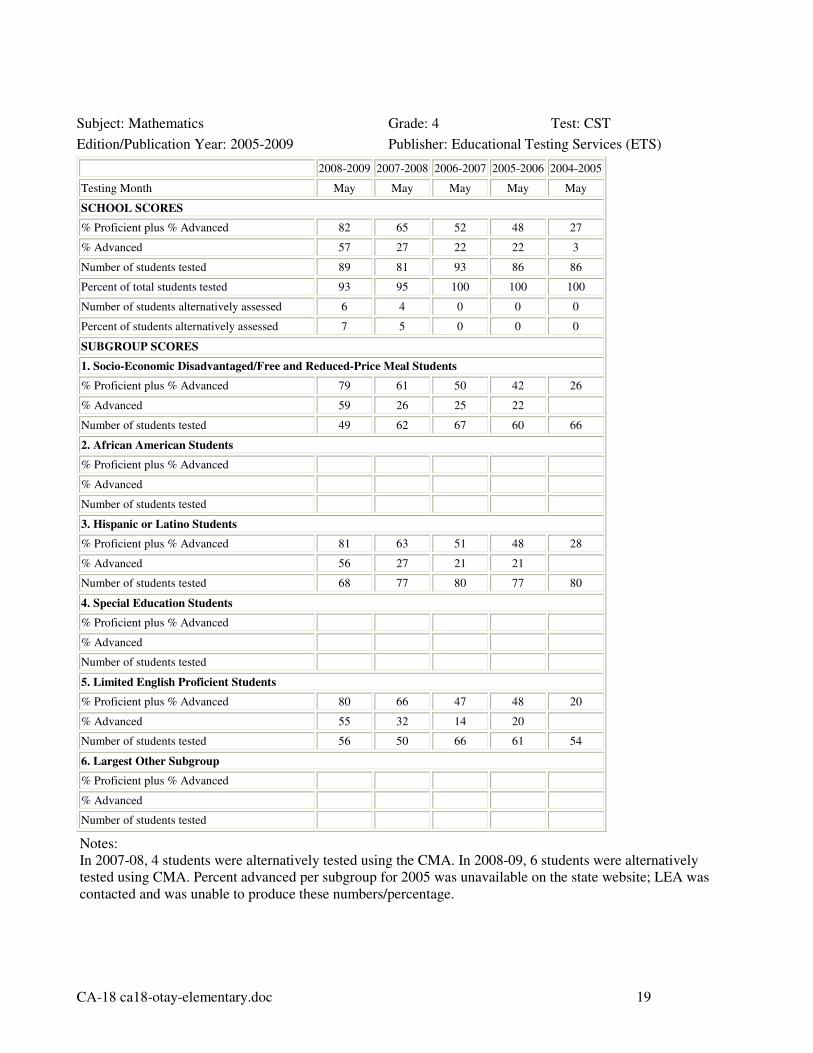
AYP target each year with 42%, 51%, 61%, 72%, and 71%. Fourth graders who were Proficient also
increased from 26% in 2005 to 82% in 2009—this represents systematic gains of more than 10% per year.
Fifth graders surpassed the AYP target for all years except 2005 where they achieved 18% Proficiency. Since
2005, Fifth graders have dramatically improved for a combined 53 percent increase to 71% in 2009. Sixth
graders also surpassed the AYP target each year. Although LEP scores dipped in 2006 to 8%, they rebounded
to 40% in 2007 and finished at 62% in 2009.
In the area of reading, Otay Elementary met the AYP target for all grades in years 2006-2009. In 2005, all
grades with the exception of 4th struggled to meet AYP goals. The struggles of the 2004-2005 school year
fueled Otay Elementary’s path to success. Desiring to exit Program Improvement (PI) status, Otay Elementary
turned a new leaf and passionately pursued results. The data tables manifest how the year 2006 marks Otay’s
transition to a high-performing school in reading (language arts). Never again did Otay fail to meet an AYP
target as a school or for a grade level. The AYP targets were the following: 24.4% for 2006, 2007; 35.2% for
2008; 46% for 2009. Otay Elementary’s AYP Proficiency scores for reading from 2006-2009 were 37%, 43%,
47% and 50%. Significant gains include sixth grade scores rising from 17% proficient in 2005 to 61% in
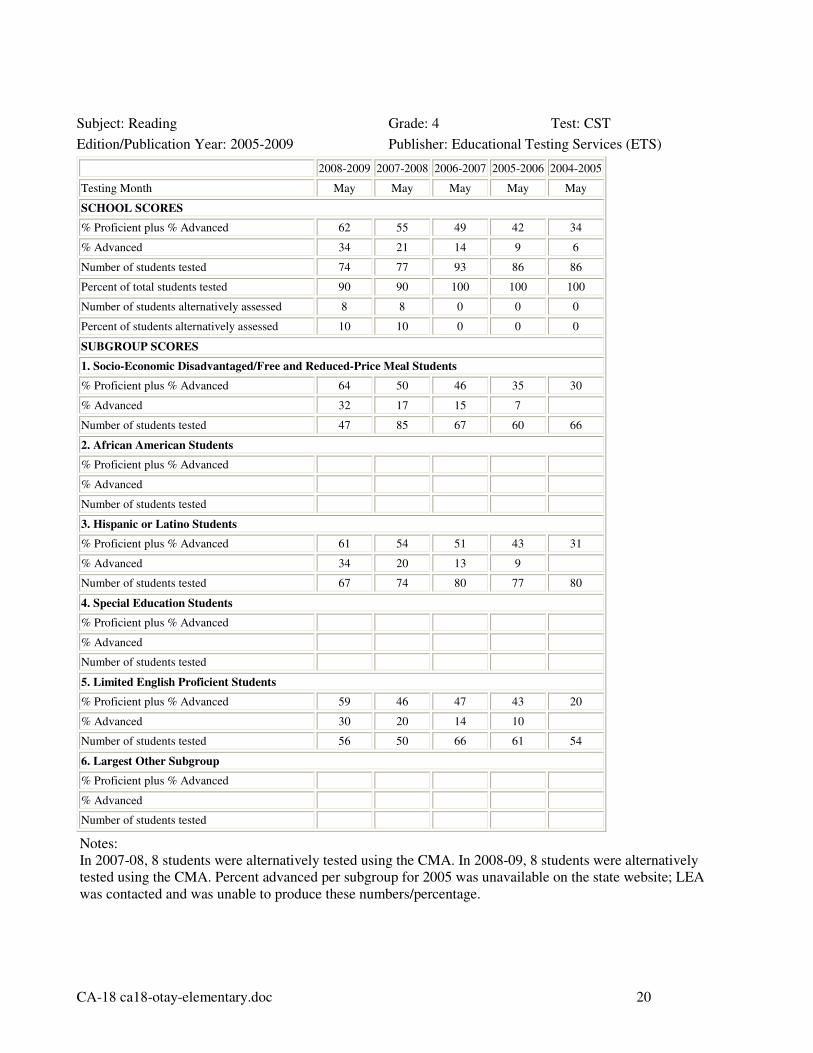
2009. For that same grade, LEP scores rose from 6% proficient in 2005 to 53% proficient in 2009. Fourth
grade SED students consistently rose in proficiency over the past 5 years: 30%, 35%, 46%, 50%, and 64%.
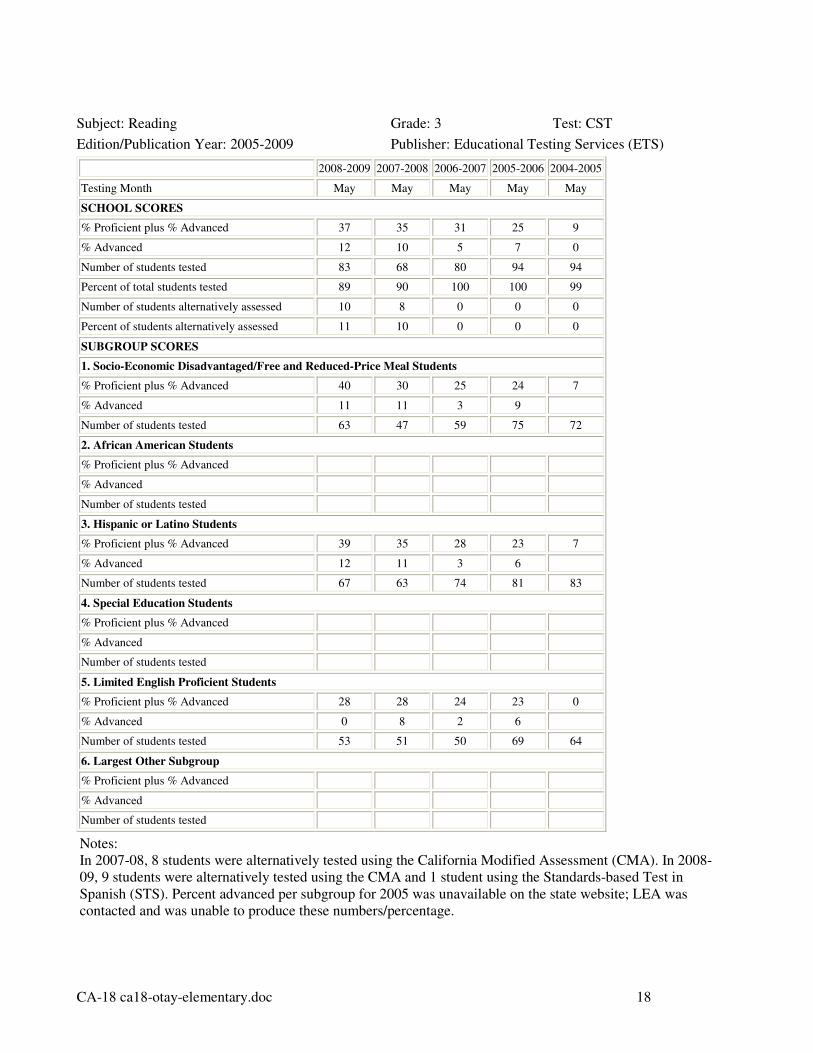
Looking at the data tables, you notice a disparity among some grade levels—especially third grade in reading.
It must be noted that this disparity can also be seen over the years when looking at statewide results for all
schools in California. (For further information on California Department of Education assessment data, please
visit http://dq.cde.ca.gov/dataquest.)
Truly, the Otay community is mindful and proud of the challenges it faced and has overcome through
perseverance and the belief that all children can and do succeed.
2. Using Assessment Results:
Otay Elementary systematically uses assessment data to differentiate instruction so that truly no child is left
behind. First, California Standards Test (CST) summative assessment data is used to paint an overall
landscape. Data is disaggregated within and across grade levels for all students and for significant subgroups
CA-18 ca18-otay-elementary.doc 9
such as Socioeconomically Disadvantaged (SED), English Learners (ELs) and Students with Disabilities. We
ask ourselves: What were our areas of strength and weakness? What best practices led to success? How can
we modify our teaching?
We also set ambitious academic goals—this year 68% Proficient/Advanced in English Language Arts
(ELA)—well above the Adequate Yearly Progress (AYP) target. Teachers subsequently use CST data to
target instruction for whole and small group settings. We use it to set individual student academic goals,
referring to specific learning strands. More importantly, Otay Elementary uses formative assessment data,
from our ELA Grade Level Assessment of Standards (GLAS) administered every six to eight weeks, to
monitor student learning, modify instruction, realign resources, and refer students to appropriate extended
learning opportunities such as before/after school programs and Saturday 350 CLUB. Teachers use OARS, an
online data and assessment system, to further analyze student achievement data. As per results, teachers
dialogue in collaboration teams about what the data is telling them. As a result, they shift students for small
group instruction during Guided Reading, Universal Access (UA), and/or intervention groups. Teachers plan
for individual students. They share the data with students; students graph their overall scores over time.
To improve teaching, the literacy coach works with individual teachers. The teacher/coach teamwork is
crucial to improving school performance. They plan around data, and follow up with lesson observations to
further dialogue about student academic improvement. Throughout the year, formative assessments in the core
areas guide teachers in closely monitoring student learning.
3. Communicating Assessment Results:
We believe in the importance of immediately communicating assessment results to parents and students; they
deserve to know. For this to occur, teachers are kept updated with the most recent disaggregated assessment
data. The school and home are one team so we want our families to feel free to ask questions, and help us
make their child’s education superior.
Mediums such as School Messenger, an automated telephone system that makes mass phone calls, personal
telephone calls, e-mail, our school website, and flyers are used to communicate with parents. Through these
means of communication parents are encouraged to attend formal and informal conferences to dialogue about
student data and understand what implications it has on their child’s academic progress.
These mediums also inform community members about events where assessment results are continually
reviewed: School Site Council (SSC) meetings, ELAC meetings, Parent forums, Curriculum Nights, and
Awards/Attendance Assemblies. As a policy making committee, SSC is continually updated on assessment
results in order to make informed decisions. During ELAC meetings, assessment results from CST, California
English Language Development Test (CELDT), Math Benchmark and GLAS are deconstructed to a level
where exact student needs, such as vocabulary, comprehension, number sense, and algebra, are pinpointed for
parents.
We want parents and students to know what to do with such knowledge. Family Literacy and Math nights
afford them the opportunity to synthesize the data with instructional strategies. Students themselves are made
aware of their formative assessment, Accelerated Reader, SuccessMaker, and Imagine Learning English
results, chart their progress, and create attainable goals.
Lastly, every fall season during our Achievement Festival, assessment results become very real for students
and families. Students receive achievement medals for meeting proficiency on the CST. Otay Elementary’s
goal is to communicate the message that all things are possible for our students.
4. Sharing Success:
Otay Elementary is proud to share its successes with others. We believe that our earned accolades such as
California Distinguished School, Title I Achievement Award, CABE Seal of Excellence, and California
Business for Education Excellence Foundation Award place us in a position of credibility and influence.
CA-18 ca18-otay-elementary.doc 10
Furthermore, we embrace the remarkable responsibility that comes with being a school that continually beats
the odds. We believe that the best practices that exist at Otay Elementary are indeed replicable, and we are
eager to prove to others that all students can learn at the highest level! We have a maxim we live by: Otay
School is “The Land of I Can!” We are enthusiastic about convincing others that “They Can”, too.
Otay Elementary has a track record for sharing its successes with others and will continue to do so upon being
awarded Blue Ribbon School status. For example, schools that we are in cohort with as a Professional
Learning Community frequently walk through our campus. Our cohort leadership teams, which include
teachers, coaches, and administrators, share insights with one another. We are able to discuss our best
practices in detail and are fully transparent and open to questions and constructive feedback. We help teachers
from our cohort of schools analyze and plan the implementation of practices that are tailored to the needs of
their particular school and students.
In addition, we have showcased our school to Governor Schwarzenegger and the former US Department of
Education Secretary Margaret Spelling. Quality Education Investment Act (QEIA) officials interested in
finding and sharing the factors that create success frequently visit Otay Elementary—few QEIA schools have
been as successful as Otay Elementary in being able to surpass the California target API of 800.
As a Blue Ribbon School, Otay’s plan is to share!
CA-18 ca18-otay-elementary.doc 11
PART V - CURRICULUM AND INSTRUCTION
1. Curriculum:
Otay Elementary possesses a rich and vibrant curriculum for English Language Arts and Mathematics.
For English Language Arts, Otay implements Houghton-Mifflin (HM) Reading. In order to ensure all
California grade level standards are fully taught, we have created a curricular Grade Level Assessment of
Standards (GLAS) scope and sequence that details where Houghton-Mifflin can be enhanced with
supplementary standards-based lessons. Teachers continue to utilize Houghton-Mifflin as the basis for
providing a balanced literacy. Teachers conduct read alouds and shared readings of grade-level text to model
specific fluency and reading strategies. Houghton-Mifflin leveled readers are used for targeted and
differentiated instruction in small groups. Teachers also supplement the narrative-based HM readers with
expository texts—Scott Foresman Science Leveled Readers and “Time for Kids” Non-Fiction Readers.
Explicit vocabulary instruction captures students’ interest during small group instruction while also building
their knowledge of academic language and content standards. Teachers infuse targeted comprehension
strategies during guided reading. UA is key to providing access to multiple and varied learning opportunities
that build upon the curriculum. English Learners gain vital language skills through the technology of Imagine
Learning English. Students gain mastery of fundamental literacy skills through SuccessMaker’s Reading
Readiness, Initial Reading, Reader’s Workshop, and Reading Adventures courses. Independent learning
stations, such as listening centers and our independent reading program, AR, provide students with
opportunities for independent practice and self-monitoring.
Otay Elementary utilizes Mc-Graw Hill Mathematics, a content standards-based series, as the core curriculum.
We customized a pacing guide that tailors instruction in a way that ties mathematical concepts and skills in an
integral way. Key concepts are sequenced to systematically build student understanding. Conceptual
understanding is highly emphasized with the use of the Lesh translation model, and time is given to develop
lessons that ground students in the fundamental ideas of mathematics. Our math curriculum also involves a
constant monitoring of student learning. Students are given assessment dipsticks every other week, and take a
formative benchmark assessment every six to eight weeks. Teachers use data from these assessments to plan
small group lessons during UA and Guided Instruction. Students independently practice their knowledge of
mathematical skills using SuccessMaker’s Math and Concept Skills course. Students engage in hands-on
exploration of math concepts, working in small groups to build and test hypotheses in areas such as
measurement and geometry, algebra and functions, and number sense.
Otay Elementary staff employs the Gradual Release of Responsibility (GRR) framework for delivering good
teaching using an established set of Quality Indicators. The premise of GRR is that the responsibility for
creating learning shifts over time from teacher to student. Thus, it is imperative for the teacher to create a
sufficient and effective model of the expected learning outcome. Teachers apply this teaching framework
across the curriculum. Teachers observe and give each other feedback on the use of the Quality Indicators of a
Focus Lesson. Within the context of the “I Do” phase of explicit instruction, the teacher is responsible for
writing and stating the lesson’s Content and Language Objectives, stating the Purpose of the lesson,
highlighting and explaining Key Vocabulary, providing Language Frames for facilitating Accountable
Student Talk around the content, modeling through the use of Meta-cognition, and Checking for Student
Understanding. We believe that this pedagogy helps Otay Elementary teachers become proficient in delivering
purposeful, intentional and explicit lessons.
2a. (Elementary Schools) Reading:
(This question is for elementary schools only)
Otay Elementary’s reading curriculum is driven by the California ELA Content Standards and the ability of
our teachers to teach them. The reading program utilized across all grades is Houghton Mifflin (HM) which is
CA-18 ca18-otay-elementary.doc 12
guided by our GLAS scope and sequence to ensure complete coverage of the content standard concepts
students need to master. Houghton Mifflin was chosen because it is comprehensive, most closely aligned to
standards, and it provides balanced literacy. This program addresses reading comprehension in Kinder thru
Sixth grade through explicit teaching of reading strategies and skills.
In all phases of reading, whole and guided, teachers use the HM strategies Monitory/Clarify, Question,
Predict, Infer, Phonics Decoding, Evaluate, and Summarize to reinforce reading comprehension. It addresses
phonics through the use of sound/spelling cards that are used K-6, systematic spelling lessons, and vocabulary
development. The grammar component is addressed through daily lessons.
There are several handbooks that are utilized to support instruction and the needs of all students, such as Extra
Support with preteaching and reteaching lessons, English Learners, Workbook Plus, Reteaching Workbook,
Classroom Management, and Challenge Handbook.
Reading instruction is differentiated through Universal Access to address the group and individual needs of
students who experience difficulty with core concepts. Leveled Readers—Below, On-Level, Challenge, and
Language Support—are utilized daily for small group reading instruction during Guided Reading to address
fluency, vocabulary and comprehension skills and strategies at the students’ instructional level. Read Aloud
and Shared Reading are embedded into each selection to model proficient reading and to allow students to
practice their reading skills.
Student progress in comprehension is evident in the various reading assessments that are administered
throughout the year. Students take assessment dipsticks every other week and every six to eight weeks
through our formative GLAS Theme Test.
3. Additional Curriculum Area:
A “Balanced Model” describes mathematics instruction at Otay Elementary. The model consists of three
components—Procedure, Concept, and Problem Solving. Mathematics lesson planning involves carefully
unpacking the standards to create explicit and purposeful objectives, and establishing a balanced treatment of
key standards. The Lesh Math Processing Mat is used at each grade level. This learning tool contains separate
fields for each of the three components, and a fourth field that invites students to consider how mathematics
concepts are applied in the real world. Teachers use the Lesh Math Processing Mat for group or individual
processing of mathematics concepts, or as an optional assessment. A series of algebra mats are also utilized at
each grade level as an important part of the mathematics curriculum to promote algebra readiness.
To support the needs of English Learners, every Focus Lesson in mathematics includes two key Quality
Indicators: (1) explicit frontloading of mathematics vocabulary, and (2) carefully constructed Language
Frames that feature the necessary academic language for the concepts being studied. “Reflection Journals” are
utilized as a tool to capture student processing of mathematics concepts, and provide teachers with a
qualitative snapshot of student progress.
While mathematics instruction is founded on the California standards, it is guided by a customized pacing
guide created by grade level teams at the beginning of the school year. Each pacing guide is composed of five
instructional blocks delineated by site benchmark assessments and district measures. The format and design of
the pacing guide document enables teachers to see the “big picture” of the school year, and allows them the
flexibility to lengthen or shorten the treatment of concepts within any instructional block. Teachers are
empowered to control their pacing based on students’ needs.
4. Instructional Methods:
Good instruction starts with a core belief in an overarching versatile instructional method. The Gradual
Release of Responsibility (GRR) model, illustrated in Doug Fisher and Nancy Frey’s Better Learning
Through Structured Teaching, establishes a framework of good teaching that is purposeful, intentional and
explicit. The GRR delivers quality differentiated instruction through four phases: The Focus Lesson, Guided
Instruction, Collaborative Group Work and Independent Practice. This year Otay Elementary agreed to
CA-18 ca18-otay-elementary.doc 13
become proficient in the delivery of the Focus Lesson. The measure of a quality Focus Lesson starts with the
identification of a content standard. The lesson first introduces the Content Objective, Language Objective,
and Language Frames which guide students toward proficiency.
Students who have not mastered the standard embodied in the Content Objective are given opportunity for
reteaching in small group instruction during Guided Reading, Universal Access, push-in-support, one-on-one,
or Building Academic Language (BAL). Guided Reading provides a format for instructional level
teaching. Universal Access time allows teachers to provide additional access to the core concepts in the form
of both homogeneous and heterogeneous groups. One-on-one opportunities are provided to students during
whole group independent work, computer lab time, and whole group assessment. Push-in certificated teachers
provide struggling students with scaffolded academic support.
BAL is based on the study of Dr. Doug Reeves’ High Performance in High Poverty Schools: 90/90/90 and
Beyond. BAL is an opportunity for teachers to spiral the teaching of expected grade level content
standards. During BAL, teachers explicitly model strategies that help students gain the academic language
needed to be successful on assessments. The aforementioned instructional methods support the diverse needs
of our ELs, SED, and Students with Disabilities by providing multiple opportunities to process and absorb
content standards. All Otay classrooms clearly depict the consistent use of these instructional strategies across
grade levels.
5. Professional Development:
Our professional development program is comprised of several layers: one-on-one coaching, grade level
collaboration, Instructional Leadership Team (ILT) planning, staff development, and teambuilding in a
Professional Learning Community. As a school-wide community, our focus was how to support student
learning through targeted professional development. Overwhelmingly, staff agreed on building professional
capacity with the Gradual Release of Responsibility framework, Guided Reading, Step-Up-To-Writing and
Universal Access. In all aspects of professional development, content standards and assessment data are what
dictate action.
Our Literacy and Math Coaches are key players in working with teachers on a one-to-one basis. They observe
lessons and provide teachers with constructive feedback that impacts and improves student achievement.
Daily, coaches facilitate three hours of collaboration with a specific grade level; this builds consistency of
practice among teachers.
The ILT targets initiatives for the whole staff. They work at a deeper level to ensure that all professional
development positively impacts student achievement by evaluating student data results. On a bi-monthly
basis, the ILT meets to evaluate the implementation of our initiatives.
The ILT also belongs to a powerful Professional Learning Community. We meet four times a year with other
cohort schools in order to exchange ideas and engage in professional discourse.
Also, school-wide staff professional development occurs during minimum school days and teacher prep
days. These workshops address the learning needs of the whole staff and allow for horizontal and vertical
dialogue. In a recent staff development meeting, each grade level reviewed Theme Test assessment data,
evaluated the curriculum’s alignment to particular content standards where students struggled, and explored
how to improve our curriculum by creating standards-aligned lesson content objectives. Then we crafted
lessons and assignments that helped students attain mastery of the standard as measured by the CST Released
Questions.
6. School Leadership:
This year, Otay Elementary was assigned a new principal. As in the past, the present leadership ensures that
all stakeholders are involved in the decision making process. Jim Collins expresses in From Good to Great,
CA-18 ca18-otay-elementary.doc 14
“Regardless of the structures of the system, one central fact stands out above all others: the pilot has ultimate
responsibility for the airplane and the lives of the people in it.” The people, Otay’s stakeholders, as in Collins’
analogy, did not panic in the brief uncertainty that came with change in leadership. The Principal simply
reassured Otay’s community and kept the course.
Otay Elementary’s shared leadership structure is key to ensuring that decisions are made in cohort with those
affected. The ILT, comprised of Literacy and Math coaches, Project Specialist, teacher representatives from
each grade level and Principal, communicate constantly to ensure that changes to educational policy are
embraced by all because their input is sought from the onset, creating a greater probability for buy-in. At a
recent ILT meeting, with four other schools in our Professional Learning Community, the ILT embarked on a
decision whose implication would affect the school’s entire teaching community. The ILT knew the school
needed to move towards student journaling where students’ thought processing could be further analyzed. It
was decided that before moving forward, input and buy-in would need to be solicited from all
teachers. Decisions that involve the input of everyone help to build relationships among colleagues and ensure
follow through.
As Otay strives to build an Accountable Community of students, teachers, administration, and parents with
the goal of continued student achievement, it is paramount that all voices are heard. As with any change,
realignment of resources are taken more in stride when the vision realized is created and accepted by all.
CA-18 ca18-otay-elementary.doc 15
PART VII - ASSESSMENT RESULTS
STATE CRITERION-REFERENCED TESTS
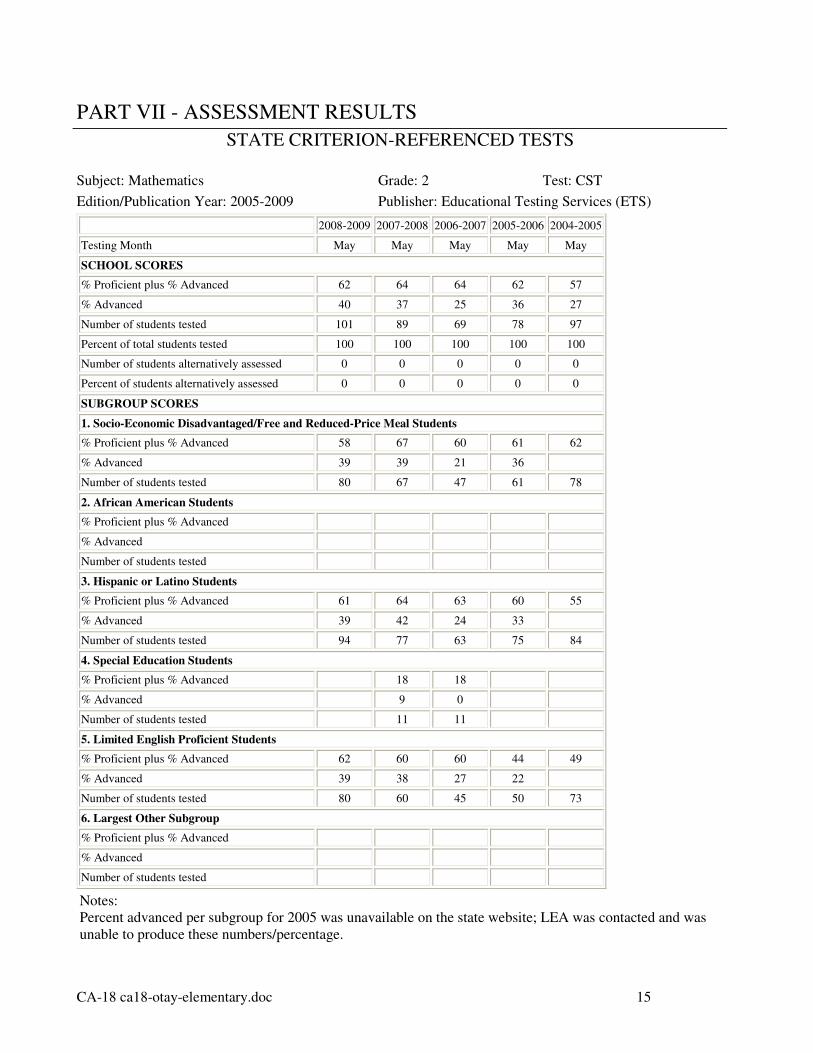
Subject: Mathematics Grade: 2 Test: CST
Edition/Publication Year: 2005-2009 Publisher: Educational Testing Services (ETS)
2008-2009 2007-2008 2006-2007 2005-2006 2004-2005
Testing Month May May May May May
SCHOOL SCORES
% Proficient plus % Advanced 62 64 64 62 57
% Advanced 40 37 25 36 27
Number of students tested 101 89 69 78 97
Percent of total students tested 100 100 100 100 100
Number of students alternatively assessed 0 0 0 0 0
Percent of students alternatively assessed 0 0 0 0 0
SUBGROUP SCORES
1. Socio-Economic Disadvantaged/Free and Reduced-Price Meal Students
% Proficient plus % Advanced 58 67 60 61 62
% Advanced 39 39 21 36
Number of students tested 80 67 47 61 78
2. African American Students
% Proficient plus % Advanced
% Advanced
Number of students tested
3. Hispanic or Latino Students
% Proficient plus % Advanced 61 64 63 60 55
% Advanced 39 42 24 33
Number of students tested 94 77 63 75 84
4. Special Education Students
% Proficient plus % Advanced
18 18
% Advanced
9 0
Number of students tested
11 11
5. Limited English Proficient Students
% Proficient plus % Advanced 62 60 60 44 49
% Advanced 39 38 27 22
Number of students tested 80 60 45 50 73
6. Largest Other Subgroup
% Proficient plus % Advanced
% Advanced
Number of students tested
Notes:
Percent advanced per subgroup for 2005 was unavailable on the state website; LEA was contacted and was
unable to produce these numbers/percentage.
CA-18 ca18-otay-elementary.doc 16
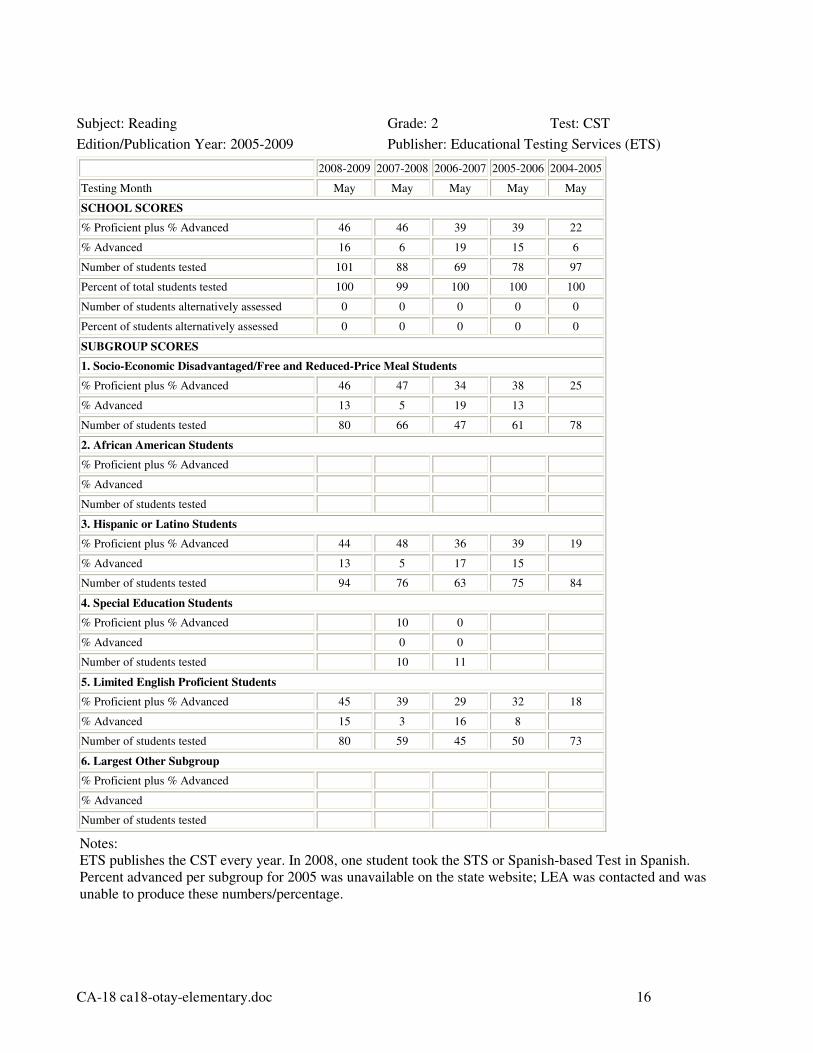
Subject: Reading Grade: 2 Test: CST
Edition/Publication Year: 2005-2009 Publisher: Educational Testing Services (ETS)
2008-2009 2007-2008 2006-2007 2005-2006 2004-2005
Testing Month May May May May May
SCHOOL SCORES
% Proficient plus % Advanced 46 46 39 39 22
% Advanced 16 6 19 15 6
Number of students tested 101 88 69 78 97
Percent of total students tested 100 99 100 100 100
Number of students alternatively assessed 0 0 0 0 0
Percent of students alternatively assessed 0 0 0 0 0
SUBGROUP SCORES
1. Socio-Economic Disadvantaged/Free and Reduced-Price Meal Students
% Proficient plus % Advanced 46 47 34 38 25
% Advanced 13 5 19 13
Number of students tested 80 66 47 61 78
2. African American Students
% Proficient plus % Advanced
% Advanced
Number of students tested
3. Hispanic or Latino Students
% Proficient plus % Advanced 44 48 36 39 19
% Advanced 13 5 17 15
Number of students tested 94 76 63 75 84
4. Special Education Students
% Proficient plus % Advanced
10 0
% Advanced
0 0
Number of students tested
10 11
5. Limited English Proficient Students
% Proficient plus % Advanced 45 39 29 32 18
% Advanced 15 3 16 8
Number of students tested 80 59 45 50 73
6. Largest Other Subgroup
% Proficient plus % Advanced
% Advanced
Number of students tested
Notes:
ETS publishes the CST every year. In 2008, one student took the STS or Spanish-based Test in Spanish.
Percent advanced per subgroup for 2005 was unavailable on the state website; LEA was contacted and was
unable to produce these numbers/percentage.
CA-18 ca18-otay-elementary.doc 17
Subject: Mathematics Grade: 3 Test: CST
Edition/Publication Year: 2005-2009 Publisher: Educational Testing Services (ETS)
2008-2009 2007-2008 2006-2007 2005-2006 2004-2005
Testing Month May May May May May
SCHOOL SCORES
% Proficient plus % Advanced 73 78 66 53 41
% Advanced 54 39 33 27 9
Number of students tested 89 70 80 94 95
Percent of total students tested 96 92 100 100 100
Number of students alternatively assessed 4 6 0 0 0
Percent of students alternatively assessed 4 8 0 0 0
SUBGROUP SCORES
1. Socio-Economic Disadvantaged/Free and Reduced-Price Meal Students
% Proficient plus % Advanced 71 72 61 51 42
% Advanced 52 39 29 25
Number of students tested 69 49 59 75 73
2. African American Students
% Proficient plus % Advanced
% Advanced
Number of students tested
3. Hispanic or Latino Students
% Proficient plus % Advanced 76 78 64 54 38
% Advanced 55 39 28 25
Number of students tested 73 64 74 81 84
4. Special Education Students
% Proficient plus % Advanced 50
% Advanced 25
Number of students tested 12
5. Limited English Proficient Students
% Proficient plus % Advanced 68 75 62 54 38
% Advanced 47 33 30 22
Number of students tested 58 51 50 69 64
6. Largest Other Subgroup
% Proficient plus % Advanced
% Advanced
Number of students tested
Notes:
In 2007-08, 6 students were alternatively tested using the CMA. In 2008-09, 4 students were alternatively
tested using the CMA. Percent advanced per subgroup for 2005 was unavailable on the state website; LEA
was contacted and was unable to produce these numbers/percentage.
CA-18 ca18-otay-elementary.doc 18
Subject: Reading Grade: 3 Test: CST
Edition/Publication Year: 2005-2009 Publisher: Educational Testing Services (ETS)
2008-2009 2007-2008 2006-2007 2005-2006 2004-2005
Testing Month May May May May May
SCHOOL SCORES
% Proficient plus % Advanced 37 35 31 25 9
% Advanced 12 10 5 7 0
Number of students tested 83 68 80 94 94
Percent of total students tested 89 90 100 100 99
Number of students alternatively assessed 10 8 0 0 0
Percent of students alternatively assessed 11 10 0 0 0
SUBGROUP SCORES
1. Socio-Economic Disadvantaged/Free and Reduced-Price Meal Students
% Proficient plus % Advanced 40 30 25 24 7
% Advanced 11 11 3 9
Number of students tested 63 47 59 75 72
2. African American Students
% Proficient plus % Advanced
% Advanced
Number of students tested
3. Hispanic or Latino Students
% Proficient plus % Advanced 39 35 28 23 7
% Advanced 12 11 3 6
Number of students tested 67 63 74 81 83
4. Special Education Students
% Proficient plus % Advanced
% Advanced
Number of students tested
5. Limited English Proficient Students
% Proficient plus % Advanced 28 28 24 23 0
% Advanced 0 8 2 6
Number of students tested 53 51 50 69 64
6. Largest Other Subgroup
% Proficient plus % Advanced
% Advanced
Number of students tested
Notes:
In 2007-08, 8 students were alternatively tested using the California Modified Assessment (CMA). In 2008-
09, 9 students were alternatively tested using the CMA and 1 student using the Standards-based Test in
Spanish (STS). Percent advanced per subgroup for 2005 was unavailable on the state website; LEA was
contacted and was unable to produce these numbers/percentage.
CA-18 ca18-otay-elementary.doc 19
Subject: Mathematics Grade: 4 Test: CST
Edition/Publication Year: 2005-2009 Publisher: Educational Testing Services (ETS)
2008-2009 2007-2008 2006-2007 2005-2006 2004-2005
Testing Month May May May May May
SCHOOL SCORES
% Proficient plus % Advanced 82 65 52 48 27
% Advanced 57 27 22 22 3
Number of students tested 89 81 93 86 86
Percent of total students tested 93 95 100 100 100
Number of students alternatively assessed 6 4 0 0 0
Percent of students alternatively assessed 7 5 0 0 0
SUBGROUP SCORES
1. Socio-Economic Disadvantaged/Free and Reduced-Price Meal Students
% Proficient plus % Advanced 79 61 50 42 26
% Advanced 59 26 25 22
Number of students tested 49 62 67 60 66
2. African American Students
% Proficient plus % Advanced
% Advanced
Number of students tested
3. Hispanic or Latino Students
% Proficient plus % Advanced 81 63 51 48 28
% Advanced 56 27 21 21
Number of students tested 68 77 80 77 80
4. Special Education Students
% Proficient plus % Advanced
% Advanced
Number of students tested
5. Limited English Proficient Students
% Proficient plus % Advanced 80 66 47 48 20
% Advanced 55 32 14 20
Number of students tested 56 50 66 61 54
6. Largest Other Subgroup
% Proficient plus % Advanced
% Advanced
Number of students tested
Notes:
In 2007-08, 4 students were alternatively tested using the CMA. In 2008-09, 6 students were alternatively
tested using CMA. Percent advanced per subgroup for 2005 was unavailable on the state website; LEA was
contacted and was unable to produce these numbers/percentage.
CA-18 ca18-otay-elementary.doc 20
Subject: Reading Grade: 4 Test: CST
Edition/Publication Year: 2005-2009 Publisher: Educational Testing Services (ETS)
2008-2009 2007-2008 2006-2007 2005-2006 2004-2005
Testing Month May May May May May
SCHOOL SCORES
% Proficient plus % Advanced 62 55 49 42 34
% Advanced 34 21 14 9 6
Number of students tested 74 77 93 86 86
Percent of total students tested 90 90 100 100 100
Number of students alternatively assessed 8 8 0 0 0
Percent of students alternatively assessed 10 10 0 0 0
SUBGROUP SCORES
1. Socio-Economic Disadvantaged/Free and Reduced-Price Meal Students
% Proficient plus % Advanced 64 50 46 35 30
% Advanced 32 17 15 7
Number of students tested 47 85 67 60 66
2. African American Students
% Proficient plus % Advanced
% Advanced
Number of students tested
3. Hispanic or Latino Students
% Proficient plus % Advanced 61 54 51 43 31
% Advanced 34 20 13 9
Number of students tested 67 74 80 77 80
4. Special Education Students
% Proficient plus % Advanced
% Advanced
Number of students tested
5. Limited English Proficient Students
% Proficient plus % Advanced 59 46 47 43 20
% Advanced 30 20 14 10
Number of students tested 56 50 66 61 54
6. Largest Other Subgroup
% Proficient plus % Advanced
% Advanced
Number of students tested
Notes:
In 2007-08, 8 students were alternatively tested using the CMA. In 2008-09, 8 students were alternatively
tested using the CMA. Percent advanced per subgroup for 2005 was unavailable on the state website; LEA
was contacted and was unable to produce these numbers/percentage.

CA-18 ca18-otay-elementary.doc 21
Subject: Mathematics Grade: 5 Test: CST
Edition/Publication Year: 2005-2009 Publisher: Educational Testing Services (ETS)
2008-2009 2007-2008 2006-2007 2005-2006 2004-2005
Testing Month May May May May May
SCHOOL SCORES
% Proficient plus % Advanced 71 55 56 52 18
% Advanced 28 20 15 22 4
Number of students tested 86 84 92 87 90
Percent of total students tested 93 91 100 100 100
Number of students alternatively assessed 6 8 0 0 0
Percent of students alternatively assessed 7 9 0 0 0
SUBGROUP SCORES
1. Socio-Economic Disadvantaged/Free and Reduced-Price Meal Students
% Proficient plus % Advanced 76 50 56 48 20
% Advanced 26 21 18 13
Number of students tested 58 63 60 62 74
2. African American Students
% Proficient plus % Advanced
% Advanced
Number of students tested
3. Hispanic or Latino Students
% Proficient plus % Advanced 72 54 57 49 15
% Advanced 28 13 14 22
Number of students tested 79 77 83 77 74
4. Special Education Students
% Proficient plus % Advanced
% Advanced
Number of students tested
5. Limited English Proficient Students
% Proficient plus % Advanced 74 52 54 46 6
% Advanced 33 17 13 16
Number of students tested 54 63 69 50 48
6. Largest Other Subgroup
% Proficient plus % Advanced
% Advanced
Number of students tested
Notes:
In 2007-08, 8 students were alternatively tested using CMA. In 2008-09, 6 students were alternatively tested
using CMA. Percent advanced per subgroup for 2005 was unavailable on the state website; LEA was
contacted and was unable to produce these numbers/percentage.
CA-18 ca18-otay-elementary.doc 22
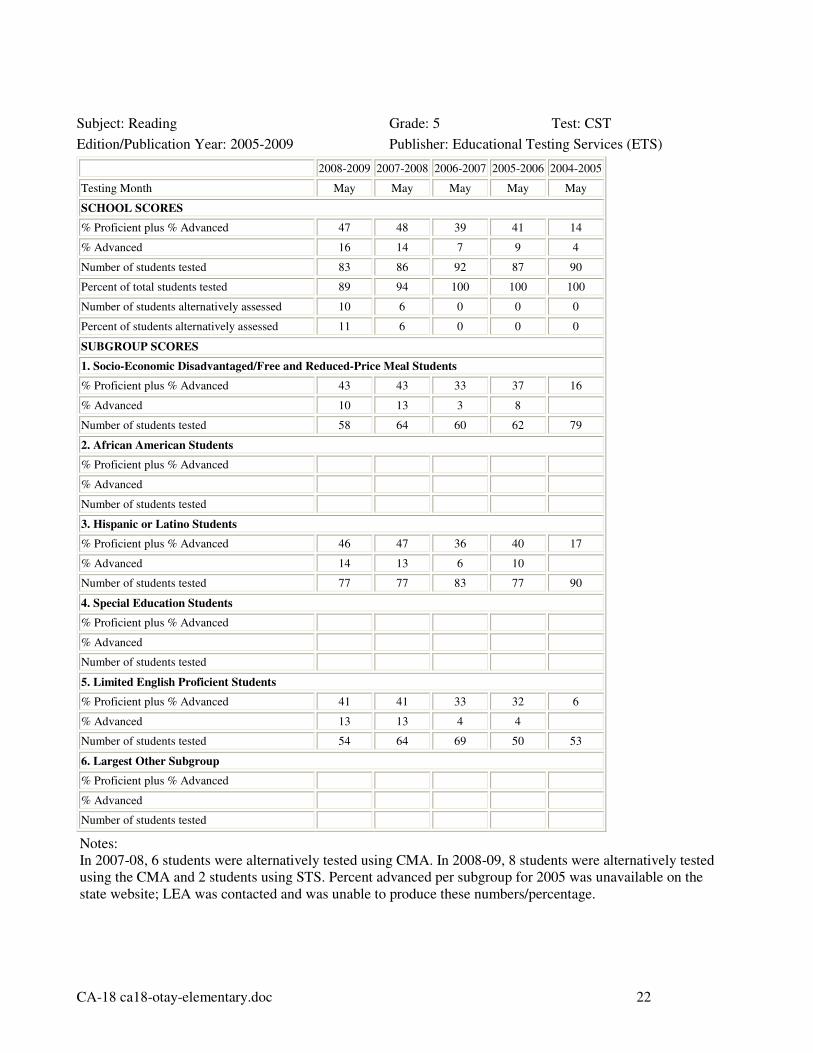
Subject: Reading Grade: 5 Test: CST
Edition/Publication Year: 2005-2009 Publisher: Educational Testing Services (ETS)
2008-2009 2007-2008 2006-2007 2005-2006 2004-2005
Testing Month May May May May May
SCHOOL SCORES
% Proficient plus % Advanced 47 48 39 41 14
% Advanced 16 14 7 9 4
Number of students tested 83 86 92 87 90
Percent of total students tested 89 94 100 100 100
Number of students alternatively assessed 10 6 0 0 0
Percent of students alternatively assessed 11 6 0 0 0
SUBGROUP SCORES
1. Socio-Economic Disadvantaged/Free and Reduced-Price Meal Students
% Proficient plus % Advanced 43 43 33 37 16
% Advanced 10 13 3 8
Number of students tested 58 64 60 62 79
2. African American Students
% Proficient plus % Advanced
% Advanced
Number of students tested
3. Hispanic or Latino Students
% Proficient plus % Advanced 46 47 36 40 17
% Advanced 14 13 6 10
Number of students tested 77 77 83 77 90
4. Special Education Students
% Proficient plus % Advanced
% Advanced
Number of students tested
5. Limited English Proficient Students
% Proficient plus % Advanced 41 41 33 32 6
% Advanced 13 13 4 4
Number of students tested 54 64 69 50 53
6. Largest Other Subgroup
% Proficient plus % Advanced
% Advanced
Number of students tested
Notes:
In 2007-08, 6 students were alternatively tested using CMA. In 2008-09, 8 students were alternatively tested
using the CMA and 2 students using STS. Percent advanced per subgroup for 2005 was unavailable on the
state website; LEA was contacted and was unable to produce these numbers/percentage.

CA-18 ca18-otay-elementary.doc 23
Subject: Mathematics Grade: 6 Test: CST
Edition/Publication Year: 2005-2009 Publisher: Educational Testing Services (ETS)
2008-2009 2007-2008 2006-2007 2005-2006 2004-2005
Testing Month May May May May May
SCHOOL SCORES
% Proficient plus % Advanced 65 56 51 29 32
% Advanced 36 17 15 3 4
Number of students tested 86 93 94 90 98
Percent of total students tested 88 100 100 100 100
Number of students alternatively assessed 12 0 0 0 0
Percent of students alternatively assessed 12 0 0 0 0
SUBGROUP SCORES
1. Socio-Economic Disadvantaged/Free and Reduced-Price Meal Students
% Proficient plus % Advanced 62 41 43 29 29
% Advanced 30 6 14 4
Number of students tested 66 68 69 72 79
2. African American Students
% Proficient plus % Advanced
% Advanced
Number of students tested
3. Hispanic or Latino Students
% Proficient plus % Advanced 64 46 47 26 31
% Advanced 35 11 15 1
Number of students tested 80 88 81 74 90
4. Special Education Students
% Proficient plus % Advanced
% Advanced
Number of students tested
5. Limited English Proficient Students
% Proficient plus % Advanced 62 44 40 8 21
% Advanced 33 13 9 0
Number of students tested 66 72 55 49 98
6. Largest Other Subgroup
% Proficient plus % Advanced
50
% Advanced
20
Number of students tested
10
Notes:
In 2008-09, 12 students were alternatively tested using CMA. Percent advanced per subgroup for 2005 was
unavailable on the state website; LEA was contacted and was unable to produce these numbers/percentage.

CA-18 ca18-otay-elementary.doc 24
Subject: Reading Grade: 6 Test: CST
Edition/Publication Year: 2005-2009 Publisher: Educational Testing Services (ETS)
2008-2009 2007-2008 2006-2007 2005-2006 2004-2005
Testing Month May May May May May
SCHOOL SCORES
% Proficient plus % Advanced 61 46 49 25 17
% Advanced 27 12 14 9 5
Number of students tested 90 93 94 90 98
Percent of total students tested 92 100 100 100 100
Number of students alternatively assessed 8 0 0 0 0
Percent of students alternatively assessed 8 0 0 0 0
SUBGROUP SCORES
1. Socio-Economic Disadvantaged/Free and Reduced-Price Meal Students
% Proficient plus % Advanced 56 41 47 23 16
% Advanced 24 6 12 8
Number of students tested 68 68 69 72 79
2. African American Students
% Proficient plus % Advanced
% Advanced
Number of students tested
3. Hispanic or Latino Students
% Proficient plus % Advanced 58 46 47 23 31
% Advanced 24 11 12 8
Number of students tested 82 88 81 74 90
4. Special Education Students
% Proficient plus % Advanced
% Advanced
Number of students tested
5. Limited English Proficient Students
% Proficient plus % Advanced 53 44 38 2 6
% Advanced 25 13 13 0
Number of students tested 68 72 55 49 53
6. Largest Other Subgroup
% Proficient plus % Advanced
40
% Advanced
20
Number of students tested
10
Notes:
In 2008-09, 8 students were alternatively tested using the CMA. Largest other subgroup for 2005-06 is white
(not of Hispanic origin). Percent advanced per subgroup for 2005 was unavailable on the state website; LEA
was contacted and was unable to produce these numbers/percentage.

![INDEX [ ] · PDF filemodel/application sakura no hino j08e-t, 2010 (trucks) blue ribbon oil filter combination ..... c-1316 j08e-t, 2012 (trucks) blue ribbon](https://static.fdocuments.net/doc/165x107/5aac6f487f8b9a2e088cf780/index-sakura-no-hino-j08e-t-2010-trucks-blue-ribbon-oil-filter-combination.jpg)

![2010 - Blue Ribbon Schools Program - Home | U.S ... · Web view2010 - Blue Ribbon Schools Program Type of School: (Check all that apply) [] Charter [] Title I [] Magnet [] Choice](https://static.fdocuments.net/doc/165x107/5b3aa8267f8b9a0e628be290/2010-blue-ribbon-schools-program-home-us-web-view2010-blue-ribbon.jpg)


![2010 - Blue Ribbon Schools Program - US … · Web viewU.S. Department of Education 2010 - Blue Ribbon Schools Program Type of School: (Check all that apply) [] Charter [X] Title](https://static.fdocuments.net/doc/165x107/5b870c817f8b9aa0218beb87/2010-blue-ribbon-schools-program-us-web-viewus-department-of-education.jpg)