urban slum mapping in Bangladesh
51
Urban Slum Mapping in Bangladesh Center for Environmental and Geographic Information Services Dhaka, Bangladesh Iffat Huque Head, Remote Sensing Division
Transcript of urban slum mapping in Bangladesh

Urban Slum Mapping in
Bangladesh
Center for Environmental and Geographic Information Services
Dhaka, Bangladesh
Iffat HuqueHead, Remote Sensing Division
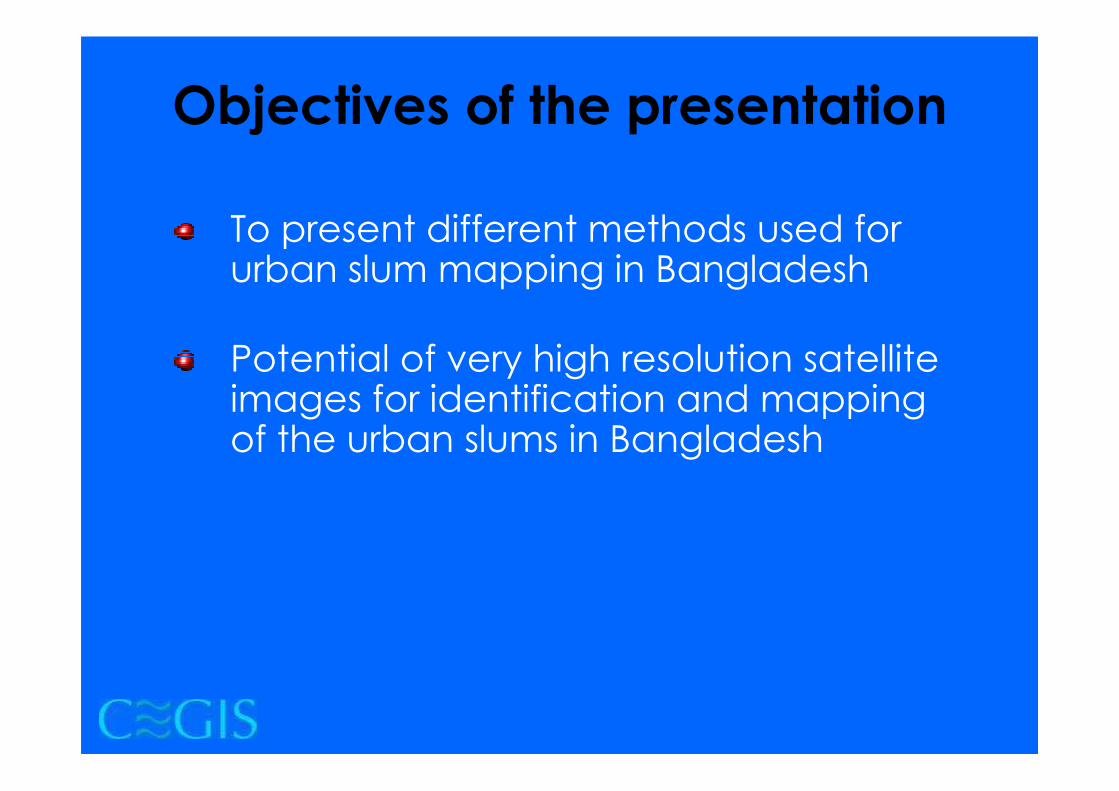
Objectives of the presentation
To present different methods used for urban slum mapping in Bangladesh
Potential of very high resolution satellite images for identification and mapping of the urban slums in Bangladesh

Urban Population – Bangladesh
Total population 140 million
Total urban population 34 million (24 % of
Total)
Total number of urban households 3.9 million
Urban population growing 3.5% annually
Projected urban population in 2015 is 50
million
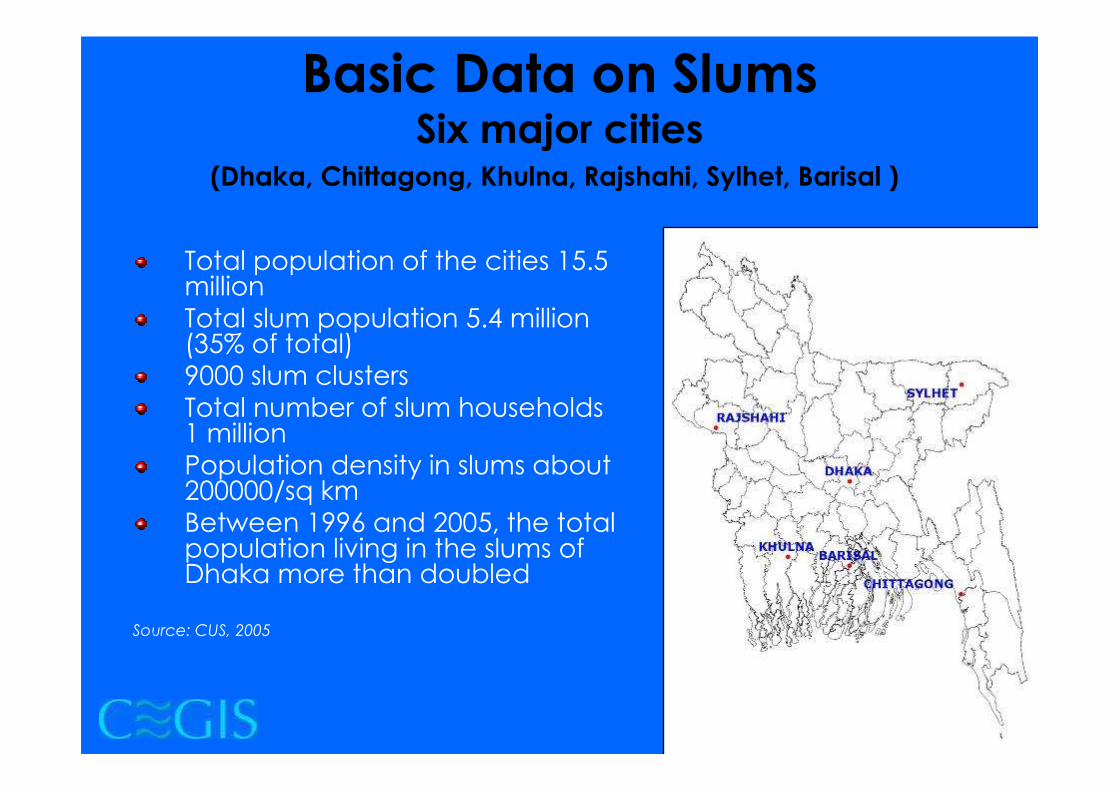
Basic Data on SlumsSix major cities
Total population of the cities 15.5 million
Total slum population 5.4 million (35% of total)
9000 slum clusters
Total number of slum households 1 million
Population density in slums about 200000/sq km
Between 1996 and 2005, the total population living in the slums of Dhaka more than doubled
Source: CUS, 2005
(Dhaka, Chittagong, Khulna, Rajshahi, Sylhet, Barisal )

Slum mapping/census
initiatives in Bangladesh
Bangladesh Bureau of Statistics (BBS)-
Census of Slums in Bangladesh 1985 and 1986
Census of Slum Areas and Floating Population 1997
Studies by Center for Urban Studies (CUS) – 1987, 1996 and 2005
Local Government Engineering Department
(LGED) – Spatial Poverty Mapping of Dhaka Metropolitan Area, 2005

BBS - Census of Slum Areas
1997Definition:A slum is a cluster of compact settlements of 5 or more households which generally grow very unsystematically and haphazardly in an unhealthy condition and atmosphere on government and private vacant land. Slums also exist in the owner based household premises
Criteria:Predominantly very poor housingVery high housing densityHousing materials are very cheap and low qualityPoor sewerage and drainage or even absence of such facilities
Inadequate, unhealthy drinking water supplyInsufficient or absence of street lightingLittle or no paved streetsInhabited by poor, uneducated and below poverty level people

BBS - Brief Methodology
Areas covered Dhaka Megacity, 3 other major cities, 14
smaller Cities and 100 paurashavas (municipalities)
Prepare maps and list of slum areas by quick count method
Large slums were divided into enumeration areas (EAs) each
compromising of about 200 households
Smaller slums were merged to form an EA of same size within
the same ward/municipality
Five percent sample HH were surveyed from each EA to
collect detailed data
For quality check
Post Enumeration Quality Check Survey
Special Evaluation Survey

BBS Census of
Slum Areas
1997
• Total Number of Slums
identified -2,991
• Collected Information• Slum areas
• Housing structure and
Characteristics
• Household size and
composition
• Household facilities (source of
light, sanitary facilities, drinking
water)
• Population size, distribution
and growth
• Employment and occupation

CUS - Mapping and Census, Slums
of Urban Bangladesh 2005
Mapping and census of 6 major cities was carried out as a basis for the 2006 Urban Health
Survey(UHS)
Carried out by Centre for Urban Studies for
National Institute of Population Research and
Training (NIPORT) and
MEASURE Evaluation of University of North
Carolina
Funded by USAID Bangladesh

Objectives Prepare maps to identify location and boundaries of all slums
Record the characteristics of slums and squatter settlements
Identify the slums and squatter settlements in terms of their physical, socio-economic and
environmental characteristics
Determine their overall legal status
Prepare a database
CUS Study

Predominantly very poor housing
Very high population density and room crowding
Very poor environmental services, especially water and
sanitation
Very low socio-economic status
Lack of security of tenure
Definition: Slums are defined as settlements with a
Minimum of 10 householdsAND
An urban community has to meet at least 4 of the above
criteria to qualify as a “slum”
CUS Study
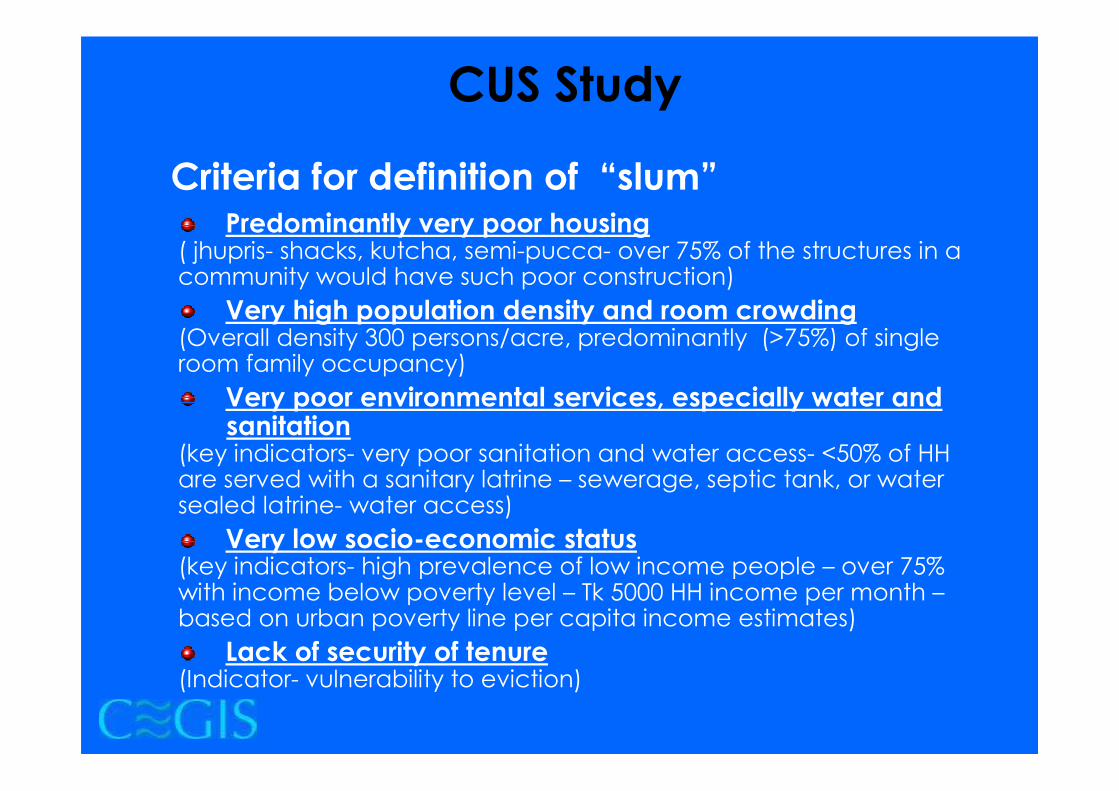
Predominantly very poor housing( jhupris- shacks, kutcha, semi-pucca- over 75% of the structures in a community would have such poor construction)
Very high population density and room crowding(Overall density 300 persons/acre, predominantly (>75%) of single room family occupancy)
Very poor environmental services, especially water and sanitation
(key indicators- very poor sanitation and water access- <50% of HH are served with a sanitary latrine – sewerage, septic tank, or water sealed latrine- water access)
Very low socio-economic status(key indicators- high prevalence of low income people – over 75% with income below poverty level – Tk 5000 HH income per month –based on urban poverty line per capita income estimates)
Lack of security of tenure(Indicator- vulnerability to eviction)
Criteria for definition of “slum”
CUS Study

CUS Study
Base Map Preparationcollection of SOB and City Corporation maps
update road networks and major urban features from satellite images
final base map preparation
Preliminary identification of slumsidentification of slums from satellite images using visual interpretation
incorporating the identified slums in the base map
Ground truthingslums identified from images were verified on the ground
slums that are not readily apparent from the satellite images were also identified from ground truthing survey
Survey of Slum Clusters (key informant)slum size (physical area, number of households and population)
environmental and socio-economic conditions
Final slum map preparation and data processingdigitization of identified slums using GIS software
if any confusion during digitization revisit of the site was done
database preparation (data collected through slum survey)
Brief Methodology

CUS Study
GIS slum maps of six study cities
list of slums with addresses, number of households and
total population
Slum Censusnumber of slum clusters, slum size by households, slum population
area of land covered by slums, density of population in slums
housing conditions and floor space in slums
slum land ownership pattern
Environmental and Infrastructural FeaturesSources of drinking water and access to latrines
Drainage situation in slums, garbage disposal in slums
Occupational pattern and Income patterns
Tenure Insecurity
Results

CEGIS- Slum mapping from high
resolution satellite images
Objectives:Test methods of interpreting slums from high resolution satellite images
Study the potential of these image for slum mapping in Dhaka
Make recommendations on data and methodologies

Data Used
Satellite Images
IKONOS 1 m Pan, 2002
IKONOS 4 m Multispectral 2002
QuickBird 60 cm Pan 2004
QuickBird 2.4 m multispectral 2004
QuickBird 60 cm Pan-sharpened 2006
Slum GIS Data from CUS, 2005
Ground Truth Data

Methodology
Reconnaissance survey of physical
characteristics of slums which can help identify
them in images
Test various pixel based classification
Texture analysis
Visual interpretation - on screen digitization
Pattern, Shape, Size, Density, Color and association
Ground truthing
Comparison with slum data of CUS
Comparison with ground truth data

Some views….

• Very little or no vegetation
• Similar orientation of structures
• Contiguous large area
• Irregular street patterns
• With more vegetation
• Haphazard orientation of structures
• Contiguous large area
Types of Slums in Dhaka City
As seen in QuickBird Pan-sharpened image, 2006
• Corrugated iron roofs
• Width: 3m, Length: 5m -12m

• Housing structure –Jhuprior shacks-having roof top made of bamboo, sun grass, gunny bags and polythene sheets
• Size approximately 2m by 3m
• Plain/corrugated iron roofs
• Size approximately 10m by 7m
• Inside planned residential plots with regular street patterns
• Scattered concrete building (Not slum dwellings)

• Corrugated iron roof
• Width 3m by 5m
• Lined in long straight lines without any space between houses
• Contiguous large area
• Corrugated iron roof
• Mixed sizes
• In plots in un-planned residential areas (irregular street pattern)
• Scattered concrete building (Not slum dwellings)

• Plain/Corrugated iron roofs
• Various different sizes
• Mixed – small industries and slums
• Plain/Corrugated iron roofs
• Small sized structures
• Contiguous large area

• Corrugated iron roof
• Size 4m by 8m
• Looks like slum but actually market place
• Distance between structures are more than that of slums and more regular

• Mostly jhupri - shacks
• Roof top - bamboo, sun grass, gunny bags; most of the times covered by polythene sheets
• On roadside or railway track
• Mixture of corrugated iron roof and jhupri
• On roadside or railway track
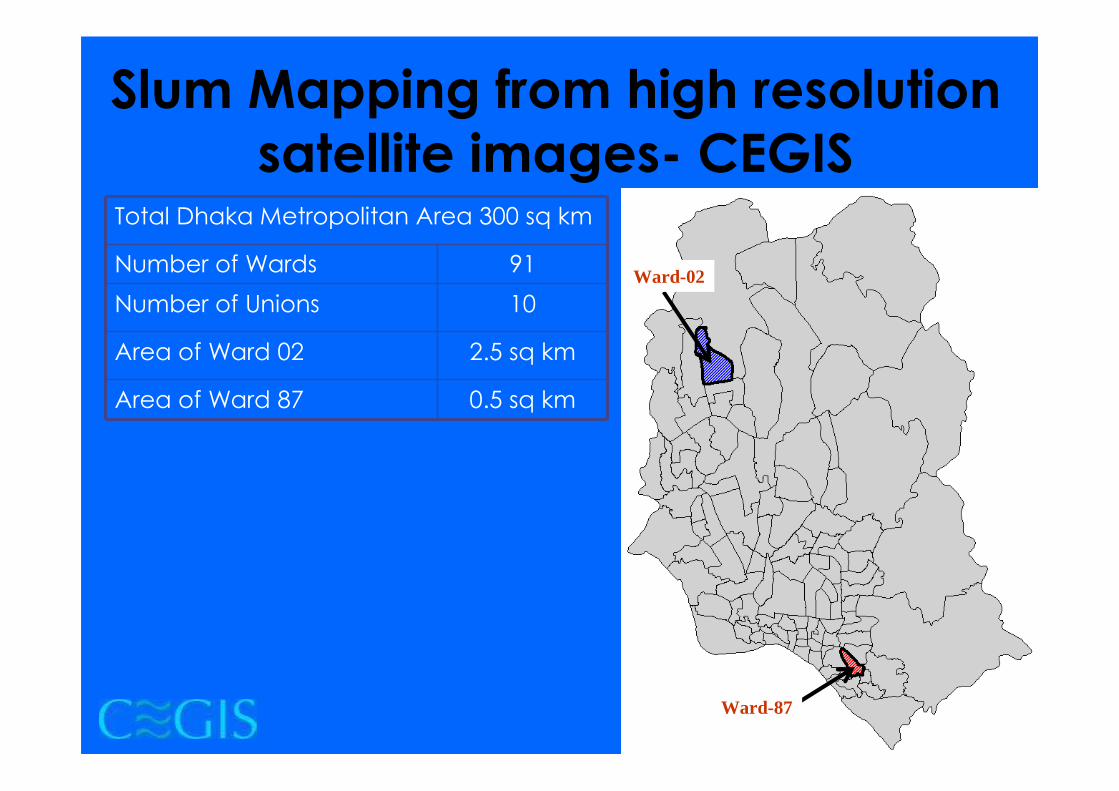
Slum Mapping from high resolution
satellite images- CEGISTotal Dhaka Metropolitan Area 300 sq km
Number of Wards 91
Number of Unions 10
Area of Ward 02 2.5 sq km
Area of Ward 87 0.5 sq km
Ward-02
Ward-87

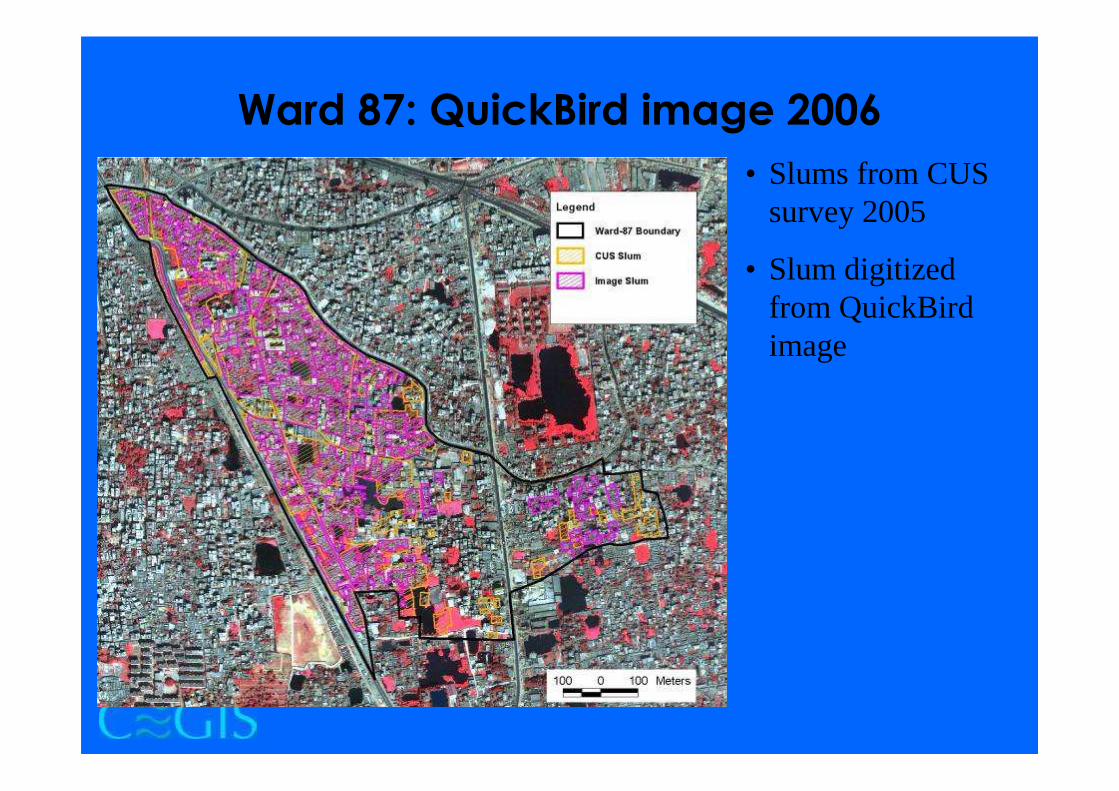
• Slums from CUS survey 2005
• Slum digitized from QuickBird image
Ward 2: QuickBird
image 2006

Area
(Acre)
% of
total
Ward-2 674 100
CUS
Slum120 18
Image Slum
140 21
Ward 2: QuickBird
image 2006
• Slums from CUS survey 2005
• Slum digitized from QuickBirdimage
Ward 87: QuickBird image 2006
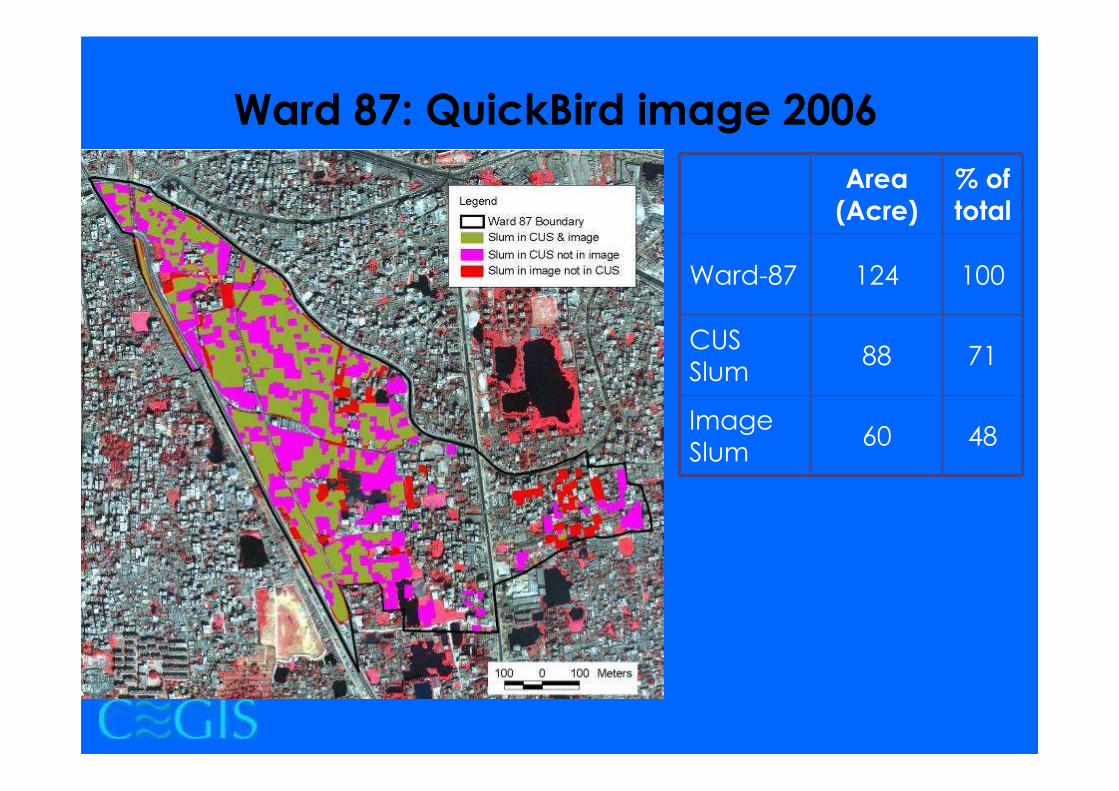
Area
(Acre)
% of
total
Ward-87 124 100
CUS
Slum88 71
Image
Slum60 48
Ward 87: QuickBird image 2006
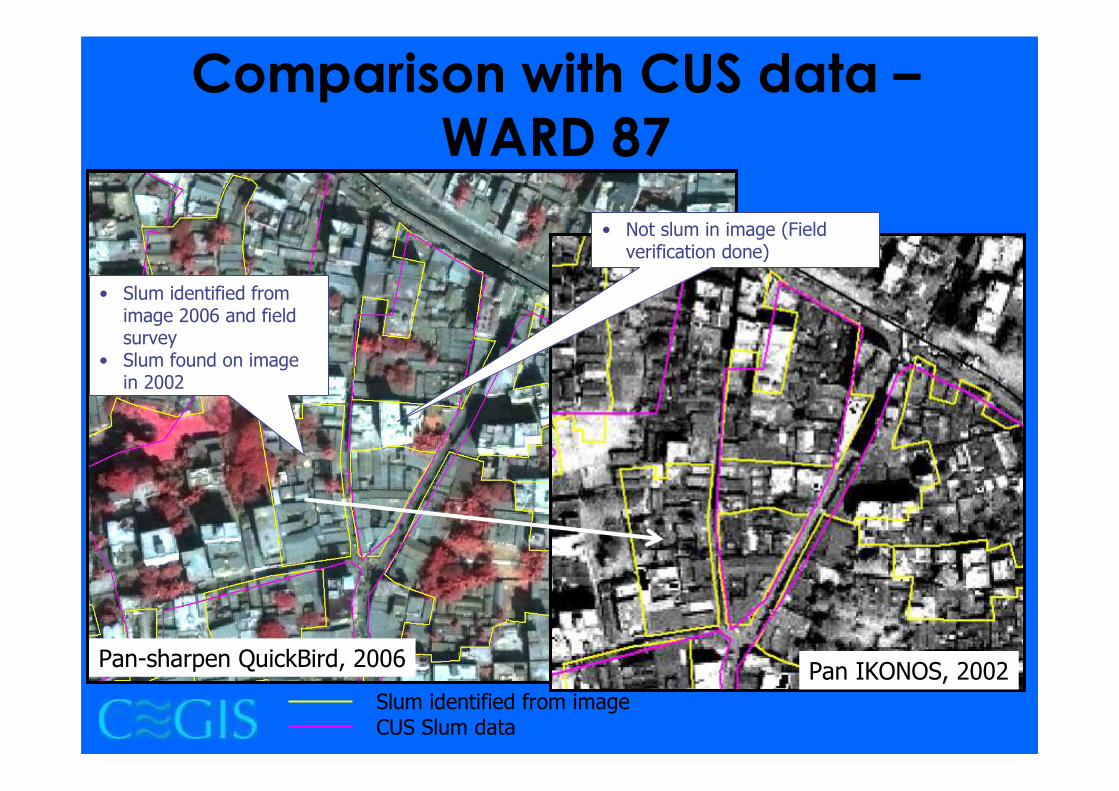
Pan-sharpen QuickBird, 2006
Comparison with CUS data –
WARD 87
Pan IKONOS, 2002
Slum identified from imageCUS Slum data
• Slum identified from image 2006 and field survey
• Slum found on image in 2002
• Not slum in image (Field verification done)

Pan-sharpen QuickBird, 2006
Comparison with CUS data –
WARD 87
Slum identified from imageCUS Slum data
• Cluster of corrugated iron roof structures
• Average size 12 m X 15 m• Factory
• Corrugated roof structures on the road side
• Shops

Comparison with CUS data –
WARD 87
Slum identified from image CUS Slum data
• Cluster of corrugated roof structures
• Average size 12 m X 15 m• Factory
• Not slum in image (Field verification done)

Multispectral IKONOS (4 m), 2002
Texture Analysis – Ward 2
Ward 2 Boundary
Slum Areas
Texture Analysis (Mean Euclidean Distance 15 X 15 window) on Multispectral IKONOS (4 m), 2002
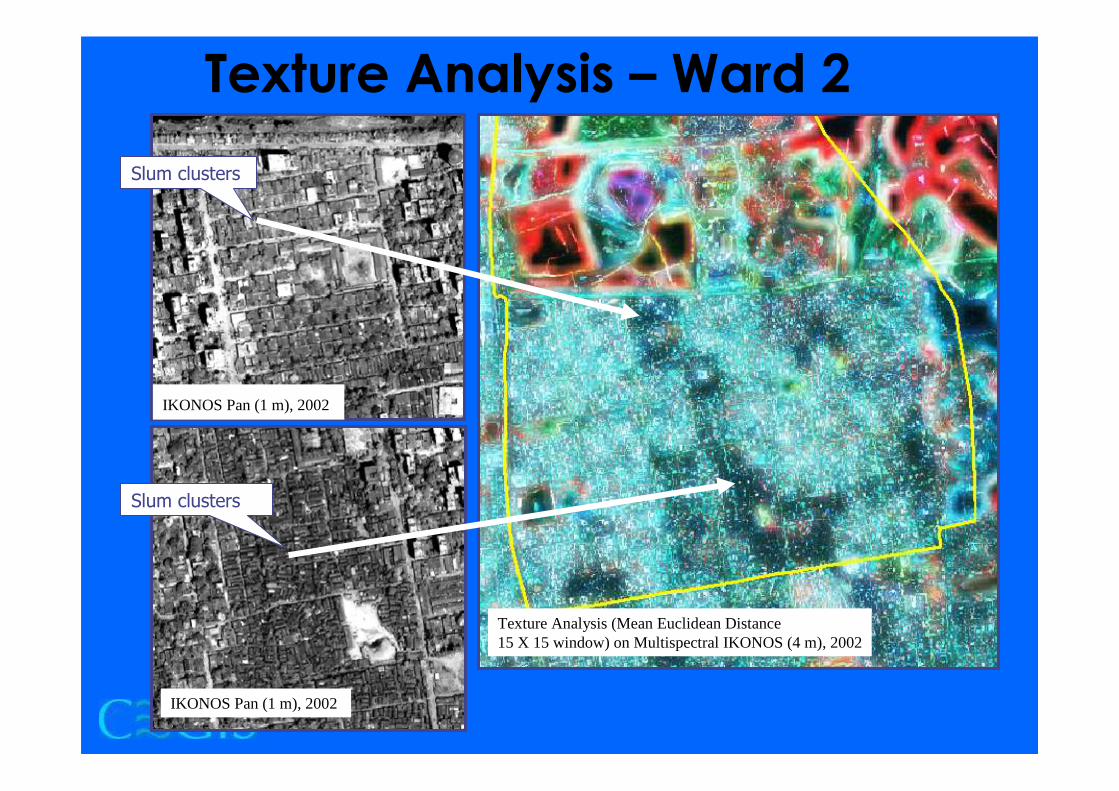
Texture Analysis – Ward 2
Slum clusters
Slum clusters
IKONOS Pan (1 m), 2002
IKONOS Pan (1 m), 2002
Texture Analysis (Mean Euclidean Distance 15 X 15 window) on Multispectral IKONOS (4 m), 2002
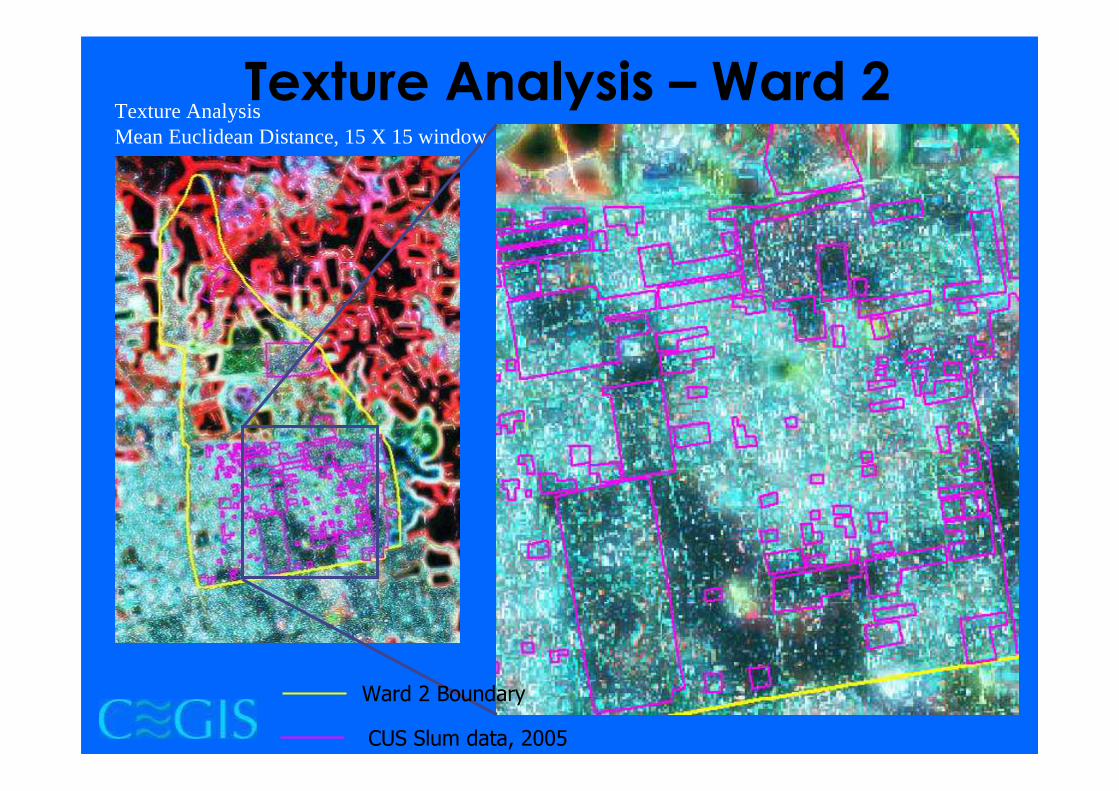
Texture Analysis – Ward 2Texture AnalysisMean Euclidean Distance, 15 X 15 window
Ward 2 Boundary
CUS Slum data, 2005
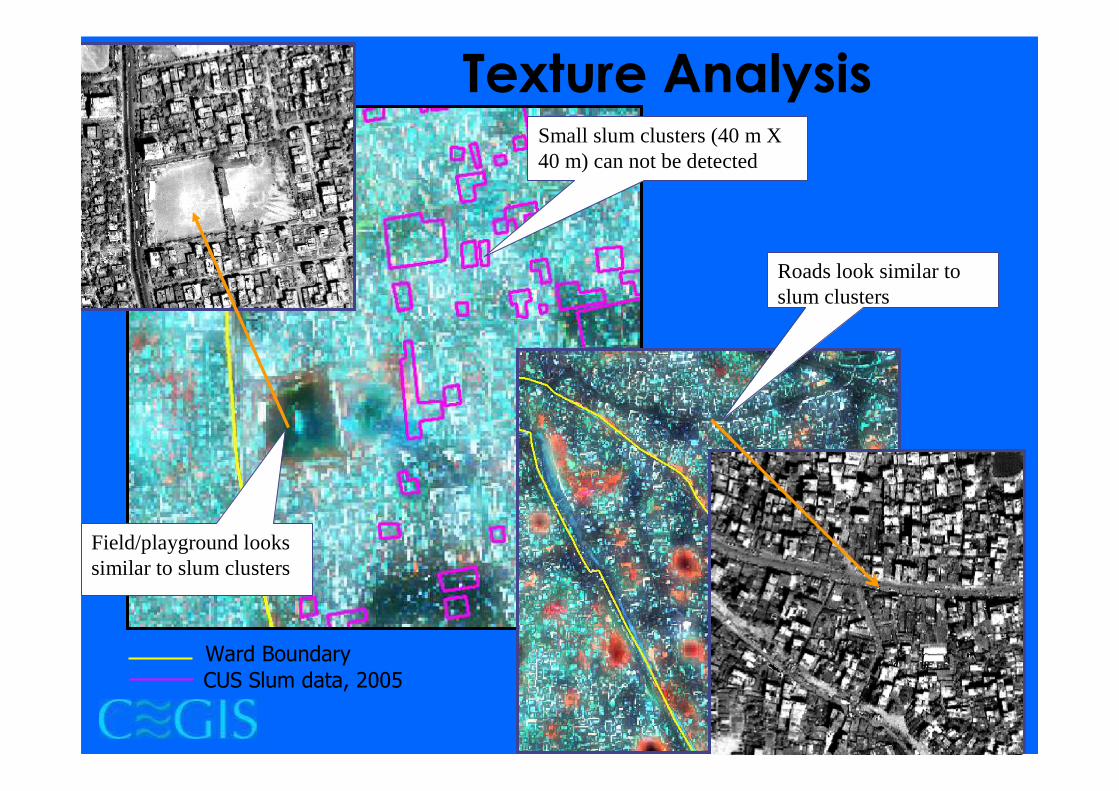
Texture Analysis
Ward Boundary
CUS Slum data, 2005
Field/playground looks similar to slum clusters
Small slum clusters (40 m X 40 m) can not be detected
Roads look similar to slum clusters

Conclusions
For initial identification of slum clusters Texture Analysis is a promising method
Texture analysis with 4 m multispectral image gave better results than 2.4 m multispectral image
Visual interpretation of pan-sharpened high resolution images gives much more detail and accurate information –but special care must be taken to use expert knowledge for interpretation
Further study of characteristics of slums in terms of building materials, patterns, size, density and their manifestations in the images will provide better interpretation keys for identification of slums
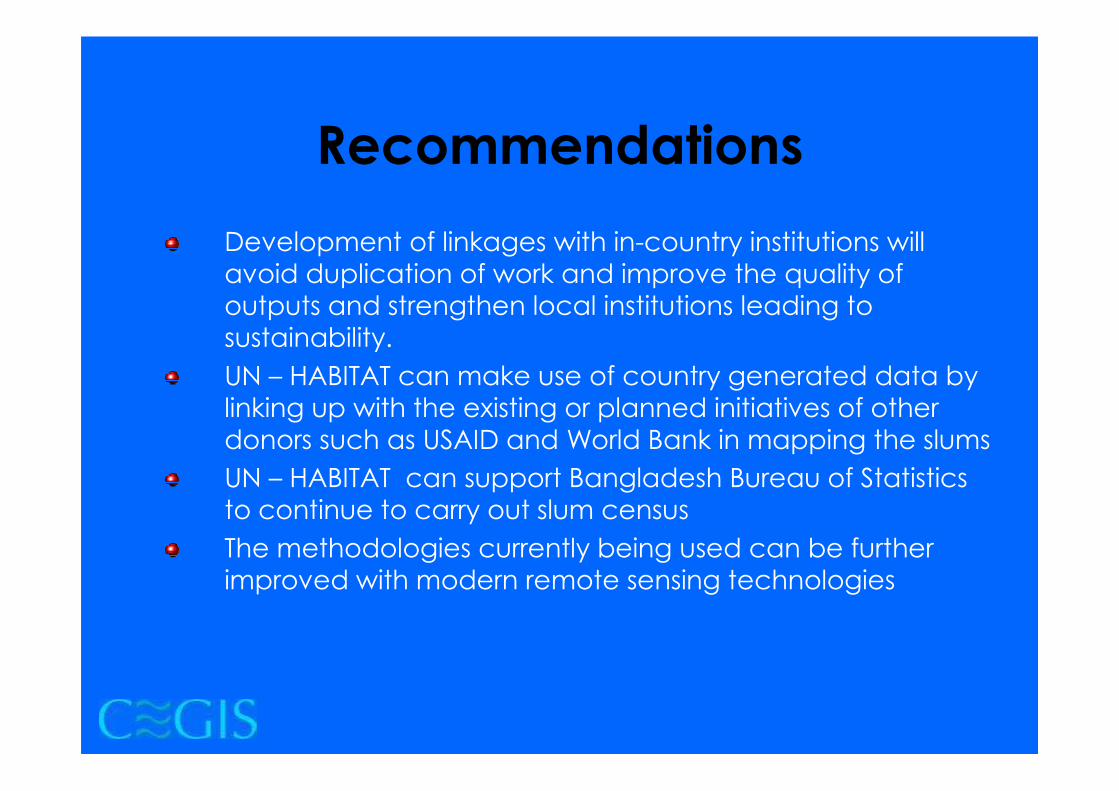
Development of linkages with in-country institutions will
avoid duplication of work and improve the quality of
outputs and strengthen local institutions leading to
sustainability.
UN – HABITAT can make use of country generated data by
linking up with the existing or planned initiatives of other
donors such as USAID and World Bank in mapping the slums
UN – HABITAT can support Bangladesh Bureau of Statistics
to continue to carry out slum census
The methodologies currently being used can be further
improved with modern remote sensing technologies
Recommendations

Thank you
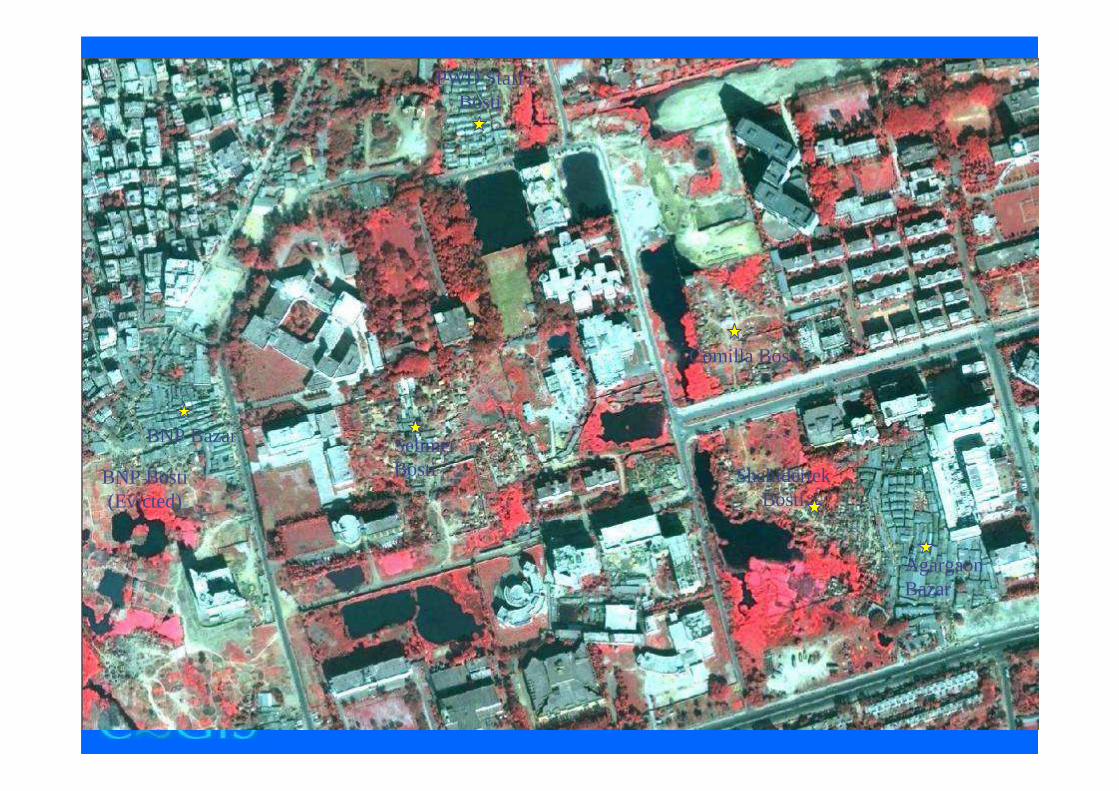
Satellite Image_Agargaon
BNP Bazar
ShahidertekBosti
Comilla Bosti
SelimerBosti
Agargaon Bazar
BNP Bosti(Evicted)
PWD Staff Bosti

Shahidertek_Inside
Water SourceSanitation
Shahidertek Bosti

Shahidertek_WaterShahidertek Bosti

Shahidertek_SanitationShahidertek Bosti

Agargaon Bazar Agargaon Bazar

Comilla Bosti_From Road
Inside the Slum
Comilla Bosti
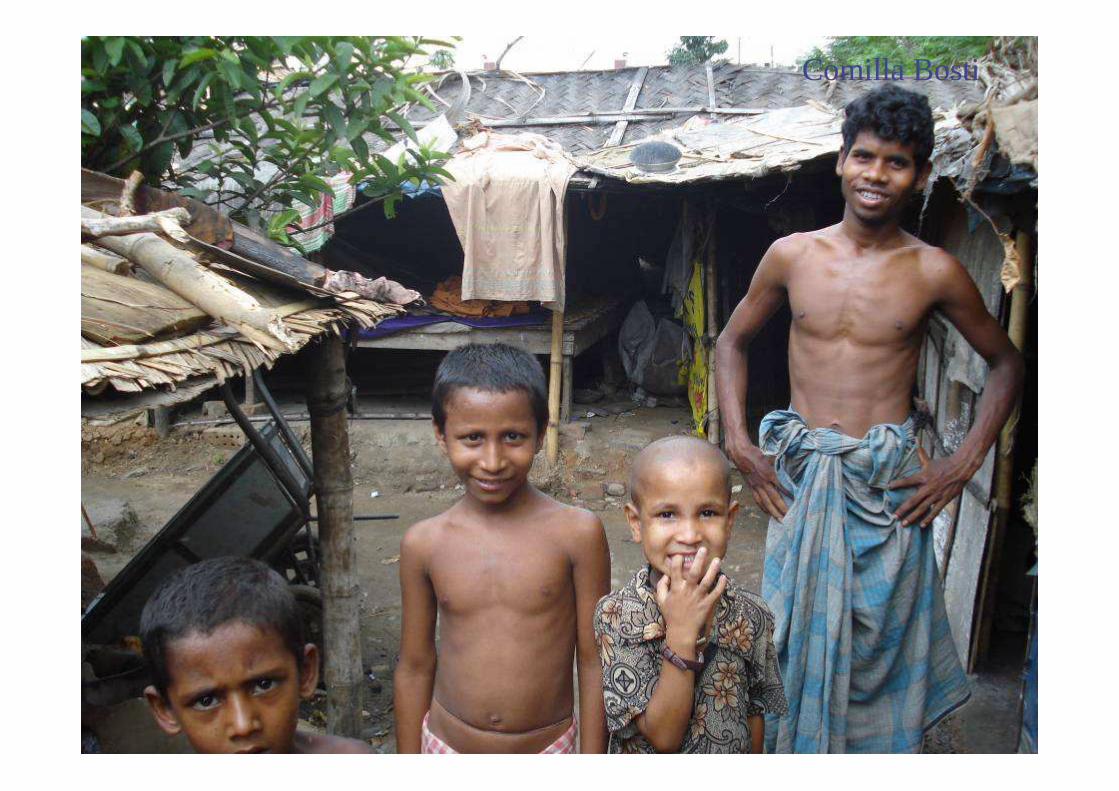
Comilla Bosti_InsideComilla Bosti

Selimer Bosti
More
Selimer Bosti

Selimer Bosti_2
More
Selimer Bosti
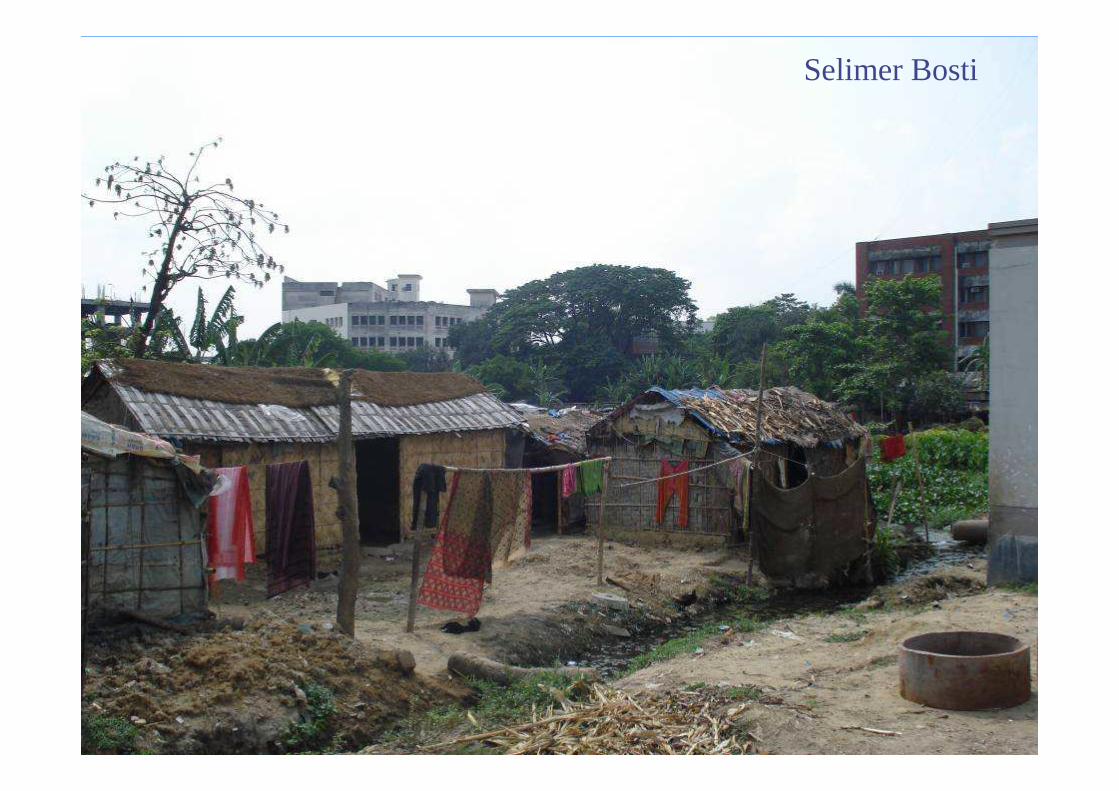
Selimer Bosti_3 Selimer Bosti

PWDB Staff Bosti PWD Staff Bosti

BNP Bazar BNP Bazar


![[Participatory mapping for city-wide slum upgrading in India]](https://static.fdocuments.net/doc/165x107/58959b021a28ab73208bbb7d/participatory-mapping-for-city-wide-slum-upgrading-in-india.jpg)