North Coast RWQCB Wetland Restoration Case Study: Upper Klamath Basin
Upper Klamath Lake DrainageTotal Maximum Daily Load (TMDL) and
Water Quality Management Plan (WQMP)
Upper KlamathLake Drainage
Upper Klamath Lake
Prepared by, May 2002


Printed by the Oregon Department of Environmental Quality
Primary authors are:Matthew Boyd, Steve Kirk, Mike Wiltsey, Brian Kasper
May, 2002
For more information contact:
Dick Pedersen, Manager of Watershed Management SectionDepartment of Environmental Quality811 Southwest 6th AvenuePortland, Oregon [email protected]

Klam
ath
Falls
Chi
loqu
inAg
ency
Lake U
pper
Klam
ath
Lake
Williamson River
Spra
gue
R ive
r
Sycan RiverN.
F.
S .F .
Fishhole CreekKl
amat
hM
arsh
Wood River
Sun CreekLa
kevi
ewBo
nanz
a
Pais
ley
Butte
Fal
ls
Upp
er K
lam
ath
Lake
Dra
inag
e

UPPER KLAMATH LAKE DRAINAGE TOTAL MAXIMUM DAILY LOAD (TMDL) ANDWATER QUALITY MANAGEMENT PLAN (WQMP)
TABLE OF CONTENTS
EXECUTIVE SUMMARY IWATER QUALITY SUMMARY ITMDL SUMMARIES I
Upper Klamath Lake and Agency Lake TMDL (Chapter II) iStream Temperature TMDL (Chapter III) iiSprague River Dissolved Oxygen TMDL (Chapter IV) iiSprague River PH TMDL (Chapter V) iiSummary of Load Allocations and Waste Load Allocations iii
CHAPTER I 1
OVERVIEW AND BACKGROUND 11.1 INTRODUCTION 21.2 OVERVIEW OF TOTAL MAXIMUM DAILY LOADS 3
1.2.1 Elements of a TMDL 31.2.2 Parameters not being addressed by a TMDL 41.2.3 TMDL Implementation Via the Water Quality Management Plan 51.2.4 Implementation and Adaptive Management Issues 6
1.3 UPPER KLAMATH LAKE DRAINAGE OVERVIEW 91.3.1 Geology 91.3.2 Climate 101.3.3 Stream Flow 101.3.4 Land Use and Ownership 101.3.5 Fisheries 15
1.4 EXISTING WATER QUALITY PROGRAMS 221.4.1 Oregon Forest Practices Act 221.4.2 Senate Bill 1010 221.4.3 Oregon Plan 221.4.4 Northwest Forest Plan 23
1.5 PUBLIC INVOLVEMENT 231.6 DATA SOURCES 23
CHAPTER II 25
UPPER KLAMATH AND AGENCY LAKES TMDL 252.1 INTRODUCTION 272.2 POLLUTANT IDENTIFICATION 302.3 TARGET IDENTIFICATION – CWA §303(D)(1) 33
2.3.1 Sensitive Beneficial Uses 332.3.2 pH Standard 332.3.3 Dissolved Oxygen Standard 342.3.4 Chlorophyll-a Standard 342.3.5 Deviation from Water Quality Standard 34
2.4 SEASONAL VARIATION - CWA §303(D)(1) 352.5 SOURCE ASSESMENT - CWA §303(D)(1) 38
2.5.1 Overview of Phosphorus Sources 382.5.2 Lake Response (Sediment Core Analysis) 402.5.3 External Sources of Phosphorus 422.5.4 Internal Lake Sources of Phosphorus 602.5.5 Phosphorus Budget 60

UPPER KLAMATH LAKE DRAINAGE TMDL AND WQMPCHAPTER I - OVERVIEW AND BACKGROUND
2.5.6 Nitrogen Budget 632.6 PHOSPHORUS REDUCTIONS NECESSARY TO MEET WATER QUALITY STANDARDS 63
2.6.1 Water Quality Standard Attainment Analysis - CWA §303(d)(1) 632.6.2 Measured Water Quality Trends 67
2.7 LOADING CAPACITY - 40 CFR 130.2(F) 682.8 ALLOCATIONS - 40 CFR 130.2(G) AND (H) 68
2.8.1 Point Sources 692.8.2 Allocation Summary 70
2.9 DERIVED WATER QUALITY TARGETS – SURROGATE MEASURES 712.10 MARGINS OF SAFETY - CWA §303(D)(1) 72
CHAPTER III 75
STREAM TEMPERATURE TMDL 753.1 OVERVIEW 76
3.1.1 Summary of Temperature TMDL Development and Approach 763.1.2 Salmonid Thermal Requirements 80
3.2 TARGET IDENTIFICATION – CWA §303(D)(1) 813.2.1 Sensitive Beneficial Use Identification 813.2.2 Water Quality Standard Identification 823.2.3 Pollutant Identification 84
3.3 EXISTING HEAT SOURCES - CWA §303(D)(1) 853.3.1 Nonpoint Sources of Heat 863.3.2 Point Sources of Heat 90
3.4 SEASONAL VARIATION & CRITICAL CONDITION - CWA §303(D)(1) 953.5 LOADING CAPACITY – 40 CFR 130.2(F) 1003.6 ALLOCATIONS – 40 CFR 130.2(G) AND (H) 1013.7 SURROGATE MEASURES – 40 CFR 130.2(I) 102
3.7.1 Site Specific Effective Shade Surrogate Measures 1033.7.2 Effective Shade Curves - Surrogate Measures 1073.7.3 Channel Morphology - Surrogate Measures 113
3.8 MARGINS OF SAFETY – CWA §303(D)(1) 1143.9 WATER QUALITY STANDARD ATTAINMENT ANALYSIS & REASONABLE ASSURANCES – CWA §303(D)(1)
116
CHAPTER IV 127
SPRAGUE RIVER DISSOLVED OXYGEN TMDL 1274.1 OVERVIEW 1294.2 TARGET IDENTIFICATION – CWA §303(D)(1) 129
4.2.1 Sensitive Beneficial Use Identification 1294.2.2 Water Quality Standard Identification 1304.2.3 Pollutant Identification 135
4.3 EXISTING SOURCES - CWA §303(D)(1) 1354.3.1 Source Descriptions 1354.3.2 Analysis - Water Quality Modeling 136
4.4 LOAD ALLOCATIONS – 40 CFR 130.2(G) & (H) 1384.5 MARGINS OF SAFETY – CWA §303(D)(1) 1394.6 SEASONAL VARIATION – CWA §303(D)(1) 139
CHAPTER V 141
SPRAGUE RIVER PH TMDL 1415.1 OVERVIEW 1425.2 TARGET IDENTIFICATION – CWA §303(D)(1) 143
5.2.1 Sensitive Beneficial Use Identification 1435.2.2 Water Quality Standard Identification 143
UPPER KLAMATH LAKE DRAINAGE TMDL AND WQMPCHAPTER I - OVERVIEW AND BACKGROUND
5.2.3 Pollutant Identification 1445.3 EXISTING SOURCES - CWA §303(D)(1) 145
5.3.1 Data Review 1455.3.2 Photosynthesis and the Carbonate Buffering System 1465.3.3 pH Model 1485.3.4 Application of the pH Model 1505.3.5 Initial Buffering Capacity 1545.3.6 Model Calibration 1545.3.7 pH Standard Attainment Analysis 156
5.4 LOADING CAPACITY – 40 CFR 130.2 (F) 1565.5 LOAD ALLOCATIONS – 40 CFR 130.2(G) & (H) 1575.6 MARGINS OF SAFETY – CWA §303(D)(1) 157
CHAPTER VI 159
WATER QUALITY MANAGEMENT PLAN 1596.1 INTRODUCTION 1596.2 ADAPTIVE MANAGEMENT 1606.3 TMDL WATER QUALITY MANAGEMENT PLAN GUIDANCE 163
6.3.1 Condition Assessment and Problem Description 1646.3.2 Existing Sources of Water Pollution 1646.3.3 Goals and Objectives 1666.3.4 Identification of responsible participants 1666.3.5 Proposed Management Measures 1686.3.6 Timeline for Implementation 1706.3.7 Reasonable Assurance 1716.3.8 Monitoring and Evaluation 1766.3.9 Public Involvement 1766.3.10 Costs and Funding 1766.3.11 Potential Sources of Project Funding 1776.3.12 Citation to Legal Authorities 177
ACRONYM LIST 181
BIBLIOGRAPHY 183

UPPER KLAMATH LAKE DRAINAGE TMDL AND WQMPEXECUTIVE SUMMARY
i
EXECUTIVE SUMMARY
WATER QUALITY SUMMARYSection 303(d) of the Federal Clean Water Act (CWA) requires that a list be developed of all
impaired or threatened waters within each state. The Oregon Department of Environmental Quality(ODEQ) is responsible for assessing data and submitting the 303(d) list to the Environmental ProtectionAgency (EPA) for federal approval. Section 303(d) also requires that the state establish a Total MaximumDaily Load (TMDL) for any waterbody designated as water quality limited (with a few exceptions, such asin cases where violations are due to natural causes or pollutants cannot be defined). TMDLs are writtenplans with an analysis that establishes that waterbodies will attain and maintain water quality levelsspecified in water quality standards.
The Upper Klamath Lake drainage is comprised of three 4th field hydrologic units (i.e. the UpperKlamath Lake subbasin, the Williamson River subbasin, and the Sprague River subbasin) and has streamsegments listed on the 1998 Oregon 303(d)1 list for: temperature, dissolved oxygen (DO), chlorophyll-a,pH, and habitat modification. The TMDL developed in this document for each of the 303(d) water qualityparameters identifies pollutants and establishes loading limits designed to comply with water qualitystandards.
Habitat and flow modification concerns are identified under biological criteria2 standardexceedance and will be addressed in management plans to be developed by designated managementagencies (DMAs). As they are not pollutants, TMDLs will not be developed for habitat and flowmodification. Chlorophyll-a is listed in the Oregon Administrative Rules (OAR) as a “nuisance criteria”and will be addressed in the Water Quality Management Plan (WQMP).
TMDL SUMMARIESFollowing are brief descriptions of the TMDLs included in this document. A summary of the
allocations and waste load allocations developed in this TMDLs are listed on page iii and listed in tableform at the beginning of each TMDL chapter.
Upper Klamath Lake and Agency Lake TMDL (Chapter II)Upper Klamath Lake and Agency Lake are hypereutrophic. High nutrient loading promotes
correspondingly high production of algae, which, in turn, modifies physical and chemical water qualitycharacteristics that can directly diminish the survival and production of fish populations. Year to yearvariations in the timing and development of algal blooms during late spring and early summer are stronglywater temperature dependent. The Upper Klamath Lake and Agency Lake TMDL examines totalphosphorous loading targets as the primary method of improving lake water quality. Statistical analysisand deterministic modeling demonstrates that pH levels are reduced to levels that benefit aquatic lifewhen total phosphorus loading rates are reduced.
1 The 303(d) list is a list of stream segments that do not meet water quality standards2 Biological criteria 303(d) listings do not have a pollutant identified, and thus, cannot have a TMDL pollutant loading limit. Instead,
biological criteria listing (i.e. flow and habitat modifications) will be addressed in water quality management plans (Chapter VI).
UPPER KLAMATH LAKE DRAINAGE TMDL AND WQMPEXECUTIVE SUMMARY
ii
Stream Temperature TMDL (Chapter III)The Federally threatened salmonids that reside in the subbasin are highly sensitive to warm
stream temperatures. Oregon’s stream temperature standard uses numeric and narrative triggers toinvoke a condition that requires "no measurable surface water increase resulting from anthropogenicactivities." Rather than target specific stream temperature levels, this TMDL targets a condition wherehuman related stream warming is minimized. While this method may seem complex, it allows site specifictargets that are more appropriate and variable than application of any one stream temperature levelthroughout the watershed.
The stream temperature TMDL targets the defined thermal pollutant: heat from human sources.There are two sources of pollutants: increased solar radiation heat loading and heat from point sourcewarm water discharge. Other factors considered in the analysis of stream heating are land cover typeand condition, channel morphology and instream flows. The loading capacity is the total allowable dailyheat loading. Load allocations are developed for anthropogenic and background nonpoint sources ofheat. Waste load allocations are developed for all point sources. There is no explicit numeric margin ofsafety provided in the temperature TMDL. Effective shade and channel morphology targets are used as asurrogate measure for nonpoint source pollutant loading offering straightforward parameters to monitorand measure. Attainment of TMDL surrogate measures (i.e. effective shade and channel morphologytargeted conditions) ensures attainment of the nonpoint source allocations.
Sprague River Dissolved Oxygen TMDL (Chapter IV)The Sprague River is listed as impaired due to insufficient concentrations of dissolved oxygen
(DO). Dissolved oxygen in water bodies may fall below healthy levels for a number of reasons includingcarbonaceous biochemical oxygen demand (CBOD) within the water column, nitrogenous biochemicaloxygen demand (NBOD, also known as nitrification), algal respiration, zooplankton respiration andsediment oxygen demand (SOD). Increased water temperatures will also reduce the amount of oxygen inwater by decreasing its solubility and increasing the rates of nitrification, respiration rates and the decayof organic matter. Depth of streambed, sediments, algal populations, phosphorus, and turbidity canimpact levels of DO. DO fluctuation is directly related to the changes in any of these parameters, eitherindividually or in combination.
It was determined by the DO modeling of the Sprague River that achieving the load allocationsand temperature reductions established in the stream temperature TMDL will reduce periphyton growthand lead to the attainment of the water quality standards.
Sprague River PH TMDL (Chapter V)Algae production is the principle cause of wide pH fluctuations in the Sprague River. The algae
of concern is periphyton. As periphyton obtains carbon dioxide for cell growth the bicarbonate present inthe water is decreased. Removal of the bicarbonate from the water will generally increase the pH. HighpH is stressful to fish. This daily increase in pH is associated with algal photosynthesis, which ismaximized by mid-day light and warmth. The pH standard has been exceeded during the warmest part ofthe day from about rivermile 50.1 to the mouth. It was determined by pH modeling of the Sprague Riverthat achieving the load allocations established for stream temperature will reduce periphyton growth andlead to the attainment of the water quality standards for pH.

UPP
ER K
LAM
ATH
LAK
E D
RAI
NAG
E TM
DL
AND
WQ
MP
E XEC
UTI
VE S
UM
MAR
Y
iii
Sum
mar
y of
Loa
d A
lloca
tions
and
Was
te L
oad
Allo
catio
ns
Load
Allo
catio
nsW
aste
Loa
d A
lloca
tions
Wat
erQ
ualit
yLi
mita
tion
Qua
ntity
Geo
grap
hic
Are
asSe
ason
Res
pons
ibili
tyQ
uant
ityPo
int o
fC
ompl
ianc
eSe
ason
Tem
pera
ture
Allo
wab
le s
olar
heat
bas
ed o
nla
nd c
over
type
/con
ditio
nan
d ch
anne
lm
orph
olog
y
Pere
nnia
lSt
ream
s of
the
Upp
erKl
amat
h La
keD
rain
age
July
toSe
ptem
ber
annu
al p
eak
tem
pera
ture
s
Land
use
s:Ag
ricul
ture
Fore
stry
Urb
anTr
ansp
orta
tion
Allo
wab
le h
eat
inpu
t dur
ing
criti
cal
perio
dEn
d of
pip
eAp
ril 1
5 to
Nov
embe
r 1
Dis
solv
edO
xyge
n%
Pho
spho
rus
redu
ctio
n
Pere
nnia
lSt
ream
s of
the
Upp
erKl
amat
h La
keD
rain
age,
Agen
cy, K
lam
ath
Lake
s
July
toO
ctob
eran
nual
min
imal
DO
leve
ls
Land
use
s:Ag
ricul
ture
Fore
stry
Urb
anTr
ansp
orta
tion
perc
ent
redu
ctio
n in
DO
durin
g cr
itica
lpe
riod
late
sum
mer
,fa
ll
Mea
sure
men
tof
DO
In U
KLTr
ibut
arie
sSp
ragu
e
Late
Sum
mer
,Fa
ll, S
prin
g
pH%
Pho
spho
rus
redu
ctio
n
Pere
nnia
lSt
ream
s of
the
Upp
erKl
amat
h La
keD
rain
age,
Agen
cy, K
lam
ath
Lake
s
June
toO
ctob
eran
nual
pea
kpH
leve
ls
Land
use
s:Ag
ricul
ture
Fore
stry
Urb
anTr
ansp
orta
tion
perc
ent
redu
ctio
n in
disc
harg
eph
osph
orus
all s
easo
ns
Mea
sure
men
tof
pH
in U
KL,
Spra
gue
Riv
er
Sprin
g to
Fall
Chl
orop
hyll
-a%
Pho
spho
rus
redu
ctio
n
Upp
erKl
amat
h an
dAg
ency
Lak
es.
Land
use
s:Ag
ricul
ture
Fore
stry
Urb
anTr
ansp
orta
tion
Nui
sanc
eC
riter
ia; r
educ
tion
in le
vels
all
seas
ons.
Late
Sum
mer

THIS PAGE IS LEFT BLANK INTENTIONALLY.

UPPER KLAMATH LAKE DRAINAGE TMDL AND WQMPCHAPTER I - OVERVIEW AND BACKGROUND
OREGON DEPARTMENT OF ENVIRONMENTAL QUALITY - MAY 2002PAGE 1
CHAPTER IOVERVIEW AND BACKGROUND
KlamathMarsh
CraterLake
AgencyLake
UpperKlamath
Lake
Sprague R. Syca
n R.
S.F.
N.F.
Will
iam
son
R.
Fishhole Cr.
Trou
t Cr.
UpperKlamath
LakeSubbasin
WilliamsonRiver Subbasin
Sprague RiverSubbasin
Figure 1-1. The Upper Klamath and Agency Lake drainage includes three 4th field hydrologic units:Williamson River, Sprague River and Upper Klamath Lake Subbasins.

UPPER KLAMATH LAKE DRAINAGE TMDL AND WQMPCHAPTER I - OVERVIEW AND BACKGROUND
OREGON DEPARTMENT OF ENVIRONMENTAL QUALITY - MAY 2002PAGE 2
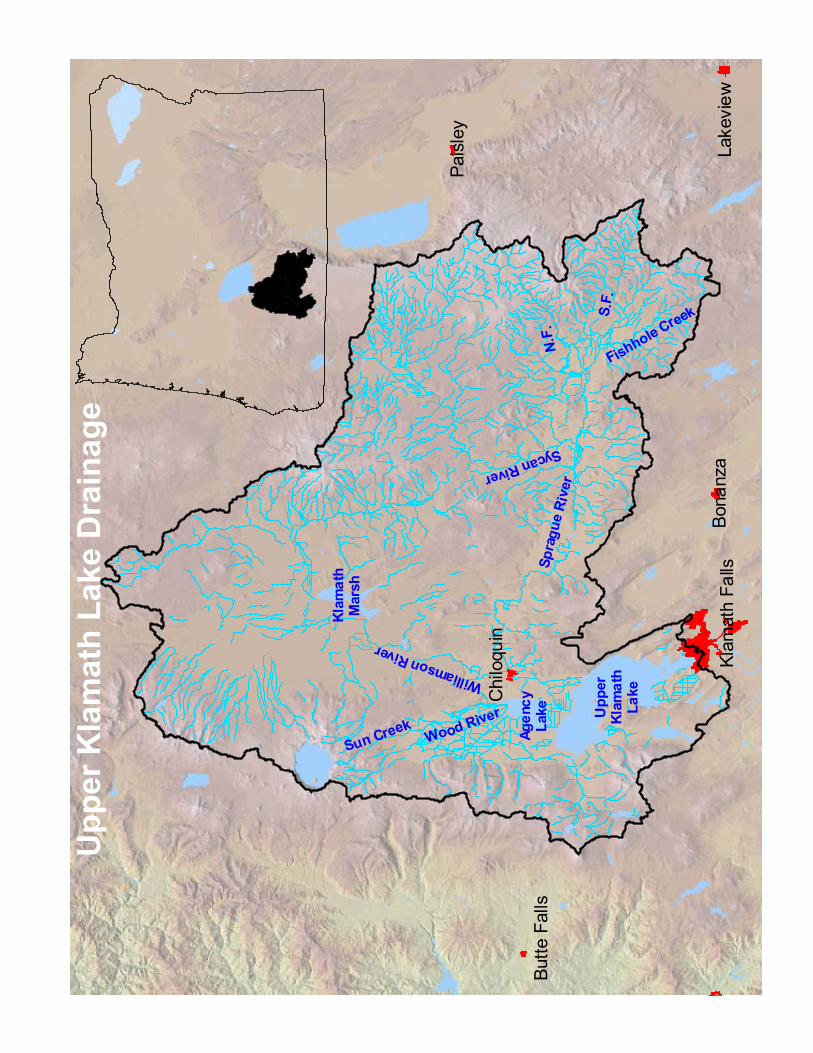
1.1 INTRODUCTIONThe following summary serves to introduce the Upper Klamath Lake drainage (Figure 1-1),
discuss the purpose of this document and describe the goals and plans established within.
The Upper Klamath Lake drainage has an area of 3,774 square miles and is located in southernOregon. Three fourth field hydrologic units comprise the Upper Klamath Lake drainage: 1) the SpragueRiver Subbasin, 2) the Williamson River Subbasin, and 3) the Upper Klamath Lake Subbasin. The UpperKlamath Lake drainage lies almost entirely within Klamath County, with some overlap into Lake County tothe east, and a very small portion in Jackson County to the west. The headwaters of the Sprague Riverare located in the Fremont National Forest. A major tributary to the Sprague River is the Sycan River,which also originates in the Fremont National Forest, flows through the Sycan Marsh, and joins theSprague River in the valley floor. The Sprague River generally flows westward until its confluence withthe Williamson River. The Williamson River also originates in the Fremont National Forest, then it flowsthrough the Klamath Marsh, and continues southward to Upper Klamath Lake.
Numerous streams do not meet Oregon water quality standards. Each TMDL contained in thisdocument evaluates water quality impairments, establishes TMDL numeric goals based on attainment ofwater quality standards, and then outlines the steps required to meet these goals. Water qualityprograms that lead to TMDL attainment will advance Oregon's commitment to complying with State andFederal law. To accomplish this, the State has promoted a path that progresses towards water qualitystandard compliance, with protection of the beneficial uses of waters of the State the primary goal. Thedata review and analysis contained in this document summarizes the varied data collection and study thathas recently occurred in the Upper Klamath Lake, Sprague, and Williamson subbasins. It is hoped thatwater quality programs will utilize this TMDL to develop and/or improve existing water qualitymanagement efforts. In addition, this TMDL should be used to track water quality, instream physicalparameters and landscape conditions that currently exist. In the future, it will be important to determinethe adequacy of planned water quality improvement efforts.
The report is organized as follows:• The main text summarizes the eight TMDL elements (listed on page 4) for each of the TMDL
parameters: temperature, dissolved oxygen, pH, and chlorophyll-a.• Appendices and attachments contain a more detailed description of the data, studies, computer
modeling, references, and data analyses that were done to develop TMDLs or to address otherparameters of concern.
• A Water Quality Management Plan is also presented in Chapter VI.
The Klamath Basin has several noteworthy distinctions:• More than 34 percent of the basin is in private ownership.• The Klamath Tribes are located within the drainage.• Federal and state agencies have been working with stakeholders for over twenty years to answer
questions regarding fish kills in Upper Klamath Lake.• The largest area of land use is private and public forest.• The water quality concerns are predominately distributed nonpoint sources of pollution instead of
discrete point source pollution.• The entire Klamath Basin (including the Upper Klamath Lake drainage) is 7th largest of Oregon’s
basins.• Upper Klamath Lake is the largest, natural body of fresh water in the Pacific Northwest.• The Upper Klamath Lake drainage is home to productive agricultural and forestlands and contains
streams with historically viable trout and anadromous salmonids. Redband trout (a type of rainbow)are present in Klamath and Agency Lakes, and Williamson and Sprague Rivers.
UPPER KLAMATH LAKE DRAINAGE TMDL AND WQMPCHAPTER I - OVERVIEW AND BACKGROUND
OREGON DEPARTMENT OF ENVIRONMENTAL QUALITY - MAY 2002PAGE 3
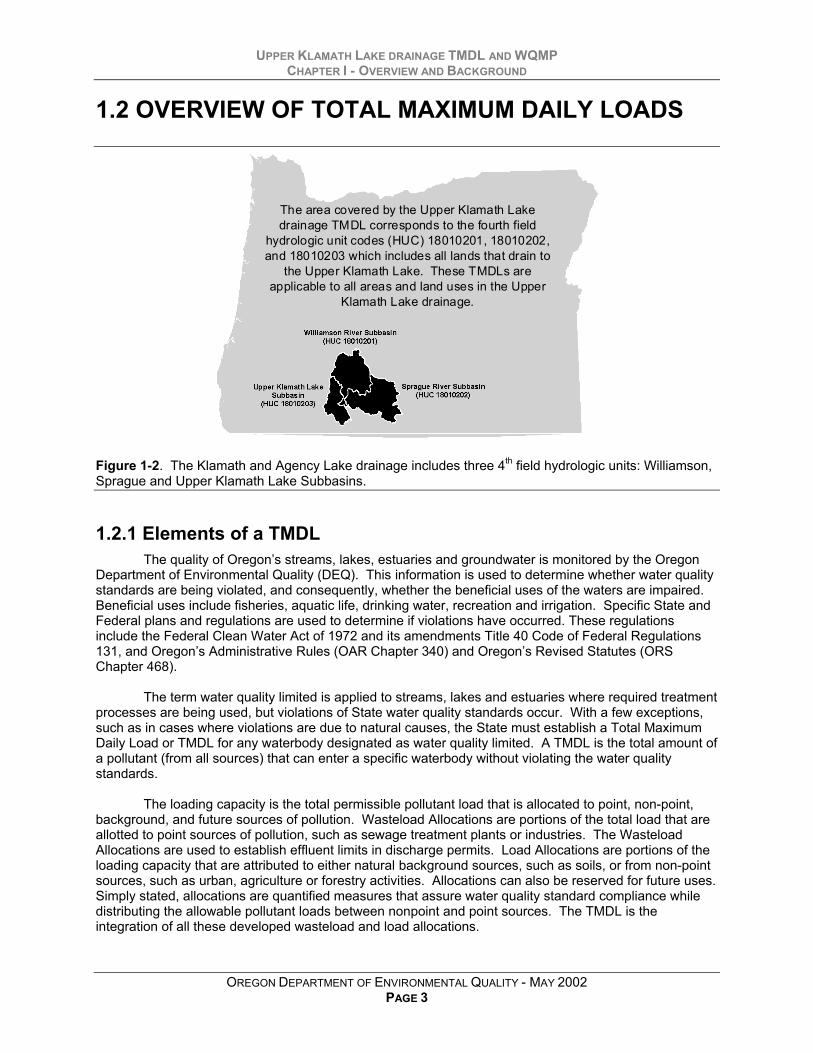
1.2 OVERVIEW OF TOTAL MAXIMUM DAILY LOADS
The area covered by the Upper Klamath Lakedrainage TMDL corresponds to the fourth field
hydrologic unit codes (HUC) 18010201, 18010202,and 18010203 which includes all lands that drain to
the Upper Klamath Lake. These TMDLs areapplicable to all areas and land uses in the Upper
Klamath Lake drainage.
Figure 1-2. The Klamath and Agency Lake drainage includes three 4th field hydrologic units: Williamson,Sprague and Upper Klamath Lake Subbasins.
1.2.1 Elements of a TMDLThe quality of Oregon’s streams, lakes, estuaries and groundwater is monitored by the Oregon
Department of Environmental Quality (DEQ). This information is used to determine whether water qualitystandards are being violated, and consequently, whether the beneficial uses of the waters are impaired.Beneficial uses include fisheries, aquatic life, drinking water, recreation and irrigation. Specific State andFederal plans and regulations are used to determine if violations have occurred. These regulationsinclude the Federal Clean Water Act of 1972 and its amendments Title 40 Code of Federal Regulations131, and Oregon’s Administrative Rules (OAR Chapter 340) and Oregon’s Revised Statutes (ORSChapter 468).
The term water quality limited is applied to streams, lakes and estuaries where required treatmentprocesses are being used, but violations of State water quality standards occur. With a few exceptions,such as in cases where violations are due to natural causes, the State must establish a Total MaximumDaily Load or TMDL for any waterbody designated as water quality limited. A TMDL is the total amount ofa pollutant (from all sources) that can enter a specific waterbody without violating the water qualitystandards.
The loading capacity is the total permissible pollutant load that is allocated to point, non-point,background, and future sources of pollution. Wasteload Allocations are portions of the total load that areallotted to point sources of pollution, such as sewage treatment plants or industries. The WasteloadAllocations are used to establish effluent limits in discharge permits. Load Allocations are portions of theloading capacity that are attributed to either natural background sources, such as soils, or from non-pointsources, such as urban, agriculture or forestry activities. Allocations can also be reserved for future uses.Simply stated, allocations are quantified measures that assure water quality standard compliance whiledistributing the allowable pollutant loads between nonpoint and point sources. The TMDL is theintegration of all these developed wasteload and load allocations.
UPPER KLAMATH LAKE DRAINAGE TMDL AND WQMPCHAPTER I - OVERVIEW AND BACKGROUND
OREGON DEPARTMENT OF ENVIRONMENTAL QUALITY - MAY 2002PAGE 4
The U. S. Environmental Protection Agency (EPA) has the authority under the Clean Water Act toapprove or disapprove TMDLs that states submit. When a TMDL is officially submitted by a state to EPA,EPA has 30 days to take action on the TMDL. In the case where EPA disapproves a TMDL, EPA wouldneed to establish the TMDL within 30 days.
The required elements of a TMDL that must be submitted to EPA include:
1. A description of the geographic area to which the TMDL applies;2. Specification of the applicable water quality standards;3. An assessment of the problem, including the extent of deviation of ambient conditions from water
quality standards;4. Evaluation of seasonal variations5. Identification of point sources and non-point sources;6. Development of a loading capacity including those based on surrogate measures and including
flow assumptions used in developing the TMDL;7. Development of Waste Load Allocations for point sources and Load Allocations for non-point
sources;8. Development of a margin of safety.
1.2.2 Parameters not being addressed by a TMDLThe 303(d) List is intended to identify all waters not meeting water quality standards. EPA has
interpreted that Total Maximum Daily Loads (TMDLs) are to be established only where a water body iswater quality limited by a “pollutant.”3 In the case where the listings are for parameters such as forHabitat Modification or Flow Modification which are not pollutants4, TMDLs would not need to beestablished and other approaches to address these concerns, such as through Management Plans, couldbe used to address these impairments. In the case of a Biological Criteria listing which could be due toeither a pollutant (e.g. excessive temperature, low dissolved oxygen or sedimentation) or some form ofpollution (flow or habitat modification), the likely cause for the Biological Criteria exceedance needs to bedetermined. If pollutants were the likely cause, a TMDL would need to be established. If some otherform of pollution was involved, other appropriate measures could be used.
The 1998 303(d) list contains listings for waters in the Upper Klamath Lake drainage for habitatmodification, for which ODEQ is not submitting a TMDL. Detailed discussions regarding this parameter isprovided in the Appendices. A summary of the rationale for not developing TMDLs for this parameterfollows:
Habitat Modification: Factors that were identified which affect fish assemblages include water quality,flow and habitat modification. TMDLs are being developed for temperature and dissolved oxygenthroughout the subbasin which should address the water quality pollutants of concern and improve thewater quality for the fish assemblages. Other factors such as habitat and flow improvements are notpollutants and a TMDL will not be developed. However, these factors will need to be addressed inmanagement plans in order to have substantial improvements in the fish assemblages.
3 Section 303(d)(1)(C) states that “each State shall establish for the waters identified in paragraph (1)(A) of this subsection, and in
accordance with the priority ranking, the total maximum daily load, for those pollutants which the Administrator identifies undersection 304(a)(2) as suitable for such calculation.
4 The term pollutant is defined in section 502(6) of the CWA and in the proposed 40 CFR 130.2(d) as follows: “The term “pollutant”means dredged spoil, solid waste, incinerator residue, sewage, garbage, sewage sludge, munitions, chemical wastes, biologicalmaterials, radioactive materials, heat, wrecked or discarded equipment, rock, sand, cellar dirt and industrial, municipal, andagricultural waste discharged into water.”

UPPER KLAMATH LAKE DRAINAGE TMDL AND WQMPCHAPTER I - OVERVIEW AND BACKGROUND
OREGON DEPARTMENT OF ENVIRONMENTAL QUALITY - MAY 2002PAGE 5
1.2.3 TMDL Implementation Via the Water Quality Management PlanImplementation of TMDLs is critical to the attainment of water quality standards. The support of
Designated Management Agencies (DMAs) in implementing TMDLs is essential. A DMA is any agency orentity responsible for affecting water quality through its management of land and/or water. In instanceswhere DEQ has no direct authority for implementation, DEQ works with DMAs on implementation toensure attainment of water quality standards. The DMAs in the Upper Klamath Lake drainage include: USForest Service, US Bureau of Reclamation, US Fish and Wildlife Service, Crater Lake Park Service, OregonDepartment of Agriculture and the Oregon Department of Forestry, Klamath County, and the City of KlamathFalls. These agencies have developed water quality management plans (WQMP) to load allocationsidentified in the 1988 TMDLs and/or are operating under NPDES permits.
DEQ intends to submit a TMDL WQMP to EPA concurrently with submission of TMDLs. Both theTMDLs and their associated WQMP will be submitted by DEQ to EPA as updates to the State’s WaterQuality Management Plan pursuant to 40 CFR 130.6. Such submissions will be a continuing update ofthe Continuing Planning Process (CPP).
The following are elements of the WQMPs that will be submitted to EPA:
• Condition assessment and problem description• Goals and objectives• Identification of responsible participants• Proposed management measures• Timeline for implementation• Reasonable assurance• Monitoring and evaluation• Public involvement• Costs and funding• Citation to legal authorities
Chapter VI contains the above elements for DMAs and contains schedules for when permits andmanagement plans will be updated.
A Water Quality Management Plan (WQMP) is included as a companion document to the TMDLs.This document explains the roles of various land management agencies, federal, state, and localgovernments, as well as private landowners in implementing the actions necessary to meet theallocations in the TMDLs. It also includes directly or by reference the statutes, rules, ordinances, localplans, and all other known mechanisms for implementation. The WQMP for the Upper Klamath Lakedrainage focuses specifically on:
• State Forest Lands (Forest Practices Act)• Private Forest Lands (Forest Practices Act)• US Bureau of Reclamation Lands (Water Quality Management Plan)• US Fish and Wildlife Services Lands (Water Quality Management Plan)• Federal Forest Lands (Northwest Forest Plan)• Private Agricultural Lands ( SB1010 Plan)• Klamath County Lands (County Ordinances)
These documents and several public summary documents will be available upon request, atlocations within the Upper Klamath Lake drainage and can be found on the ODEQ website:http://waterquality.deq.state.or.us/wq/. The TMDL and WQMP build upon the following land managementprograms in the Upper Klamath Lake drainage:
UPPER KLAMATH LAKE DRAINAGE TMDL AND WQMPCHAPTER I - OVERVIEW AND BACKGROUND
OREGON DEPARTMENT OF ENVIRONMENTAL QUALITY - MAY 2002PAGE 6
• Oregon’s Forest Practices Act (state and private forestlands)• Senate Bill 1010 (agricultural lands)• Oregon Plan (all lands)• Many other programs (USFS, ODOT, Cities & County, NPDES, etc.)
Chapter VI includes (1) schedules for evaluating and producing programs, rules or policy toimplement TMDLs, (2) recommendations of best management practices to improve water quality, (3)discussion of costs, areas and impairments of emphasis, long-term monitoring, public involvement andmaintenance of effort over time. The primary authors were workgroups appointed to represent thespecific land uses, providing stakeholder representation as well as technical and policy expertise.
The Upper Klamath Basin TMDL Citizens Advisory Committee was formed to assist the Department indeveloping TMDLs for the Upper Klamath Lake drainage. The committee includes representatives ofvarious land uses and resources. Valuable contributions by the committee include review and commentconcerning method development, data collection, data evaluation and study of the interaction betweenland use and water quality. The knowledge derived from these data collection efforts and discussion,some of which is presented in this document, has been used to design the enclosed protective andenhancement strategies that address water quality issues. Citizen Advisory Committee meetings wereopen to the public and public participation at the meetings was encouraged.
1.2.4 Implementation and Adaptive Management IssuesThe goal of the Clean Water Act and associated Oregon Administrative Rules is that water quality
standards shall be met or that all feasible steps will be taken towards achieving the highest quality waterattainable. This is a long-term goal in many watersheds, particularly where non-point sources are themain concern. To achieve this goal, implementation must commence as soon as possible.
Total Maximum Daily Loads (TMDLs) are numerical loadings that are set to limit pollutant levelssuch that in-stream water quality standards are met. ODEQ recognizes that TMDLs are values calculatedfrom mathematical models and other analytical techniques designed to simulate and/or predict verycomplex physical, chemical and biological processes. Models and techniques are simplifications of thesecomplex processes and, as such, are unlikely to produce an exact prediction of how streams and otherwaterbodies will respond to the application of various management measures. It is also recognized thatthere is a varying level of uncertainty in the TMDLs depending on factors such as amount of data that isavailable and how well the processes listed above are understood. It is for this reason that the TMDLshave been established with a margin of safety. Subject to available resources, ODEQ will review and, ifnecessary, modify TMDLs established for a subbasin on a five-year basis or possibly sooner if ODEQdetermines that new scientific information is available that indicates significant changes to the TMDL areneeded.
Water Quality Management Plans (WQMPs) are plans designed to reduce pollutant loads to meet
TMDLs. ODEQ recognizes that it may take some period of time—from several years to several decades--after full implementation before management practices identified in a WQMP become fully effective inreducing and controlling certain forms of pollution such as heat loads from lack of riparian vegetation. Inaddition, ODEQ recognizes that technology for controlling some pollution sources such as nonpointsources and stormwater is, in many cases, in the development stages and will likely take one or moreiterations to develop effective techniques. It is possible that after application of all reasonable bestmanagement practices, some TMDLs or their associated surrogates cannot be achieved as originallyestablished.
ODEQ also recognizes that, despite the best and most sincere efforts, natural events beyond thecontrol of humans may interfere with or delay attainment of the TMDL and/or its associated surrogates.Such events could be, but are not limited to, floods, fire, insect infestations, and drought.
UPPER KLAMATH LAKE DRAINAGE TMDL AND WQMPCHAPTER I - OVERVIEW AND BACKGROUND
OREGON DEPARTMENT OF ENVIRONMENTAL QUALITY - MAY 2002PAGE 7
In this TMDL, pollutant surrogates have been defined as alternative targets for meeting the TMDLfor some parameters. The purpose of the surrogates is not to bar or eliminate human access or activity inthe subbasin or its riparian areas. It is the expectation, however, that WQMPs will address how humanactivities will be managed to achieve the surrogates. It is also recognized that full attainment of pollutantsurrogates (system potential vegetation, for example) at all locations may not be feasible due to physical,legal or other regulatory constraints. To the extent possible, WQMPs should identify potential constraints,but should also provide the ability to mitigate those constraints should the opportunity arise. For instance,at this time, the existing location of a road or highway may preclude attainment of system potentialvegetation due to safety considerations. In the future, however, should the road be expanded orupgraded, consideration should be given to designs that support TMDL load allocations and pollutantsurrogates such as system potential vegetation.
When developing water quality-based effluent limits for NPDES permits, ODEQ will ensure thateffluent limits developed are consistent with the assumptions and requirements of the wasteloadallocation (CFR 122.44(d)(1)(vii)(B)). Similarly, the Department will work with nonpoint sources indeveloping management plans that are consistent in meeting the assumptions and requirements of theload allocations. These permits and plans will be developed/modified within 1-2 years following thedevelop/modification of a TMDL and include but not be limited to the following (February 2000 MOAbetween ODEQ and EPA):
• Management measures tied to attainment of the TMDL,;
• Timeline for implementation (including appropriate incremental measurable water quality targets andmilestones for implementing control actions);
• Timeline for attainment of water quality standards including an explanation of how implementation isexpected to result in the attainment of water quality standards, and
• Monitoring and evaluation.
If a source that is covered by this TMDL complies with its permit, WQMP or applicable forestpractice rules, it will be considered in compliance with the TMDL. ODEQ intends to regularly reviewprogress of WQMPs to achieve TMDLs. If and when ODEQ determines that WQMP have been fullyimplemented, that all feasible management practices have reached maximum expected effectiveness anda TMDL or its interim targets have not been achieved, the Department shall reopen the TMDL and adjustit or its interim targets and its associated water quality standard(s) as necessary. The determination thatall feasible steps have been taken will be based on, but not limited to, a site-specific balance of thefollowing criteria: protection of beneficial uses; appropriateness to local conditions; use of best treatmenttechnologies or management practices or measures; and cost of compliance (OAR 340-41-026(3)(a)(D)(ii)).
The implementation of TMDLs and the associated management plans is generally enforceable byODEQ, other state agencies and local government. However, it is envisioned that sufficient initiativeexists to achieve water quality goals with minimal enforcement. Should the need for additional effortemerge, it is expected that the responsible agency will work with land managers and permit holders toovercome impediments to progress through education, technical support or enforcement. Enforcementmay be necessary in instances of insufficient action towards progress. In the case of nonpoint sources,this could occur first through direct intervention from land management agencies (e.g. ODF, ODA,counties and cities), and secondarily through ODEQ. The latter may be based in departmental orders toimplement management goals leading to water quality standards.
A zero waste load allocation does not necessarily mean that a point source is prohibited fromdischarging any wastes. A source may be permitted to discharge by ODEQ if the holder can adequatelydemonstrate that the discharge will not have a significant impact on water quality over that achieved by azero allocation. For instance, a permit applicant may be able to demonstrate that a proposed thermaldischarge would not have a measurable detrimental impact on projected stream temperatures whensystem temperature is achieved. Or, in the case where a TMDL is set based upon attainment of a

UPPER KLAMATH LAKE DRAINAGE TMDL AND WQMPCHAPTER I - OVERVIEW AND BACKGROUND
OREGON DEPARTMENT OF ENVIRONMENTAL QUALITY - MAY 2002PAGE 8
specific pollutant concentration, a source could be permitted to discharge at that concentration and still beconsidered as meeting a zero allocation.
In employing an adaptive management approach to this TMDL and WQMP, ODEQ has the followingexpectations and intentions:
• Subject to available resources, ODEQ will review and, if necessary, modify TMDLs and WQMPsestablished for a subbasin on a five-year basis or possibly sooner if ODEQ determines that newscientific information is available that indicates significant changes to the TMDL are needed.
• When developing water quality-based effluent limits for NPDES permits, ODEQ will ensure thateffluent limits developed are consistent with the assumptions and requirements of the wasteloadallocation (CFR 122.44(d)(1)(vii)(B)).
• In conducting this review, ODEQ will evaluate the progress towards achieving the TMDL (and waterquality standards) and the success of implementing the WQMP.
• ODEQ expects that each management agency will also monitor and document its progress inimplementing the provisions of its component of the WQMP. This information will be provided toODEQ for its use in reviewing the TMDL.
• As implementation of the WQMP proceeds, ODEQ expects that management agencies will developbenchmarks for attainment of TMDL surrogates, which can then be used to measure progress.
• Where implementation of the WQMP or effectiveness of management techniques are found to beinadequate, ODEQ expects management agencies to revise the components of the WQMP toaddress these deficiencies.
• When ODEQ, in consultation with the management agencies, concludes that all feasible steps havebeen taken to meet the TMDL and its associated surrogates and attainment of water qualitystandards, the TMDL, or the associated surrogates is not practicable, it will reopen the TMDL andadjust it or its interim targets and its associated water quality standard(s) as necessary. Thedetermination that all feasible steps have been taken will be based on, but not limited to, a site-specific balance of the following criteria: protection of beneficial uses; appropriateness to localconditions; use of best treatment technologies or management practices or measures; and cost ofcompliance (OAR 340-41-026(3)(a)(D)(ii)).

UPPER KLAMATH LAKE DRAINAGE TMDL AND WQMPCHAPTER I - OVERVIEW AND BACKGROUND
OREGON DEPARTMENT OF ENVIRONMENTAL QUALITY - MAY 2002PAGE 9
1.3 UPPER KLAMATH LAKE DRAINAGE OVERVIEW
1.3.1 GeologyThe Upper Klamath Lake drainage headwaters predominately occur in the coniferous forests of
the Fremont and Winema National Forests, and at over 5,000 feet elevation (the highest point in thesubbasin is 9,490 feet in elevation). The Williamson River enters Upper Klamath Lake at 4,140 feetabove sea level. Shaded relief topography is depicted in Figure 1-4. The Upper Klamath Lake drainageis surrounded by relatively steep mountains. There are several high elevation meadows and marshesthat the stream network flows through (i.e., Klamath Marsh in the Williamson River Subbasin and SycanMarsh, Teddy Powers Meadow, and Lee Thomas Meadow in the Sprague River Subbasin).
Upper Klamath Lake is in a large, flat valley adjacent to the eastern slopes of the Cascade Rangein south-central Oregon. It is the largest lake (by area) wholly within Oregon, having a surface area ofabout 140 square miles at maximum lake surface elevation, a length of about 25 miles, and a widthranging from 2.5 to 12.5 miles. Despite its large size, the lake is shallow and has a mean summer depthof about 8 feet and a maximum depth of about 58 feet (U.S. Army Corp of Engineers, 1979, 1982).
The north-northwest trending Klamath Basin corresponds, in part, to a down-faulted crustal block,which is 6-9 mile wide. It is known as the Klamath Graben and extends north toward Crater Lake in theCascade range and is bounded by high, steep escarpments, especially along the eastern rim. As muchas 6,600 feet of unconsolidated sediment fills the graben. Rocks in the area are predominately volcanicorigin, consisting of unconsolidated or consolidated volcanic materials or unconsolidated sedimentslargely derived from volcanic rocks.
Parts of Upper Klamath Lake drainage were heavily glaciated during the Plistocene. During thistime a large pluvial lake, Lake Modoc, covered much of the basin floor. Large quantities of ash andpumice as well as accumulations of diatoms and peat were deposited in the basin. At the end of thePliestocene, about 10,000 years ago, Lake Modoc began to shrink, forming Upper and Lower KlamathLakes.
About 6,900 years ago, a massive eruption occurred from what is now referred to as MountMazama at the northern end of Upper Klamath Lake Drainage. Mount Mazama collapsed during thiseruption forming Crater lake and generated pumice and ash deposits over much of the Upper KlamathLake Drainage. Volcanic materials resulting from the deposition of ash from Mount Mazama have beenobserved to a depth 10.5 feet in sediment cores (Snyder and Morace, 1997)
The drainage area for Upper Klamath Lake is about 3,800 square miles. The principal tributariesto the lake are the Williamson and Wood Rivers. The Williamson River is the largest, with much of its flowderived from the Sprague River. The Williamson River subbasin and the Sprague River subbasin has adrainage area of approximately 3,000 square miles and constitutes 79 percent of the total drainage areathat contributes to Upper Klamath Lake. The Sprague River has a drainage area of 1,580 square miles53 percent of the Williamson River subbasin. Together, the Williamson and Sprague Rivers supply aboutone-half of the inflow to Upper Klamath Lake.
In addition to streams, spring flow and groundwater seepage provide continuous inflow to the lakethroughout the year (Illian, 1970). Upper Klamath Lake is drained at the southern end by the Link River,which flows through a short reach and enters Lake Ewauna at Klamath Falls. The headwaters of theKlamath River proper are about one mile south of Klamath Falls where Lake Ewauna flows into theKlamath River. Link River Dam on the Link River regulates the flow from Upper Klamath Lake. Since1919, the operation of Link River Dam has facilitated the control of lake level elevations. Upper Klamath

UPPER KLAMATH LAKE DRAINAGE TMDL AND WQMPCHAPTER I - OVERVIEW AND BACKGROUND
OREGON DEPARTMENT OF ENVIRONMENTAL QUALITY - MAY 2002PAGE 10
Lake, Sprague River, and Williamson River subbasins are home to productive forested and agriculturelands and has the distinction of containing extensive waterbodies with expansive marshes teeming withwaterfowl, blue-ribbon trout streams, and large ranches. Valuable contributions from agriculture, forestry,fisheries, the Klamath Tribes and federal agencies in these watersheds have prompted extensive datacollection and study of the interaction between land use and water quality.
1.3.2 ClimateThe climate of the Upper Klamath Lake drainage is generally characterized dry summers with
high temperatures and wet winters with moderately low temperatures. Due to its location approximately120 miles east of the Cascade Mountain Range, it is in the path of storms originating in the north PacificOcean. Winter precipitation is derived from these storms traversing in an easterly direction. TheCascade Range creates a rain shadow that affects the distribution of precipitation throughout the UpperKlamath Lake drainage. Annual precipitation (Figure 1-5) in the basin ranges from lows of 15 inches atUpper Klamath Lake and along the Sprague River to highs reaching 90 inches at Crater Lake (Daly et al,1994, 1997). The mean annual precipitation (Table 1-1) for the Upper Klamath Lake subbasin is 27inches. The mean annual precipitation is 23 inches in the Williamson River subbasin upstream from theconfluence with the Sprague River and 20 inches in the Sprague River subbasin. Mean annual snowaccumulation ranges from 15 inches in the valleys to more than 160 inches in the mountainous areas ofthe basin. Snowfall represents 30 percent of the annual precipitation in the valleys and more than 50percent of the total at higher elevations.
Table 1-1. Average Monthly Climate Data for Chiloquin, Oregon
Parameter Jan Feb Mar April May Jun July Aug Sept Oct Nov Dec YearAir Temperature (oF)Mean 27.2 30.1 37.4 43.5 48.5 55.9 61.0 61.1 53.8 45.8 34.8 27.5 44.1Maximum 36.4 40.4 48.5 57.7 64.3 72.7 79.8 80.5 71.9 62.1 44.8 36.2 58.2Minimum 17.9 19.8 26.3 29.3 32.6 39.1 42.3 41.8 35.7 29.6 24.8 18.7 30.1Precipitation (inches)Mean 2.4 2.83 2.47 1.30 1.29 .65 .61 .57 .82 1.23 3.18 3.59 21.8
1.3.3 Stream Flow
Low flows generally occur during the end of the summer months (July to October) due todecreased precipitation and increased agriculture water withdrawals. It is extremely likely that 7Q10 lowflows5 in the lower portions of the drainage are impacted (i.e., lowered) by upstream diversions.Relatively little historical flow data exists for the Upper Klamath Lake drainage. Six USGS gages on theSycan, Sprague, and Williamson Rivers have recorded enough historical daily values to calculate LogPearson Type III 7Q10 low flows. Figure 1-3 displays those calculated 7Q10 low flows for each USGSgage, while Table 1-2 summarizes the gage locations and periods of record.
1.3.4 Land Use and Ownership
Land ownership is predominantly private and United States Forest Service in the Upper KlamathLake drainage, accounting for 42.3% and 53.4% of the land area, respectively. Crater Lake National Park
5 7Q10 refers to a seven day averaged low flow condition that occurs on a ten-year return period. Mathematically, this low flowcondition has a 10% probability of occurring every year. A Log Pearson Type III distribution was used to calculate the return period.

UPPER KLAMATH LAKE DRAINAGE TMDL AND WQMPCHAPTER I - OVERVIEW AND BACKGROUND
OREGON DEPARTMENT OF ENVIRONMENTAL QUALITY - MAY 2002PAGE 11
makes up 3% of the land area. Nearly 1% of the area is National Wildlife Refuge. Spatial distributions ofland ownership are displayed in Figure 1-6.
Land use in the Upper Klamath Lake drainage is predominantly forested (69.4%) andshrubland/grassland (13.7%). Agriculture (farming and grazing occur on 5.5% of the drainage. Wetlandsand water make up 6% and 3.7% of the surface area, respectively. Figure 1-7 shows the spatialdistribution of major land use types.
Table 1-2. Log Pearson Type III 7Q10 Low Flow
Low Flow Averaged over 7 days with a Return Period of 10 Years
Stream Location Period River Mile7Q10 Low
Flows(cfs)
Sycan River Below Snake Creek 1978-1991 3.0 8.4Sprague River Near Beatty, OR 1953-1991 75.1 76.2Sprague River Near Chiloquin, OR 1921-1999 5.4 120.2
Williamson River Below Sheep Creek 1978-1991 67.8 37.6Williamson River Near Klamath Agency, OR 1954-1995 27.0 0Williamson River Below Sprague River 1923-1999 11.0 390.4
8.4
76.2
120.2
37.6
0
390.4
0
50
100
150
200
250
300
350
400
450
Sycan R. (RM 3.0)
Sprague R.(RM 75.1)
Sprague R.(RM 5.4)
Williamson R.(RM 67.8)
Williamson R.(RM 27.0)
Williamson R.(RM 11.0)
7Q10
Low
Flo
w (c
fs)
Figure 1-3. Upper Klamath Lake drainage 7Q10 Low Flows (cfs)

UPPER KLAMATH LAKE DRAINAGE TMDL AND WQMPCHAPTER I - OVERVIEW AND BACKGROUND
OREGON DEPARTMENT OF ENVIRONMENTAL QUALITY - MAY 2002PAGE 12
Figure 1-4. Illustration of the Upper Klamath Lake drainage Shaded Relief Topography
Figure 1-5. Upper Klamath Lake drainage Precipitation (Oregon SSCGIS)

UPPER KLAMATH LAKE DRAINAGE TMDL AND WQMPCHAPTER I - OVERVIEW AND BACKGROUND
OREGON DEPARTMENT OF ENVIRONMENTAL QUALITY - MAY 2002PAGE 13
Private42.3% USFS
53.4%
State Lands0.2%
Nat. Park or Monument3.0%
BLM0.3%
Nat. Wildlife Refuge0.9%
Figure 1-6. Land Ownership/Management Spatial Distributions

UPPER KLAMATH LAKE DRAINAGE TMDL AND WQMPCHAPTER I - OVERVIEW AND BACKGROUND
OREGON DEPARTMENT OF ENVIRONMENTAL QUALITY - MAY 2002PAGE 14
Wetland6.0%
Forested69.4%
Srubland, Grassland13.7%
Agriculture5.5%
Water3.7%
Developed0.2%
Barren1.4%
Figure 1-7. Land Use Spatial Distributions

UPPER KLAMATH LAKE DRAINAGE TMDL AND WQMPCHAPTER I - OVERVIEW AND BACKGROUND
OREGON DEPARTMENT OF ENVIRONMENTAL QUALITY - MAY 2002PAGE 15
1.3.5 FisheriesA wide variety of fish species are present in the UKLDB. Fish species presently found in the
Upper Klamath Lake drainage include:
Interior redband trout (Oncorhynchus mykiss) Brown bullhead (Ameiurus nebulosus)Eastern brook trout (Salvelinus frontinalis) Largemouth bass (Micropterus salmoides)Brown trout (Salmo trutta) Pumpkinseed (Lepomis gibbosus)Bull Trout (Salvelinus confluent) Yellow perch (Perca flavescens)
Blue chub (Gila coerula) Klamath Lake sculpin (Cottus princeps)Fathead minnow (Pimephales promelas) Marbled sculpin (Cottus klamathensis)Speckled dace (Rhinichthys osculus) Slender sculpin (Cottus tenuis)Tui chub (Gila bicolor)
Klamath Lamprey (Lampetra similis)Klamath largescale sucker (Catostomaus snyderi) Pacific lamprey (Lampetra tridentata)Lost River sucker (Deltistes luxatus)Shortnose sucker (Chasmistes brevirostris)
Key species of interest to this TMDL include the Interior redband trout (Oncorhynchus mykiss), Bull Trout(Salvelinus confluent), Lost River sucker (Deltistes luxatus) and Shortnose sucker (Chasmistesbrevirostris). Life stages periodicities for these key species are listed in Table 1-3.
Table 1-3. Life Stage Periodicity
Species Life Stage Jan Feb Mar Apr May Jun Jul Aug Sep Oct Nov DecAdult X X X X X X X X X X X XSpawning X X X X X XIncubation X X X X X XFry X X X X X XJuvenile X X X X X X X X X X X XMigration
Redbandtrout
Adult X X X X X X X X X X X XSpawning X X X X X XIncubation X X X X X XFry X X X X X XJuvenile X X X X X X X X X X X XMigration
Bulltrout
Adult X X X X X X X X X X X XSpawning X X X X XIncubation X X X X XLarval X X X X X XJuvenile X X X X X X X X X X X XMigration X X X X X X
LostRiver
sucker
Adult X X X X X X X X X X X XSpawning X X X XLarval X X X XFry X X X X XJuvenile X X X X X X X X X X X X
Shortnose
sucker
Migration

UPPER KLAMATH LAKE DRAINAGE TMDL AND WQMPCHAPTER I - OVERVIEW AND BACKGROUND
OREGON DEPARTMENT OF ENVIRONMENTAL QUALITY - MAY 2002PAGE 16
Bull TroutA native of the Upper Klamath Lake drainage, Bull
Trout (Salvelinus confluentus) was listed in 1998 by the U.S.Fish and Wildlife Service as threatened within the KlamathBasin (Figure 1-8). Due to anthropogenic changes in theirhabitat, the trout are now restricted to the headwaters of ninesub-drainages and fragmentation has caused residentinbreeding. There is currently an active Bull Trout recoverygroup headed by ODFW with representatives from USFWS, USFS, Klamath Tribes, forest productsindustry, TNC and agricultural groups.
Klamath Falls
ChiloquinAgency
Lake
UpperKlamath
Lake
Will
iam
son
Rive
r
Sprague River
Syca
n Ri
ver
N.F.
S.F.Fishhole Creek
KlamathMarsh
Wood River
Sun Creek
Figure 1-8. Bull Trout Distribution

UPPER KLAMATH LAKE DRAINAGE TMDL AND WQMPCHAPTER I - OVERVIEW AND BACKGROUND
OREGON DEPARTMENT OF ENVIRONMENTAL QUALITY - MAY 2002PAGE 17
Lost River and Shortnose Sucker
Drying sucker fish at the Lost River. Tribal fishing for suckerswas stopped in the mid-1980’s (OWRD, 2001).
The Lost River sucker (Deltistes luxatus) andshortnose sucker (Chasmistes brevirostris) were federallylisted as endangered on July 18, 1988, because they were atrisk of extinction owing to significant population declines withcontinued downward trends, a lack of recent recruitment,range reduction, habitat loss/degradation and fragmentation,potential hybridization, competition and predation by exoticfishes, and other factors (USFWS 1988). These fish were once very abundant and were importantseasonal foods of native Americans and white settlers in the upper Klamath River basin (Cope 1879,Gilbert 1898, Howe 1968). Spawning migrations occurred in the spring at a critical time when winter foodstores had been exhausted. The Klamath and Modoc Indians dried suckers for later use. It wasestimated that the aboriginal harvest at one site on the Lost River may have been 50 tons annually (Stern1966). In 1959, suckers were made a game species under Oregon State law; however, the game fisherywas terminated in 1987, just prior to federal listing. Lost River suckers and Shortnose suckers are called“lake suckers” because they primarily occur in lake (lacustrine) habitats. This contrasts with the majorityof sucker species, which are riverine. Figure 1-9 indicates the distribution of suckers in the UpperKlamath Lake drainage.

UPPER KLAMATH LAKE DRAINAGE TMDL AND WQMPCHAPTER I - OVERVIEW AND BACKGROUND
OREGON DEPARTMENT OF ENVIRONMENTAL QUALITY - MAY 2002PAGE 18
Klamath Falls
ChiloquinAgency
Lake
UpperKlamath
Lake
Wil l
iam
son
Rive
r
Sprague River
Syca
n Ri
ver
N.F.
S.F.Fishhole Creek
KlamathMarsh
Woo d River
Sun Creek
Figure 1-9. Lost River and Shortnose Sucker Distribution
UPPER KLAMATH LAKE DRAINAGE TMDL AND WQMPCHAPTER I - OVERVIEW AND BACKGROUND
OREGON DEPARTMENT OF ENVIRONMENTAL QUALITY - MAY 2002PAGE 19
Redband Trout
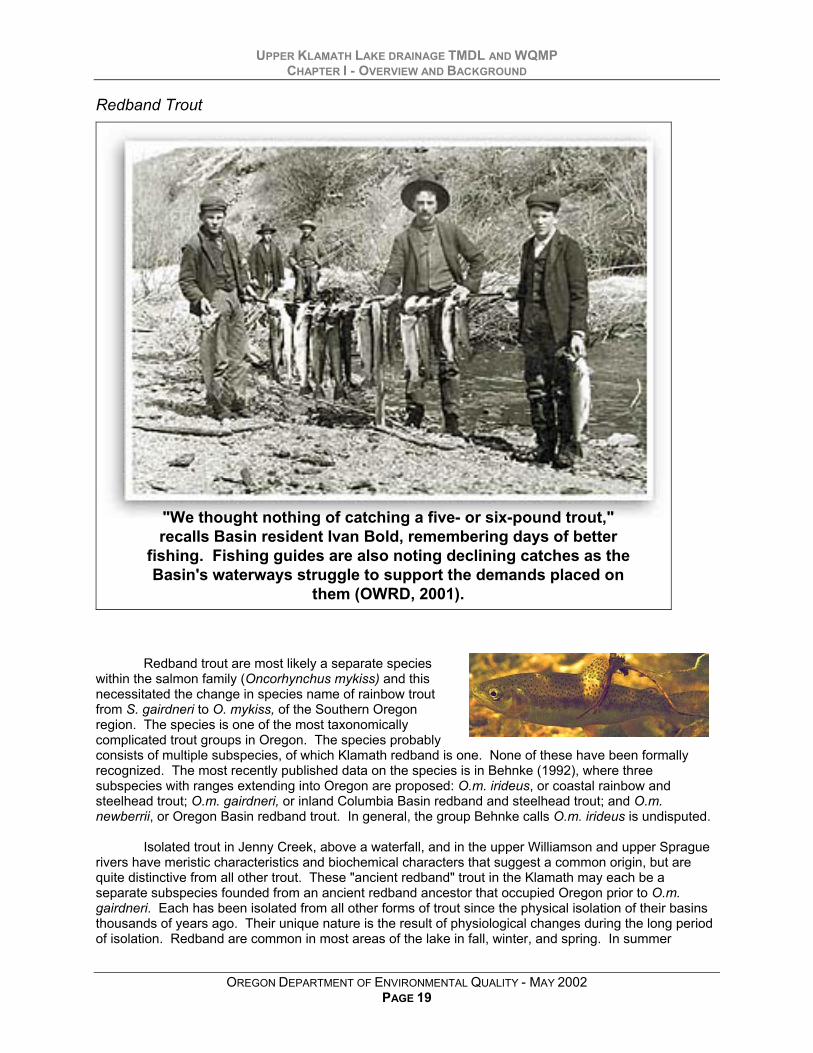
"We thought nothing of catching a five- or six-pound trout,"recalls Basin resident Ivan Bold, remembering days of better
fishing. Fishing guides are also noting declining catches as theBasin's waterways struggle to support the demands placed on
them (OWRD, 2001).
Redband trout are most likely a separate specieswithin the salmon family (Oncorhynchus mykiss) and thisnecessitated the change in species name of rainbow troutfrom S. gairdneri to O. mykiss, of the Southern Oregonregion. The species is one of the most taxonomicallycomplicated trout groups in Oregon. The species probablyconsists of multiple subspecies, of which Klamath redband is one. None of these have been formallyrecognized. The most recently published data on the species is in Behnke (1992), where threesubspecies with ranges extending into Oregon are proposed: O.m. irideus, or coastal rainbow andsteelhead trout; O.m. gairdneri, or inland Columbia Basin redband and steelhead trout; and O.m.newberrii, or Oregon Basin redband trout. In general, the group Behnke calls O.m. irideus is undisputed.
Isolated trout in Jenny Creek, above a waterfall, and in the upper Williamson and upper Spraguerivers have meristic characteristics and biochemical characters that suggest a common origin, but arequite distinctive from all other trout. These "ancient redband" trout in the Klamath may each be aseparate subspecies founded from an ancient redband ancestor that occupied Oregon prior to O.m.gairdneri. Each has been isolated from all other forms of trout since the physical isolation of their basinsthousands of years ago. Their unique nature is the result of physiological changes during the long periodof isolation. Redband are common in most areas of the lake in fall, winter, and spring. In summer
UPPER KLAMATH LAKE DRAINAGE TMDL AND WQMPCHAPTER I - OVERVIEW AND BACKGROUND
OREGON DEPARTMENT OF ENVIRONMENTAL QUALITY - MAY 2002PAGE 20
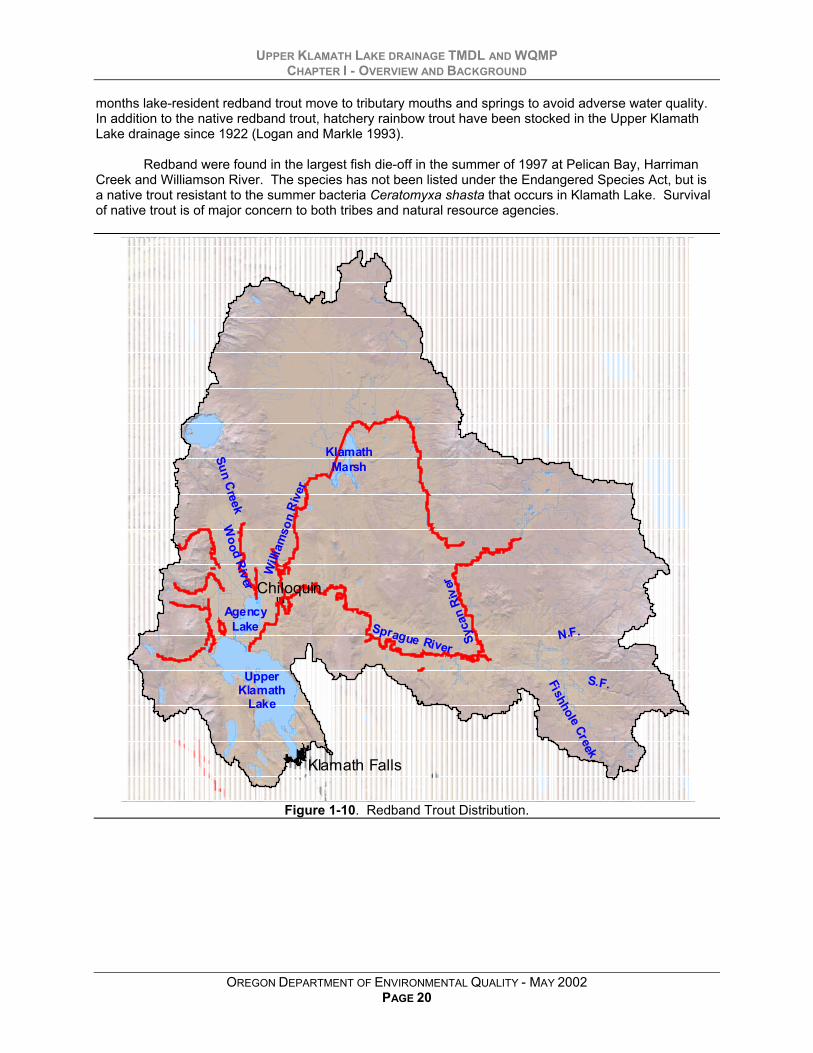
months lake-resident redband trout move to tributary mouths and springs to avoid adverse water quality.In addition to the native redband trout, hatchery rainbow trout have been stocked in the Upper KlamathLake drainage since 1922 (Logan and Markle 1993).
Redband were found in the largest fish die-off in the summer of 1997 at Pelican Bay, HarrimanCreek and Williamson River. The species has not been listed under the Endangered Species Act, but isa native trout resistant to the summer bacteria Ceratomyxa shasta that occurs in Klamath Lake. Survivalof native trout is of major concern to both tribes and natural resource agencies.
Klamath Falls
ChiloquinAgency
Lake
UpperKlamath
Lake
Will
iam
son
Rive
r
Sprague River
Syca
n Ri
ver
N.F.
S.F.Fishhole Creek
KlamathMarsh
Woo d R
iver
Sun Creek
Figure 1-10. Redband Trout Distribution.
UPPER KLAMATH LAKE DRAINAGE TMDL AND WQMPCHAPTER I - OVERVIEW AND BACKGROUND
OREGON DEPARTMENT OF ENVIRONMENTAL QUALITY - MAY 2002PAGE 21
Klamath Falls
ChiloquinAgency
Lake
UpperKlamath
Lake
Will
i am
son
Riv
er
Sprague River
Syca
n Ri
ver
N.F.
S.F.Fishhole Creek
KlamathMarsh
Wood River
Sun Creek
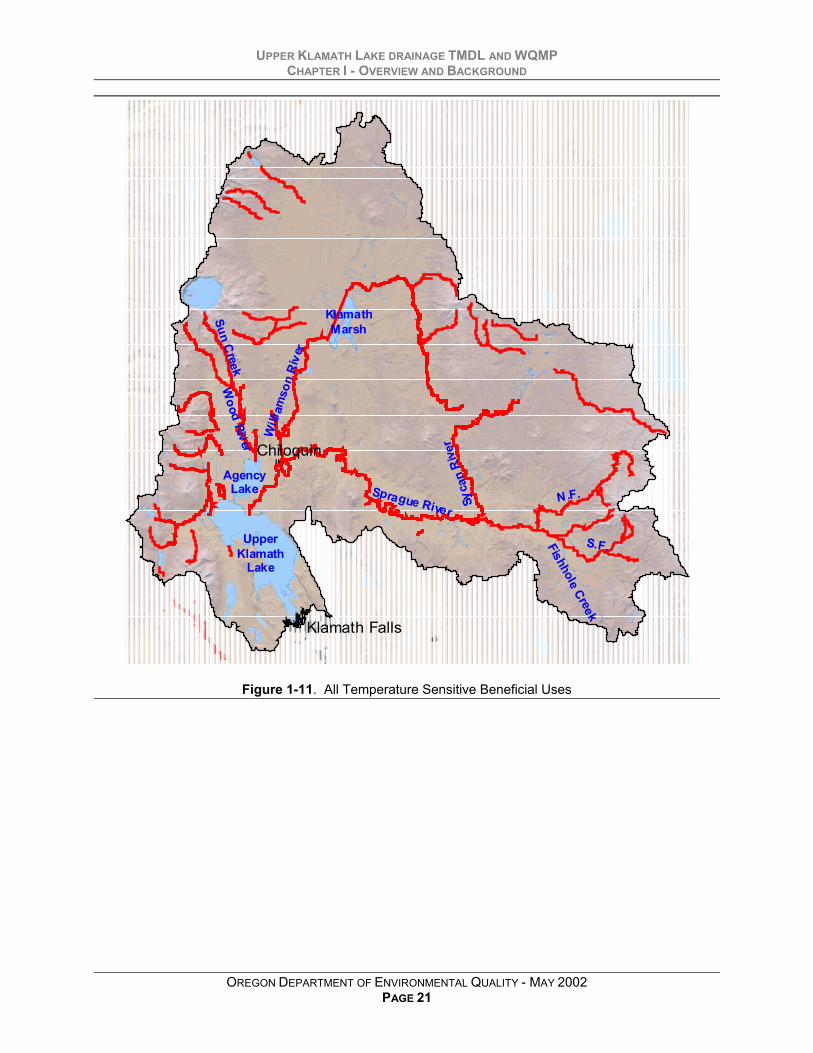
Figure 1-11. All Temperature Sensitive Beneficial Uses
UPPER KLAMATH LAKE DRAINAGE TMDL AND WQMPCHAPTER I - OVERVIEW AND BACKGROUND
OREGON DEPARTMENT OF ENVIRONMENTAL QUALITY - MAY 2002PAGE 22
1.4 EXISTING WATER QUALITY PROGRAMS
1.4.1 Oregon Forest Practices ActThe Oregon Forest Practices Act (FPA, 1994) contains regulatory provisions that include the
objectives to classify and protect water resources, reduce the impacts of clearcut harvesting, maintain soiland site productivity, ensure successful reforestation, reduce forest management impacts to anadromousfish, conserve and protect water quality and maintain fish and wildlife habitat, develop cooperativemonitoring agreements, foster public participation, identify stream restoration projects, recognize thevalue of bio-diversity and monitor/regulate the application of chemicals. Oregon’s Department of Forestry(ODF) has adopted Forest Practice Administrative Rules (1997) that define allowable actions on State,County and private forestlands. Forest Practice Administrative Rules allow revisions and adjustments tothe regulatory parameters it contains. Several revisions have been made in previous years and it isexpected that the ODF, in conjunction with ODEQ, will continue to monitor the success of the ForestPractice Administrative Rules and make appropriate revisions when necessary to address water qualityconcerns.
1.4.2 Senate Bill 1010Senate Bill 1010 allows the Oregon Department of Agriculture (ODA) to develop Water Quality
Management Plans for agricultural lands where such actions are required by State or Federal Law, suchas TMDL requirements. The Water Quality Management Plan should be crafted in such a way thatlandowners in the local area can prevent and control water pollution resulting from agricultural activities.Local stakeholders will be asked to take corrective action against identified problems such as soil erosion,nutrient transport to waterways and degraded riparian areas. It is ODA’s intent to establish Water QualityManagement Plans on a voluntary basis. However, Senate Bill 1010 allows ODA to use civil penaltieswhen necessary to enforce against agriculture activity that is found to transgress parameters of anapproved Water Quality Management Plan. ODA has expressed a desire to work with the localstakeholders and other State and Federal agencies to formulate and enforce approved Water QualityManagement Plans.
1.4.3 Oregon PlanThe State of Oregon has formed a partnership between Federal and State agencies, local groups
and grassroots organizations, that recognizes the attributes of aquatic health and their connection to thehealth of salmon populations. The Oregon Plan considers the condition of salmon as a critical indicator ofecosystems (CSRI, 1997). The decline of salmon populations has been linked to impoverishedecosystem form and function. Clearly stated, the Oregon Plan has committed the State of Oregon to thefollowing obligations: an ecosystem approach that requires consideration of the full range of attributes ofaquatic health, focuses on reversing factors decline by meeting objectives that address these factors,develops adaptive management and a comprehensive monitoring strategy, and relies on citizens andconstituent groups in all parts of the restoration process.
The intent of the Oregon Plan is to conserve and restore functional elements of the ecosystemthat supports fish, wildlife and people. In essence, the Oregon Plan is different from the traditionalagency approach, and instead, depends on sustaining a local-state-federal partnership. Specifically, theOregon Plan is designed to build on existing State and Federal water quality programs, namely: CoastalZone Non-point Pollution Control Programs, the Northwest Forest Plan, Oregon’s Forest Practices Act,Oregon’s Senate Bill 1010 and Oregon’s Total Maximum Daily Load Program.
UPPER KLAMATH LAKE DRAINAGE TMDL AND WQMPCHAPTER I - OVERVIEW AND BACKGROUND
OREGON DEPARTMENT OF ENVIRONMENTAL QUALITY - MAY 2002PAGE 23
1.4.4 Northwest Forest PlanIn response to environmental concerns and litigation related to timber harvest and other
operations on Federal Lands, the United States Forest Service (USFS) and the Bureau of LandManagement (BLM) commissioned the Forest Ecosystem Management Assessment Team (FEMAT) toformulate and assess the consequences of management options. The assessment emphasizesproducing management alternatives that comply with existing laws and maintaining the highestcontribution of economic and social well being. The “backbone” of ecosystem management is recognizedas constructing a network of late-succession forests and an interim and long-term scheme that protectsaquatic and associated riparian habitats adequate to provide for threatened species and at risk species.Biological objectives of the Northwest Forest Plan include assuring adequate habitat on Federal lands toaid the “recovery” of late-succession forest habitat-associated species listed as threatened under theEndangered Species Act and preventing species from being listed under the Endangered Species Act.
1.5 PUBLIC INVOLVEMENTTechnical and citizens advisory committees were formed to review and comment on the approach
used for developing the TMDLs and WQMP. Committees were composed of local scientists and stakeholders representing DMAs and representatives of various land uses. The technical advisory committeewas first convened in October 1998. The citizen’s advisory committee was first convened in February1999. The advisory committees were convened periodically during the TMDL development process togain feedback from local scientists and stakeholders. Valuable contributions from the committees includecomments concerning method development, data collection, data analyses and TMDLs documentation.Public attendance and participation at committee meetings during committee meetings was encouraged.
1.6 DATA SOURCESData utilized for the development of the TMDLs was drawn from a variety of sources.
Attachment 2 provides a complete list of data received for consideration in the development of TMDLsfor Upper Klamath and Agency Lakes. Figure 2-2 depicts the locations of data collection sites listed inAttachment 2. It is important to note that some of the data collected cannot be used for calculation ofnutrient loads to Upper Klamath and Agency Lakes because flow data was not collected in conjunctionwith nutrient data. A large portion of the data collected for lake nutrient TMDL development was providedby others, including: US Bureau of Reclamation, US Forest Service, Oregon Water ResourcesDepartment, US Geological Survey and Oregon State University Extension Service.

UPPER KLAMATH LAKE DRAINAGE TMDL AND WQMPCHAPTER II – UPPER KLAMATH AND AGENCY LAKES TMDL
24 OREGON DEPARTMENT OF ENVIRONMENTAL QUALITY - MAY 2002PAGE 24
UPPER KLAMATH LAKE DRAINAGE TMDL AND WQMPCHAPTER II – UPPER KLAMATH AND AGENCY LAKES TMDL
OREGON DEPARTMENT OF ENVIRONMENTAL QUALITY - MAY 2002PAGE 25
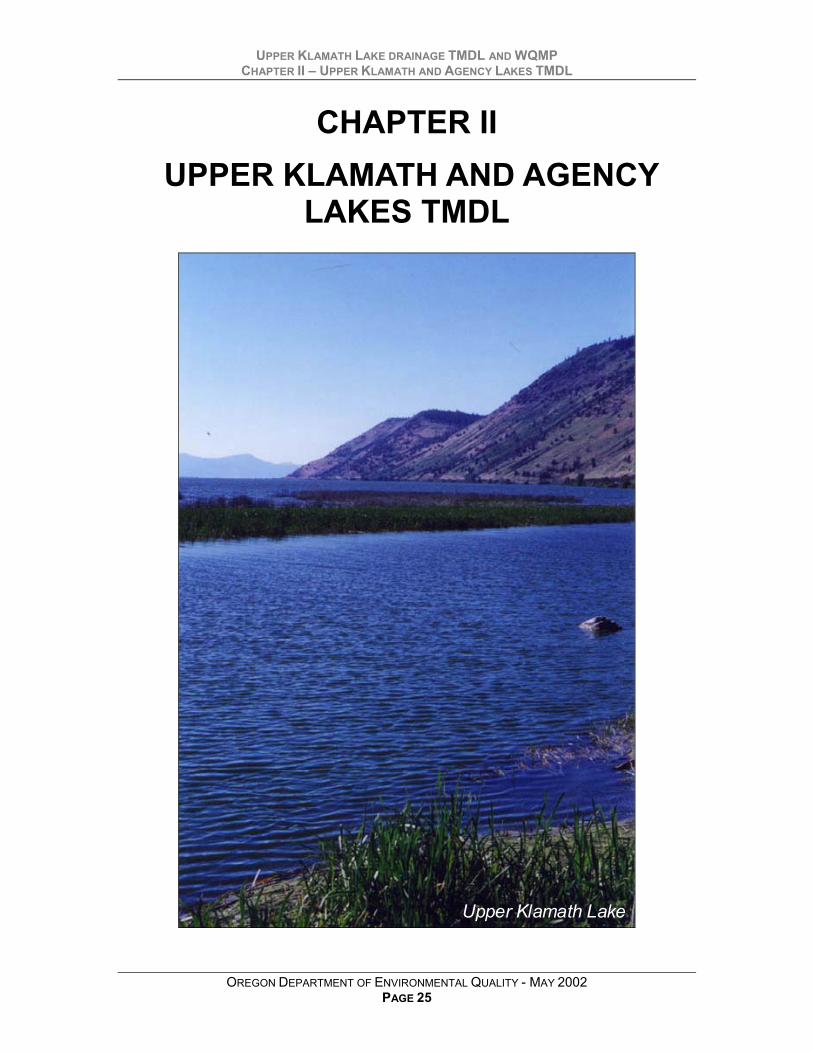
CHAPTER II UPPER KLAMATH AND AGENCY
LAKES TMDL
Upper Klamath Lake
UPPER KLAMATH LAKE DRAINAGE TMDL AND WQMPCHAPTER II – UPPER KLAMATH AND AGENCY LAKES TMDL
OREGON DEPARTMENT OF ENVIRONMENTAL QUALITY - MAY 2002PAGE 26
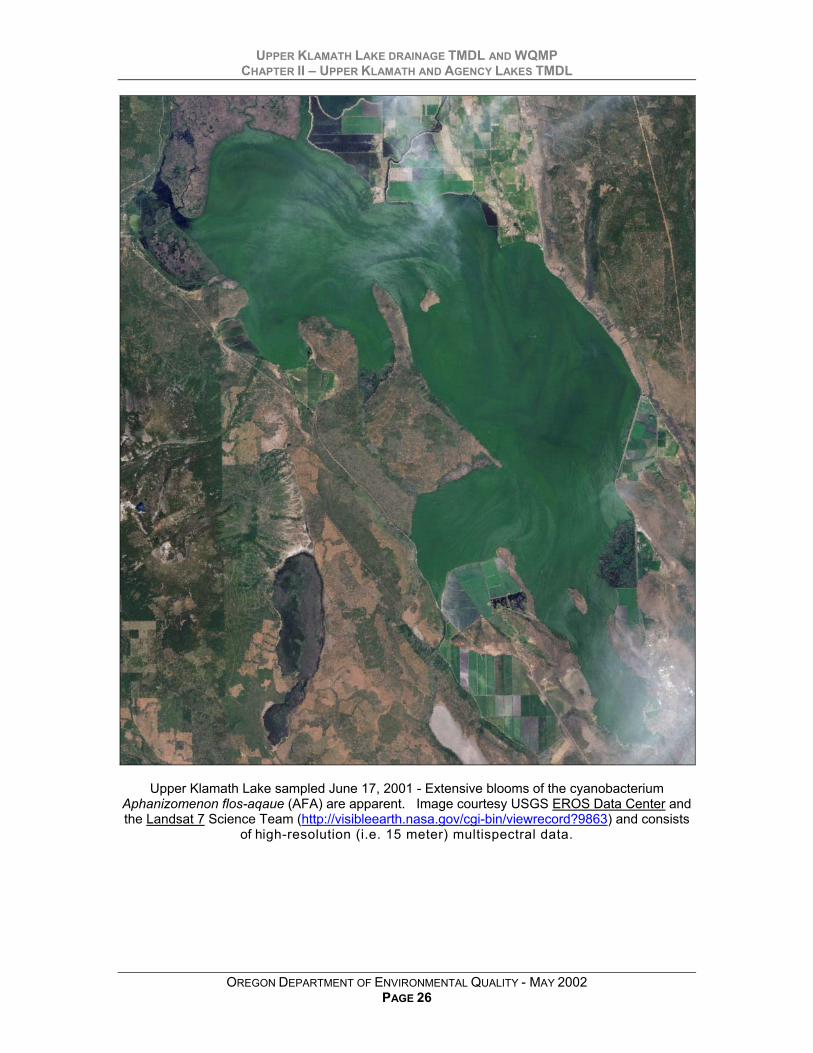
Upper Klamath Lake sampled June 17, 2001 - Extensive blooms of the cyanobacteriumAphanizomenon flos-aqaue (AFA) are apparent. Image courtesy USGS EROS Data Center andthe Landsat 7 Science Team (http://visibleearth.nasa.gov/cgi-bin/viewrecord?9863) and consists
of high-resolution (i.e. 15 meter) multispectral data.
UPPER KLAMATH LAKE DRAINAGE TMDL AND WQMPCHAPTER II – UPPER KLAMATH AND AGENCY LAKES TMDL
OREGON DEPARTMENT OF ENVIRONMENTAL QUALITY - MAY 2002PAGE 27
2.1 INTRODUCTION“The term eutrophic is often associated with adverse water quality condition (pollution),whereas in reality, a body of water may be both ecologically “healthy” and eutrophic.Historically UKL [Upper Klamath Lake] was a productive (eutrophic) and diverseecosystem. It is presently a hypereutrophic system that frequently experiences suchpoor water quality as to be lethal to its native species (Saiki and Monda 1993). Thusstatements such as UKL [Upper Klamath Lake] has always been a eutrophic system”should not be used as an excuse for inaction nor construed to mean that the system waspolluted or unhealthy… The argument that it is useless to reduce nutrient loadingbecause the lake will still be eutrophic indicates a misunderstanding of trophic levelclassifications.”
-Gearheart et al. 1995
Upper Klamath and Agency Lakes are large (235.4 and 35.6 km2, respectively), shallow(mean depth approximately 2 meters), hypereutrophic lake system located in south-centralOregon just east of the Cascades. Low dissolved oxygen and pH water quality violations haveled to the 1998 303(d) listing of both Upper Klamath and Agency Lakes. This TMDL will coverboth lake systems for dissolved oxygen and pH.
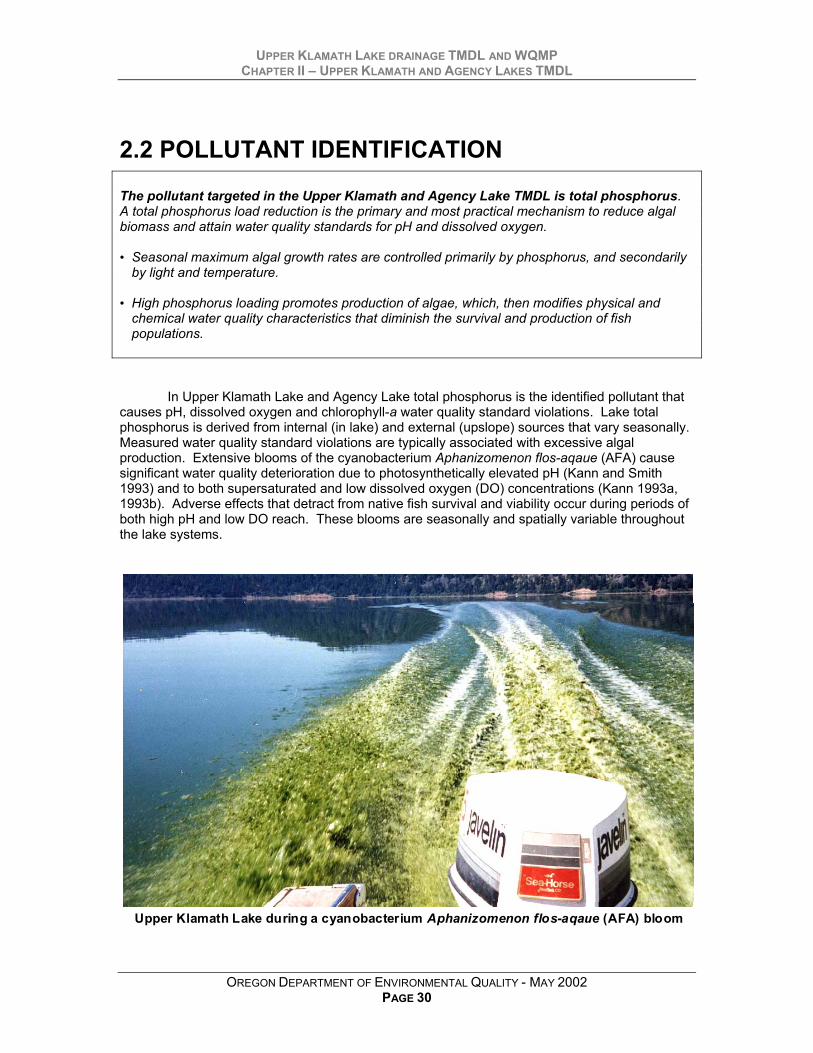
Low dissolved oxygen and high pH levels have been linked to high algal productivity inboth lakes (Kann and Walker, 2001 and Walker 2001). Chlorophyll-a concentrations exceeding200 µg/l are frequently observed in the summer months (Kann and Smith, 1999). Algal bloomsare accompanied or followed by excursions from Oregon’s water quality standards for pH,dissolved oxygen and free ammonia. Water quality standards are established to protect thebeneficial uses of Upper Klamath and Agency Lakes. The most sensitive beneficial uses areprotected aquatic resources, including the endangered species (shortnose sucker, Lost Riversucker), and interior redband trout. Based upon monitored levels of dissolved oxygen, pH andchlorophyll-a, both Agency Lake and Upper Klamath Lake have been designated as water qualitylimited for resident fish and aquatic life (ODEQ 303(d) List 1998). The remaining portion of thisTMDL identifies the pollutant, analyzes the sources, develops pollutant loads designed to meetwater quality standards and relates these TMDL targets to water quality compliance.
Historical accounts indicate that Upper Klamath and Agency Lakes were consideredeutrophic 100 years ago. However, over that time period there have been numerous land andwater use changes that have impacted watershed hydrologic regimes and nutrient exportcharacteristics of the drainage. Land use practices have also affected nutrient cycling andleaching through the loss of wetlands. The hydrology of the lake has been changed by increasesin upland water yields, by extensive diking and draining of seasonal wetland/marsh areas, bywater diversions from tributaries entering the lake, by diversion of water out of the lake, and bythe construction of a dam at the lake’s outlet in 1921 that allows the lake to be operated as astorage reservoir. As a result, both the timing and quantity of the lake flushing flows and nutrientretention dynamics have been altered, and lake surface elevation and volume are seasonallyreduced below historic levels.
There have also been major changes in management of the watershed resulting indegradation of riparian corridors, and the conversion of 35,000 acres of wetlands to pasture andagriculture on the lake periphery itself (Gearheart et al. 1995; Risley and Laenen 1999). TheEnvironmental Protection Agency Index of Watershed Indicators (EPA 1998) indicates that atleast 110,000 acres of the watershed have been converted to irrigated pasture or otheragricultural activities. Risley and Laenen (1999) show an eleven-fold increase in permittedirrigated land acreage between 1900 and the present. Most of these 110,000 acres occur in
UPPER KLAMATH LAKE DRAINAGE TMDL AND WQMPCHAPTER II – UPPER KLAMATH AND AGENCY LAKES TMDL
OREGON DEPARTMENT OF ENVIRONMENTAL QUALITY - MAY 2002PAGE 28
riparian and flood plain areas, with the majority being flood-irrigated. These watershed land usechanges are consistent with the types of activities that would cause altered hydraulic regimes(Poff et al. 1997) and increased nutrient loading to tributaries and Upper Klamath and AgencyLakes (Carpenter and Cottingham 1997).
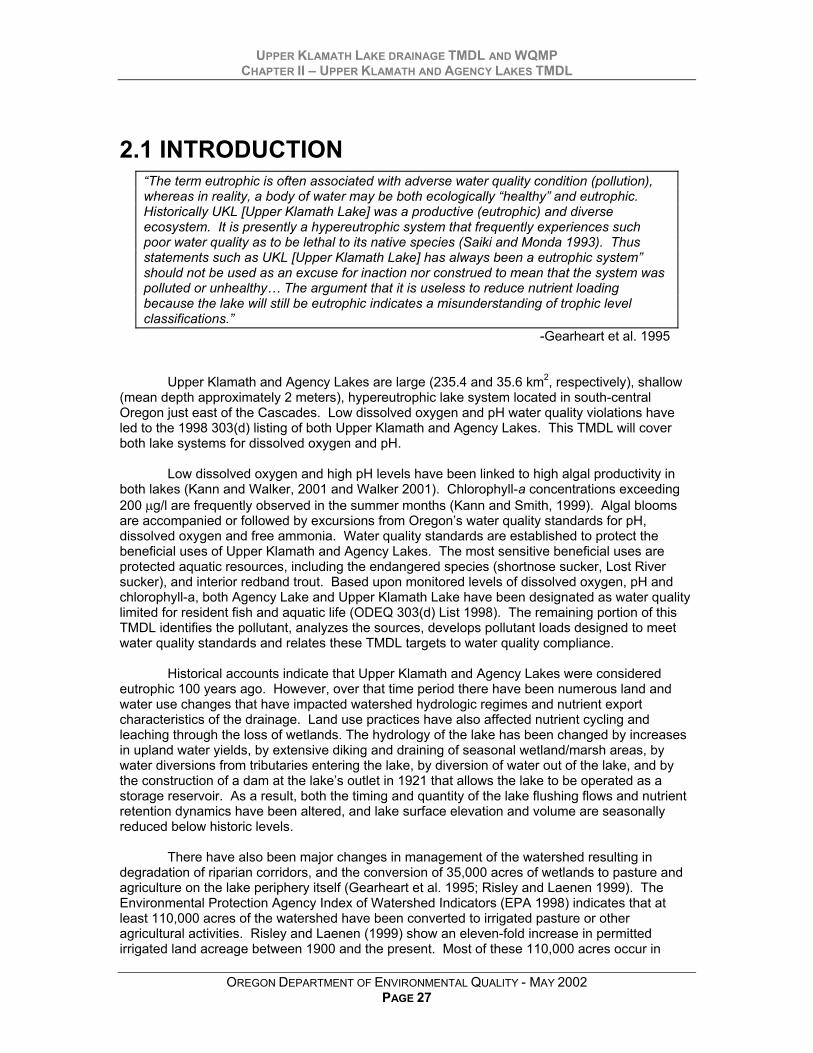
Riparian VegetationRemoval
Channel Armoring andFloodplain Development
Stream Bank ErosionHydrologic
ModificationsHuman related changes to Upper Klamath Lake Drainage
The Upper Klamath Lake TMDL is developed using a large database of lake and uplandinformation that has been, and continues to be, collected by multiple academic efforts,government agencies and the Klamath Tribes (see Attachment 2). Both statistical anddeterministic analytical methods are used to correlate parameters and simulate water quality.Specifically, a statistical correlation between lake mean total phosphorus, chlorophyll-a and pH isused to justify the use of total phosphorus as a controlling parameter in dealing with adverse pHand dissolved oxygen levels in Upper Klamath Lake. Both internal (i.e. lake generated) andexternal (i.e. watershed generated) sources of total phosphorus are considered in the loadinganalysis. Internal loading of phosphorus from the lake sediments is a large source, producingroughly two thirds of the yearly average total load to the lake water column. External sourcesrepresent the remaining one third of loading to the lake, largely coming from near lake reclaimedwetlands and traditional upland sources of nutrients such as erosion, increased water yields,riparian/wetland disturbance and natural sources such as springs. A model has been developedthat can simulate lake mean pH values based on total phosphorus loading to the lake and othersecondary factors that affect pH such as available light, lake temperature, mean lake depth,season/date, sedimentation and burial processes, and other processes that control nutrientdynamics in the lake. This model is used to demonstrate that reductions in total phosphorusloading to the lake will improve water quality to levels that comply with water quality standards.

UPPER KLAMATH LAKE DRAINAGE TMDL AND WQMPCHAPTER II – UPPER KLAMATH AND AGENCY LAKES TMDL
OREGON DEPARTMENT OF ENVIRONMENTAL QUALITY - MAY 2002PAGE 29
Table 2-1. Upper Klamath Lake pH, Dissolved Oxygen and Chlorophyll-a TMDL Components
WaterbodiesUpper Klamath and Agency Lakes are 303(d) listed. This TMDL applies to both Upper Klamathand Agency Lake and all rivers, streams, springs, pumped and drained discharges that coveypollutants to these lakes or surface waters that eventually drain pollutants into these lakes.
PollutantIdentification Pollutants: Total phosphorus from external sources
Target Identification(Applicable WaterQuality Standards)
CWA §303(d)(1)
pH OAR 340-41-962(2)(d): pH (hydrogen ion concentration) values shall not fall outside theranges identified in paragraphs (A) and (B) of this subsection. The following exception applies:Waters impounded by dams existing on January 1, 1996, which have pHs that exceed thecriteria shall not be considered in violation of the standard if the Department determines thatthe exceedance would not occur without the impoundment and that all practicable measureshave been taken to bring the pH in the impounded waters into compliance with the criteria: (A)Fresh waters except Cascade lakes: pH values shall not fall outside the range of 6.5 – 9.0.When greater than 25 percent of ambient measurements taken between June and Septemberare greater than pH 8.7, and as resources are available according to priorities set by theDepartment, the Department shall determine whether the values higher than 8.7.
Dissolved OxygenOAR 340-41-962 (2)(E): For waterbodies identified by the Department as providing cool-wateraquatic life, the dissolved oxygen shall not be less than 6.5 mg/l as an absolute minimum. Atthe discretion of the Department, when the Department determines that adequate informationexists, the dissolved oxygen shall not fall below 6.5 mg/l as a 30-day mean minimum, 5.0 mg/las a seven-day minimum mean, and shall not fall below 4.0 mg/l as an absolute minimum.
Chlorophyll-aOAR 340-041-150: The following values and implementation program shall be applied to lakes,reservoirs, estuaries and streams, except for ponds and reservoirs less than ten acres in surfacearea, marshes and saline lakes:(1) (b) Nuisance Phytoplankton Growth: Natural lakes that do not stratify, reservoirs, rivers and
estuaries: 0.015 mg/L.Existing Sources
CWA §303(d)(1)Nutrient leaching from reclaimed wetlands and upland sources such as agriculture, forestry andurban runoff and transport to the streams that drain to Upper Klamath Lake.
Seasonal VariationCWA §303(d)(1)
Critical pH, dissolved oxygen and chlorophyll-a conditions occur from June through October.Total phosphorus loading from various pathways occurs year round. Therefore, pollutantloading allocations apply to all seasons.
TMDLLoading Capacityand Allocations40 CFR 130.2(f)40 CFR 130.2(g)40 CFR 130.2(h)
Loading Limits - External Total Phosphorus Delivered to Upper Klamath Lake
Loading Capacity: 109,130 kg external total phosphorus per year
Waste Load Allocations (Point Sources): 1,620 kg external total phosphorus per year
Load Allocations (Non-Point Sources): 107,510 kg external total phosphorus per year
Surrogate Measures40 CFR 130.2(i)
Compliance Monitoring Targets• 110 µg/l annual lake mean total phosphorus concentration• 30 µg/l springtime (March – May) mean total phosphorus concentration• 66 µg/l annual mean total phosphorus concentration fro all inflows to the lake
Margins of SafetyCWA §303(d)(1)
Margins of Safety are demonstrated in critical condition assumptions and are inherent tomethodology. No numeric margin of safety is developed.
Water QualityStandard
Attainment AnalysisCWA §303(d)(1)
• Analytical modeling of TMDL loading capacities demonstrates attainment water qualitystandards
UPPER KLAMATH LAKE DRAINAGE TMDL AND WQMPCHAPTER II – UPPER KLAMATH AND AGENCY LAKES TMDL
OREGON DEPARTMENT OF ENVIRONMENTAL QUALITY - MAY 2002PAGE 30
2.2 POLLUTANT IDENTIFICATION
The pollutant targeted in the Upper Klamath and Agency Lake TMDL is total phosphorus.A total phosphorus load reduction is the primary and most practical mechanism to reduce algalbiomass and attain water quality standards for pH and dissolved oxygen.
• Seasonal maximum algal growth rates are controlled primarily by phosphorus, and secondarilyby light and temperature.
• High phosphorus loading promotes production of algae, which, then modifies physical andchemical water quality characteristics that diminish the survival and production of fishpopulations.
In Upper Klamath Lake and Agency Lake total phosphorus is the identified pollutant thatcauses pH, dissolved oxygen and chlorophyll-a water quality standard violations. Lake totalphosphorus is derived from internal (in lake) and external (upslope) sources that vary seasonally.Measured water quality standard violations are typically associated with excessive algalproduction. Extensive blooms of the cyanobacterium Aphanizomenon flos-aqaue (AFA) causesignificant water quality deterioration due to photosynthetically elevated pH (Kann and Smith1993) and to both supersaturated and low dissolved oxygen (DO) concentrations (Kann 1993a,1993b). Adverse effects that detract from native fish survival and viability occur during periods ofboth high pH and low DO reach. These blooms are seasonally and spatially variable throughoutthe lake systems.
Upper Klamath Lake during a cyanobacterium Aphanizomenon flos-aqaue (AFA) bloom

UPPER KLAMATH LAKE DRAINAGE TMDL AND WQMPCHAPTER II – UPPER KLAMATH AND AGENCY LAKES TMDL
OREGON DEPARTMENT OF ENVIRONMENTAL QUALITY - MAY 2002PAGE 31
A total phosphorus load reduction is the primary mechanism to attain water qualitystandards for pH, dissolved oxygen and algal biomass in Upper Klamath Lake and Agency Lake(Kann and Walker, 2001 and Walker, 2001). Seasonal maximum algal growth rates in UpperKlamath and Agency Lakes, and its subsequent impact on elevated pH and low DO levels, arecontrolled primarily by phosphorus availability, and secondarily by light and temperature. Highlake water nutrient concentrations result from nutrient loading to the lake and nutrients derivedfrom lake sediments and promote correspondingly high production of algae, which, in turn,modifies physical and chemical water quality characteristics that can directly diminish the survivaland production of fish populations. Year to year variations in the timing and development of algalblooms during late spring and early summer are largely temperature dependent.
Under conditions of high nutrient input and adequate light, algae growth rates increase,resulting in an accumulation of biomass. Ultimately a combination of factors (i.e. light penetrationand transmittance through the water column, nutrient availability, water temperature, and otherfactors) limits further growth. As biomass increases and nutrients are accumulated in biomass,the available soluble forms of nitrogen (N) and phosphorus (P) in the lake water columndecrease. Nutrients accumulate seasonally in the biomass and become unavailable for furtherbiomass increase. Lake primary productivity follows a seasonal lifespan, and eventually biomassdies in the fall and deposits in the lake sediments, where decomposition and benthic biochemicalprocesses store (in lake sediments) and liberate (recycle) portions of the nutrients back to thewater column and become available for algal uptake.
Although nitrogen is an important structuring component of the algal communities andoften determines biomass types, phosphorus reduction has been shown to be the most effectiveand practical long-term nutrient management option to control algal biomass (Sas et al., 1989).This is especially true of nitrogen fixing species such as Aphanizomenon, which can augmenttheir nitrogen needs in what may otherwise be a nitrogen limiting system. While nitrogenlimitations may be a factor later in the growing season, there is no evidence that the energyrequirement for nitrogen fixation is actually limiting algal densities during the critical months ofJune and July, when energy supply (solar radiation), algal growth rates, and pH excursionfrequencies are highest.
The chlorophyll-a v. phosphorus and lake mean pH v. chlorophyll-a relationshipsdescribed by Kann (1993; 1998) and Walker (1995) support total phosphorus load reduction asthe management goal for Upper Klamath and Agency Lakes. Empirical relationships developedfrom lake monitoring data reveal:
• There is a statistical relationship between lake total phosphorus concentration andchlorophyll-a concentrations;
• There is a statistical relationship between lake mean pH and chlorophyll-aconcentrations;
A lake-mean total phosphorus concentration of approximately100 µg/l corresponds to amean chlorophyll-a concentration of approximately 66 µg/l and a mean pH of 9.0 in June-July(Figure 2-1).
Violations of water quality standards for dissolved oxygen are directly related to algalproductivity which in turn, is a function of phosphorous loading to Upper Klamath and AgencyLakes. The technical analysis of the water quality data demonstrates that the reduction ofphosphorous loads, while concentrating on anthropogenic sources associated with externalnutrient loading to the Upper Klamath Lake, is addressed to the maximum extent possiblethrough the phosphorous loading capacity. Consequently, development of a TMDL for dissolvedoxygen is performed in conjunction with pH in this chapter.

UPPER KLAMATH LAKE DRAINAGE TMDL AND WQMPCHAPTER II – UPPER KLAMATH AND AGENCY LAKES TMDL
OREGON DEPARTMENT OF ENVIRONMENTAL QUALITY - MAY 2002PAGE 32
Figure 2-1. Empirical Relationship Relating Total Phosphorus, Chlorophyll-a and pH(Walker 2001)
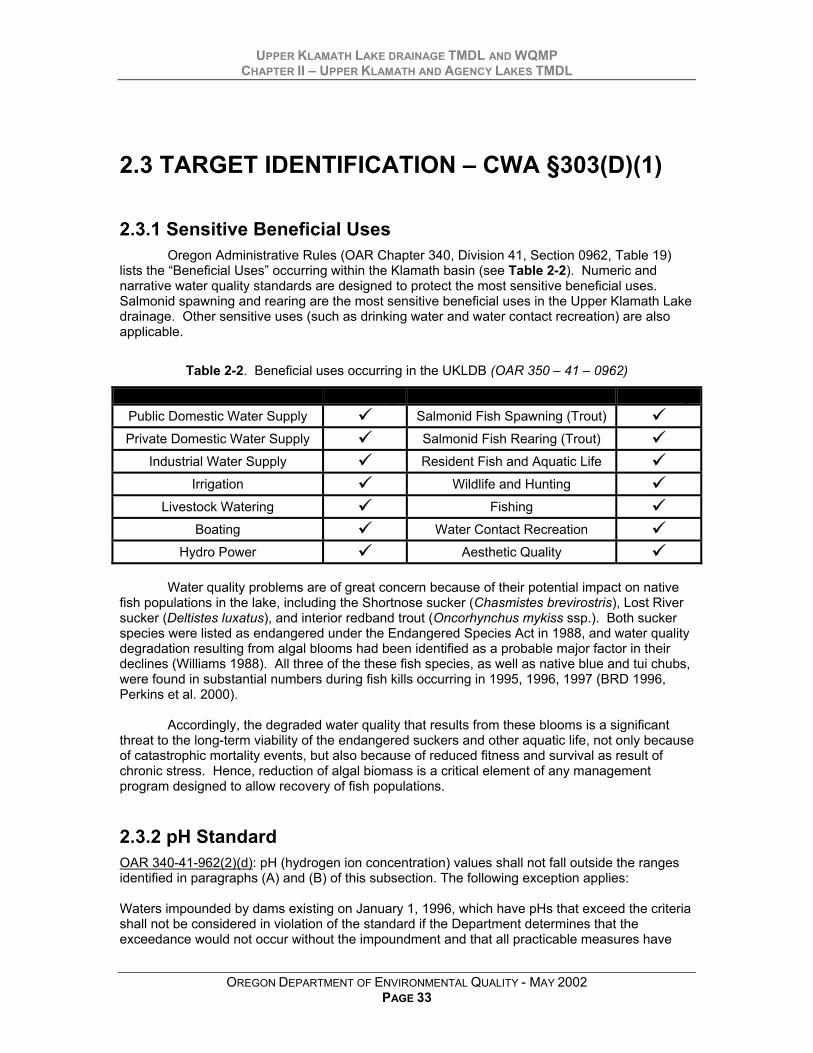
UPPER KLAMATH LAKE DRAINAGE TMDL AND WQMPCHAPTER II – UPPER KLAMATH AND AGENCY LAKES TMDL
OREGON DEPARTMENT OF ENVIRONMENTAL QUALITY - MAY 2002PAGE 33
2.3 TARGET IDENTIFICATION – CWA §303(D)(1)
2.3.1 Sensitive Beneficial UsesOregon Administrative Rules (OAR Chapter 340, Division 41, Section 0962, Table 19)
lists the “Beneficial Uses” occurring within the Klamath basin (see Table 2-2). Numeric andnarrative water quality standards are designed to protect the most sensitive beneficial uses.Salmonid spawning and rearing are the most sensitive beneficial uses in the Upper Klamath Lakedrainage. Other sensitive uses (such as drinking water and water contact recreation) are alsoapplicable.
Table 2-2. Beneficial uses occurring in the UKLDB (OAR 350 – 41 – 0962)
Beneficial Use Occurring Beneficial Use OccurringPublic Domestic Water Supply Salmonid Fish Spawning (Trout)Private Domestic Water Supply Salmonid Fish Rearing (Trout)
Industrial Water Supply Resident Fish and Aquatic LifeIrrigation Wildlife and Hunting
Livestock Watering FishingBoating Water Contact Recreation
Hydro Power Aesthetic Quality
Water quality problems are of great concern because of their potential impact on nativefish populations in the lake, including the Shortnose sucker (Chasmistes brevirostris), Lost Riversucker (Deltistes luxatus), and interior redband trout (Oncorhynchus mykiss ssp.). Both suckerspecies were listed as endangered under the Endangered Species Act in 1988, and water qualitydegradation resulting from algal blooms had been identified as a probable major factor in theirdeclines (Williams 1988). All three of the these fish species, as well as native blue and tui chubs,were found in substantial numbers during fish kills occurring in 1995, 1996, 1997 (BRD 1996,Perkins et al. 2000).
Accordingly, the degraded water quality that results from these blooms is a significantthreat to the long-term viability of the endangered suckers and other aquatic life, not only becauseof catastrophic mortality events, but also because of reduced fitness and survival as result ofchronic stress. Hence, reduction of algal biomass is a critical element of any managementprogram designed to allow recovery of fish populations.
2.3.2 pH StandardOAR 340-41-962(2)(d): pH (hydrogen ion concentration) values shall not fall outside the rangesidentified in paragraphs (A) and (B) of this subsection. The following exception applies:
Waters impounded by dams existing on January 1, 1996, which have pHs that exceed the criteriashall not be considered in violation of the standard if the Department determines that theexceedance would not occur without the impoundment and that all practicable measures have
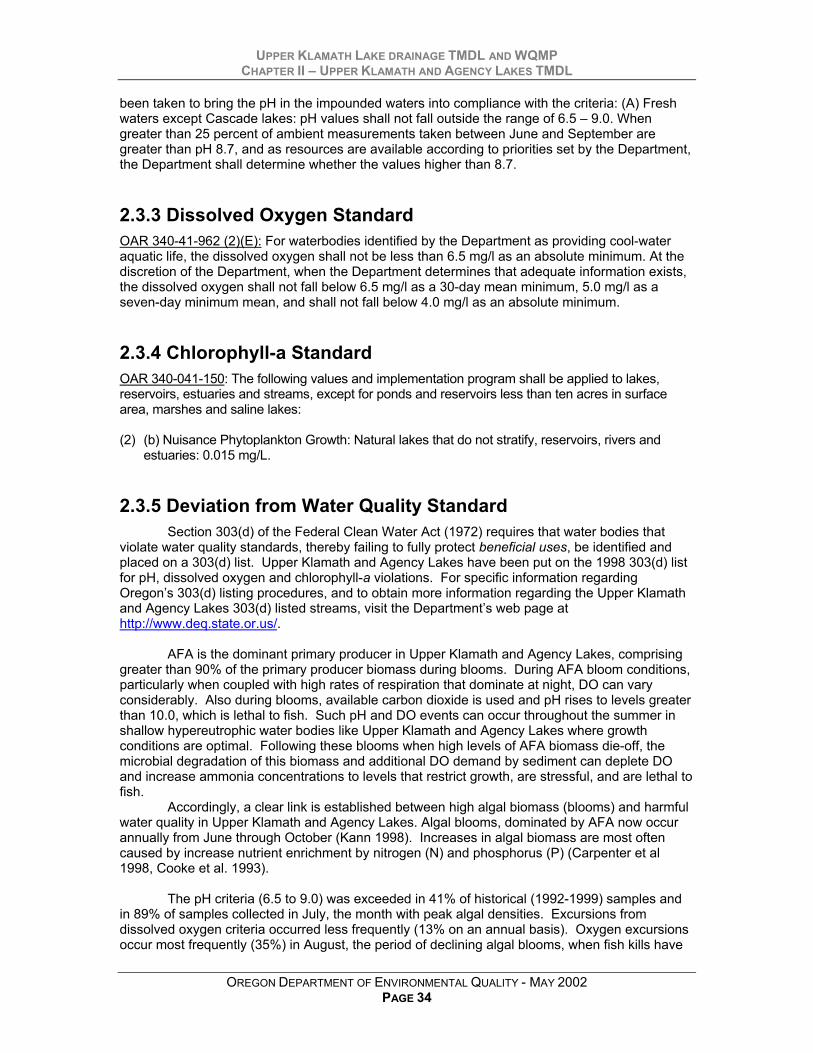
UPPER KLAMATH LAKE DRAINAGE TMDL AND WQMPCHAPTER II – UPPER KLAMATH AND AGENCY LAKES TMDL
OREGON DEPARTMENT OF ENVIRONMENTAL QUALITY - MAY 2002PAGE 34
been taken to bring the pH in the impounded waters into compliance with the criteria: (A) Freshwaters except Cascade lakes: pH values shall not fall outside the range of 6.5 – 9.0. Whengreater than 25 percent of ambient measurements taken between June and September aregreater than pH 8.7, and as resources are available according to priorities set by the Department,the Department shall determine whether the values higher than 8.7.
2.3.3 Dissolved Oxygen StandardOAR 340-41-962 (2)(E): For waterbodies identified by the Department as providing cool-wateraquatic life, the dissolved oxygen shall not be less than 6.5 mg/l as an absolute minimum. At thediscretion of the Department, when the Department determines that adequate information exists,the dissolved oxygen shall not fall below 6.5 mg/l as a 30-day mean minimum, 5.0 mg/l as aseven-day minimum mean, and shall not fall below 4.0 mg/l as an absolute minimum.
2.3.4 Chlorophyll-a StandardOAR 340-041-150: The following values and implementation program shall be applied to lakes,reservoirs, estuaries and streams, except for ponds and reservoirs less than ten acres in surfacearea, marshes and saline lakes:
(2) (b) Nuisance Phytoplankton Growth: Natural lakes that do not stratify, reservoirs, rivers andestuaries: 0.015 mg/L.
2.3.5 Deviation from Water Quality StandardSection 303(d) of the Federal Clean Water Act (1972) requires that water bodies that
violate water quality standards, thereby failing to fully protect beneficial uses, be identified andplaced on a 303(d) list. Upper Klamath and Agency Lakes have been put on the 1998 303(d) listfor pH, dissolved oxygen and chlorophyll-a violations. For specific information regardingOregon’s 303(d) listing procedures, and to obtain more information regarding the Upper Klamathand Agency Lakes 303(d) listed streams, visit the Department’s web page athttp://www.deq.state.or.us/.
AFA is the dominant primary producer in Upper Klamath and Agency Lakes, comprisinggreater than 90% of the primary producer biomass during blooms. During AFA bloom conditions,particularly when coupled with high rates of respiration that dominate at night, DO can varyconsiderably. Also during blooms, available carbon dioxide is used and pH rises to levels greaterthan 10.0, which is lethal to fish. Such pH and DO events can occur throughout the summer inshallow hypereutrophic water bodies like Upper Klamath and Agency Lakes where growthconditions are optimal. Following these blooms when high levels of AFA biomass die-off, themicrobial degradation of this biomass and additional DO demand by sediment can deplete DOand increase ammonia concentrations to levels that restrict growth, are stressful, and are lethal tofish.
Accordingly, a clear link is established between high algal biomass (blooms) and harmfulwater quality in Upper Klamath and Agency Lakes. Algal blooms, dominated by AFA now occurannually from June through October (Kann 1998). Increases in algal biomass are most oftencaused by increase nutrient enrichment by nitrogen (N) and phosphorus (P) (Carpenter et al1998, Cooke et al. 1993).
The pH criteria (6.5 to 9.0) was exceeded in 41% of historical (1992-1999) samples andin 89% of samples collected in July, the month with peak algal densities. Excursions fromdissolved oxygen criteria occurred less frequently (13% on an annual basis). Oxygen excursionsoccur most frequently (35%) in August, the period of declining algal blooms, when fish kills have

UPPER KLAMATH LAKE DRAINAGE TMDL AND WQMPCHAPTER II – UPPER KLAMATH AND AGENCY LAKES TMDL
OREGON DEPARTMENT OF ENVIRONMENTAL QUALITY - MAY 2002PAGE 35
also been observed (Perkins et al., 2000). Accordingly, Upper Klamath and Agency Lake DO,pH, and chlorophyll (algal biomass) have been designated as water quality limited on Oregon’s1998 303(d) list for exceeding DO, pH, and chlorophyll (algal biomass) water quality standards(Table 2-3).
Table 2-3. Agency and Klamath Lake parameters listed on the 1998 303d list.
Waterbody Name Parameter Period
Agency Lake Chlorophyll a SummerAgency Lake pH SummerAgency Lake Dissolved Oxygen (DO) Summer
Upper Klamath Lake Chlorophyll a SummerUpper Klamath Lake pH SummerUpper Klamath Lake Dissolved Oxygen (DO) Summer
2.4 SEASONAL VARIATION - CWA §303(D)(1)Critical pH, dissolved oxygen and chlorophyll-a conditions occur from June through
October. The total phosphorus loading from various pathways occurs year round. Therefore,pollutant loading analysis and allocations applies to all seasons.
Water quality data collection for Upper Klamath Lake and Agency Lake has beenextensive, dating back to the early 1990’s. Contributors include the Klamath Tribes, U.S.Department of the Interior, the U.S. Geological Survey (USBR and USGS), U.S. Forest Serviceand Oregon State University Agriculture Extension Researchers. When comparing water qualitysamples reported by other researchers, there is no evidence that suggests errors (Rykbost andCharlton, 2001).
Total phosphorus data is summarized by monitoring site and data source and ispresented in Attachment 2. The available data for the Upper Klamath Lake system reflects thecomprehensive analytical efforts that have been conducted in the area over the past decade.Water quality sampling locations for Upper Klamath and Agency Lakes and the drainage areshown in Figure 2-2. Summaries of seasonal pH, total phosphorus and chlorophyll-a datacollected at these locations is presented in Figure 2-3.
Overview of Nutrient and Flow Data
Data Collection Sites: 162Date Sources: 11
Total Phosphorus Samples (since 1991): 3,189Corresponding Flow Measurements (since 1991): 510
Upland Total Phosphorus Measurements 1,889Lake Total Phosphorus Measurements 1,275Well Total Phosphorus Measurements 26
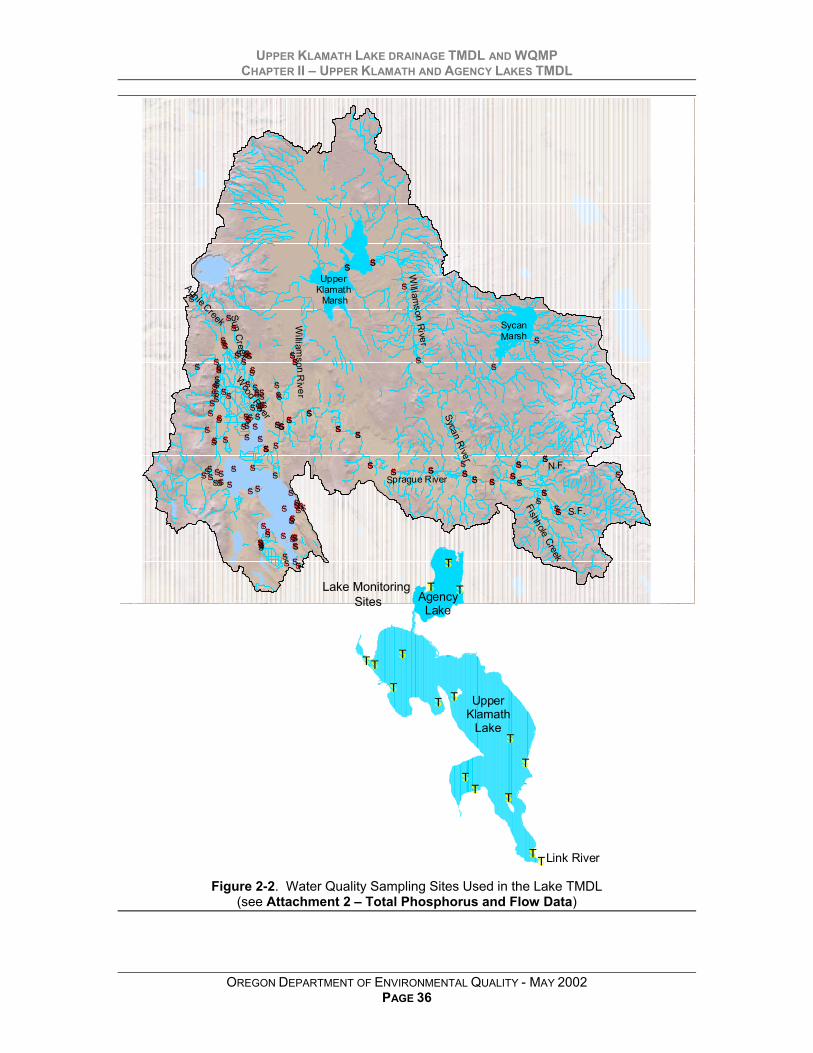
UPPER KLAMATH LAKE DRAINAGE TMDL AND WQMPCHAPTER II – UPPER KLAMATH AND AGENCY LAKES TMDL
OREGON DEPARTMENT OF ENVIRONMENTAL QUALITY - MAY 2002PAGE 36
#S#S
#S
#S
#S
#S#S
#S
#S
#S#S
#S
#S
#S
#S#S
#S#S#S#S
#S#S
#S#S#S#S#S
#S
#S
#S
#S
#S#S#S
#S#S#S#S
#S
#S #S
#S
#S#S
#S#S#S
#S
#S
#S#S#S#S #S
#S #S#S#S#S
#S#S#S
#S
#S#S
#S#S#S
#S#S
#S
#S
#S
#S
#S
#S#S
#S
#S
#S
#S#S
#S
#S#S
#S#S
#S
#S
#S
#S
#S#S#S
#S
#S
#S
#S#S#S
#S
#S
#S
#S
#S
#S
#S
#S
#S
#S
#S
#S
#S
#S
#S
#S
#S
#S
#S
#S#S
#S
#S
#S
#S
#S#S
#S#S
#S
#S#S
#S#S#S
#S
#S
#S
#S
#S
#S
#S#S
#S
#S#S
#S#S #S #S
#S #S #S#S
#S
#S
#S
#S#S
#S#S
#S
#S#S
Sun Cree k
Sycan River
Wood River
Willia m
so n Riv er
Annie Creek
Sprague River
Will iam
son Ri ver
N.F.
S.F.
Fishhole Creek
Upper Klamath
Marsh
SycanMarsh
$T$T
$T
$T
$T
$T$T
$T
$T
$T$T
$T
$T
$T
$T
$T
Link River
AgencyLake
UpperKlamath
Lake
Lake MonitoringSites
Figure 2-2. Water Quality Sampling Sites Used in the Lake TMDL(see Attachment 2 – Total Phosphorus and Flow Data)
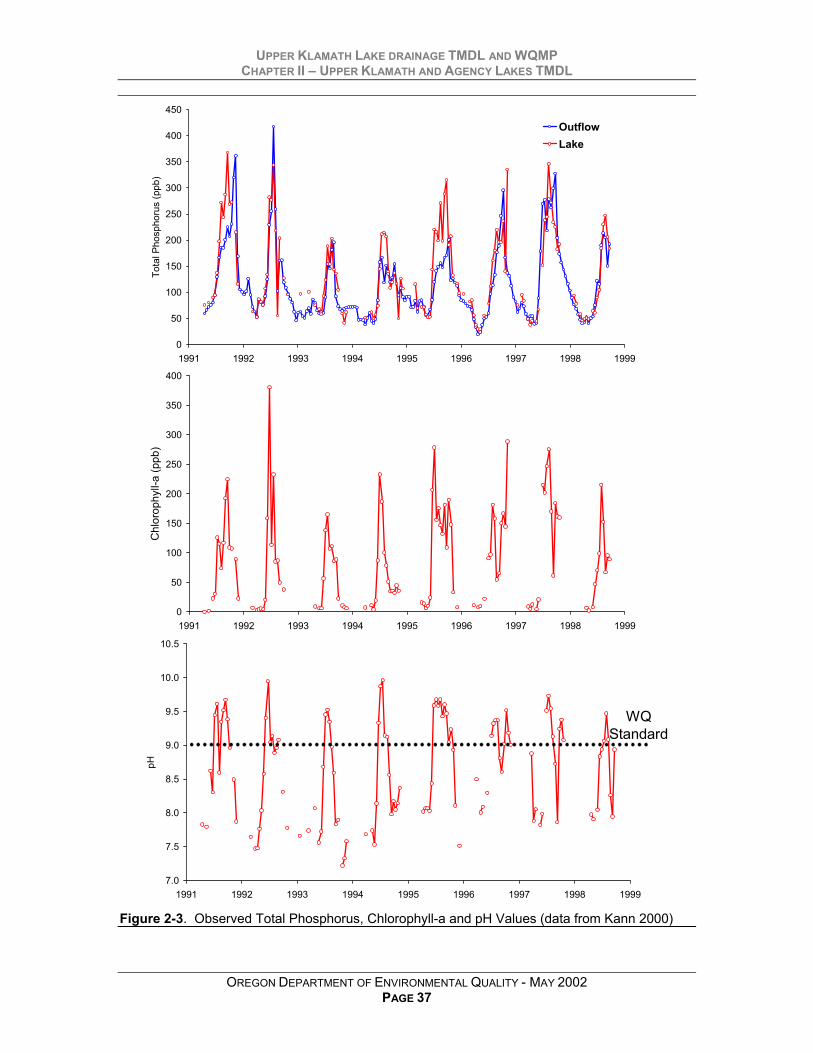
UPPER KLAMATH LAKE DRAINAGE TMDL AND WQMPCHAPTER II – UPPER KLAMATH AND AGENCY LAKES TMDL
OREGON DEPARTMENT OF ENVIRONMENTAL QUALITY - MAY 2002PAGE 37
0
50
100
150
200
250
300
350
400
450
1991 1992 1993 1994 1995 1996 1997 1998 1999
Tota
l Pho
spho
rus
(ppb
)
OutflowLake
0
50
100
150
200
250
300
350
400
1991 1992 1993 1994 1995 1996 1997 1998 1999
Chl
orop
hyll-
a (p
pb)
7.0
7.5
8.0
8.5
9.0
9.5
10.0
10.5
1991 1992 1993 1994 1995 1996 1997 1998 1999
pH
WQStandard
Figure 2-3. Observed Total Phosphorus, Chlorophyll-a and pH Values (data from Kann 2000)

UPPER KLAMATH LAKE DRAINAGE TMDL AND WQMPCHAPTER II – UPPER KLAMATH AND AGENCY LAKES TMDL
OREGON DEPARTMENT OF ENVIRONMENTAL QUALITY - MAY 2002PAGE 38
Critical ConditionAlthough the mass-balance model simulates lake-mean phosphorus concentrations and
the TMDL represents a long-term-average load to the entire system, the derivation considersseasonal and spatial variations in lake water quality. Seasonal variations are considered bysimulation of the entire calendar year and extracting compliance statistics for June and July,historically the period of peak algal growth and pH excursion frequency. Spatial variations(vertical and horizontal) are considered by modeling them as stochastic variations around thelake-mean value on a given sampling date. The approach therefore incorporates the “criticalcondition” concept required for consideration in TMDL development (USEPA 1999).
Nutrient data indicate that Upper Klamath Lake is highly eutrophic (hypereutrophic).Total phosphorus concentrations in the lake can exceed 300 µg/l. Algal productivity is quite high,with chlorophyll-a concentrations exceeding 200 µg/l frequently observed in summer months(Kann and Smith, 1993). Algal blooms usually correspond or precede departures from pH anddissolved oxygen water quality standards. Water quality violations for pH and dissolved oxygengenerally occur from May to November as shown in Figure 2-4.
0%
25%
50%
75%
100%
Jan Feb Mar Apr May Jun Jul Aug Sep Oct Nov Dec
Excu
rsio
n Fr
eque
ncy
pH > 9.0 pH > 9.5DO < 4 DO < 6
Figure 2-4. Seasonal Excursions Frequencies above Water Quality Standards
2.5 SOURCE ASSESMENT - CWA §303(D)(1)
2.5.1 Overview of Phosphorus SourcesSources of phosphorous in the Upper Klamath Lake drainage are distributed across the
landscape from springs in the headwaters to sediments in Upper Klamath and Agency Lakes.Mobilization of phosphorous from agriculture and other nonpoint sources, however, appears tohave pushed the lake into an exaggerated state of eutrophication (NAS, February 2002). Thissection characterizes the following sources of phosphorous in UKLD:
• External sources from uplands• External sources from reclaimed wetlands• Internal sources from lake sediments

UPPER KLAMATH LAKE DRAINAGE TMDL AND WQMPCHAPTER II – UPPER KLAMATH AND AGENCY LAKES TMDL
OREGON DEPARTMENT OF ENVIRONMENTAL QUALITY - MAY 2002PAGE 39
Between 1992 and 1998, detailed in-lake and external nutrient loading data werecollected by multiple parties6 as part of a long-term water quality monitoring program in the UpperKlamath Basin. Utilizing this data, it is possible to develop a time series mass balance forphosphorus and nitrogen at a bi-weekly interval. Results are presented for annual and seasonaltime scales. On an annual average, internal phosphorus loading was approximately 61% of thetotal loading to the lake, while external loading comprised 39% of the total phosphorus sources,with each having a standard deviation of 9%.(see Table 2-4).
Table 2-4. Estimated Average Annual Total Phosphorus Internal and External Load for UpperKlamath and Agency Lakes (1992 – 1998)
(Kann and Walker, 2001)
Water Year
InternalLoad7
(mtons/yr)
ExternalLoad8
(mtons/yr)Total Load(mtons/yr)
PercentInternal Load
PercentExternal
Load1992 294 113 407 72% 28%1993 265 208 473 56% 44%1994 195 112 307 64% 36%1995 394 169 563 70% 30%1996 212 241 453 47% 53%1997 376 220 596 63% 37%1998 257 208 465 55% 45%
Average 285 182 466 61% 39%Stand. Dev. 76 52 96 9% 9%
External total phosphorus loading (i.e. processes that directly load the lake as well assource areas that contribute flow and nutrients to the lake) is the sum of loading fromprecipitation, 7-mile Canal, Wood River, agricultural pumping, springs/ungaged tributaries, andWilliamson River (Kann and Walker, 2001). These external load breakouts are largely due todata collection design, with sites selected where data could be collected at or near the sourcebefore contributing to the lake.
Lake outflow total phosphorus loads tended to increase during high runoff events in thespring. High outflow rates of phosphorus continue into the summer period when external loadinto the lake is low, indicating that phosphorus is internally loaded to the lake from the nutrientrich sediments. Rykbost and Charlton (2001) and Kann and Walker (2001) document elevatedlake mean total phosphorus concentrations in June, July, August, September and October. Theseseasonal increases in lake mean total phosphorus concentrations are the result of internalloading during this period. Large net internal loading events are generally followed by asubstantial decline, indicating a sedimentation event. Such events coincide with algal bloomcrashes where the cause is simply dead algae falling out of the water column and onto the lakesediment (Kann 1998). The increased levels of phosphorus in Upper Klamath and Agency Lakesduring summer months are attributed to increases from internal loading via lake sediments duringthe summer period (Barbiero and Kann 1994; Laenen and LeTourneau 1996; Kann 1998). 6 Nutrient data has been collected by the Klamath Tribes, US Bureau of Reclamation, Oregon State University Extension
Staff, US Geological Survey, Oregon Water Resources Department, Natural Resource Scientists, Inc., WinemaNational Forest and Oregon Department of Environmental Quality. This data is presented in Attachment 2 of thisdocument.
7 Internal loading refers to total phosphorus derived from sediments in the lake. A detailed description of external loadingof nutrients to Upper Klamath Lake is presented in Section 2.5.4.
8 External loading refers to total phosphorus derived from sources other than the water and sediments in the lake. Adetailed description of external loading of nutrients to Upper Klamath Lake is presented in Section 2.5.3.

UPPER KLAMATH LAKE DRAINAGE TMDL AND WQMPCHAPTER II – UPPER KLAMATH AND AGENCY LAKES TMDL
OREGON DEPARTMENT OF ENVIRONMENTAL QUALITY - MAY 2002PAGE 40
Figure 2-5 demonstrates the seasonal (i.e. June through October) increase in lake waterphosphorus concentration that results from increases in internal loading.
Lake Mean Total Phosphorus Concentration data from Kann and Walker (2001)
0
50
100
150
200
Janu
ary
Febr
uary
Mar
ch
Apr
il
May
June
July
Aug
ust
Sep
tem
ber
Oct
ober
Nov
embe
r
Dec
embe
r
Tota
l Pho
phor
us
Conc
entra
tion
(ug/
l)Average
Figure 2-5. Lake Mean Total Phosphorus Concentrations
2.5.2 Lake Response (Sediment Core Analysis)In October 1998, the United States Bureau of Reclamation collected sediment cores from
Upper Klamath Lake in order to determine historic sedimentation rates and algal compositionsdeposited over the last 150 years (Eilers et al, 2001). Results obtained from this investigationindicate that water quality conditions within the lake have changed dramatically as developmentof the surrounding watershed progressed. Specifically, this study showed that the sedimentaccumulation rates (SAR) have substantially increased in the 20th century. In addition, themodern sediments (20th century) are enriched in both nitrogen (N) and phosphorus (P) comparedto pre-settlement sediment. The authors speculate that the increases in nutrient concentrationsmay be affected to various degrees by geochemical reactions within the sediments. However,the study revealed that the changes in concentration were also marked by changes in the N:Pratio and in a qualitative change in the source of nitrogen. Results indicate that changes are due,in part, to anthropogenic influence.
Nitrogen and phosphorus accumulation rates were observed to vary between strata witha significant decrease in the nitrogen to phosphorous ratio (N:P) in the upper (“newer”)sediments. The authors of this study conclude that this N:P ratio shift may be the result of eitherincreased phosphorus loading or a decline of nitrogen fixation from lake biomass. However, theauthors point out that given the abundance of nitrogen fixing algae currently present in the lake, itappears more likely that the phosphorus loading has increased relative to nitrogen loading to thelake.
The authors (Eilers, Kann, Cornett, Moser, Amand, and Gubala) also looked at theproportion of a particular stable isotope of nitrogen (15N) in the sediment cores, which are found athigh levels (compared with 14N). The 15N results from Upper Klamath Lake indicate a significantincrease in the later part of the 20th century following the construction of the dam on the outlet ofthe lake in 1921. This event is generally contemporaneous with an increase in watershed loadingfrom nonpoint sources of nitrogen. These results indicate large inputs of nonpoint sourcepollution from watershed sources (Fry 1999). The authors point out several other factors, such aschanging water temperatures, that may also influence the sediment 15N levels. Like many of thefindings related to studying the sediment core data, an increase in the detection of 15N during the20th century results from complex chemical and hydrological process, but is generally interpretedas an indication that sources of nutrient loading had increased during this period.

UPPER KLAMATH LAKE DRAINAGE TMDL AND WQMPCHAPTER II – UPPER KLAMATH AND AGENCY LAKES TMDL
OREGON DEPARTMENT OF ENVIRONMENTAL QUALITY - MAY 2002PAGE 41
0
5
10
15
20
25
0% 3% 6% 9% 12%
15%
0
5
10
15
20
25
0 5 10 15 201800
1825
1850
1875
1900
1925
1950
1975
2000
0 5 10 15 20
Indication of Lake Water Quality Changes(Eilers et al., 2001)
Aphanizomenon
Sediment core analysis demonstrates that sediment accumulation rates have increased over that past
120 years
Distribution of Blue Green Algae in Sediment Core
Sediment Accumulation Rate (g/m2 yr)
Sedi
men
t Dep
th (c
m)
Sedi
men
t Dep
th (c
m)
Dep
ositi
onal
Yea
r
Nitrogen fixing blue-green algae are now more abundant indicating an increase in phosphorus availability
Figure 2-6. Upper Klamath Lake Sediment Core Analysis (Eilers et al. 2001).
The study utilized stable tracers (titanium and aluminum) because they are not readilyaltered and concentrations can be measured within sediment cores to indicate the history andmagnitude of watershed disturbance. Both of these metals show major increases in the uppersediment layer confirming an increase in post-settlement external sediment inputs to the lake. Analternative explanation for these observed distributions is a rapid decrease in the deposition ofplankton in the 20th century that would cause the external inputs to be proportionally greater thanthe internal inputs. This latter explanation is considered unlikely give the history of the watershedand the current high levels of primary production within the lake system. The authors concludethat the increase in titanium and aluminum provide strong evidence of increased sediment inputsto the lake associated with erosion and land use disturbance occurring within the watershedduring the 20th century.
Finally, the authors of this study investigated algal species composition within layeredsediment strata. Although mixing in the upper sediments prevents temporal periods less than 10years to be compared in the analysis of the history of the Upper Klamath Lake, the resultsdemonstrated a measurable shift in the phytoplankton assemblages in the lake. Specifically,Pediastrum, a green alga, was well-preserved in the sediments and exhibited a sharp decline inthe relative abundance in the upper sediments. However, Aphanizomenon, a cyanobacteria, hasincreased dramatically since the 1900s. It is important to note again that a clear link betweenhigh algal biomass (blooms) and harmful water quality in Upper Klamath and Agency Lake, andsuch algal blooms, dominated by the blue-green alga Aphanizomenon flos-aqaue (AFA) nowoccur annually from June through October (Kann 1998).

UPPER KLAMATH LAKE DRAINAGE TMDL AND WQMPCHAPTER II – UPPER KLAMATH AND AGENCY LAKES TMDL
OREGON DEPARTMENT OF ENVIRONMENTAL QUALITY - MAY 2002PAGE 42
Results obtained from this sediment core analysis highlight the impact of watersheddevelopment over the past century and its direct impact on water quality conditions withinKlamath Lake. Additionally, the reported findings and interpretations provide a strong linkagebetween external anthropogenic sources of nutrients and sediments with the observed increasein abundance of AFA . Sediment core data (i.e. sediment accumulation rates and distributions ofAFA) can be found in Figure 2-6.
2.5.3 External Sources of PhosphorusExternal loading refers to total phosphorus derived from sources other than the water andsediments in the lake. Based on information presented in this section, humans have increasedthe external nutrient loading to the lake largely, but not exclusively, via:
1. Reclaiming and draining near lake wetlands for agricultural uses. Wetland reclamation anduse may account for 29% of the external total phosphorus loading to the lake.
And,
2. Increased water yields and runoff rates in the Williamson and Sprague subbasins have beendocumented in the 1951-1996 period that are independent of climatic conditions. Theseincrease water yields are likely the result of land use and may account for 18% of the externaltotal phosphorus loading to the lake.
Despite high background phosphorus levels in Upper Klamath Lake drainage tributaries,data exists from numerous studies to indicate that external phosphorus loading and concentrationin Upper Klamath Lake are elevated substantially above these background levels (Miller andTash 1967; USACE 1982; Campbell et al. 1993; USGS Water Resources Data 1992-1997; EPAStoret Data 1959-1997). One of the earliest nutrient loading studies (Miller and Tash 1967;updates by USACE 1982) indicates that even though direct agricultural input from pumps andcanals accounting for only 12.4% of the water inflow, these sources account for 31% of theannual external total phosphorus (TP) budget. Snyder and Morace (1997) demonstrate thatnitrogen and phosphorus are liberated from drained wetland areas, leach into adjacent ditches,and are subsequently pumped to the lake or its tributaries. Gearheart et al. (1995) estimated thatover 50% of the annual total phosphorus load from the watershed could be reduced withimproved agricultural management practices. Anderson (1998) likewise estimates that in-laketotal phosphorus concentration can be reduced utilizing watershed management strategies.Rykbost and Charlton (2001) state that “nutrient loading in Klamath Lake is unquestionablyenhanced by the drainage of irrigation water from agricultural properties adjacent to the lake.”
Sources of phosphorus are distributed throughout the Upper Klamath Lake drainage. Forsimplicity, these sources are broken into source areas that contribute directly to the lakephosphorus levels (Kann and Walker, 2001). ODEQ has added point sources (i.e. Chiloquin STPand Crooked Creek Hatchery) of phosphorus that are not considered in the Kann and Walker(2001) loading analysis. The source areas considered in phosphorus load analysis are listed inFigure 2-7 along with the distributions of the contributing drainage area, flow inputs to the lakeand the annual total phosphorus loading received by the lake. Water and nutrient budgetcomponents for Upper Klamath and Agency Lakes were broken into seven major sourcecategories: Williamson River, Sprague River, Wood River, Seven-Mile Canal, agricultural pumps,ungaged springs and tributaries and precipitation received by the lake system.
Phosphorous loading from the two point sources (Chiloquin STP and Crooked Creek FishHatchery) were estimated and are small when compared to the other sources of externalphosphorus loading. Average flow from the hatchery is approximately 10.3 mgd with acorresponding total phosphorous concentration of 0.13 mg/L. Estimated flow and concentrationfrom the Chiloquin STP is 0.1 mgd and 4 mg/L, respectively. Figure 2-7 depicts the relatively
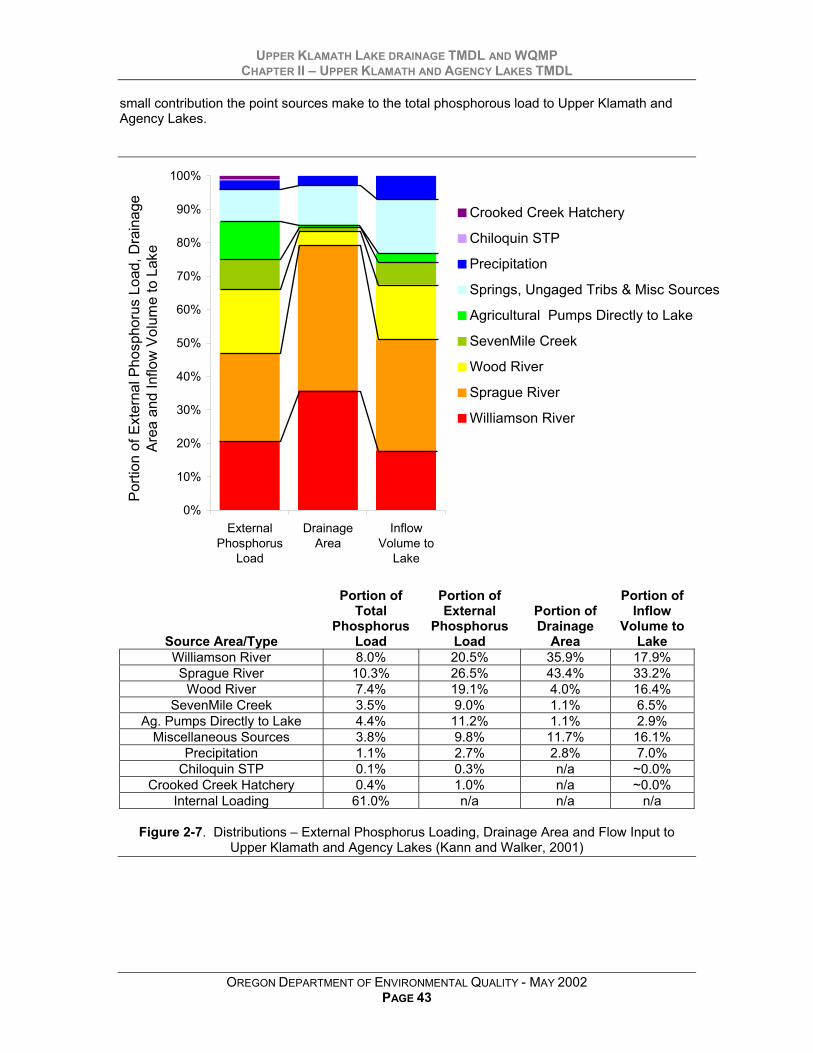
UPPER KLAMATH LAKE DRAINAGE TMDL AND WQMPCHAPTER II – UPPER KLAMATH AND AGENCY LAKES TMDL
OREGON DEPARTMENT OF ENVIRONMENTAL QUALITY - MAY 2002PAGE 43
small contribution the point sources make to the total phosphorous load to Upper Klamath andAgency Lakes.
0%
10%
20%
30%
40%
50%
60%
70%
80%
90%
100%
ExternalPhosphorus
Load
DrainageArea
InflowVolume to
Lake
Dis
trib
utio
n of
Tot
al
Crooked Creek Hatchery
Chiloquin STP
Precipitation
Springs, Ungaged Tribs & Misc Sources
Agricultural Pumps Directly to Lake
SevenMile Creek
Wood River
Sprague River
Williamson River
Porti
on o
f Ext
erna
l Pho
spho
rus
Load
, Dra
inag
e Ar
ea a
nd In
flow
Vol
ume
to L
ake
Source Area/Type
Portion ofTotal
PhosphorusLoad
Portion ofExternal
PhosphorusLoad
Portion ofDrainage
Area
Portion ofInflow
Volume toLake
Williamson River 8.0% 20.5% 35.9% 17.9%Sprague River 10.3% 26.5% 43.4% 33.2%
Wood River 7.4% 19.1% 4.0% 16.4%SevenMile Creek 3.5% 9.0% 1.1% 6.5%
Ag. Pumps Directly to Lake 4.4% 11.2% 1.1% 2.9%Miscellaneous Sources 3.8% 9.8% 11.7% 16.1%
Precipitation 1.1% 2.7% 2.8% 7.0%Chiloquin STP 0.1% 0.3% n/a ~0.0%
Crooked Creek Hatchery 0.4% 1.0% n/a ~0.0%Internal Loading 61.0% n/a n/a n/a
Figure 2-7. Distributions – External Phosphorus Loading, Drainage Area and Flow Input toUpper Klamath and Agency Lakes (Kann and Walker, 2001)

UPPER KLAMATH LAKE DRAINAGE TMDL AND WQMPCHAPTER II – UPPER KLAMATH AND AGENCY LAKES TMDL
OREGON DEPARTMENT OF ENVIRONMENTAL QUALITY - MAY 2002PAGE 44
Using the mass balance developed by Kann and Walker (2001), the Williamson Riverand Sprague River subbasins contribute 51% of the annual flow input to Upper Klamath Lake.The Wood River and Seven Mile Creek accounts for 16% and 7% of the flow inputs, respectively.Other flow inputs to the lake include agricultural pumps (3%), springs and ungage tributaries(16%) and precipitation received by the lake (7%).
Roughly half of the external phosphorus loading to Upper Klamath Lake is derived fromthe Williamson River and Sprague River subbasins. The Wood River contributes 19% of theexternal total phosphorus load. Other external total phosphorus sources include Seven-MileCanal (9%), springs and ungaged tributaries (10%), agricultural pumps (11%) and precipitation(3%). Point sources account for a very small portion of the external total phosphorus loading toUpper Klamath Lake.
The total external phosphorus load delivered to Upper Klamath Lake and Agency Lake isestimated to be 181.6 metric tons9 per year (Kann and Walker, 2001). Figure 2-8 presentsannual external loading to the lake as both an external phosphorus load and a unit areaphosphorus load. Relative contributions of phosphorus from each distributed source area shouldbe made comparing unit area external phosphorus loads. For example, the Williamson Riversubbasin delivers a large external phosphorus load to Upper Klamath Lake (86.4 metric tons peryear) when compared to that contributed from Seven-Mile Creek (16.5 metric tons per year). Thedrainage area of the Williamson River subbasin is large (3501 km2), while the drainage area ofSeven Mile Creek is comparatively small (106 km2). When the production of annual externalphosphorus loading is considered as a unit area load, the Williamson River subbasin contributesconsiderably less phosphorus per square kilometer (11 kg/ km2 per year), while the Seven MileCreek drainage contributes a high rate of loading per unit area (156 kg/ km2 per year).
9 1 metric ton = 1000 kg

UPPER KLAMATH LAKE DRAINAGE TMDL AND WQMPCHAPTER II – UPPER KLAMATH AND AGENCY LAKES TMDL
OREGON DEPARTMENT OF ENVIRONMENTAL QUALITY - MAY 2002PAGE 45
External Phosphorus Load
External Phosphorus Unit Area Load
48.7
37.8
86.4
21.7
13.5
35.2
16.5
20.5
18.1
4.9
0.6
1.9
176.7
181.6
0 20 40 60 80 100 120 140 160 180 200
Sprague River
Williamson River
Williamson River Total
Wood River above Weed Rd.
Wood River below Weed Rd.
Wood River Total
SevenMile Creek
Agricultural Pumps Directly to Lake
Springs, Ungaged Tribs & Misc Sources
Precipitation
Chiloquin STP
Crooked Creek Hatchery
Wetland Sources
Total Tributary/Spring Inflow
Total Inflow
Total Phosphorus Load Export (1000 kg per year)
Current Phosphorus Load
Factored into Nonpoint Source Areas
11.5
10.8
11.2
64.9
237.0
90.0
156.2
188.2
15.8
18.0
18.6
0 50 100 150 200 250
Sprague River
Williamson River
Williamson River Total
Wood River above Weed Rd.
Wood River below Weed Rd.
Wood River Total
SevenMile Creek
Agricultural Pumps Directly to Lake
Springs, Ungaged Tribs & Misc Sources
Precipitation
Chiloquin STP
Crooked Creek Hatchery
Wetland Sources
Total Tributary/Spring Inflow
Total Phosphorus Unit Load Export (kg/km2 per year)
Current Phosphorus Unit Area Load
N/A
N/A
Factored into Nonpoint Source Areas
Figure 2-8. Annual External Total Phosphorus Loads (Kann and Walker, 2001)

UPPER KLAMATH LAKE DRAINAGE TMDL AND WQMPCHAPTER II – UPPER KLAMATH AND AGENCY LAKES TMDL
OREGON DEPARTMENT OF ENVIRONMENTAL QUALITY - MAY 2002PAGE 46
2.5.3.1 Reclaimed Wetlands as an External Source of Phosphorus
“Nutrient loading in Klamath Lake is unquestionably enhanced by the drainage ofirrigation water from agricultural properties adjacent to the lake. Prior to reclamation, allof these properties were either permanent or seasonal wetlands. Following constructionof dikes and drainage systems, the properties were managed for pastures and/or cropproduction. Soils are high in organic matter content and native fertility; therefore pasturesand hay crops on these lands are generally not fertilized. Natural processes associatedwith mineralization of these soils release nutrients subject to transport in drainage water.”
-Rykbost and Charlton, 2001
Wetlands adjacent to Upper Klamath Lake have been drained for the cultivation of cropsand cattle grazing. An extensive effort to reclaim wetlands started in 1889 and continued through1971. Recent scientific efforts demonstrate that reclaimed wetlands can become a source ofphosphorus (Snyder and Morace, 1997) and eventually result in nutrient loading to the UpperKlamath Lake (Bortleson and Fretwell, 1993). In light of these studies, targeted wetlandrestoration is taking place resulting in large reclaimed land areas in various stages of restoration.Figure 2-9 displays the reclaimed wetland acreage for each reclamation project and Figure 2-12displays the cumulative total acreage reclaimed by year. Figure 2-13 displays Upper Klamathand Agency Lake and the associated wetlands.
Turn of the century canalconstruction & wetland draining
Snyder and Morace (1997) quantified the load of total phosphorus from reclaimedwetlands to Upper Klamath Lake by accounting for pumped volumes from drained wetlands andnutrient concentrations of pumped water. The same study also measured and modeled thenutrient loss due to peat decomposition associated with each reclaimed wetland presented inFigure 2-12. Little variation between sites or water years existed in the data. The medianphosphorus unit area load from drained wetlands received by Upper Klamath Lake is ~2 lbs/acreper year (i.e. 220 kg/km2 per year in metric units). Such high rates of annual loading are notdirectly comparable to other source areas in the Upper Klamath Lake Drainage presented inKann and Walker (2001) because values include both lands that drain reclaimed wetlands andthose that do not. However, source areas that drain large areas of reclaimed wetlands do have ahigh rate of phosphorus loading (Table 2-5). This information, along with other studies, indicatesthat reclaimed wetlands are a large source of phosphorus when considered as a unit area and asthe total phosphorus loss from reclaimed wetlands.

UPPER KLAMATH LAKE DRAINAGE TMDL AND WQMPCHAPTER II – UPPER KLAMATH AND AGENCY LAKES TMDL
OREGON DEPARTMENT OF ENVIRONMENTAL QUALITY - MAY 2002PAGE 47
Wetland areas were commonly reclaimed by building dikes to disassociate lake flow,constructing a network of drainage ditches and pumping surface and shallow groundwater to helpdrain the water from the wetland area and lower the water table (Snyder and Morace, 1997). Oneconsequence of lowering the water tables in reclaimed wetlands is an increase in aerobicdecomposition of peat soils that liberates and introduces nutrients, namely nitrogen andphosphorus, into surface waters and shallow groundwater. The transport of this nutrient richwater occurs rapidly via drainage ditches and pumping to the lake or tributaries to the lake. Theperiod of time since drainage coupled with the agricultural use of the reclaimed wetland likelyhave a combined effect on the rate of peat decomposition. Activities that introduce air andoxygenated water into the soils will increase peat decomposition rates and increase nutrientintroduction into water (Snyder and Morace, 1997). Therefore, activities such as disking andfurrowing likely increase peat decomposition. Cattle grazing can cause soil compaction, whichcan slow rates of peat decomposition. Further, simply eliminating mechanical pumping and/orgravity drainage of wetlands slows the decomposition of peat soils and the subsequent transportof nutrients to Upper Klamath Lake.
-6,000
-4,000
-2,000
0
2,000
4,000
6,000
McC
orna
ck P
oint
- 18
89
Woc
us M
arsh
- 18
96
Algo
ma
- 191
4
Cal
edon
ia M
arsh
- 19
16
Ball
Bay
Sout
h - 1
919
Willi
amso
n R
iver
Nor
th -
1920
Cov
e Po
int -
191
9-19
40
Ball
Bay
Wes
t - 1
946-
1947
Woo
d R
iver
Pro
perty
- 19
40-1
957
Agen
cy L
ake
Nor
th -
1962
Agen
cy L
ake
Wes
t - 1
968-
1971
Woo
d R
iver
Pro
perty
- 19
95
Willi
amso
n R
iver
Nor
th -
1997
McC
orna
ck P
oint
- 20
00
Cal
edon
ia M
arsh
- 20
00
Agen
cy L
ake
Nor
th -
2000
Agen
cy L
ake
Wes
t - 2
000
Dra
ined
Wet
land
s th
at C
onne
cted
toU
pper
Kla
mat
h La
ke
(acr
es)
Figure 2-9. Reclaimed wetland acreage by wetland unit. Negative values indicate restoredwetlands (Snyder and Morace, 1997, Snyder, 2001)
Table 2-5. Derived loading rates of phosphorus for areas that drain reclaimed wetlands
Source Areas that Drain ReclaimedWetlands10
Data from Kann and Walker (2001)Median Reclaimed Wetland Load
Data from Snyder and Morace (1997)Wood River below Weed Road
~ 237 kg/km2 per yearAgricultural Pumps
~ 188 kg/km2 per year
~ 220 kg/km2 per year
10 These source areas also drain other lands. Therefore, a direct comparison to between Kann and Walker (1999)
loading rates cannot be made with Snyder and Morace (1997) measured values for loading rates from reclaimedwetlands.
UPPER KLAMATH LAKE DRAINAGE TMDL AND WQMPCHAPTER II – UPPER KLAMATH AND AGENCY LAKES TMDL
OREGON DEPARTMENT OF ENVIRONMENTAL QUALITY - MAY 2002PAGE 48
Geiger (2001) suggests that nutrient loads from restored wetlands previously reclaimedfor agricultural production is influenced by the relative lake-wetland hydraulic connection. Geiger(2001) hypothesizes that isolation of former wetlands around Upper Klamath and Agency Lakesby diking and draining has degraded the water quality of the lakes by the resultant deprivation ofwetland function, rather than by the subsequent agricultural discharges related to use of thereclaimed wetland. Further, Geiger (2001) has suggested that dissolved organic substancesderived from the decomposition of marsh plants suppress the growth of AFA and that waterquality improvements may result from these decreases in primary productivity. However, limiteddata has been collected to support these hypotheses. Future studies are needed to quantify thesignificance of these processes compared to the well documented phosphorous loading frompeat soil decomposition and leaching that accompanies wetland reclamation.
Physical and chemical parameters reveal the decomposition rates of peat in soilsassociated with reclaimed wetlands and soils associated with undrained wetlands. Snyder andMorace (1997) found that reclaimed wetlands have lower total nitrogen relative to undrainedwetland soils (see Figure 2-11). Drained and undrained wetlands experience similar median totalphosphorus content, however drained wetlands have a larger range measured values. Snyderand Morace (1997) suggest that measured values are “indicative of the occurrence of bothphosphorus loss[es] due to drainage and phosphorus accumulation due to adsorption orexchange with adjacent soil layers or ground water, or from agricultural sources such as cattleurine and feces or fertilizer for crops.” Annual losses of phosphorus from peat soils in reclaimedwetlands are estimated with a first-order decay function:
ktt AeA −=
-Snyder and Morace, 1997where,
At: Mass of phosphorus stored in soils of reclaimed wetland at time t (tons)A*: Initial mass of phosphorus stored in soils of reclaimed wetland (tons)K*: Rate constant (year-1)
t: Time since drainage (year)*Values for A and k can be found in Table 2-5
Annual phosphorus losses from reclaimed wetlands estimated with the first-order decayfunction, wetland reclamation acreage and wetland acreage that is currently undergoingrestoration is presented in Figure 2-12. Phosphorus losses from reclaimed wetlands peaked in1963 at 68,200 kg per year. Year 2001 estimates are greatly reduced to ≈11,000 kg per year dueto wetland restoration that is in progress. This represents a best-case scenario where restoredwetlands no longer contribute to peat soil decomposition.11 Calculations that estimate a conditionin which no restoration is occurring substantially increase the losses in phosphorus to ≈52,000 kgper year. It is important to note that the average total external phosphorus load to Upper KlamathLake is 181,600 kg per year. Therefore, total phosphorus derived from reclaimed wetlandspotentially account for 29% of the total load. Assuming that wetlands currently under restorationwill regain the ability to prevent phosphorus losses, an estimated reduction of ≈41,000 kg/year inphosphorus losses from reclaimed wetlands results (ODEQ calculation for 2001), representing a≈80% reduction loading from near lake reclaimed wetlands and a 23% reduction in the averagetotal phosphorus external load to the lake. It should be noted that phosphorus losses fromreclaimed wetlands are not specifically demonstrated to relate to phosphorus delivery to UpperKlamath Lake since the pathways for delivery are variable for each reclaimed wetland.Adsorption to soils and suspended sediments, ground water sinks, and bio-uptake may reducedissolved phosphorus before reaching the lake system. However, it is a valid assumption thatongoing and future wetland restoration are mechanisms that reduce phosphorus losses fromwetland sources, and in turn, reduce phosphorus loading to Upper Klamath and Agency Lakes.
11 Snyder, personal communication
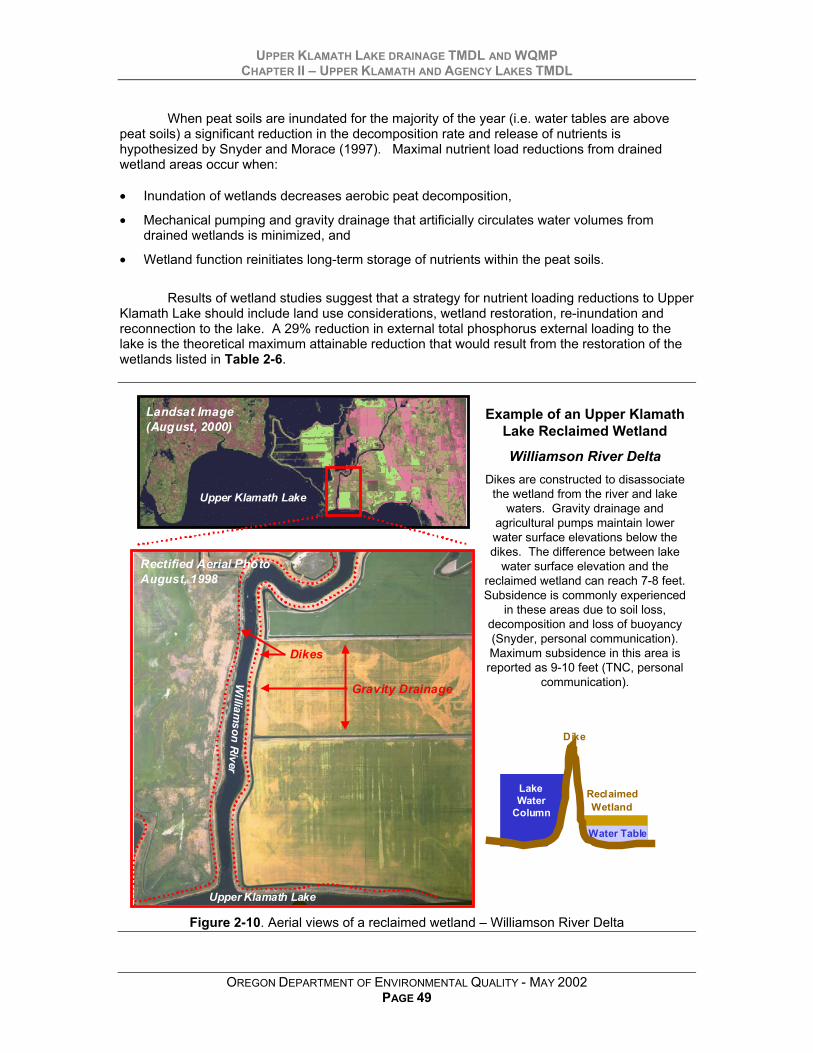
UPPER KLAMATH LAKE DRAINAGE TMDL AND WQMPCHAPTER II – UPPER KLAMATH AND AGENCY LAKES TMDL
OREGON DEPARTMENT OF ENVIRONMENTAL QUALITY - MAY 2002PAGE 49
When peat soils are inundated for the majority of the year (i.e. water tables are abovepeat soils) a significant reduction in the decomposition rate and release of nutrients ishypothesized by Snyder and Morace (1997). Maximal nutrient load reductions from drainedwetland areas occur when:
• Inundation of wetlands decreases aerobic peat decomposition,
• Mechanical pumping and gravity drainage that artificially circulates water volumes fromdrained wetlands is minimized, and
• Wetland function reinitiates long-term storage of nutrients within the peat soils.
Results of wetland studies suggest that a strategy for nutrient loading reductions to UpperKlamath Lake should include land use considerations, wetland restoration, re-inundation andreconnection to the lake. A 29% reduction in external total phosphorus external loading to thelake is the theoretical maximum attainable reduction that would result from the restoration of thewetlands listed in Table 2-6.
William
son River
Upper Klamath Lake
Dikes
Gravity Drainage
Upper Klamath Lake
Example of an Upper KlamathLake Reclaimed Wetland
Williamson River Delta
Dikes are constructed todisassociate the wetland from the
river and lake waters. Gravitydrainage and agriculture pumps
maintain lower water surfaceelevations below the dikes. Thedifference between water surfaceelevation between the lake and
the reclaimed wetlands canreach 7-8 feet. Subsidence is acommonly experienced in these
areas. Synder and Morace(1997) report subsidence values
ranging from 1 to 13 feet.
Rectified Aerial PhotoAugust, 1998
Landsat Image(August, 2000)
ReclaimedWetland
Dike
LakeWater
Column
Water Table
Example of an Upper KlamathLake Reclaimed Wetland
Williamson River DeltaDikes are constructed to disassociate
the wetland from the river and lakewaters. Gravity drainage and
agricultural pumps maintain lowerwater surface elevations below thedikes. The difference between lake
water surface elevation and thereclaimed wetland can reach 7-8 feet.Subsidence is commonly experienced
in these areas due to soil loss,decomposition and loss of buoyancy(Snyder, personal communication).Maximum subsidence in this area isreported as 9-10 feet (TNC, personal
communication).
Figure 2-10. Aerial views of a reclaimed wetland – Williamson River Delta

UPPER KLAMATH LAKE DRAINAGE TMDL AND WQMPCHAPTER II – UPPER KLAMATH AND AGENCY LAKES TMDL
OREGON DEPARTMENT OF ENVIRONMENTAL QUALITY - MAY 2002PAGE 50
Figure 2-11. Nutrient content in drained and undrained wetland soils adjacent to Upper KlamathLake (taken directly from Snyder, 2001)
Estimated Phosphorus Loss from Reclaimed Wetlands(Based on Calculated First Order Decay Rates)
0
5000
10000
15000
20000
25000
1880
1890
1900
1910
1920
1930
1940
1950
1960
1970
1980
1990
2000
2010
2020
2030
2040
Year
Dra
ined
Wet
land
s th
at C
onne
cted
to
Upp
er K
lam
ath
Lake
(acr
es)
0
16
32
48
64
80
Estim
ated
Pho
spho
rus
Loss
from
Re
clai
med
Wet
land
s(1
000
kg p
er y
ear)
ReclaimedWetland Area
Without Wetland Restoration
With Wetland Restoration
Figure 2-12. Estimated phosphorus loss from reclaimed wetlands and reclaimed wetland surfacearea (data from Snyder, 2001).
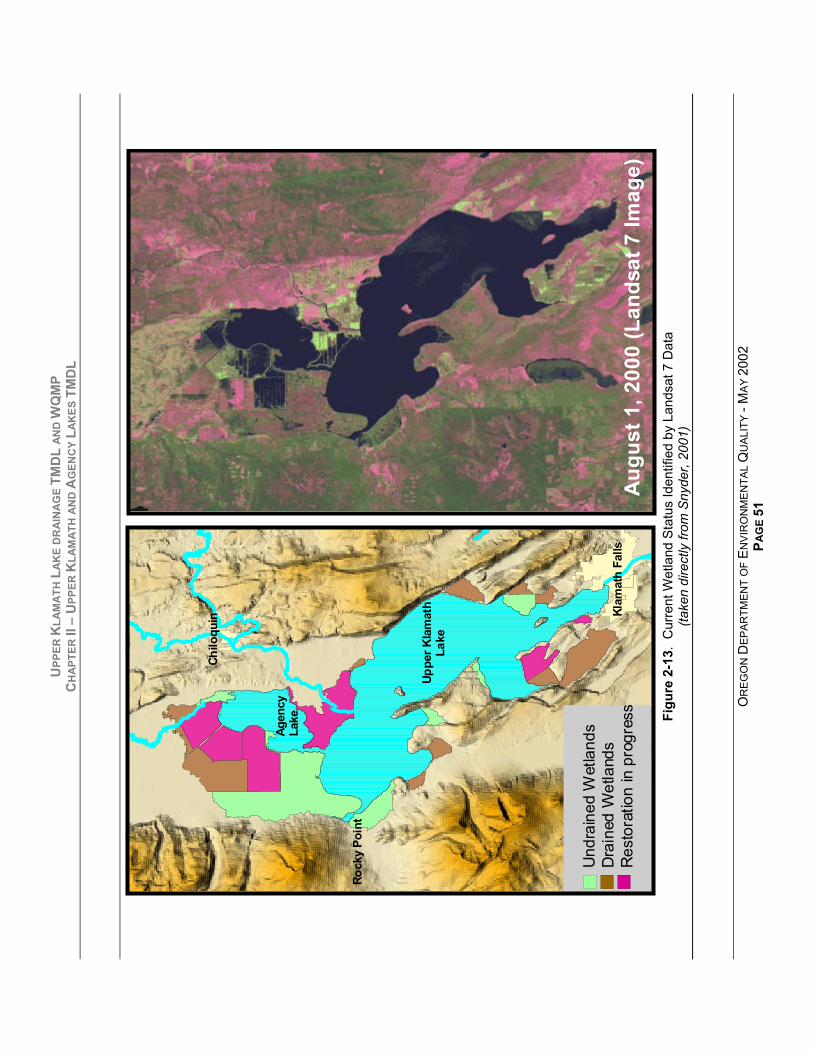
UPP
ER K
LAM
ATH
LAK
E D
RAI
NAG
E TM
DL
AND
WQ
MP
CH
APTE
R II
– U
PPER
KLA
MAT
H A
ND
AG
ENC
Y LA
KES
TM
DL
OR
EGO
N D
EPAR
TMEN
T O
F EN
VIR
ON
MEN
TAL
QU
ALIT
Y - M
AY 2
002
PAG
E 51
Aug
ust 1
, 200
0 (L
ands
at 7
Imag
e)
Uppe
r Kla
mat
hLa
ke
Agen
cyLa
ke
Klam
ath
Falls
Chilo
quin
Rock
y Po
int
U
ndra
ined
Wet
land
s
Dra
ined
Wet
land
s
Res
tora
tion
in p
rogr
ess Figu
re 2
-13.
Cur
rent
Wet
land
Sta
tus
Iden
tifie
d by
Lan
dsat
7 D
ata
(take
n di
rect
ly fr
om S
nyde
r, 20
01)

UPP
ER K
LAM
ATH
LAK
E D
RAI
NAG
E TM
DL
AND
WQ
MP
CH
APTE
R II
– U
PPER
KLA
MAT
H A
ND
AG
ENC
Y LA
KES
TM
DL
OR
EGO
N D
EPAR
TMEN
T O
F EN
VIR
ON
MEN
TAL
QU
ALIT
Y - M
AY 2
002
PAG
E 52
Tabl
e 2-
6. R
ecla
imed
Wet
land
Dat
a an
d D
eriv
ed P
hosp
horu
s Fi
rst-O
rder
Dec
ay F
unct
ions
(Sny
der a
nd M
orac
e, 1
997)
USG
SC
ode
Com
mon
Nam
e &
Con
stru
ctio
n D
ate
Are
a(a
cres
)
Cum
ulat
ive
Wet
land
Are
a(a
cres
)La
nd U
se
Ann
ual L
oss
of T
otal
Phos
phor
us19
65-1
966
(Ton
s)
Ann
ual L
oss
of T
otal
Phos
phor
us19
94-1
995
(Ton
s)
Dec
ayC
oeffi
cien
tk
(Yea
r-1)
Initi
alPh
osph
orus
Mas
sA
(Ton
s)R
ecla
imed
Wet
land
sM
CC
McC
orna
ck P
oint
- 18
8926
026
0C
rop
Cul
tivat
ion
0.22
0.17
0.00
9550
WO
CW
ocus
Mar
sh -
1896
3,80
040
60M
ixed
Agric
ultu
re1.
401.
400.
0005
2700
ALG
Algo
ma
(191
4)1,
200
5260
Cro
p C
ultiv
atio
n0.
930.
890.
0017
610
CAM
Cal
edon
ia M
arsh
(191
6)2,
500
7760
Cro
p C
ultiv
atio
n5.
004.
600.
0029
2000
BBS
Ball
Bay
Sout
h (1
919)
800
8560
Cat
tle G
razi
ngN
C*
NC
*N
C*
NC
*
WR
NW
illiam
son
Riv
er N
orth
(192
0)3,
200
1176
0C
rop
Cul
tivat
ion
25.0
021
.00
0.00
7050
00C
OV
Cov
e Po
int (
1919
-194
0)55
012
310
Cro
p C
ultiv
atio
n2.
602.
000.
0080
430
BBW
Ball
Bay
Wes
t (19
46-1
947)
410
1272
0C
attle
Gra
zing
0.09
0.08
0.00
0616
0W
RR
Woo
d R
iver
Pro
perty
(194
0-19
57)
2,90
015
620
Cat
tle G
razi
ng12
.00
10.0
00.
0064
2100
ALN
Agen
cy L
ake
Nor
th (1
962)
2,60
018
220
Cat
tle G
razi
ng26
.00
20.0
00.
0098
2700
ALW
Agen
cy L
ake
Wes
t (19
68-1
971)
4,60
022
820
Cat
tle G
razi
ngN
C*
0.00
0.00
0034
00W
etla
nds
Bei
ng R
esto
red
WR
RW
ood
Riv
er P
rope
rty -
1995
-2,9
0019
,920
Wet
land
WR
NW
illiam
son
Riv
er N
orth
- 19
97-2
,200
**17
,720
Wet
land
MC
CM
cCor
nack
Poi
nt -
2000
-260
17,4
60W
etla
ndC
AMC
aled
onia
Mar
sh -
2000
-1,7
00**
15,7
60W
etla
ndAL
NAg
ency
Lak
e N
orth
- 20
00-2
,600
13,1
60W
etla
ndAL
WAg
ency
Lak
e W
est -
200
0-4
,600
8,56
0W
etla
nd* N
C -
Not
Cal
cula
ted
** O
nly
parti
ally
rest
ored
- Ac
tual
rest
orat
ion
exte
nt is
cur
rent
ly le
ss th
an to
tal w
etla
nd a
rea

UPPER KLAMATH LAKE DRAINAGE TMDL AND WQMPCHAPTER II – UPPER KLAMATH AND AGENCY LAKES TMDL
53 OREGON DEPARTMENT OF ENVIRONMENTAL QUALITY - MAY 2002PAGE 53
2.5.3.2 Upland Sources of External Phosphorus
“The view of the lake as a naturally hypereutrophic system (Johnson et al. 1985) is consistentwith its shallow morphology, deep organic-rich sediments, and a large watershed withphosphorus-enriched soils. However, watershed development, beginning in the late-1800’s andaccelerated through the 1900’s, is strongly implicated as the cause of its current hypereutrophiccharacter (Bortleson and Fretwell 1993).”
-Eilers et al., 2001
Gearheart et al. (1995) concludes that considerable changes have occurred in the upstreamwatershed as large areas of land surrounding the major lake tributaries have been converted toagricultural and grazing land. Euro-American settlers took great efforts to utilize natural resources withinthe Upper Klamath Lake drainage. Much of the historical and current impacts that affect the uplands thatdrain to Upper Klamath Lake are cultivated agricultural, rangeland livestock grazing and forestry related.These three sources account for nearly 90% of the external phosphorus loading to Upper Klamath Lake(Gearheart et al. 1995).
Many of the numerous streams and rivers supplied by snow-melt and groundwater are used forirrigation water for livestock and cultivated crops. Extensive wetlands, both adjacent to Upper KlamathLake and Agency Lake and other vast wetland/riparian areas in the upland areas, have been drained toprovide rich farmlands to support livestock and to create cropland. Cattle production in Klamath Countypeaked in the 1960’s with 140,000 head of livestock and is currently near 100,000 head (Gearheart et al.1995). The Environmental Protection Agency (EPA Index of Watershed Indicators 1998) has estimatedthat at least 110,000 acres (172 mi2) of the watershed have been converted to irrigated pasture or otheragricultural activities. Risley and Laenen (1999) estimate an eleven-fold increase in permitted irrigatedland acreage between 1900 and the present.
0
200
400
600
800
1000
1910
1920
1930
1940
1950
1960
1970
1980
1990
2000
Year
Tim
ber H
arve
st (M
BF)
0
30,000
60,000
90,000
120,000
150,000
Tota
l Hea
d of
Cat
tleTimber Harvest Total Head of Cattle
Figure 2-14. Historical timber harvest and total head of cattle for Klamath County12
(data from Gearheart et al. 1995)
12 The Upper Klamath Lake drainage comprises 55% of Klamath County.

UPPER KLAMATH LAKE DRAINAGE TMDL AND WQMPCHAPTER II – UPPER KLAMATH AND AGENCY LAKES TMDL
OREGON DEPARTMENT OF ENVIRONMENTAL QUALITY - MAY 2002PAGE 54
The extensive forests in the surrounding mountains historically provided abundant supplies oftimber to local mills. Timber harvest in the area was most active from 1925 to 1945, reaching a maximumproduction in excess of 800 MBF (million board feet) per year, and is now currently stabilized near 400MBF per year (Eilers et al. 2001).
A strong signal of watershed disturbance is provided in sediment core values for titanium (Ti) andaluminum (Al), both of which indicate major increases in erosion inputs to Upper Klamath Lake in the lastcentury (Eilers et al. 2001). Increases in Ti and Al provide strong evidence of erosion inputs associatedwith disturbance of the watershed. Gearheart et al. (1995) report that the total phosphorus (TP)concentrations in many of the UKL tributaries can be correlated to both runoff events and suspendedsolids concentrations. Approximately 50% of the total phosphorus loading occurs during a four monthrunoff period from February through May (Gearheart et al. 1995). Erosion is the major process intransporting phosphorus from the watershed into the lake. Exceptions to this trend are spring systemssuch as Spring Creek, a major tributary to the Williamson River that comprises the majority of base flowdownstream of Upper Klamath Marsh.
It is important to note (once again) that historical accounts indicate that Upper Klamath andAgency Lakes would have been considered eutrophic, even 100 years ago. These accounts aresupported by measured elevated concentrations of total phosphorus within springs throughout the basin(Kann and Walker 2001, Rykbost and Charlton 2001). However, in many locations throughout thewatershed the observed total phosphorus concentrations measured in tributaries and rivers are elevatedsignificantly above these background conditions. For example, water quality data collected longitudinallyalong Wood River over a five-year period showed that nutrient concentrations increased as the rivertraveled through six miles of reclaimed wetlands and pasturelands in the lower watershed (i.e.downstream from Weed Road Bridge) (Kann and Walker, 2001). Figure 2-15 displays the totalphosphorus concentrations for the Wood River at two locations (river mile 0.0 and river mile 5.9) relativeto the average spring and lake concentrations for the period of 1992 to 1998. Large increases in totalphosphorus concentrations in thelower Wood River generally occur inthe winter and spring months.Approximately 76% of the 130 pairedtotal phosphorus measurementsexperience increases greater thanthe 75th percentile (i.e. increases of50 µg/l or greater) in the periodspanning January to June. Thistiming corresponds to pumpingschedules, drainage of thesurrounding inundated lands forgrazing and agricultural uses andpeak seasonal runoff. It should benoted that major restoration projectshave recently been completed in thisarea that are, in part, designed toreduce the sources of totalphosphorus in the lower Wood Riverreach.
Water quality samples from fourteen springs are summarized in Attachment 2 and presented inFigure 2-16. Summary statistics were calculated for springs in Upper Klamath Lake drainage having atleast seven samples. For comparison purposes, the average, median, geomean and standard deviationabout the mean were calculated for each spring. Results indicate that for the 118 spring samples theaverage concentration of total phosphorus is 77 µg/L with a standard deviation of 22 µg/L from the mean.
27%
49%
16%
8%
0%
10%
20%
30%
40%
50%
Jan-Mar Apr-Jun Jul-Sep Oct-Dec
Seas
onal
Dis
trib
utio
n of
Mea
sure
d In
crea
ses
in T
otal
Pho
spho
rus
Gre
ater
than
the
75th
Pe
rcen
tile
(50
ppb)
in th
e Lo
wer
Woo
d R
iver
(R
M 5
.9 to
RM
0)

UPPER KLAMATH LAKE DRAINAGE TMDL AND WQMPCHAPTER II – UPPER KLAMATH AND AGENCY LAKES TMDL
OREGON DEPARTMENT OF ENVIRONMENTAL QUALITY - MAY 2002PAGE 55
0
50
100
150
200
250
300
350
400
450
1993 1994 1995 1996 1997 1998 1999
Tota
l Pho
spho
rus
(ppb
)
RM 0RM 5.9Lake Mean TPMean Spring (77 ppb)
-150
-50
50
150
250
350
450
1993 1994 1995 1996 1997 1998 1999
Woo
d R
iver
Cha
nge
in T
otal
Pho
spho
rus
RM
5.9
to R
M 0
(ppb
)
Yearly Median
Figure 2-15. Total Phosphorus Concentrations in Wood River, Klamath Lake and median spring values –A consistent pattern of increasing total phosphorus concentrations is apparent in the monitoring data
between Weed Road (RM 5.9) and Dike Road (RM 0).

UPPER KLAMATH LAKE DRAINAGE TMDL AND WQMPCHAPTER II – UPPER KLAMATH AND AGENCY LAKES TMDL
OREGON DEPARTMENT OF ENVIRONMENTAL QUALITY - MAY 2002PAGE 56
(23) (16)
(12) (17)(11)
(10)
(7)
(7)
(7)
(2)
(2)
(2)(1)
(1)
(118)
0
20
40
60
80
100
120
Mar
es E
gg S
prin
g
Blue
Spi
ngs
Woo
d R
.Spr
ings
Res
erva
tion
Sprin
gs
Cro
oked
Cre
ek S
prin
gs
Sprin
g C
reek
Spr
ings
Mal
one
Sprin
gs
Har
riman
Spr
ings
Ode
ssa
Sprin
gs
Anni
e C
reek
Spr
ing
Cry
stal
Cre
ek S
prin
g
Fort
Cre
ek S
prin
g
Bark
ley
Sprin
g
Thre
emile
Cre
ek S
prin
g
Tota
l
Tota
l Pho
spho
rus
(ppb
)
Average = 77 ppb
Figure 2-16. Total Phosphorus Concentrations of springs in the Upper Klamath Lake Drainage - meanspring values with one standard deviation about the mean along with sample size (n).
The Sprague River delivers a significant portion of the bound phosphorus load to the lake,primarily during peak runoff events when erosion rates are highest (Gearheart et al. 1995). Whencompared to the Williamson River, the Sprague River has a high correlation (Sprague River - R2 = 0.89,Williamson River - R2 = 0.46) between flow rate and total phosphorus loading (see Figure 2-17). Tosome degree, the Williamson River phosphorus loading upstream of the Sprague River confluence isindependent of flow rate below the 2-year high flow. The Sprague River phosphorus loading is highlydependent on flow rate for all return periods, indicating that runoff inputs during peak flows is a significantphosphorus source. This relationship between flow rate and phosphorus loading for the Sprague River isobserved throughout the range of flow values, suggesting that surface runoff inputs may occur at flowrates well below statistical peak flows listed in Figure 2-17.
A strong correlation between water yield and loading rates indicates that the Sprague River is aprimary source of particulate and surface flow transported phosphorus. When summarized by monthlyvalues, the Sprague River phosphorus loading is a function of season and high flow timing. TheWilliamson River upstream of the Sprague River confluence is relatively independent of season and highflow timing (see Figure 2-18). When compared to the Williamson River (upstream of the Sprague RiverConfluence), the Sprague River is a large seasonal source of phosphorus loading. Recall that Eilers etal. (2001) report that Al and Ti lake sediment core results indicate high rates of upland erosion. Further,Gearheart et al. (1995) reports that upland total phosphorus loading occurs primarily as boundphosphorus and is highly correlated to peak runoff and total suspended solids (TSS). Erosion is a sourceof bound phosphorus generated during seasonal runoff events. In the context of these results, thedisparity in loading rates of phosphorus (displayed in Figure 2-18) suggests higher (and more variable)rates of runoff and erosion in the Sprague River drainage than that occurring in the Williamson Riverdrainage.
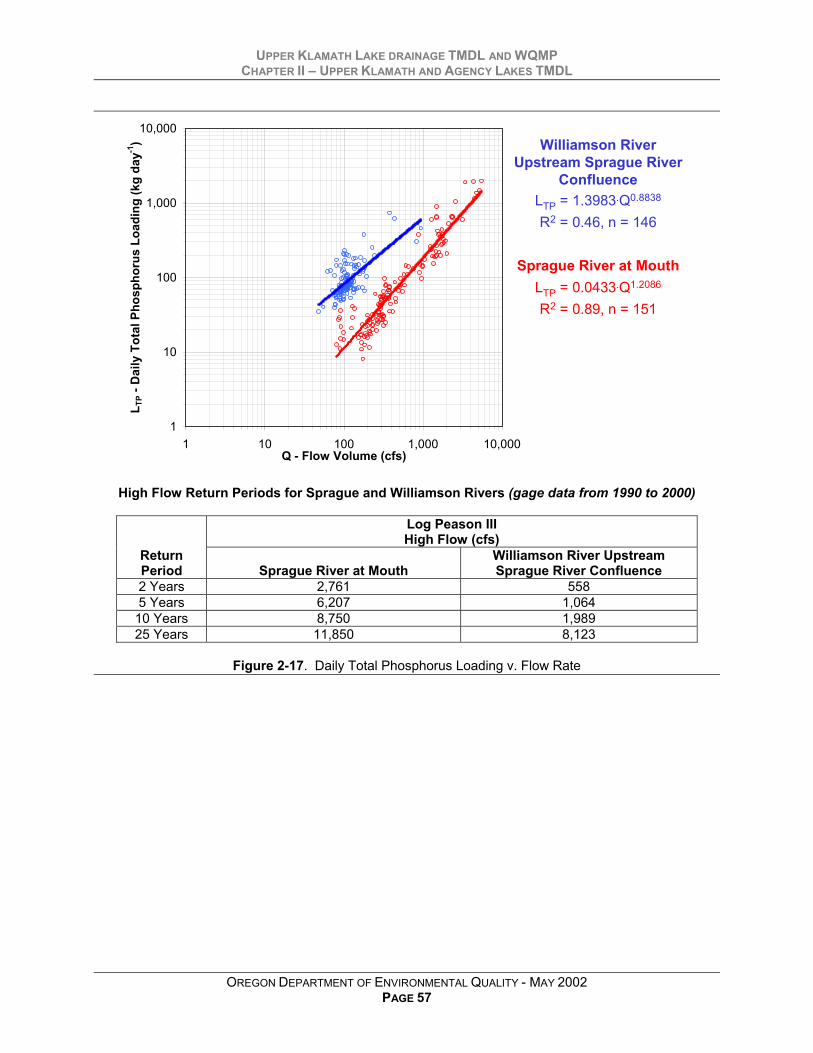
UPPER KLAMATH LAKE DRAINAGE TMDL AND WQMPCHAPTER II – UPPER KLAMATH AND AGENCY LAKES TMDL
OREGON DEPARTMENT OF ENVIRONMENTAL QUALITY - MAY 2002PAGE 57
1
10
100
1,000
10,000
1 10 100 1,000 10,000Q - Flow Volume (cfs)
L TP
- Dai
ly T
otal
Pho
spho
rus
Load
ing
(kg
day-1
) Williamson RiverUpstream Sprague River
ConfluenceLTP = 1.3983.Q0.8838
R2 = 0.46, n = 146
Sprague River at MouthLTP = 0.0433.Q1.2086
R2 = 0.89, n = 151
High Flow Return Periods for Sprague and Williamson Rivers (gage data from 1990 to 2000)
Log Peason IIIHigh Flow (cfs)
ReturnPeriod Sprague River at Mouth
Williamson River UpstreamSprague River Confluence
2 Years 2,761 5585 Years 6,207 1,064
10 Years 8,750 1,98925 Years 11,850 8,123
Figure 2-17. Daily Total Phosphorus Loading v. Flow Rate
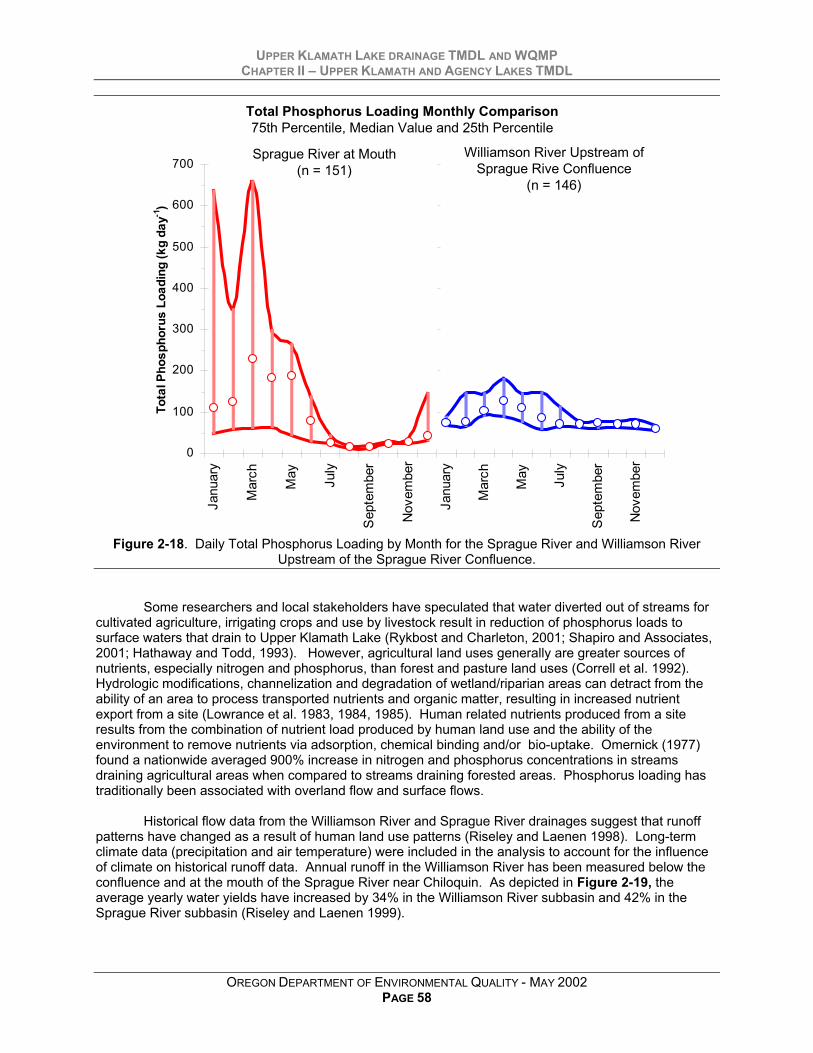
UPPER KLAMATH LAKE DRAINAGE TMDL AND WQMPCHAPTER II – UPPER KLAMATH AND AGENCY LAKES TMDL
OREGON DEPARTMENT OF ENVIRONMENTAL QUALITY - MAY 2002PAGE 58
0
100
200
300
400
500
600
700
Janu
ary
Mar
ch
May
July
Sep
tem
ber
Nov
embe
r
0
100
200
300
400
500
600
700
Janu
ary
Mar
ch
May
July
Sep
tem
ber
Nov
embe
r
Tota
l Pho
spho
rus
Load
ing
(kg
day-1
)Sprague River at Mouth
(n = 151)Williamson River Upstream of
Sprague Rive Confluence(n = 146)
Total Phosphorus Loading Monthly Comparison75th Percentile, Median Value and 25th Percentile
Figure 2-18. Daily Total Phosphorus Loading by Month for the Sprague River and Williamson RiverUpstream of the Sprague River Confluence.
Some researchers and local stakeholders have speculated that water diverted out of streams forcultivated agriculture, irrigating crops and use by livestock result in reduction of phosphorus loads tosurface waters that drain to Upper Klamath Lake (Rykbost and Charleton, 2001; Shapiro and Associates,2001; Hathaway and Todd, 1993). However, agricultural land uses generally are greater sources ofnutrients, especially nitrogen and phosphorus, than forest and pasture land uses (Correll et al. 1992).Hydrologic modifications, channelization and degradation of wetland/riparian areas can detract from theability of an area to process transported nutrients and organic matter, resulting in increased nutrientexport from a site (Lowrance et al. 1983, 1984, 1985). Human related nutrients produced from a siteresults from the combination of nutrient load produced by human land use and the ability of theenvironment to remove nutrients via adsorption, chemical binding and/or bio-uptake. Omernick (1977)found a nationwide averaged 900% increase in nitrogen and phosphorus concentrations in streamsdraining agricultural areas when compared to streams draining forested areas. Phosphorus loading hastraditionally been associated with overland flow and surface flows.
Historical flow data from the Williamson River and Sprague River drainages suggest that runoffpatterns have changed as a result of human land use patterns (Riseley and Laenen 1998). Long-termclimate data (precipitation and air temperature) were included in the analysis to account for the influenceof climate on historical runoff data. Annual runoff in the Williamson River has been measured below theconfluence and at the mouth of the Sprague River near Chiloquin. As depicted in Figure 2-19, theaverage yearly water yields have increased by 34% in the Williamson River subbasin and 42% in theSprague River subbasin (Riseley and Laenen 1999).

UPPER KLAMATH LAKE DRAINAGE TMDL AND WQMPCHAPTER II – UPPER KLAMATH AND AGENCY LAKES TMDL
OREGON DEPARTMENT OF ENVIRONMENTAL QUALITY - MAY 2002PAGE 59
200
250
300
350
400
450
500
Williamson R. Subbasin Sprague R. Subbasin
Mea
n Ye
arly
Run
off
(100
0 ac
re-fe
et)
30%
32%
34%
36%
38%
40%
42%
44%
Obs
erve
d In
crea
se in
Mea
n Ye
arly
Run
off
1922-19501951-1996Average Increase
Figure 2-19. Two Sample Tests for Differences in Williamson and Sprague River Annual Runoff for TwoPeriods: 1922-1950 and 1951-1996 (Risley and Laenen, 1999)
Riseley and Laenen (1999) suggest that the statistically significant shifts in annual runoff arecaused by human development and land use. The bulk of the irrigated acreage in the Williamson andSprague drainages were developed between 1950 and 1980. While irrigated acreage cannot explain theincrease in water yields, other associated landscape modifications that accompany irrigated cropcultivation and livestock grazing may offer an explanation: decreased summertime evapotranspiration,increased runoff rates, reduced infiltration and reduced riparian, floodplain and wetland water storage.Timber harvest can accelerate the snow melt and decrease evapotranspiration, causing increased wateryields (Rothacher, 1970). However, Figure 2-14 indicates a decrease in timber harvests in the post-1950’s period. Therefore, it is more likely that the combined effects of hydrologic disturbance that haveincreased water yields in the Williamson and Sprague River subbasins are related to agricultural activitiesin the drainage.
Total external phosphorus loading is simply the product of concentration and flow volume.Therefore, assuming that total phosphorus concentrations have not decreased in the 1951-1996 period,relative to the 1922-1950 period, the Sprague and Williamson River subbasins generate a proportionallylarger total phosphorus load simply by virtue of increased water yields. External loading rates of totalphosphorus derived from the increased water yield in the Williamson and Sprague River subbasins mayaccount for 18% (327,000 kg/year) of the total external load to the lake. Table 2-7 lists the water yieldsand associated total phosphorus loading rates for the Williamson and Sprague River subbasins.
Table 2-7. Williamson River and Sprague River Subbasin Water Yields and Associated TotalPhosphorus Loading Rates.
Increase in WaterYield from 1922-1950 Period to
1951-1996 Period
CurrentExternal TotalPhosphorus
Load (1000 kg/year)
ExternalPhosphorus
LoadAssociated
with IncreasedWater Yield
(1000 kg/year)
Potential TotalPhosphorus Load
Reduction as aPercent of the Total
External Load(181,600 kg/year)
Williamson RiverSubbasin 34.2% 37.8 12.9 7.1%
Sprague RiverSubbasin 41.6% 48.7 20.2 11.1%
Total 37.8% 86.5 32.7 18.0%

UPPER KLAMATH LAKE DRAINAGE TMDL AND WQMPCHAPTER II – UPPER KLAMATH AND AGENCY LAKES TMDL
OREGON DEPARTMENT OF ENVIRONMENTAL QUALITY - MAY 2002PAGE 60
2.5.4 Internal Lake Sources of PhosphorusInternal phosphorus loading (sediment regenerated phosphorus delivered to the lake water
column) is a large source of phosphorus in Upper Klamath Lake (Barbiero and Kann 1994; Laenen andLeTourneau 1996; Kann 1998). An important mechanism for the release of phosphorus in shallowproductive polymictic (continuously mixed) lakes is photosynthetically elevated pH (Welch 1992;Sondergaard 1988; Jacoby et al. 1982). Elevated pH increases phosphorus flux to the water column bysolubilizing iron-bound phosphorus in both bottom and resuspended sediments as high pH causesincreased competition between hydoxyl ions and phosphate ions decreasing the sorption of phosphate oniron. Evidence for this exists in Upper Klamath Lake where it was shown that the phosphorus associatedwith hydrated iron oxides in the sediment was the principle source of phosphorus to the overlying water,and that iron-phosphorus reaction decrease from May to June and July (Wildung et al. 1997). In addition,the probability of achieving increased internal loading rate increases with pH, and it appears that a pH ofapproximately 9.3 is the level at which the probability of internal loading sharply increases (Kann 1998).Empirical evidence from Upper Klamath Lake, along with supportive evidence from other lakes, indicatesthat as the AFA bloom progresses that pH increases. A flux of phosphorus to the water column from lakesediments increases the water column phosphorus concentration and further elevates AFA biomass andpH, setting up a positive feedback loop (Kann 1998). Internal load was calculated for the 1992 to 1998period and is included in this analysis. Internal phosphorus loading to the lake averaged 285 mtons/yearwith a standard deviation of 76 mtons/year. Figure 2-20 displays the annual average internal andexternal phosphorus loads and Figure 2-21 displays the observed and predicted internal recycling ratesdeveloped by Walker (2001).
It should be noted that other sediment/water column processes are likely occurring to anunknown degree, in addition to solubilizing iron-bound phosphorus in both bottom and resuspendedsediments. Mechanical mixing and entrainment of sediments by wave/wind energy can resuspendsediments into the water column. Other chemical and biological processes may alter the phosphorusgradient and rates of transfer from sediment to the water column.
2.5.5 Phosphorus BudgetTotal phosphorus loads average 466 mtons/year: external loading accounts for 182 mtons/year
and internal loading accounts for 285 mtons/year. Phosphorus sources to the lake water column resultfrom inflow (including precipitation) and recycling from lake sediments. Phosphorus losses from the lakeresult from outflow and gross sedimentation. Biweekly phosphorus fluxes (i.e. loading and removalrates: inflows, outflows, gross sedimentation and recycling) between 1992 and 1999 for a combined effectthat results in the total available phosphorus concentration in the lake at any given time. Biweekly andyearly average phosphorus mass balance pathway values are presented in Figure 2-21.
Nutrient contributions into Upper Klamath and Agency Lakes from various source classes (i.e.external sources and internal loading from sediments) are summarized in Table 2-4. These values werecalculated from water quality data collected within these lakes and their tributaries from 1992 through1998 (Kann and Walker, 2001). On an annual basis there tends to be a net retention of total phosphorusin the lake due to the significant sedimentation events from algal crashes and the likely settling ofparticulate phosphorus during high runoff. However, it is evident from the negative retention (positiveinternal loading) during the May through September period that internal loading is a significant source ofphosphorus to the lake. Although there is a high contribution of internal total phosphorus loading to thelake during the algal growing season, it has been noted that the mobilization of phosphorus from iron hasthe potential to respond rapidly when primary productivity and pH maxima are reduced (Marsden 1989).The rapid response may be due to a reversal of the positive feedback mechanism described earlier inSection 2.5.4 Internal Lake Sources of Phosphorus.

UPP
ER K
LAM
ATH
LAK
E D
RAI
NAG
E TM
DL
AND
WQ
MP
CH
APTE
R II
– U
PPER
KLA
MAT
H A
ND
AG
ENC
Y LA
KES
TM
DL
61 O
REG
ON
DEP
ARTM
ENT
OF
ENVI
RO
NM
ENTA
L Q
UAL
ITY
- MAY
200
2PA
GE
61
Inte
rnal
Lo
adin
g 2
85 m
tons
/yr
61%
of t
otal
Exte
rnal
Lo
adin
g 1
82 m
tons
/yr
39%
of t
otal
Aver
age
Annu
al T
P Lo
adin
g 4
66 m
tons
/yr
294
265
195
394
212
376
257
113
208
112
169
241
220
208
285
182
0
100
200
300
400
500
600
1992
1993
1994
1995
1996
1997
1998
Ave
rage
Total Phosphorus Loading (mtons/year)
Ext
erna
l Loa
dIn
tern
al L
oad
Figu
re 2
-20.
Tot
al P
hosp
horu
s Lo
ad a
s a
Func
tion
of E
xter
nal a
nd In
tern
al L
oads
(Wal
ker 2
001)
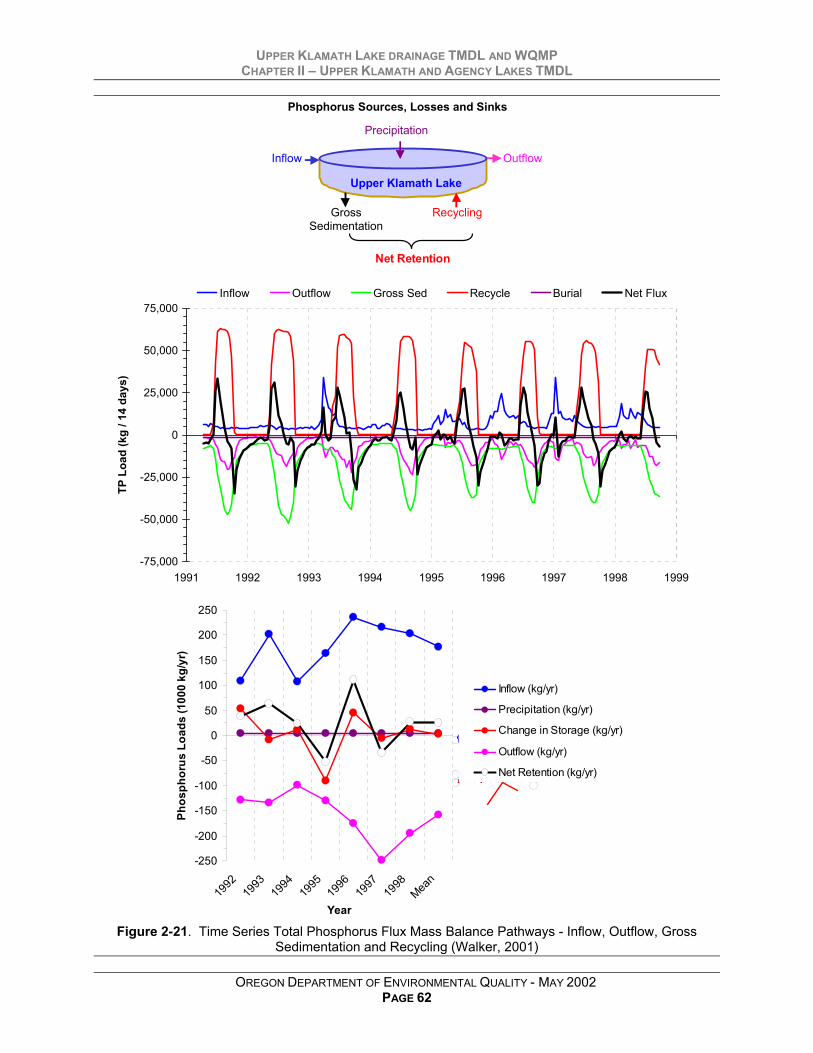
UPPER KLAMATH LAKE DRAINAGE TMDL AND WQMPCHAPTER II – UPPER KLAMATH AND AGENCY LAKES TMDL
62 OREGON DEPARTMENT OF ENVIRONMENTAL QUALITY - MAY 2002PAGE 62
Inflow Outflow
GrossSedimentation
Recycling
Upper Klamath Lake
Phosphorus Sources, Losses and Sinks
Precipitation
Net Retention
-75,000
-50,000
-25,000
0
25,000
50,000
75,000
1991 1992 1993 1994 1995 1996 1997 1998 1999
TP L
oad
(kg
/ 14
days
)
Inflow Outflow Gross Sed Recycle Burial Net Flux
Inflow (kg/yr)
Precipitation (kg/yr)
Change in Storage (kg/yr)
Outflow (kg/yr)
Net Retention (kg/yr)
-250
-200
-150
-100
-50
0
50
100
150
200
250
1992
1993
1994
1995
1996
1997
1998
Mean
Year
Phos
phor
us L
oads
(100
0 kg
/yr)
Figure 2-21. Time Series Total Phosphorus Flux Mass Balance Pathways - Inflow, Outflow, GrossSedimentation and Recycling (Walker, 2001)
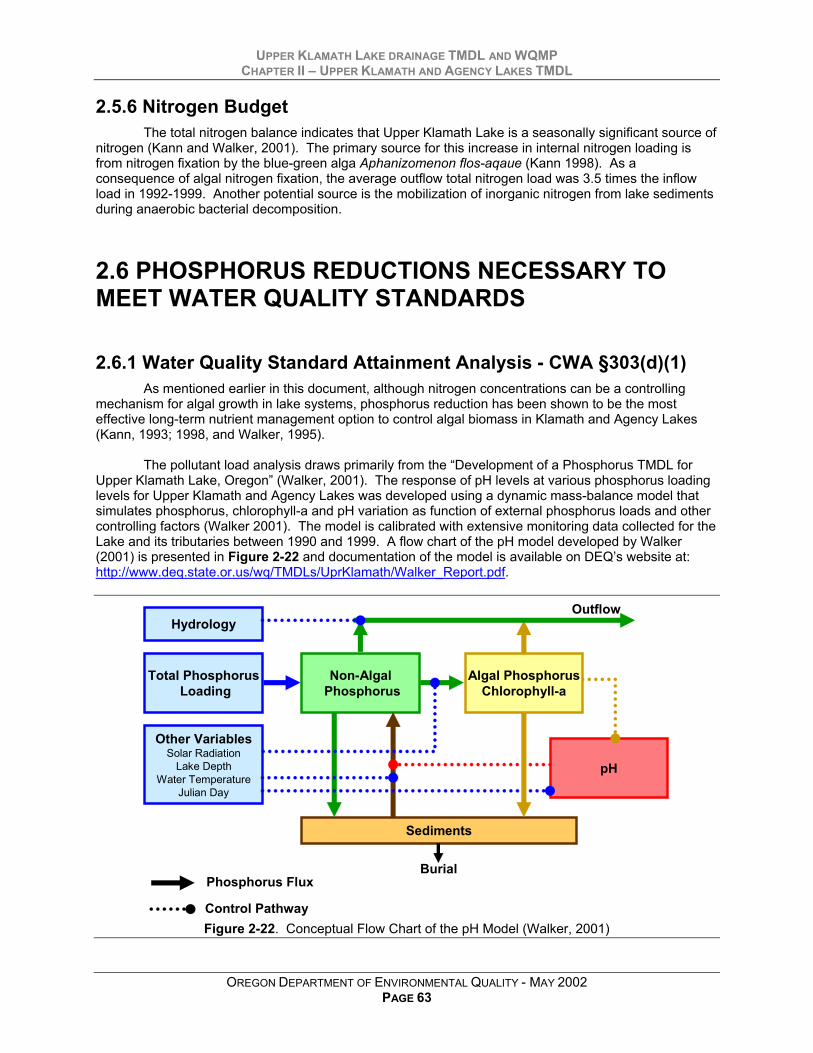
UPPER KLAMATH LAKE DRAINAGE TMDL AND WQMPCHAPTER II – UPPER KLAMATH AND AGENCY LAKES TMDL
OREGON DEPARTMENT OF ENVIRONMENTAL QUALITY - MAY 2002PAGE 63
2.5.6 Nitrogen BudgetThe total nitrogen balance indicates that Upper Klamath Lake is a seasonally significant source of
nitrogen (Kann and Walker, 2001). The primary source for this increase in internal nitrogen loading isfrom nitrogen fixation by the blue-green alga Aphanizomenon flos-aqaue (Kann 1998). As aconsequence of algal nitrogen fixation, the average outflow total nitrogen load was 3.5 times the inflowload in 1992-1999. Another potential source is the mobilization of inorganic nitrogen from lake sedimentsduring anaerobic bacterial decomposition.
2.6 PHOSPHORUS REDUCTIONS NECESSARY TOMEET WATER QUALITY STANDARDS
2.6.1 Water Quality Standard Attainment Analysis - CWA §303(d)(1)As mentioned earlier in this document, although nitrogen concentrations can be a controlling
mechanism for algal growth in lake systems, phosphorus reduction has been shown to be the mosteffective long-term nutrient management option to control algal biomass in Klamath and Agency Lakes(Kann, 1993; 1998, and Walker, 1995).
The pollutant load analysis draws primarily from the “Development of a Phosphorus TMDL forUpper Klamath Lake, Oregon” (Walker, 2001). The response of pH levels at various phosphorus loadinglevels for Upper Klamath and Agency Lakes was developed using a dynamic mass-balance model thatsimulates phosphorus, chlorophyll-a and pH variation as function of external phosphorus loads and othercontrolling factors (Walker 2001). The model is calibrated with extensive monitoring data collected for theLake and its tributaries between 1990 and 1999. A flow chart of the pH model developed by Walker(2001) is presented in Figure 2-22 and documentation of the model is available on DEQ’s website at:http://www.deq.state.or.us/wq/TMDLs/UprKlamath/Walker_Report.pdf.
Hydrology
Total PhosphorusLoading
Other VariablesSolar Radiation
Lake DepthWater Temperature
Julian Day
Non-AlgalPhosphorus
pH
Sediments
Outflow
Burial
Algal PhosphorusChlorophyll-a
Phosphorus Flux
Control PathwayFigure 2-22. Conceptual Flow Chart of the pH Model (Walker, 2001)

UPPER KLAMATH LAKE DRAINAGE TMDL AND WQMPCHAPTER II – UPPER KLAMATH AND AGENCY LAKES TMDL
OREGON DEPARTMENT OF ENVIRONMENTAL QUALITY - MAY 2002PAGE 64
A direct simulation of pH excursion frequency as a function of total phosphorus load and othercontrolling factors utilize the calibrated dynamic pH model (Walker 2001). Simulation results areexpressed as relationships between percent reductions in total phosphorus loads and pH excursionfrequencies, computed using various spatial and temporal averaging methods. Total phosphorusreduction simulation results are presented in Table 2-8 and Figure 2-23 where total external phosphorusloading is reduced incrementally 0% to 55%. Analytical outputs suggest that excursion frequencies forthe pH standard can theoretically be reduced to ~0%, if the load for total phosphorous is reduced by 50%(Walker 2001). However, there is evidence that such a load reduction is not possible/feasible (seeSection 2.5.3 External Sources of Phosphorus). General “compliance” with water quality standardsdoes not necessarily require that all measurements are below a specific number value at all locations(and depths) throughout all times ofa year. A recognized reality is thatwater quality conditions are drivenby variables (i.e. climate, hydrology,biochemical reactions, biologicalprocesses, etc.) that vary via humanmanipulations and natural forcesover a space and time to the extentthat 100% compliance istheoretically unattainable under anyloading regime. Walker (2001)advocates a quantitative definition ofcompliance of water qualitystandards that acknowledges spatialand temporal variability in the lakeand upland systems, as well as theuncertainties with measurements,monitoring programs and analyticaltechniques.
Table 2-8. Lake pH Response at Various External Total Phosphorus Load Reduction
TP Load Reduction
Improvem
ent in pH
0%0%55%
0%0%50%
3%0%45%
6%4%40%
11%5%35%
19%15%30%
28%16%25%
75%29%0%
Summertime MeanJune-July
Year RoundMean
Reduction in External Loading
Frequency of pH Values > 9.0
0%0%55%
0%0%50%
3%0%45%
6%4%40%
11%5%35%
19%15%30%
28%16%25%
75%29%0%
Summertime MeanJune-July
Year RoundMean
Reduction in External Loading
Frequency of pH Values > 9.0
Figure 2-23. Lake-Mean pH Frequency as a Function of External Phosphorus Load Reduction (Walker, 2001)
0%
25%
50%
75%
0% 10% 20% 30% 40% 50% 60%External Total Phosphorus Load Reduction
Excu
rsio
n Fr
eque
ncy
of L
ake
Mea
n pH
> 9
.0
Year RoundSummertime (June/July)

UPPER KLAMATH LAKE DRAINAGE TMDL AND WQMPCHAPTER II – UPPER KLAMATH AND AGENCY LAKES TMDL
OREGON DEPARTMENT OF ENVIRONMENTAL QUALITY - MAY 2002PAGE 65
In light of these monitoring and analytical limitations and the complexity of the lake anddrainages, the selection of a TMDL targeted loading condition and compliance frequency ultimatelybecomes a professional judgment. As is the case in any such professional judgment, there are varyingperspectives on an appropriate targeted condition. Regardless, a 40% reduction in total phosphorusloading to Upper Klamath Lake represents the targeted condition for this TMDL. This targetacknowledges external load reductions that range from 33% to 47% that are documented in the literature(from Kann and Walker, 2001). Further, other potential external loading reductions highlighted in Section2.5.3 External Sources of Phosphorus that demonstrates a potential 47% reduction in external totalphosphorus loading to the lake:
• 29% reduction in external total phosphorus loading from near-lake wetland restoration, and
• 18% reduction in external total phosphorus loading resulting from upland hydrology and landcover restoration.
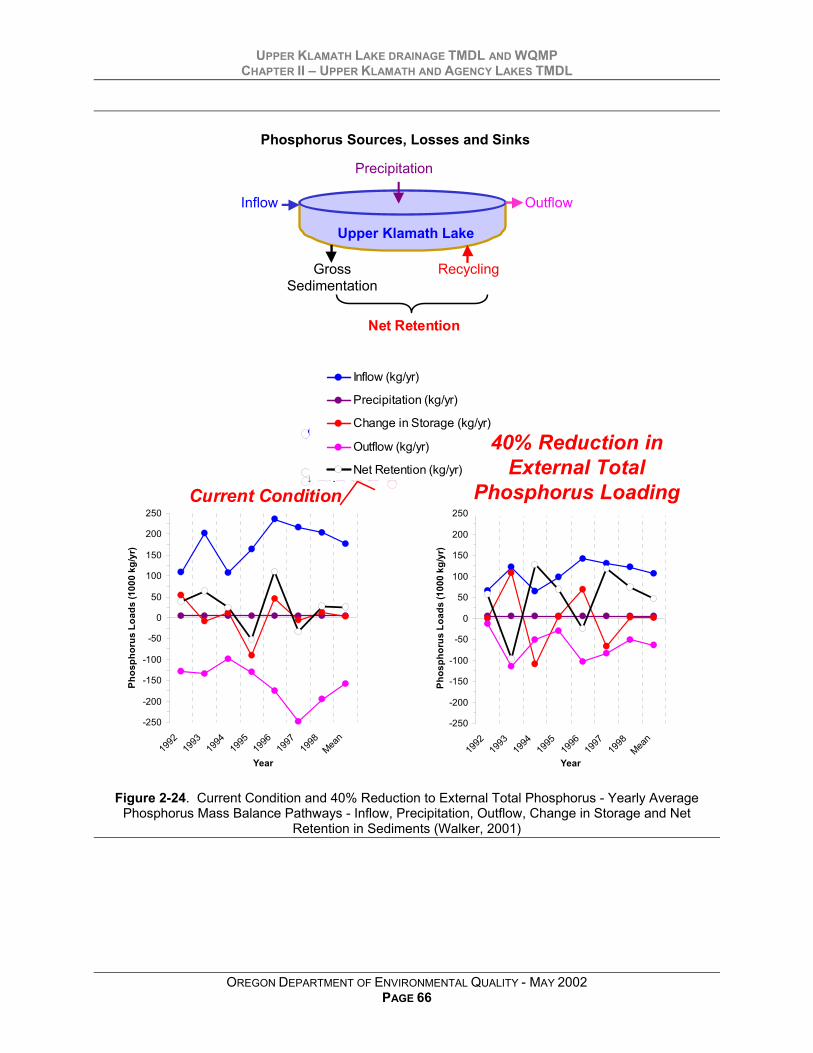
UPPER KLAMATH LAKE DRAINAGE TMDL AND WQMPCHAPTER II – UPPER KLAMATH AND AGENCY LAKES TMDL
OREGON DEPARTMENT OF ENVIRONMENTAL QUALITY - MAY 2002PAGE 66
Inflow Outflow
GrossSedimentation
Recycling
Upper Klamath Lake
Phosphorus Sources, Losses and Sinks
Precipitation
Net Retention
-250
-200
-150
-100
-50
0
50
100
150
200
250
1992
1993
1994
1995
1996
1997
1998
Mean
Year
Phos
phor
us L
oads
(100
0 kg
/yr)
Current Condition
Inflow (kg/yr)
Precipitation (kg/yr)
Change in Storage (kg/yr)
Outflow (kg/yr)
Net Retention (kg/yr)40% Reduction to
External Phosphorus(Inflow)
-250
-200
-150
-100
-50
0
50
100
150
200
250
1992
1993
1994
1995
1996
1997
1998
Mean
Year
Phos
phor
us L
oads
(100
0 kg
/yr)
16% Reduction in Total Phosphorus
Loading
40% Reduction in External Total
Phosphorus Loading
Figure 2-24. Current Condition and 40% Reduction to External Total Phosphorus - Yearly AveragePhosphorus Mass Balance Pathways - Inflow, Precipitation, Outflow, Change in Storage and Net
Retention in Sediments (Walker, 2001)

UPPER KLAMATH LAKE DRAINAGE TMDL AND WQMPCHAPTER II – UPPER KLAMATH AND AGENCY LAKES TMDL
OREGON DEPARTMENT OF ENVIRONMENTAL QUALITY - MAY 2002PAGE 67
177
5
-2
-159
25
106
5
-64
46
1
-250
-200
-150
-100
-50
0
50
100
150
200
250
Inflow Precipitation Change inStorage
Outflow Net Retention
Mass Balance Pathway
Phos
phor
us L
oads
(100
0 kg
/yr)
Current Condition40% Reduction in External Phosphorus Loading40% Reduction in External Total Phosphorus Loading
Current Condition
Figure 2-25. Current Condition and 40% Reduction in External Total Phosphorus - Average PhosphorusMass Balance Pathways over Period of Data/Analysis Record (1992 – 1998) - Inflow, Precipitation,
Outflow, Change in Storage and Net Retention in Sediments (Walker, 2001)
2.6.2 Measured Water Quality TrendsThe Seasonal Kendall test performed on observed UKL mean total phosphorus collected during
March through May, 1991 to 2000, indicates that there is a statistically significant decreasing trend (seeAttachment 2 - Figure 3). The purpose of reducing phosphorus in Upper Klamath Lake is to reducealgal biomass, indicated by chlorophyll a, and subsequently pH. Lowering pH to the water qualitystandard (9.0) should significantly reduce or eliminate toxic conditions in the lake.
A net retention of total phosphorus in the lake results from significantsedimentation of biomass from algal crashes and settling of particulate
phosphorus during high runoff. The mobilization of phosphorus from ironhas the potential to respond rapidly when primary productivity and pH
maxima are reduced (Marsden 1989). Therefore, a reversal of this positivefeedback mechanism increases the net retention of phosphorus as lower
pH values result from the 40% reduction in external total phosphorusloading to the lake. These lower pH values decrease the rate of recycling
associated with internal phosphorous sources.

UPPER KLAMATH LAKE DRAINAGE TMDL AND WQMPCHAPTER II – UPPER KLAMATH AND AGENCY LAKES TMDL
OREGON DEPARTMENT OF ENVIRONMENTAL QUALITY - MAY 2002PAGE 68
2.7 LOADING CAPACITY - 40 CFR 130.2(F)The loading capacity (see Figure 2-26) provides a reference for calculating the amount of
pollutant reduction needed to bring water into compliance with water quality standards. EPA’s currentregulation defines loading capacity as “the greatest amount of loading that a waterbody can receivewithout violating water quality standards.” (40 CFR § 130.2(f)). The load capacity is estimated forpurposes of this TMDL as the external total phosphorus loading into Upper Klamath and Agency Lakesthat corresponds to a reduction of approximately 40% from current conditions. At this total phosphorusloading level it is expected that the pH criteria of 9.0 will largely be achieved, with limited excursions.Further, any progress towards the load capacity will be accompanied by improvements in water quality(see Table 2-7 – blue shaded Region in Section 2.6.1 Water Quality Standard Attainment Analysis -CWA §303(d)(1)).
0
25
50
75
100
125
150
175
200
Annual Average
Exte
rnal
Tot
al P
hosp
horu
s Lo
adin
g(1
000
kg p
er y
ear)
40% Pollutant Load Reduction = 72.5 metric tons/year
Pollutant Loading CapacityTargeted Loading to Meet Water Quality
Standards
= 109.1 mtons/year
Current Pollutant Load181.6 metric tons/year
Figure 2-26. Loading Capacity for Upper Klamath and Agency Lakes
2.8 ALLOCATIONS - 40 CFR 130.2(G) AND (H)Load Allocations are developed for nonpoint source phosphorus loading. These allocationsinclude background sources such as precipitation, springs, soil contributions, etc., andanthropogenic distributed sources such as wetland reclamation, upland sources, pumps, canals,etc. Further these allocations are flexible. Large load reductions from one source area may allowsmaller reductions in other source areas.
Waste Load Allocations for point sources specify phosphorus loading rates that will be achievedthrough regulatory permits.
Table 2-9 lists the distribution of external total phosphorus loading to Upper Klamath and AgencyLakes allocated to the various sources.

UPPER KLAMATH LAKE DRAINAGE TMDL AND WQMPCHAPTER II – UPPER KLAMATH AND AGENCY LAKES TMDL
OREGON DEPARTMENT OF ENVIRONMENTAL QUALITY - MAY 2002PAGE 69
2.8.1 Point SourcesThere are two point sources of phosphorus that discharge to waters that drain to Upper Klamath
Lake: the Chiloquin Sewage Treatment Plant and the Crooked Creek Fish Hatchery. The phosphorusloads that result from discharge are calculated by multiplying the year discharge volume by the yearlydischarge phosphorus concentration. The waste load allocation targets a 40% loading ratereduction, which matches the 40% reduction in external loading a specified in Section 2.6Phosphorus Reductions Necessary to Meet Water Quality Standards. In the event thatbackground condition concentrations prevent attainment of a 40% loading reduction, thebackground condition becomes the target. The allowable phosphorus loads that result from dischargeare calculated by multiplying the year discharge volume by the yearly targeted phosphorus concentration.Equations used in this analysis are presented below. Terms are defined in Table 2-8, where flow volumedata, phosphorus concentrations and calculated loading rates are presented.
gm10KglPQLoad 39current µ⋅⋅
⋅⋅⋅= gm10
KglPQWLA 39WLA µ⋅⋅⋅⋅⋅=
Estimated background loading rates for phosphorus are developed to match backgroundreceiving water concentrations of phosphorus. Background concentrations of phosphorus at theCrooked Creek hatchery are estimated by using the measured concentration of the spring flowing into thehatchery (90 µg/L). Background levels of total phosphorous for the Chiloquin STP was estimated as thecalculated background concentration of nearby springs (80 µg/L) (see Attachment 2- Table 3 for springnutrient concentration summaries).
Point Source Associated SpringSamples
n
Median13 TotalPhosphorus
(ppb)Chiloquin STP Spring Creek Springs 11 80
Crooked Creek Hatchery Crooked Creek Springs 10 90
Table 2-8. Point Source Flow Discharge Data, Estimated Phosphorus Concentrations and CalculatedLoading Rates
PhosphorusConcentration (µg/l)
Total Phosphorus Load(mton/year)
DischargeQ
(cms)Current(Pcurrent)
Background& Allowable
(PWLA)Current(Load)
Allowable (WLA)
TotalPhosphorus
LoadReduction
ChiloquinSewage
TreatmentPlant*
1.38.105 4000 802,400 0.55 0.33 40%
CrookedCreek
Hatchery1.43.107 130 90
90 1.86 1.29 31%
*A 40% reduction in load is targeted for the Chiloquin Sewage Treatment Plant. Background concentration is not targeted.
13 The median total phosphorus concentration of nearby springs is used to estimate local background levels (PWLA) that serve as the
lower bound for reductions.
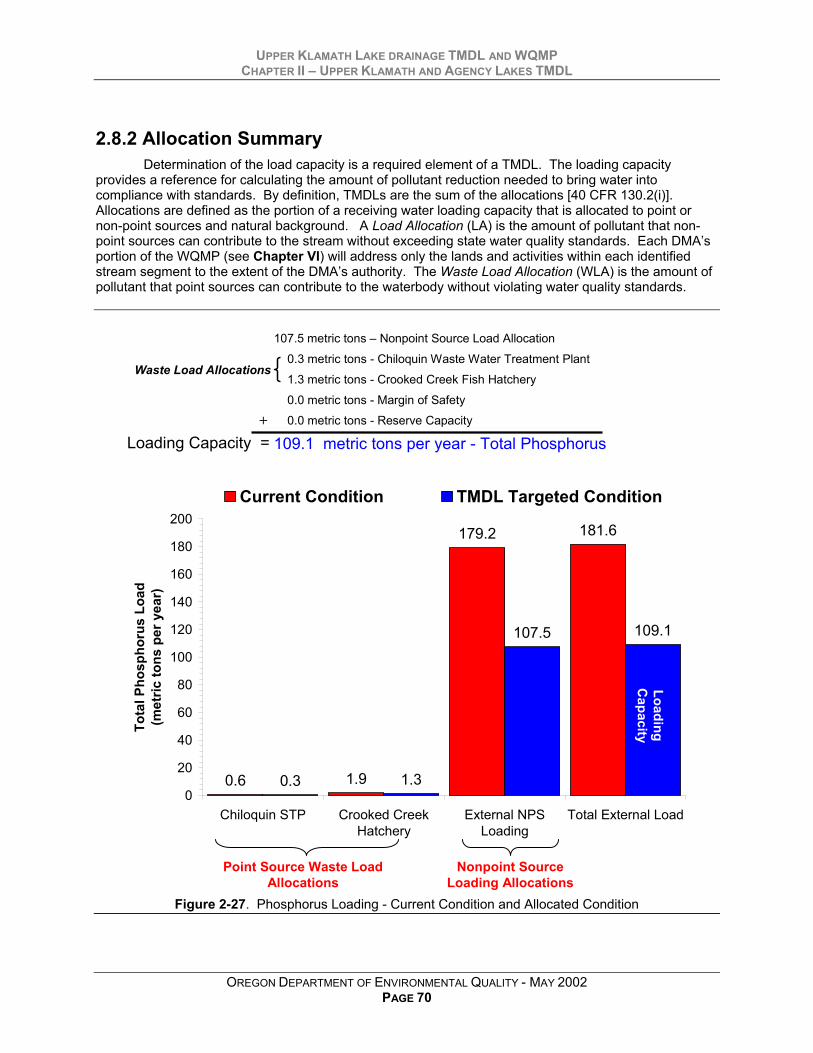
UPPER KLAMATH LAKE DRAINAGE TMDL AND WQMPCHAPTER II – UPPER KLAMATH AND AGENCY LAKES TMDL
OREGON DEPARTMENT OF ENVIRONMENTAL QUALITY - MAY 2002PAGE 70
2.8.2 Allocation SummaryDetermination of the load capacity is a required element of a TMDL. The loading capacity
provides a reference for calculating the amount of pollutant reduction needed to bring water intocompliance with standards. By definition, TMDLs are the sum of the allocations [40 CFR 130.2(i)].Allocations are defined as the portion of a receiving water loading capacity that is allocated to point ornon-point sources and natural background. A Load Allocation (LA) is the amount of pollutant that non-point sources can contribute to the stream without exceeding state water quality standards. Each DMA’sportion of the WQMP (see Chapter VI) will address only the lands and activities within each identifiedstream segment to the extent of the DMA’s authority. The Waste Load Allocation (WLA) is the amount ofpollutant that point sources can contribute to the waterbody without violating water quality standards.
Loading Capacity =
107.5 metric tons – Nonpoint Source Load Allocation
0.3 metric tons - Chiloquin Waste Water Treatment Plant1.3 metric tons - Crooked Creek Fish Hatchery
0.0 metric tons - Margin of Safety0.0 metric tons - Reserve Capacity
109.1 metric tons per year - Total Phosphorus+
Waste Load Allocations
0.6 1.9
179.2 181.6
0.3 1.3
109.1107.5
0
20
40
60
80
100
120
140
160
180
200
Chiloquin STP Crooked CreekHatchery
External NPSLoading
Total External Load
Tota
l Pho
spho
rus
Load
(met
ric to
ns p
er y
ear)
Current Condition TMDL Targeted Condition
Nonpoint SourceLoading Allocations
Point Source Waste Load Allocations
LoadingC
apacity
Figure 2-27. Phosphorus Loading - Current Condition and Allocated Condition

UPPER KLAMATH LAKE DRAINAGE TMDL AND WQMPCHAPTER II – UPPER KLAMATH AND AGENCY LAKES TMDL
OREGON DEPARTMENT OF ENVIRONMENTAL QUALITY - MAY 2002PAGE 71
Table 2-9. Allocation Summary
Nonpoint Sources
SourceLoading Allocation
Allowable Nonpoint SourceTotal phosphorous Load
(metric tons/year)Nonpoint Source External Sources 107.5
Point Sources
Facility Name Receiving WaterWaste Load Allocation
Allowable Point Source Totalphosphorous Load(metric tons/year)
Chiloquin Sewage Treatment Plant Williamson River 0.3Crooked Creek Fish Hatchery Crooked Creek 1.3
All Point Sources 1.6Reserve Capacity and Margins of Safety
Reserve Capacity 0.00Margin of Safety 0.0
Total Allowable External Phosphorus Loading 109.1
2.9 DERIVED WATER QUALITY TARGETS –SURROGATE MEASURES
The Upper Klamath Lake TMDL incorporates measures in addition to the daily loads presented inSection 2.8 Allocations to fulfill requirements of 303(d). While it is important to quantify and analyze thetotal phosphorus pollutant load reductions in the TMDL, it is also helpful to identify target concentrationsthat help guide management activities and compliance monitoring and tracking. Phosphorus targetconcentrations are presented below for the lake and tributaries that correlate with the TMDL targeted 40%external total phosphorus loading reduction to Upper Klamath and Agency Lakes (Walker 2001).
Lake and Inflow Total Phosphorus Concentration Targets~110 µg/l annual lake mean total phosphorus concentration~30 µg/l spring (March - May) lake mean total phosphorus concentration~66 µg/l annual mean total phosphorus concentration from all inflows to the lake
Total Phosphorus Loading Reduction~40% external loading reduction of total phosphorus where possible

UPPER KLAMATH LAKE DRAINAGE TMDL AND WQMPCHAPTER II – UPPER KLAMATH AND AGENCY LAKES TMDL
OREGON DEPARTMENT OF ENVIRONMENTAL QUALITY - MAY 2002PAGE 72
2.10 MARGINS OF SAFETY - CWA §303(D)(1)The Clean Water Act requires that each TMDL be established with a margin of safety (MOS).
The statutory requirement that TMDLs incorporate a MOS is intended to account for uncertainty inavailable data or in the actual effect controls will have on loading reductions and receiving water quality.A MOS is expressed as unallocated assimilative capacity or conservative analytical assumptions used inestablishing the TMDL (e.g., derivation of numeric targets, modeling assumptions or effectiveness ofproposed management actions).
The MOS may be implicit, as in conservative assumptions used in calculating the loadingcapacity, Waste Load Allocation, and Load Allocations. The MOS may also be explicitly stated as anadded, separate quantity in the TMDL calculation. In any case, assumptions should be stated and thebasis behind the MOS documented. The MOS is not meant to compensate for a failure to considerknown sources. Table 2-10 presents six approaches for incorporating a MOS into TMDLs. The followingfactors may be considered in evaluating and deriving an appropriate MOS:
• The analysis and techniques used in evaluating the components of the TMDL process and derivingan allocation scheme.
• Characterization and estimates of source loading (e.g., confidence regarding data limitation, analysislimitation or assumptions).
• Analysis of relationships between the source loading and instream impact.• Prediction of response of receiving waters under various allocation scenarios (e.g., the predictive
capability of the analysis, simplifications in the selected techniques).• The implications of the MOS on the overall load reductions identified in terms of reduction feasibility
and implementation time frames.
A TMDL and associated MOS, which results in an overall allocation, represents the best estimateof how standards can be achieved. The selection of the MOS should clarify the implications formonitoring and implementation planning in refining the estimate if necessary (adaptive management).The TMDL process accommodates the ability to track and ultimately refine assumptions within the TMDLimplementation-planning component.
Table 2-10. Approaches for Incorporating a Margin of Safety into a TMDL
Type of Margin ofSafety Available Approaches
Explicit1. Set numeric targets at more conservative levels than analytical resultsindicate.2. Add a safety factor to pollutant loading estimates.3. Do not allocate a portion of available loading capacity; reserve for MOS.
Implicit
1. Conservative assumptions in derivation of numeric targets.2. Conservative assumptions when developing numeric modelapplications.3. Conservative assumptions when analyzing prospective feasibility ofpractices and restoration activities.
UPPER KLAMATH LAKE DRAINAGE TMDL AND WQMPCHAPTER II – UPPER KLAMATH AND AGENCY LAKES TMDL
OREGON DEPARTMENT OF ENVIRONMENTAL QUALITY - MAY 2002PAGE 73
Implicit Margins of SafetyA MOS has been incorporated into the calculation of waste load and load allocations.
Specifically, conservative assumptions are used in derivation of numeric targets and conservativeassumptions are used when developing numeric model applications.
Reserve CapacityThere is no allocated pollutant load for future sources of heat in the Upper Klamath Lake
drainage.

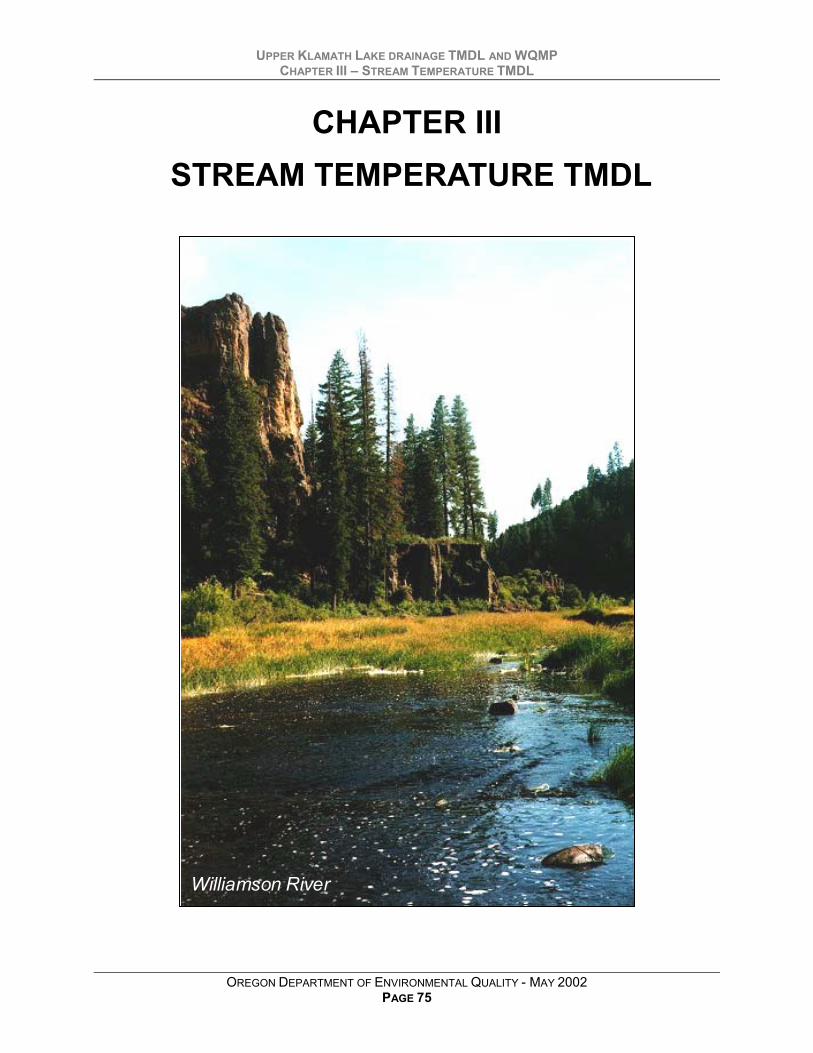
UPPER KLAMATH LAKE DRAINAGE TMDL AND WQMPCHAPTER III – STREAM TEMPERATURE TMDL
OREGON DEPARTMENT OF ENVIRONMENTAL QUALITY - MAY 2002PAGE 75
CHAPTER III STREAM TEMPERATURE TMDL
Williamson River

UPPER KLAMATH LAKE DRAINAGE TMDL AND WQMPCHAPTER III – STREAM TEMPERATURE TMDL
OREGON DEPARTMENT OF ENVIRONMENTAL QUALITY - MAY 2002PAGE 76
3.1 OVERVIEW
3.1.1 Summary of Temperature TMDL Development and Approach
TMDL - Allocations and Surrogate MeasuresTargets for Meeting the Temperature Standard
TMDL - Source Assessment• TMDL scaled to sub-basin due to cumulative thermal processes.• Identify human related sources of stream warming• Increased solar radiation loading is the primary nonpoint source pollutant• Near stream vegetation removal/disturbance is the mechanism for
decreased stream surface shade and increased solar radiation loading• Develop system potential as the condition that allows no pollutant loading
from anthropogenic activities - establish background condition• Potential near stream vegetation is that which can reproduce at a site
given elevation, soil types, hydrology, and plant biology. Vegetationtype/condition is developed and quantified and then used to estimatenonpoint source pollutant loading
• Quantify nonpoint source heat• Quantify point source heat
• Nonpoint sources are allocated zero pollutant loading thus meeting the“no measurable surface water temperature increase resulting fromanthropogenic activities…” specified in the standard.
• Point sources are allowed heat that produces 0.25oF increase overbackground temperatures within the zone of dilution.
• Effective shade surrogate measures are used to help translate thenonpoint source heat loading allocation.
• Meeting the effective shade surrogate measures ensures attainment ofnonpoint source heat loading allocations.
Temperature Standard“no measurable surface water temperature increase
resulting from anthropogenic activities…”
303(d) ListingNumeric and qualitative triggers invoke the temperature standard.
A TMDL is then developed.
Com
pletion of Temperature TM
DL
Figure 3-1. Oregon DEQ Temperature Standard, 303(d) Listing and TMDL Development Process

UPPER KLAMATH LAKE DRAINAGE TMDL AND WQMPCHAPTER III – STREAM TEMPERATURE TMDL
OREGON DEPARTMENT OF ENVIRONMENTAL QUALITY - MAY 2002PAGE 77
3.1.1.1 Summary of Stream Temperature StandardHuman activities and aquatic species that are to be protected by water quality standards are
deemed beneficial uses. Water quality standards are developed to protect the most sensitive beneficialuse within a water body of the State. The stream temperature standard is designed to protect coldwater fish (salmonids) rearing and spawning as the most sensitive beneficial use.
Several numeric and qualitative trigger conditions invoke the temperature standard. Numerictriggers are based on temperatures that protect various salmonid life stages. Qualitative triggers specifyconditions that deserve special attention, such as the presence of threatened and endangered cold waterspecies, dissolved oxygen violations and/or discharge into natural lake systems. The occurrence of oneor more of the stream temperature trigger will invoke the temperature standard.
Once invoked, a water body is designated water quality limited. For such water quality limitedwater bodies, the temperature standard specifically states that “no measurable surface watertemperature increase resulting from anthropogenic activities is allowed” (OAR 340-41-0962(2)(b)(A)). Thermally impaired water bodies in the Upper Klamath Lake drainage are subject to thetemperature standard that mandates a condition of no allowable anthropogenic related temperatureincreases.
3.1.1.2 Summary of Stream Temperature TMDL ApproachStream temperature TMDLs are generally scaled to a subbasin or basin and include all perennial
surface waters with salmonid presence or that contribute to areas with salmonid presence. Since streamtemperature results from cumulative interactions between upstream and local sources, the TMDLconsiders all surface waters that affect the temperatures of 303(d) listed water bodies. For example, theWilliamson River is water quality limited for temperature. To address this listing in the TMDL, theWilliamson River and all major tributaries are included in the TMDL analysis and TMDL targets applythroughout the entire stream network. This broad approach is necessary to address the cumulativenature of stream temperature dynamics.
The temperature standard specifies that "no measurable surface water temperature increaseresulting from anthropogenic activities is allowed”. An important step in the TMDL is to examine theanthropogenic contributions to stream heating. The pollutant is heat. The TMDL establishes that that theanthropogenic contributions of nonpoint source solar radiation heat loading results from varying levels ofdecreased stream surface shade throughout the sub-basin. Decreased levels of stream shade arecaused by near stream land cover disturbance/removal and channel morphology changes. Otheranthropogenic sources of stream warming include stream flow reductions and warm surface water returnflows.
As defined in this TMDL, system potential is the combination of potential near stream land covercondition and potential channel morphology conditions. Potential near stream land cover is that whichcan grow and reproduce on a site, given: climate, elevation, soil properties, plant biology and hydrologicprocesses. Potential channel morphology is developed using an estimate of width to depth ratiosappropriate for the Rosgen channel type regressed from regional curves. System potential does notconsider management or land use as limiting factors. In essence, system potential is the designcondition used for TMDL analysis that meets the temperature standard by minimizing humanrelated warming.
• System potential is an estimate of the condition where anthropogenic activities that cause streamwarming are minimized.
• System potential is not an estimate of pre-settlement conditions. Although it is helpful to considerhistoric land cover patterns, channel conditions and hydrology, many areas have been altered to thepoint that the historic condition is no longer attainable given changes in stream location and hydrology(channel armoring, wetland draining, urbanization, etc.).
UPPER KLAMATH LAKE DRAINAGE TMDL AND WQMPCHAPTER III – STREAM TEMPERATURE TMDL
OREGON DEPARTMENT OF ENVIRONMENTAL QUALITY - MAY 2002PAGE 78
Heat is the identified pollutant. Nonpoint sources are expected to eliminate the anthropogenicportion of solar radiation heat loading. Point sources are allowed heating that results in less than 0.25oFincrease in a defined mixing zone. Allocated conditions are expressed as heat per unit time (kcal perday). The nonpoint source heat allocation is translated to effective shade surrogate measures thatlinearly translates the nonpoint source solar radiation allocation. Effective shade surrogate measuresprovide site-specific targets for land managers. And, attainment of the surrogate measures ensurescompliance with the nonpoint source allocations.
3.1.1.3 Limitations of Stream Temperature TMDL ApproachIt is important to acknowledge limitations to analytical outputs and to indicate where future
scientific advancements are needed and to provide some context for how results should be used inregulatory processes, outreach and education and academic studies. The past decade has broughtremarkable progress in stream temperature monitoring and analysis. Undoubtedly there will be continuedadvancements in the science related to stream temperature.
While the stream temperature data and analytical methods presented in TMDLs arecomprehensive, there are limitations to the applicability of the results. Like any scientific investigation,research completed in a TMDL is limited to the current scientific understanding of the water qualityparameter and data availability for other parameters that affect the water quality parameter. Physical,thermodynamic and biological relationships are well understood at finite spatial and temporal scales.However, at a large scale, such as a subbasin or basin, there are limits to the current analyticalcapabilities.
The state of scientific understanding of stream temperature is evolving, however, there are stillareas of analytical uncertainty that introduce errors into the analysis. Three major limitations should berecognized:
• Current analysis is focused on a defined critical condition. This usually occurs in late July or earlyAugust when stream flows are low, radiant heating rates are high and ambient conditions are warm.However, there are several other important time periods where fewer data are available and theanalysis is less explicit. For example, spawning periods have not received comparable treatment asthe period of seasonal maximum stream temperature.
• Current analytical methods fail to capture some upland, atmospheric and hydrologic processes. At alandscape scale these exclusions can lead to errors in analytical outputs. For example, methods donot currently exist to simulate riparian microclimates at a landscape scale.
• In some cases, there is not scientific consensus related to riparian, channel morphology andhydrologic potential conditions. This is especially true when confronted with highly disturbed sites,meadows and marshes and potential hyporheic/subsurface flows.
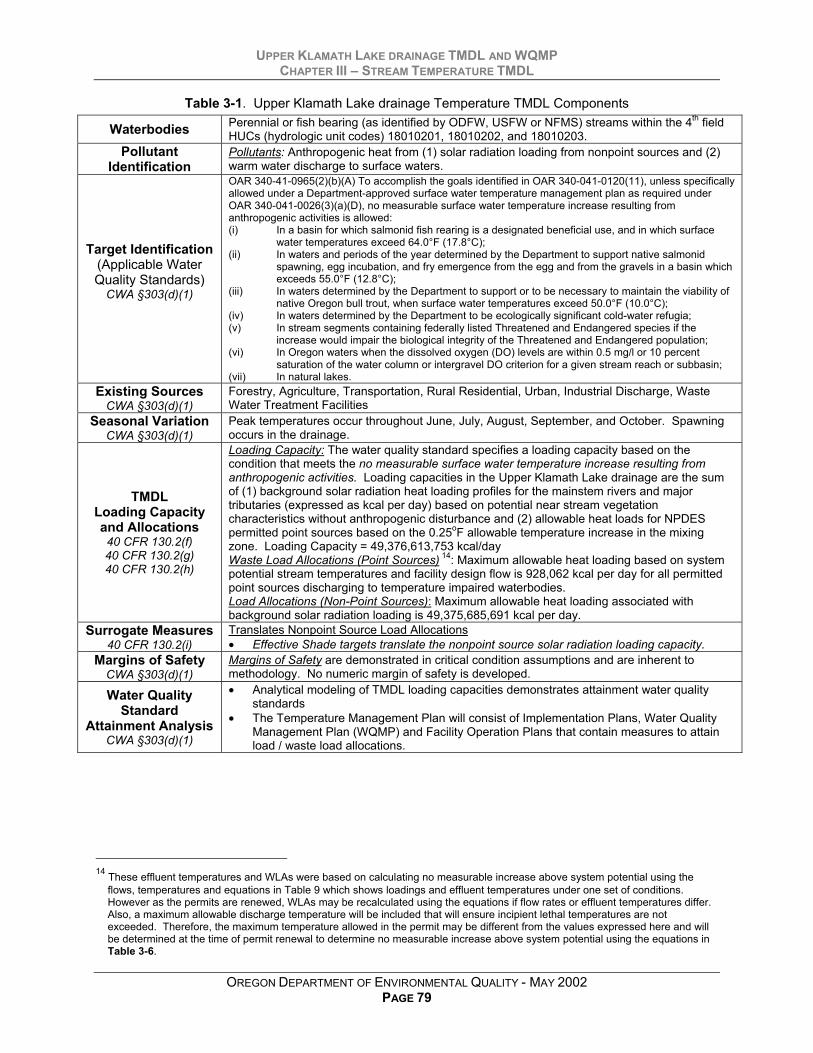
UPPER KLAMATH LAKE DRAINAGE TMDL AND WQMPCHAPTER III – STREAM TEMPERATURE TMDL
OREGON DEPARTMENT OF ENVIRONMENTAL QUALITY - MAY 2002PAGE 79
Table 3-1. Upper Klamath Lake drainage Temperature TMDL Components
Waterbodies Perennial or fish bearing (as identified by ODFW, USFW or NFMS) streams within the 4th fieldHUCs (hydrologic unit codes) 18010201, 18010202, and 18010203.
PollutantIdentification
Pollutants: Anthropogenic heat from (1) solar radiation loading from nonpoint sources and (2)warm water discharge to surface waters.
Target Identification(Applicable WaterQuality Standards)
CWA §303(d)(1)
OAR 340-41-0965(2)(b)(A) To accomplish the goals identified in OAR 340-041-0120(11), unless specificallyallowed under a Department-approved surface water temperature management plan as required underOAR 340-041-0026(3)(a)(D), no measurable surface water temperature increase resulting fromanthropogenic activities is allowed:(i) In a basin for which salmonid fish rearing is a designated beneficial use, and in which surface
water temperatures exceed 64.0°F (17.8°C);(ii) In waters and periods of the year determined by the Department to support native salmonid
spawning, egg incubation, and fry emergence from the egg and from the gravels in a basin whichexceeds 55.0°F (12.8°C);
(iii) In waters determined by the Department to support or to be necessary to maintain the viability ofnative Oregon bull trout, when surface water temperatures exceed 50.0°F (10.0°C);
(iv) In waters determined by the Department to be ecologically significant cold-water refugia;(v) In stream segments containing federally listed Threatened and Endangered species if the
increase would impair the biological integrity of the Threatened and Endangered population;(vi) In Oregon waters when the dissolved oxygen (DO) levels are within 0.5 mg/l or 10 percent
saturation of the water column or intergravel DO criterion for a given stream reach or subbasin;(vii) In natural lakes.
Existing SourcesCWA §303(d)(1)
Forestry, Agriculture, Transportation, Rural Residential, Urban, Industrial Discharge, WasteWater Treatment Facilities
Seasonal VariationCWA §303(d)(1)
Peak temperatures occur throughout June, July, August, September, and October. Spawningoccurs in the drainage.
TMDLLoading Capacityand Allocations40 CFR 130.2(f)40 CFR 130.2(g)40 CFR 130.2(h)
Loading Capacity: The water quality standard specifies a loading capacity based on thecondition that meets the no measurable surface water temperature increase resulting fromanthropogenic activities. Loading capacities in the Upper Klamath Lake drainage are the sumof (1) background solar radiation heat loading profiles for the mainstem rivers and majortributaries (expressed as kcal per day) based on potential near stream vegetationcharacteristics without anthropogenic disturbance and (2) allowable heat loads for NPDESpermitted point sources based on the 0.25oF allowable temperature increase in the mixingzone. Loading Capacity = 49,376,613,753 kcal/dayWaste Load Allocations (Point Sources) 14: Maximum allowable heat loading based on systempotential stream temperatures and facility design flow is 928,062 kcal per day for all permittedpoint sources discharging to temperature impaired waterbodies.Load Allocations (Non-Point Sources): Maximum allowable heat loading associated withbackground solar radiation loading is 49,375,685,691 kcal per day.
Surrogate Measures40 CFR 130.2(i)
Translates Nonpoint Source Load Allocations• Effective Shade targets translate the nonpoint source solar radiation loading capacity.
Margins of SafetyCWA §303(d)(1)
Margins of Safety are demonstrated in critical condition assumptions and are inherent tomethodology. No numeric margin of safety is developed.
Water QualityStandard
Attainment AnalysisCWA §303(d)(1)
• Analytical modeling of TMDL loading capacities demonstrates attainment water qualitystandards
• The Temperature Management Plan will consist of Implementation Plans, Water QualityManagement Plan (WQMP) and Facility Operation Plans that contain measures to attainload / waste load allocations.
14 These effluent temperatures and WLAs were based on calculating no measurable increase above system potential using the
flows, temperatures and equations in Table 9 which shows loadings and effluent temperatures under one set of conditions.However as the permits are renewed, WLAs may be recalculated using the equations if flow rates or effluent temperatures differ.Also, a maximum allowable discharge temperature will be included that will ensure incipient lethal temperatures are notexceeded. Therefore, the maximum temperature allowed in the permit may be different from the values expressed here and willbe determined at the time of permit renewal to determine no measurable increase above system potential using the equations inTable 3-6.

UPPER KLAMATH LAKE DRAINAGE TMDL AND WQMPCHAPTER III – STREAM TEMPERATURE TMDL
OREGON DEPARTMENT OF ENVIRONMENTAL QUALITY - MAY 2002PAGE 80
3.1.2 Salmonid Thermal RequirementsSalmonids and some amphibians are highly sensitive to temperature. In particular, bull trout
(Salvelinus confluentus) are among the most temperature sensitive of the cold water fish species.Oregon’s water temperature standard employs logic that relies on using indicator species, which are themost sensitive. If temperatures are protective of indicator species, other species will share in this level ofprotection.
If stream temperatures become too hot, fish die almost instantaneously due to denaturing ofcritical enzyme systems in their bodies (Hogan, 1970). The ultimate instantaneous lethal limit occurs inhigh temperature ranges (upper-90oF). Such warm temperature extremes are rare in the Upper KlamathLake drainage.
More common and widespread within the Upper Klamath Lake drainage are summertime streamtemperatures in the mid-70oF range (mid- to high-20oC range). These temperatures cause death of cold-water fish species during exposure times lasting a few hours to one day. The exact temperature at whicha cold water fish succumbs to such a thermal stress depends on the temperature that the fish isacclimated, as well as, particular development life-stages. This cause of mortality, termed the incipientlethal limit, results from breakdown of physiological regulation of vital processes such as respiration andcirculation (Heath and Hughes, 1973).
The most common and widespread cause of thermally induced fish mortality is attributed tointeractive effects of decreased or lack of metabolic energy for feeding, growth or reproductive behavior,increased exposure to pathogens (viruses, bacteria and fungus), decreased food supply (impairedmacroinvertebrate populations) and increased competition from warm water tolerant species. This modeof thermally induced mortality, termed indirect or sub-lethal, is more delayed, and occurs weeks to monthsafter the onset of elevated temperatures (mid-60oF to low-70oF). Table 3-2 summarizes the modes ofcold water fish mortality.
Table 3-2. Modes of Thermally Induced Cold Water Fish Mortality(Brett, 1952; Bell, 1986, Hokanson et al., 1977)
Modes of Thermally Induced Fish Mortality TemperatureRange
Time toDeath
Instantaneous Lethal Limit – Denaturing of bodily enzymesystems
> 90oF> 32oC Instantaneous
Incipient Lethal Limit – Breakdown of physiological regulation ofvital bodily processes, namely: respiration and circulation
70oF - 77oF21oC - 25oC Hours to Days
Sub-Lethal Limit – Conditions that cause decreased or lack ofmetabolic energy for feeding, growth or reproductive behavior,encourage increased exposure to pathogens, decreased foodsupply and increased competition from warm water tolerantspecies
64oF - 74oF17.8oC - 23oC
Weeks toMonths

UPPER KLAMATH LAKE DRAINAGE TMDL AND WQMPCHAPTER III – STREAM TEMPERATURE TMDL
OREGON DEPARTMENT OF ENVIRONMENTAL QUALITY - MAY 2002PAGE 81
3.2 TARGET IDENTIFICATION – CWA §303(D)(1)
3.2.1 Sensitive Beneficial Use IdentificationSalmonid fish spawning, incubation, fry emergence, and rearing are deemed the most temperature-
sensitive beneficial uses within the Upper Klamath Lake drainage.
Beneficial uses and the associated water quality standards are generally applicable drainage-wide (i.e., the Upper Klamath Lake drainage). Some uses require further delineation. At a minimum,uses are considered attainable wherever feasible or wherever attained historically. In applying standardsand restoration, it is important to know where existing salmonid spawning locations are and where theyare potentially attainable. Salmonid spawning and the quality of the spawning grounds are particularlysensitive to water quality and streambed conditions. Other sensitive uses (such as drinking water andwater contact recreation) are applicable throughout the drainage. Oregon Administrative Rules (OARChapter 340, Division 41, Section 962, Table 19) lists the “Beneficial Uses” occurring within the KlamathBasin (Table 3-3). Numeric and narrative water quality standards are designed to protect the mostsensitive beneficial uses. Salmonid spawning and rearing are the most sensitive beneficial uses in theUpper Klamath Lake drainage.
Table 3-3. Beneficial uses occurring in the Upper Klamath Lake drainage(OAR 340 – 41 – 962)
Temperature-Sensitive Beneficial uses are marked in Red
Beneficial Use Occurring Beneficial Use OccurringPublic Domestic Water Supply Salmonid Fish Spawning (Trout)Private Domestic Water Supply Salmonid Fish Rearing (Trout)
Industrial Water Supply Resident Fish and Aquatic LifeIrrigation Anadromous Fish Passage
Livestock Watering Wildlife and HuntingBoating Fishing
Hydro Power Water Contact RecreationAesthetic Quality Commercial Nav./Transport.
The Lost River sucker (Deltistes luxatus), and the shortnose sucker (Chasmistes brevirostris)were placed on the endangered species list in 1988. The Lost River sucker and the shortnose sucker arenative to Upper Klamath Lake and its tributaries (see Figure 1-9, page 18). Both species are primarilylake residents that spawn in the lake’s tributaries (i.e., streams, rivers, and springs). Construction ofdams, instream diversion structures, irrigation canals, wetland draining, and the dredging of UpperKlamath Lake have fragmented their historical habitat range. Water quality degradation in the UpperKlamath Lake drainage has led to large-scale fish kills related to algal bloom cycles. Elevated watertemperatures stimulate algal growth, which in turn depletes dissolved oxygen levels and increases thepH. Reducing stream temperatures will help preserve endangered Lost River sucker and shortnosesucker populations.
Bull trout (Salvelinus confluentus) were listed as threatened without critical habitat in 1998.Isolated remnant populations remain in the headwaters of rivers and in spring water dominated streams inthe Upper Klamath Lake drainage (see Figure 1-8, page 16). Stream habitat alterations that have
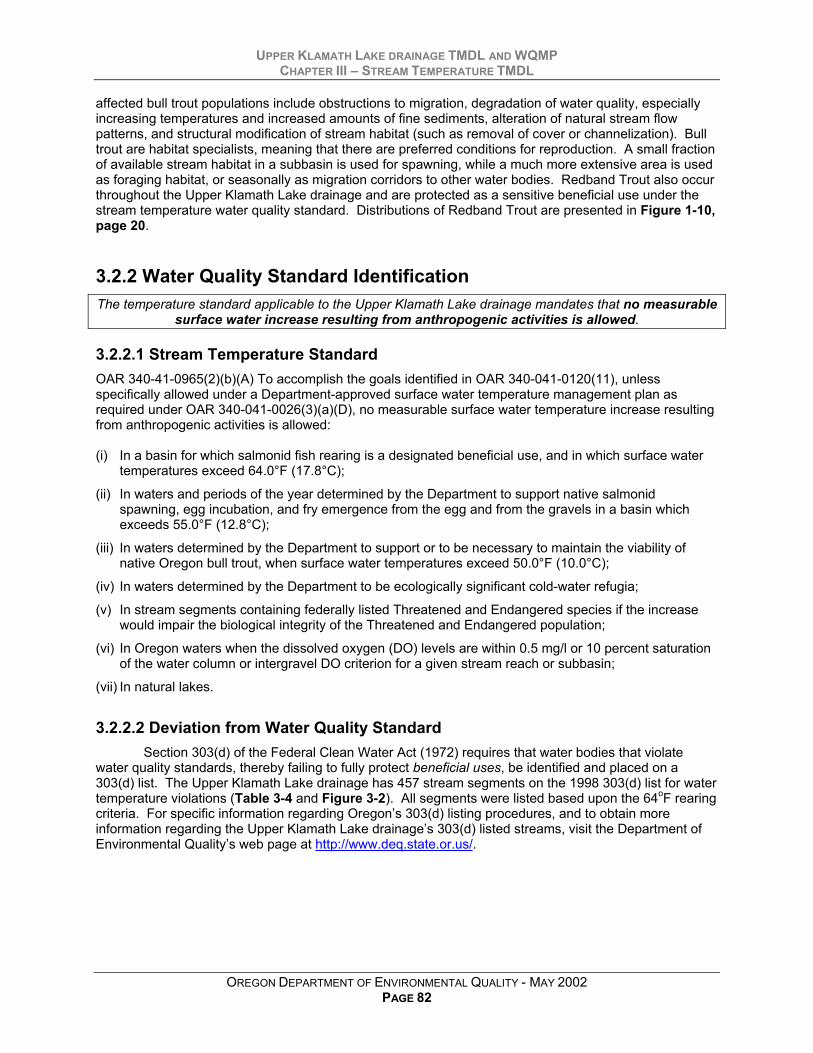
UPPER KLAMATH LAKE DRAINAGE TMDL AND WQMPCHAPTER III – STREAM TEMPERATURE TMDL
OREGON DEPARTMENT OF ENVIRONMENTAL QUALITY - MAY 2002PAGE 82
affected bull trout populations include obstructions to migration, degradation of water quality, especiallyincreasing temperatures and increased amounts of fine sediments, alteration of natural stream flowpatterns, and structural modification of stream habitat (such as removal of cover or channelization). Bulltrout are habitat specialists, meaning that there are preferred conditions for reproduction. A small fractionof available stream habitat in a subbasin is used for spawning, while a much more extensive area is usedas foraging habitat, or seasonally as migration corridors to other water bodies. Redband Trout also occurthroughout the Upper Klamath Lake drainage and are protected as a sensitive beneficial use under thestream temperature water quality standard. Distributions of Redband Trout are presented in Figure 1-10,page 20.
3.2.2 Water Quality Standard IdentificationThe temperature standard applicable to the Upper Klamath Lake drainage mandates that no measurable
surface water increase resulting from anthropogenic activities is allowed.
3.2.2.1 Stream Temperature StandardOAR 340-41-0965(2)(b)(A) To accomplish the goals identified in OAR 340-041-0120(11), unlessspecifically allowed under a Department-approved surface water temperature management plan asrequired under OAR 340-041-0026(3)(a)(D), no measurable surface water temperature increase resultingfrom anthropogenic activities is allowed:
(i) In a basin for which salmonid fish rearing is a designated beneficial use, and in which surface watertemperatures exceed 64.0°F (17.8°C);
(ii) In waters and periods of the year determined by the Department to support native salmonidspawning, egg incubation, and fry emergence from the egg and from the gravels in a basin whichexceeds 55.0°F (12.8°C);
(iii) In waters determined by the Department to support or to be necessary to maintain the viability ofnative Oregon bull trout, when surface water temperatures exceed 50.0°F (10.0°C);
(iv) In waters determined by the Department to be ecologically significant cold-water refugia;
(v) In stream segments containing federally listed Threatened and Endangered species if the increasewould impair the biological integrity of the Threatened and Endangered population;
(vi) In Oregon waters when the dissolved oxygen (DO) levels are within 0.5 mg/l or 10 percent saturationof the water column or intergravel DO criterion for a given stream reach or subbasin;
(vii) In natural lakes.
3.2.2.2 Deviation from Water Quality StandardSection 303(d) of the Federal Clean Water Act (1972) requires that water bodies that violate
water quality standards, thereby failing to fully protect beneficial uses, be identified and placed on a303(d) list. The Upper Klamath Lake drainage has 457 stream segments on the 1998 303(d) list for watertemperature violations (Table 3-4 and Figure 3-2). All segments were listed based upon the 64oF rearingcriteria. For specific information regarding Oregon’s 303(d) listing procedures, and to obtain moreinformation regarding the Upper Klamath Lake drainage’s 303(d) listed streams, visit the Department ofEnvironmental Quality’s web page at http://www.deq.state.or.us/.

UPPER KLAMATH LAKE DRAINAGE TMDL AND WQMPCHAPTER III – STREAM TEMPERATURE TMDL
OREGON DEPARTMENT OF ENVIRONMENTAL QUALITY - MAY 2002PAGE 83
Figure 3-2. 1998 303(d) List for Temperature (Bolded Red Lines)

UPPER KLAMATH LAKE DRAINAGE TMDL AND WQMPCHAPTER III – STREAM TEMPERATURE TMDL
OREGON DEPARTMENT OF ENVIRONMENTAL QUALITY - MAY 2002PAGE 84
Table 3-4. Upper Klamath Lake drainage Stream Segments on the 1998 303(d) List for Temperature
Subbasin Name Stream Name Segment ListedSprague Boulder Creek Mouth to HeadwatersSprague Brownsworth Creek Mouth to Hammond CreekSprague Brownsworth Creek Hammond Creek to HeadwatersSprague Buckboard Creek Mouth to HeadwatersSprague Calahan Creek Mouth to Hammond CreekSprague Coyote Creek Mouth to HeadwatersSprague Deming Creek Mouth to Campbell Reservoir DiversionSprague Deming Creek Campbell Reservoir Diversion to HeadwatersSprague Fishhole Creek Mouth to HeadwatersSprague Fivemile Creek Mouth to HeadwatersSprague Leonard Creek Mouth to HeadwatersSprague Long Creek (Sycan Marsh) Sycan Marsh to Calahan CreekSprague Paradise Creek Mouth to HeadwatersSprague Pothole Creek Mouth to HeadwatersSprague Sprague River Mouth to North/South ForkSprague Sprague River, North Fork Mouth to Dead Cow CreekSprague Sprague River, South Fork Mouth to Camp CreekSprague Sycan River Mouth to Rock CreekSprague Trout Creek Mouth to Headwaters
Williamson Williamson River Mouth to Sprague RiverWilliamson Williamson River Sprague River to Klamath MarshWilliamson Williamson River Klamath Marsh to Headwaters
Upper Klamath Lake Fourmile Creek Mouth to RM 1Upper Klamath Lake Rock Creek Mouth to Headwaters
3.2.3 Pollutant IdentificationHeat originating from human increases in solar radiation loading and warm water discharge to surface
waters.
With a few exceptions, such as in cases where violations are due to natural causes, the Statemust establish a Total Maximum Daily Load or TMDL for any waterbody designated on the 303(d) list asviolating water quality standards. A TMDL is the total amount of a pollutant (from all sources) that canenter a specific waterbody without violating the water quality standards
Water temperature change is an expression of heat energy exchange per unit volume:
VolumeEnergyHeateTemperatur ∆∝∆
Anthropogenic heat sources are derived from solar radiation as increased levels of sunlight reachthe stream surface and effluent discharges to surface waters. Therefore, the pollutants targeted in thisTMDL are (1) heat from human caused increases in solar radiation loading to the stream network and (2)heat from warm water discharges of human origin.
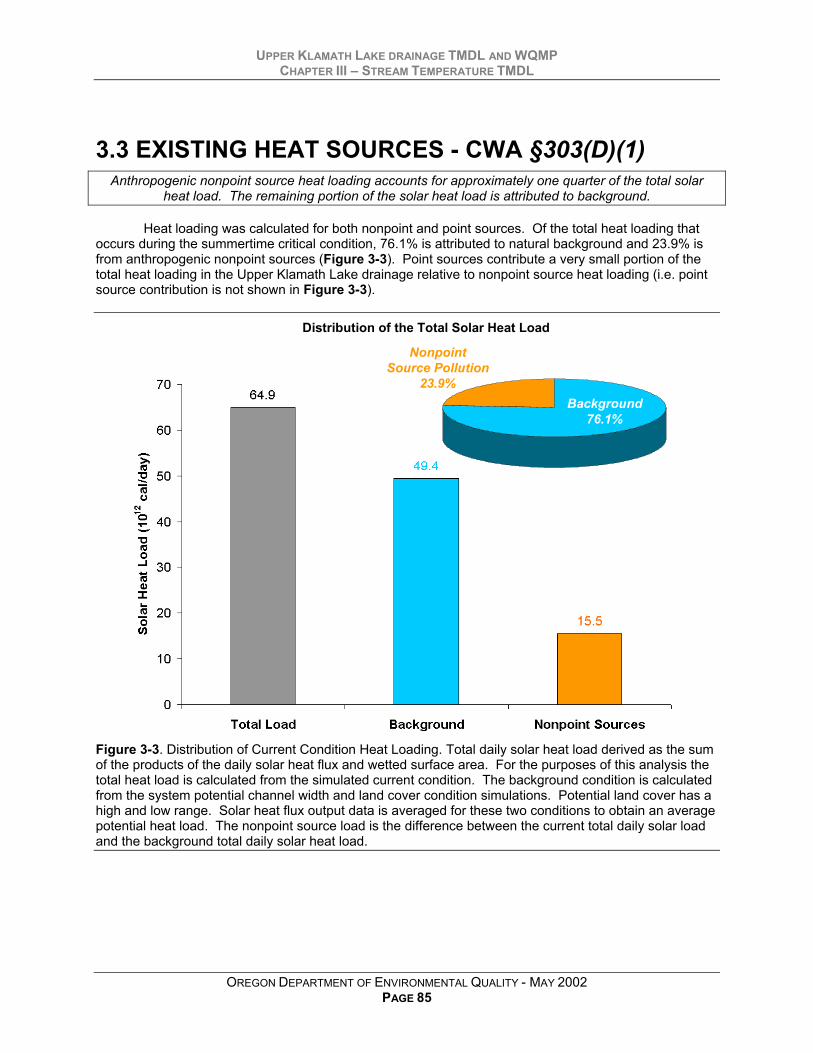
UPPER KLAMATH LAKE DRAINAGE TMDL AND WQMPCHAPTER III – STREAM TEMPERATURE TMDL
OREGON DEPARTMENT OF ENVIRONMENTAL QUALITY - MAY 2002PAGE 85
3.3 EXISTING HEAT SOURCES - CWA §303(D)(1)Anthropogenic nonpoint source heat loading accounts for approximately one quarter of the total solar
heat load. The remaining portion of the solar heat load is attributed to background.
Heat loading was calculated for both nonpoint and point sources. Of the total heat loading thatoccurs during the summertime critical condition, 76.1% is attributed to natural background and 23.9% isfrom anthropogenic nonpoint sources (Figure 3-3). Point sources contribute a very small portion of thetotal heat loading in the Upper Klamath Lake drainage relative to nonpoint source heat loading (i.e. pointsource contribution is not shown in Figure 3-3).
Distribution of the Total Solar Heat Load
NonpointSource Pollution
23.9%Background
76.1%
Figure 3-3. Distribution of Current Condition Heat Loading. Total daily solar heat load derived as the sumof the products of the daily solar heat flux and wetted surface area. For the purposes of this analysis thetotal heat load is calculated from the simulated current condition. The background condition is calculatedfrom the system potential channel width and land cover condition simulations. Potential land cover has ahigh and low range. Solar heat flux output data is averaged for these two conditions to obtain an averagepotential heat load. The nonpoint source load is the difference between the current total daily solar loadand the background total daily solar heat load.
UPPER KLAMATH LAKE DRAINAGE TMDL AND WQMPCHAPTER III – STREAM TEMPERATURE TMDL
OREGON DEPARTMENT OF ENVIRONMENTAL QUALITY - MAY 2002PAGE 86
3.3.1 Nonpoint Sources of HeatElevated summertime stream temperatures attributed to nonpoint sources result from increased solar
radiation heat loading. Near stream vegetation disturbance/removal and channel morphologydisturbances have reduced levels of stream shading and exposed streams to higher levels of solar
radiation (i.e., reduction in stream surface shading via decreased riparian vegetation height, width and/ordensity increases the amount of solar radiation reaching the stream surface). Anthropogenic nonpoint
source contributions account for 23.9% of the total heat loading. The heat loading analysis is discussedin detail within the Upper Klamath Lake Drainage Stream Temperature Analysis (Attachment 1)
Settlement of the Upper Klamath Lake drainage in the mid-1800s brought about changes in thenear stream vegetation and hydrologic characteristics of the streams. Historically, agricultural andlogging practices have altered the stream morphology and hydrology and decreased the amount ofriparian vegetation in the drainage. The drainage includes urban, agricultural, and forested lands. Due toagricultural practices, many streams in the lower watershed have undergone extensive channelization fordrainage and flood control. Channel straightening, while providing relief from local flooding, increasesflooding downstream and may result in the destruction of riparian vegetation and increased channelerosion. Additionally, major diversions and multiple points of diversion in the Upper Klamath Lakedrainage have lowered stream flow levels.
Riparian vegetation, stream morphology, hydrology, climate, and geographic location influencestream temperature. While climate and geographic location are outside of human control, ripariancondition, channel morphology and hydrology are affected by land use activities.
Low summertime flows decrease the thermal assimilative capacity of streams. Pollutant (solarradiation) loading causes larger temperature increases in stream segments where flows are reduced byhuman uses. Many streams in the Upper Klamath Lake drainage are extensively utilized for cropirrigation during the summer months.
Site specific total nonpoint source solar radiation heat load was derived for the Williamson River,Sprague River, North Fork Sprague River, South Fork Sprague River, Sycan River, Fishhole Creek, andTrout Creek (Table 3-5). Current condition solar radiation loading was calculated by simulating currentstream and vegetation conditions (the methodology is presented in detail in the Upper Klamath LakeDrainage Stream Temperature Analysis - Attachment 1). Background loading was calculated bysimulating the solar radiation heat loading that resulted with system potential near stream vegetation andchannel morphology. This background condition, based on system potential, reflects an estimate ofnonpoint source heat load that would occur while meeting the temperature standard (i.e., no measurablesurface water increase resulting from anthropogenic activities is allowed).
Figure 3-4 contrasts the longitudinal profile of the current solar radiation heat loading with thesolar radiation heat loading that occurs with system potential land cover and channel morphology. Thesolar radiation heat load calculated for system potential near stream vegetation and channelmorphology is considered the background condition with anthropogenic sources removed. Theanthropogenic portion of the total current condition solar radiation heat load for the modeled streams isgiven in Figure 3-5.

UPPER KLAMATH LAKE DRAINAGE TMDL AND WQMPCHAPTER III – STREAM TEMPERATURE TMDL
OREGON DEPARTMENT OF ENVIRONMENTAL QUALITY - MAY 2002PAGE 87
Total Solar Radiation Heat Load from All Nonpoint Sources,ΗTotal NPS = ΗSP NPS + ΗAnthro NPS = ΦTotal Solar·A
Solar Radiation Heat Load from Background Nonpoint Sources (System Potential),ΗSP NPS = ΦSP Solar·A
Solar Radiation Heat Load from Anthropogenic Nonpoint Sources,ΗAnthro NPS = ΗTotal NPS - ΗSP NPS
*All solar radiation loads are the clear sky received loads that account for Julian time, elevation, atmospheric attenuation andscattering, stream aspect, topographic shading, near stream vegetation stream surface reflection, water column absorption andstream bed absorption.
where,ΗTotal NPS: Total Nonpoint Source Heat Load (kcal/day)
ΗSP NPS: Background Nonpoint Source Heat Load based on System Potential (kcal/day)ΗAnthro NPS: Anthropogenic Nonpoint Source Heat Load (kcal/day)ΦTotal Solar: Total Daily Solar Radiation Load (ly/day)
ΦSP Solar: Background Daily Solar Radiation Load based on System Potential (ly/day)ΦAnthro Solar: Anthropogenic Daily Solar Radiation Load (ly/day)
A: Stream Surface Area - calculated at each 100 foot stream segment node (cm2)
Table 3-5. Nonpoint Source Solar Radiation Heat Loading - Current Condition with Background(Loading Capacity) and Anthropogenic Contributions
ΗTotal NPS ΗSP NPS ΗAnthro NPS
Stream
CurrentCondition
Solar RadiationHeat Loading(1012 cal/day)
BackgroundSystem PotentialSolar RadiationHeat Loading15
(1012 cal/day)
AnthropogenicNonpoint SourceSolar RadiationHeat Loading(1012 cal/day)
Portion of CurrentSolar Radiation
Load fromAnthropogenic
Nonpoint SourcesWilliamson River 19.1 14.7 4.4 29.4%Sprague River 27.6 20.8 6.8 42.5%
N.F. Sprague River 3.7 2.4 1.3 5.7%S.F. Sprague River 2.7 2.2 0.6 4.2%
Sycan River 10.2 8.0 2.2 15.7%Fishhole Cr. 1.3 1.0 0.3 2.0%
Trout Cr./SF Trout Cr.16 0.3 0.3 0.0 0.5%Totals 64.9 49.4 15.5 100.0%
15 Background solar radiation heat loading is based on effective shade resulting from system potential near stream vegetation.16 The modeling exercise covered the Trout Creek mainstem and South Fork Trout Creek. In Figure 13, river miles 0 to 1.6 areTrout Creek, and river miles 1.6 to 8.0 are South Fork Trout Creek.

UPPER KLAMATH LAKE DRAINAGE TMDL AND WQMPCHAPTER III – STREAM TEMPERATURE TMDL
OREGON DEPARTMENT OF ENVIRONMENTAL QUALITY - MAY 2002PAGE 88
0
1
2
3
4
5
6
7
8
27 25 23 21 19 17 15 13 11 9 7 5 3 1
River Mile
Sola
r Rad
iatio
n R
ecei
ved
by
Stre
am (1
09 cal
/day
)
Current ConditionBackground - System Potential
Sycan River Fishhole Creek
Trout Creek North Fork Sprague River
South Fork Sprague River Sprague River
Williamson River
0
3
6
9
12
15
18
72 66 61 56 50 45 40 34 29 24 18 13 8 2
River Mile
Sola
r Rad
iatio
n Re
ceiv
ed b
y St
ream
(109 c
al/d
ay)
Current ConditionBackground - System Potential
0.00.20.40.60.81.01.21.41.61.82.0
8 7 6 5 4 3 2 1 0River Mile
Sola
r Rad
iatio
n R
ecei
ved
by
Stre
am (1
09 cal
/day
)
Current ConditionBackground - System Potential
0
1
2
3
4
5
6
7
8
34 32 29 27 25 22 20 17 15 12 10 7 5 2
River Mile
Sola
r Rad
iatio
n R
ecei
ved
by
Stre
am (1
09 cal
/day
)
Current ConditionBackground - System Potential
0
1
2
3
4
5
6
7
8
32 30 27 25 23 20 18 16 13 11 9 6 4 2
River Mile
Sola
r Rad
iatio
n Re
ceiv
ed b
y St
ream
(109 c
al/d
ay)
Current ConditionBackground - System Potential
0
3
6
9
12
15
18
21
24
85 78 72 66 59 53 47 40 34 28 22 15 9 3
River Mile
Sola
r Rad
iatio
n R
ecei
ved
by
Stre
am (1
09 cal
/day
)
Current ConditionBackground - System Potential
0
3
6
9
12
15
18
21
24
87 82 77 73 68 63 57 51 35 29 22 16 10 3
River Mile
Sola
r Rad
iatio
n R
ecei
ved
by
Stre
am (1
09 cal
/day
)
Current ConditionBackground - System Potential
Figure 3-4. Solar Radiation Loading - Current Condition and Background - System Potential17
17 On the Trout Creek chart, river miles 0 to 1.6 are Trout Creek and river miles 1.6 to 8.0 are South Fork Trout Creek.

UPPER KLAMATH LAKE DRAINAGE TMDL AND WQMPCHAPTER III – STREAM TEMPERATURE TMDL
OREGON DEPARTMENT OF ENVIRONMENTAL QUALITY - MAY 2002PAGE 89
North Fork Sprague River
8.1%
Trout Creek0.2%
Fishhole Creek1.7%South Fork
Sprague River3.7%
Sycan River14.0%
Sprague River43.8%
Williamson River28.5%
Distribution of the Total Nonpoint Source Solar Heat Load
Figure 3-5. Anthropogenic Nonpoint Source and Background Solar Heat Loading
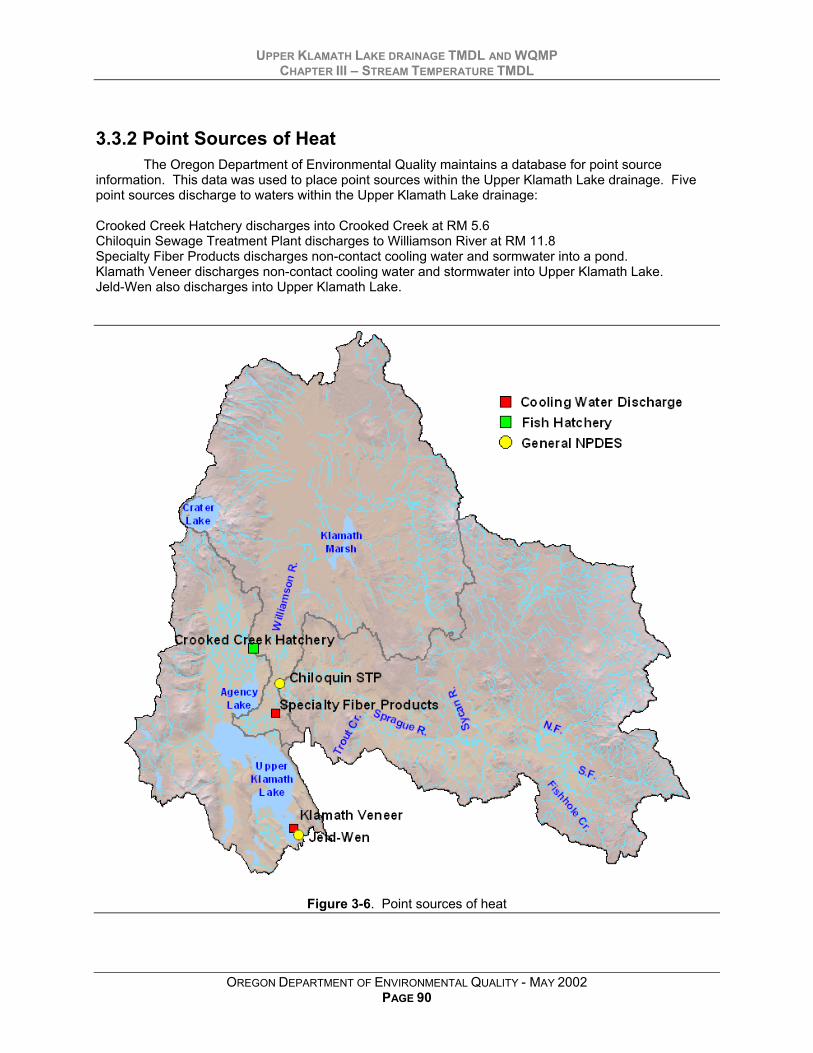
UPPER KLAMATH LAKE DRAINAGE TMDL AND WQMPCHAPTER III – STREAM TEMPERATURE TMDL
OREGON DEPARTMENT OF ENVIRONMENTAL QUALITY - MAY 2002PAGE 90
3.3.2 Point Sources of HeatThe Oregon Department of Environmental Quality maintains a database for point source
information. This data was used to place point sources within the Upper Klamath Lake drainage. Fivepoint sources discharge to waters within the Upper Klamath Lake drainage:
Crooked Creek Hatchery discharges into Crooked Creek at RM 5.6Chiloquin Sewage Treatment Plant discharges to Williamson River at RM 11.8Specialty Fiber Products discharges non-contact cooling water and sormwater into a pond.Klamath Veneer discharges non-contact cooling water and stormwater into Upper Klamath Lake.Jeld-Wen also discharges into Upper Klamath Lake.
Figure 3-6. Point sources of heat
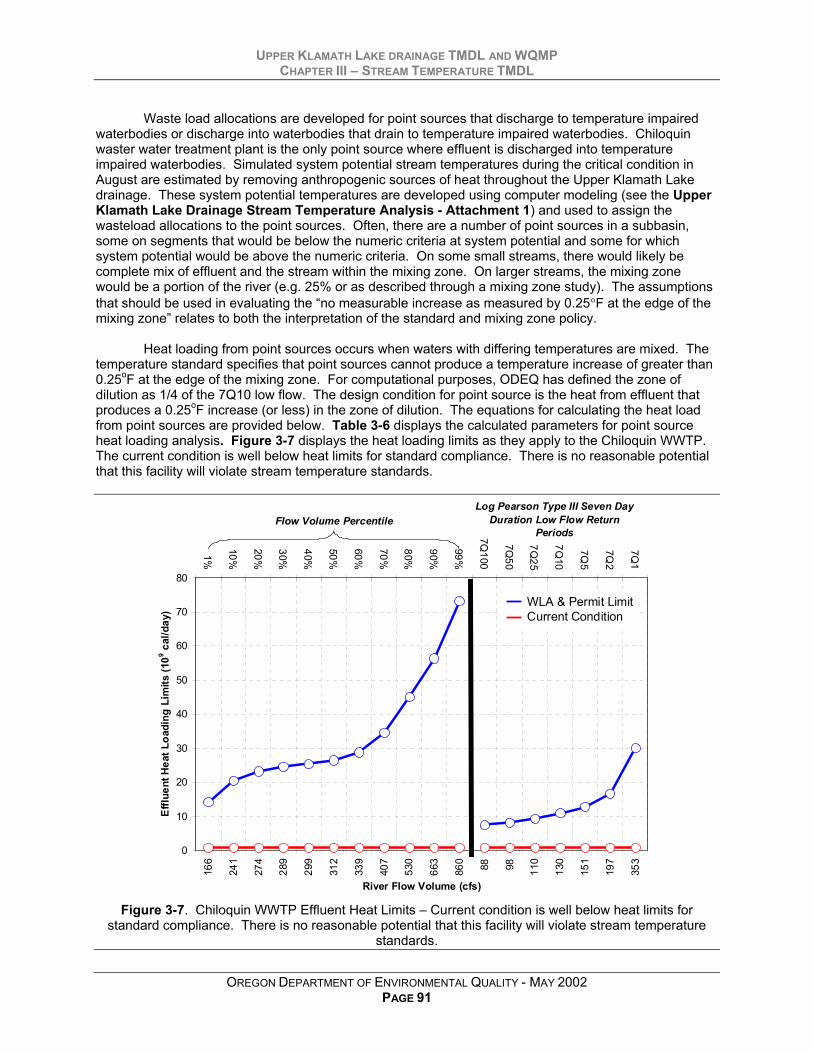
UPPER KLAMATH LAKE DRAINAGE TMDL AND WQMPCHAPTER III – STREAM TEMPERATURE TMDL
OREGON DEPARTMENT OF ENVIRONMENTAL QUALITY - MAY 2002PAGE 91
Waste load allocations are developed for point sources that discharge to temperature impairedwaterbodies or discharge into waterbodies that drain to temperature impaired waterbodies. Chiloquinwaster water treatment plant is the only point source where effluent is discharged into temperatureimpaired waterbodies. Simulated system potential stream temperatures during the critical condition inAugust are estimated by removing anthropogenic sources of heat throughout the Upper Klamath Lakedrainage. These system potential temperatures are developed using computer modeling (see the UpperKlamath Lake Drainage Stream Temperature Analysis - Attachment 1) and used to assign thewasteload allocations to the point sources. Often, there are a number of point sources in a subbasin,some on segments that would be below the numeric criteria at system potential and some for whichsystem potential would be above the numeric criteria. On some small streams, there would likely becomplete mix of effluent and the stream within the mixing zone. On larger streams, the mixing zonewould be a portion of the river (e.g. 25% or as described through a mixing zone study). The assumptionsthat should be used in evaluating the “no measurable increase as measured by 0.25°F at the edge of themixing zone” relates to both the interpretation of the standard and mixing zone policy.
Heat loading from point sources occurs when waters with differing temperatures are mixed. Thetemperature standard specifies that point sources cannot produce a temperature increase of greater than0.25oF at the edge of the mixing zone. For computational purposes, ODEQ has defined the zone ofdilution as 1/4 of the 7Q10 low flow. The design condition for point source is the heat from effluent thatproduces a 0.25oF increase (or less) in the zone of dilution. The equations for calculating the heat loadfrom point sources are provided below. Table 3-6 displays the calculated parameters for point sourceheat loading analysis. Figure 3-7 displays the heat loading limits as they apply to the Chiloquin WWTP.The current condition is well below heat limits for standard compliance. There is no reasonable potentialthat this facility will violate stream temperature standards.
0
10
20
30
40
50
60
70
80
166
241
274
289
299
312
339
407
530
663
860 88 98 110
130
151
197
353
River Flow Volume (cfs)
Efflu
ent H
eat L
oadi
ng L
imits
(109 c
al/d
ay)
1%
10%
20%
30%
40%
50%
60%
70%
80%
90%
99%
7Q100
7Q50
7Q25
7Q10
7Q5
7Q2
7Q1
Flow Volume PercentileLog Pearson Type III Seven Day
Duration Low Flow Return Periods
WLA & Permit LimitCurrent Condition
Figure 3-7. Chiloquin WWTP Effluent Heat Limits – Current condition is well below heat limits forstandard compliance. There is no reasonable potential that this facility will violate stream temperature
standards.
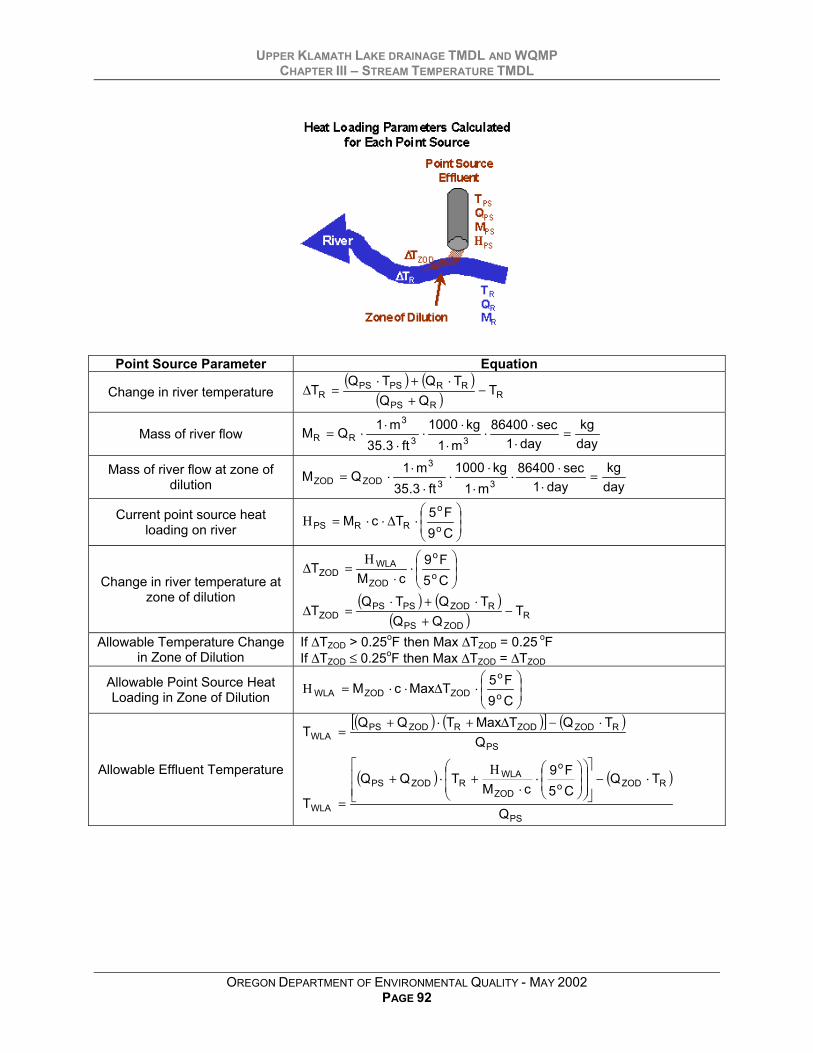
UPPER KLAMATH LAKE DRAINAGE TMDL AND WQMPCHAPTER III – STREAM TEMPERATURE TMDL
OREGON DEPARTMENT OF ENVIRONMENTAL QUALITY - MAY 2002PAGE 92
Point Source Parameter Equation
Change in river temperature( ) ( )
( ) RRPS
RRPSPSR T
QQTQTQ
T −+
⋅+⋅=∆
Mass of river flowdaykg
day1sec86400
m1kg1000
ft3.35m1QM
33
3
RR =⋅
⋅⋅⋅
⋅⋅
⋅⋅⋅=
Mass of river flow at zone ofdilution day
kgday1
sec86400m1
kg1000ft3.35
m1QM33
3
ZODZOD =⋅
⋅⋅⋅
⋅⋅
⋅⋅⋅=
Current point source heatloading on river
⋅∆⋅⋅=Η
C9F5TcM
o
o
RRPS
Change in river temperature atzone of dilution
⋅
⋅Η
=∆C5F9
cMT
o
o
ZOD
WLAZOD
( ) ( )( ) R
ZODPS
RZODPSPSZOD T
QQTQTQ
T −+
⋅+⋅=∆
Allowable Temperature Changein Zone of Dilution
If ∆TZOD > 0.25oF then Max ∆TZOD = 0.25 oFIf ∆TZOD ≤ 0.25oF then Max ∆TZOD = ∆TZOD
Allowable Point Source HeatLoading in Zone of Dilution
⋅∆⋅⋅=Η
C9F5TMaxcM
o
o
ZODZODWLA
Allowable Effluent Temperature
( ) ( )[ ] ( )PS
RZODZODRZODPSWLA Q
TQTMaxTQQT
⋅−∆+⋅+=
( ) ( )
PS
RZODo
o
ZOD
WLARZODPS
WLA Q
TQC5F9
cMTQQ
T
⋅−
⋅
⋅Η
+⋅+
=

UPPER KLAMATH LAKE DRAINAGE TMDL AND WQMPCHAPTER III – STREAM TEMPERATURE TMDL
OREGON DEPARTMENT OF ENVIRONMENTAL QUALITY - MAY 2002PAGE 93
where,TR: Upstream potential river temperature (oF)
TPS: Point source effluent temperature (oF)TWLA: Maximum allowable point source effluent temperature (oF)∆TR: Change in river temperature (oF)
∆TZOD: Change in river temperature at edge of zone of dilution - 0.25oF allowable (oF)Max ∆TZOD: Maximum Allowable Change in river temperature at edge of zone of dilution (oF)
• If zone of dilution temperature change is greater than 0.25oF then maximum allowablezone of dilution temperature change is 0.25oF, or
• If zone of dilution temperature change is less than 0.25oF then maximum allowablezone of dilution temperature change is the current zone of dilution temperaturechange.
QR: Upstream river flow - Calculated as 7Q10 low flow statistic (cfs)QZOD: Upstream river flow through zone of dilution - Calculated as 1/4 7Q10 low flow statistic (cfs)QPS: Point source effluent discharge (cfs)MR: Daily mass of river flow (kg/day)
MZOD: Daily mass of river flow through zone of dilution (kg/day)MPS: Daily mass of effluent (kg/day)ΗPS: Heat from point source effluent received by river (kcal/day)
ΗWLA: Allowable heat from point source effluent received by river (kcal/day)c: Specific heat of water (1 kcal/kg oC)
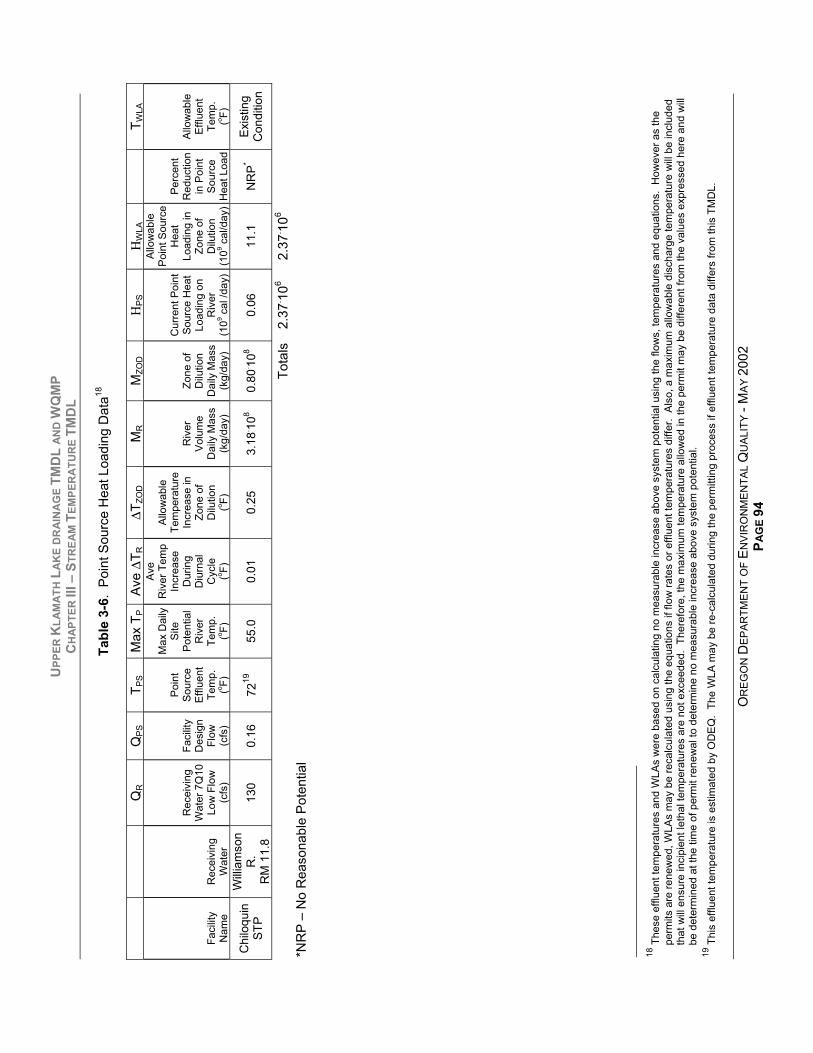
UPP
ER K
LAM
ATH
LAK
E D
RAI
NAG
E TM
DL
AND
WQ
MP
CH
APTE
R II
I – S
TREA
M T
EMPE
RAT
UR
E TM
DL
OR
EGO
N D
EPAR
TMEN
T O
F EN
VIR
ON
MEN
TAL
QU
ALIT
Y - M
AY 2
002
PAG
E 94
Tabl
e 3-
6. P
oint
Sou
rce
Hea
t Loa
ding
Dat
a18
QR
QPS
T PS
Max
TP
Ave
∆TR
∆TZO
DM
RM
ZOD
ΗPS
ΗW
LAT W
LA
Faci
lity
Nam
eR
ecei
ving
Wat
er
Rec
eivi
ngW
ater
7Q
10Lo
w F
low
(cfs
)
Faci
lity
Des
ign
Flow
(cfs
)
Poin
tSo
urce
Efflu
ent
Tem
p.(o F)
Max
Dai
lySi
tePo
tent
ial
Riv
erTe
mp.
(o F)
Ave
Riv
er T
emp
Incr
ease
Dur
ing
Diu
rnal
Cyc
le(o F)
Allo
wab
leTe
mpe
ratu
reIn
crea
se in
Zone
of
Dilu
tion
(o F)
Riv
erVo
lum
eD
aily
Mas
s(k
g/da
y)
Zone
of
Dilu
tion
Dai
ly M
ass
(kg/
day)
Cur
rent
Poi
ntSo
urce
Hea
tLo
adin
g on
Riv
er(1
09 cal
/day
)
Allo
wab
lePo
int S
ourc
eH
eat
Load
ing
inZo
ne o
fD
ilutio
n(1
09 cal
/day
)
Perc
ent
Red
uctio
nin
Poi
ntSo
urce
Hea
t Loa
d
Allo
wab
leEf
fluen
tTe
mp.
(o F)
Chi
loqu
inST
P
Willi
amso
nR
.R
M 1
1.8
130
0.16
7219
55.0
0.01
0.25
3.18
. 108
0.80
. 108
0.06
11.1
NR
P*Ex
istin
gC
ondi
tion
Tota
ls2.
37. 10
62.
37. 10
6
*NR
P –
No
Rea
sona
ble
Pote
ntia
l
18 T
hese
effl
uent
tem
pera
ture
s an
d W
LAs
wer
e ba
sed
on c
alcu
latin
g no
mea
sura
ble
incr
ease
abo
ve s
yste
m p
oten
tial u
sing
the
flow
s, te
mpe
ratu
res
and
equa
tions
. H
owev
er a
s th
epe
rmits
are
rene
wed
, WLA
s m
ay b
e re
calc
ulat
ed u
sing
the
equa
tions
if fl
ow ra
tes
or e
fflue
nt te
mpe
ratu
res
diffe
r. A
lso,
a m
axim
um a
llow
able
dis
char
ge te
mpe
ratu
re w
ill be
incl
uded
that
will
ensu
re in
cipi
ent l
etha
l tem
pera
ture
s ar
e no
t exc
eede
d. T
here
fore
, the
max
imum
tem
pera
ture
allo
wed
in th
e pe
rmit
may
be
diffe
rent
from
the
valu
es e
xpre
ssed
her
e an
d w
illbe
det
erm
ined
at t
he ti
me
of p
erm
it re
new
al to
det
erm
ine
no m
easu
rabl
e in
crea
se a
bove
sys
tem
pot
entia
l.19
Thi
s ef
fluen
t tem
pera
ture
is e
stim
ated
by
OD
EQ.
The
WLA
may
be
re-c
alcu
late
d du
ring
the
perm
ittin
g pr
oces
s if
efflu
ent t
empe
ratu
re d
ata
diffe
rs fr
om th
is T
MD
L.
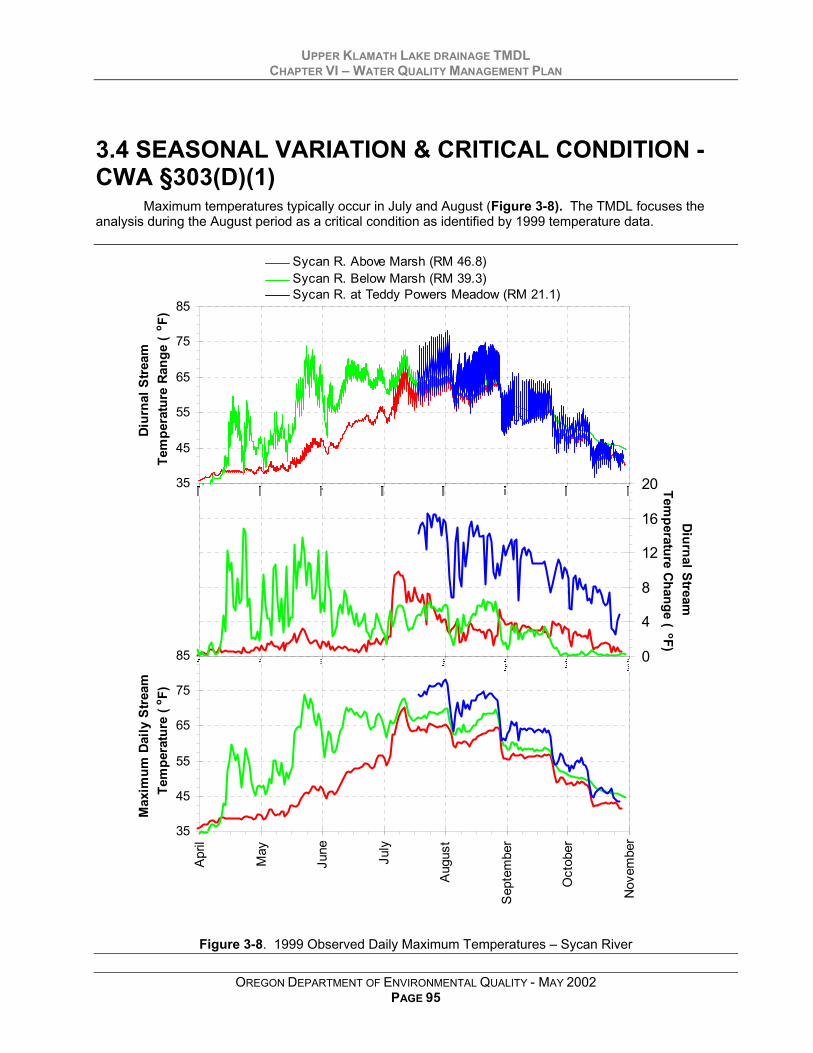
UPPER KLAMATH LAKE DRAINAGE TMDLCHAPTER VI – WATER QUALITY MANAGEMENT PLAN
OREGON DEPARTMENT OF ENVIRONMENTAL QUALITY - MAY 2002PAGE 95
3.4 SEASONAL VARIATION & CRITICAL CONDITION -CWA §303(D)(1)
Maximum temperatures typically occur in July and August (Figure 3-8). The TMDL focuses theanalysis during the August period as a critical condition as identified by 1999 temperature data.
35
45
55
65
75
85
Apr
il
May
June
July
Aug
ust
Sep
tem
ber
Oct
ober
Nov
embe
r
Max
imum
Dai
ly S
tream
Tem
pera
ture
(o F)
0
4
8
12
16
20
Diurnal Stream
Temperature Change (
oF)
35
45
55
65
75
85
Diur
nal S
tream
Te
mpe
ratu
re R
ange
(o F)
Sycan R. Above Marsh (RM 46.8)Sycan R. Below Marsh (RM 39.3)Sycan R. at Teddy Powers Meadow (RM 21.1)
Figure 3-8. 1999 Observed Daily Maximum Temperatures – Sycan River

UPPER KLAMATH LAKE DRAINAGE TMDL AND WQMPCHAPTER III – STREAM TEMPERATURE TMDL
OREGON DEPARTMENT OF ENVIRONMENTAL QUALITY - MAY 2002PAGE 96
35
45
55
65
75
85
Apr
il
May
June
July
Aug
ust
Sep
tem
ber
Oct
ober
Nov
embe
r
Max
imum
Dai
ly S
tream
Tem
pera
ture
(o F)
0
4
8
12
16
20
Diurnal Stream
Temperature Change (
oF)
35
45
55
65
75
85Di
urna
l Stre
am
Tem
pera
ture
Ran
ge (
o F)
Sprague R. at Godowa Sprg Rd (RM 71.7)Sprague R at Saddle Mtn. Pit Rd. (RM 33.1)Sprague R. Mouth (RM 0.5)
Figure 3-8 (continued). 1999 Observed Daily Maximum Temperatures – Sprague River

UPPER KLAMATH LAKE DRAINAGE TMDL AND WQMPCHAPTER III – STREAM TEMPERATURE TMDL
OREGON DEPARTMENT OF ENVIRONMENTAL QUALITY - MAY 2002PAGE 97
35
45
55
65
75
85
Apr
il
May
June
July
Aug
ust
Sep
tem
ber
Oct
ober
Nov
embe
r
Max
imum
Dai
ly S
tream
Tem
pera
ture
(o F)
0
4
8
12
16
20
Diurnal Stream
Temperature Change (
oF)
35
45
55
65
75
85Di
urna
l Stre
am
Tem
pera
ture
Ran
ge (
o F)
S.F. Sprague R. at Brownsworth Cr. (RM 15.3)N.F. Sprague R. at Ivory Pine Rd (RM 5.7)Fishhole Creek u/s Briggs Spring (RM 17.7)
Figure 3-8 (continued). 1999 Observed Daily Maximum Temperatures – Sprague River Tributaries
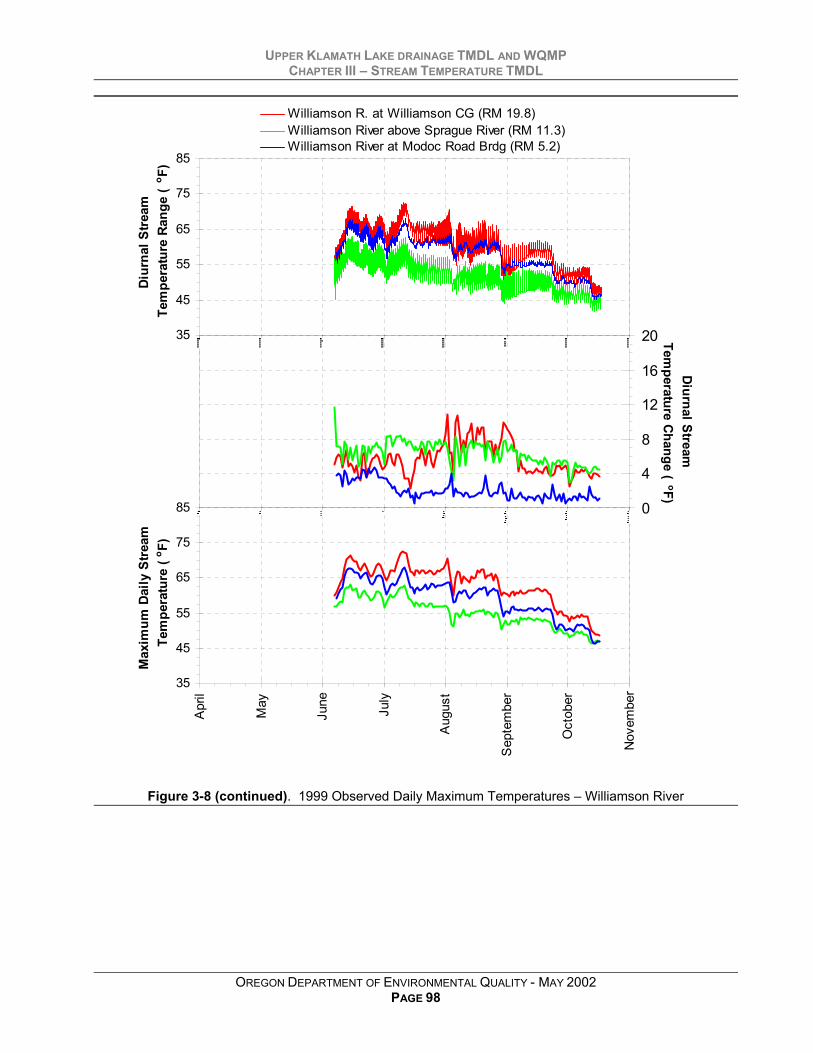
UPPER KLAMATH LAKE DRAINAGE TMDL AND WQMPCHAPTER III – STREAM TEMPERATURE TMDL
OREGON DEPARTMENT OF ENVIRONMENTAL QUALITY - MAY 2002PAGE 98
35
45
55
65
75
85
Apr
il
May
June
July
Aug
ust
Sep
tem
ber
Oct
ober
Nov
embe
r
Max
imum
Dai
ly S
tream
Tem
pera
ture
(o F)
0
4
8
12
16
20
Diurnal Stream
Temperature Change (
oF)
35
45
55
65
75
85Di
urna
l Stre
am
Tem
pera
ture
Ran
ge (
o F)
Williamson R. at Williamson CG (RM 19.8)Williamson River above Sprague River (RM 11.3)Williamson River at Modoc Road Brdg (RM 5.2)
Figure 3-8 (continued). 1999 Observed Daily Maximum Temperatures – Williamson River

UPPER KLAMATH LAKE DRAINAGE TMDL AND WQMPCHAPTER III – STREAM TEMPERATURE TMDL
OREGON DEPARTMENT OF ENVIRONMENTAL QUALITY - MAY 2002PAGE 99
35
45
55
65
75
85
Apr
il
May
June
July
Aug
ust
Sep
tem
ber
Oct
ober
Nov
embe
r
Max
imum
Dai
ly S
tream
Tem
pera
ture
(o F)
0
4
8
12
16
20
Diurnal Stream
Temperature Change (
oF)
35
45
55
65
75
85Di
urna
l Stre
am
Tem
pera
ture
Ran
ge (
o F)
Larkin Creek Mouth (RM 0.0)
Spring Creek Mouth (RM 0.0)
Figure 3-8 (continued). 1999 Observed Daily Maximum Temperatures – Williamson River Tributaries
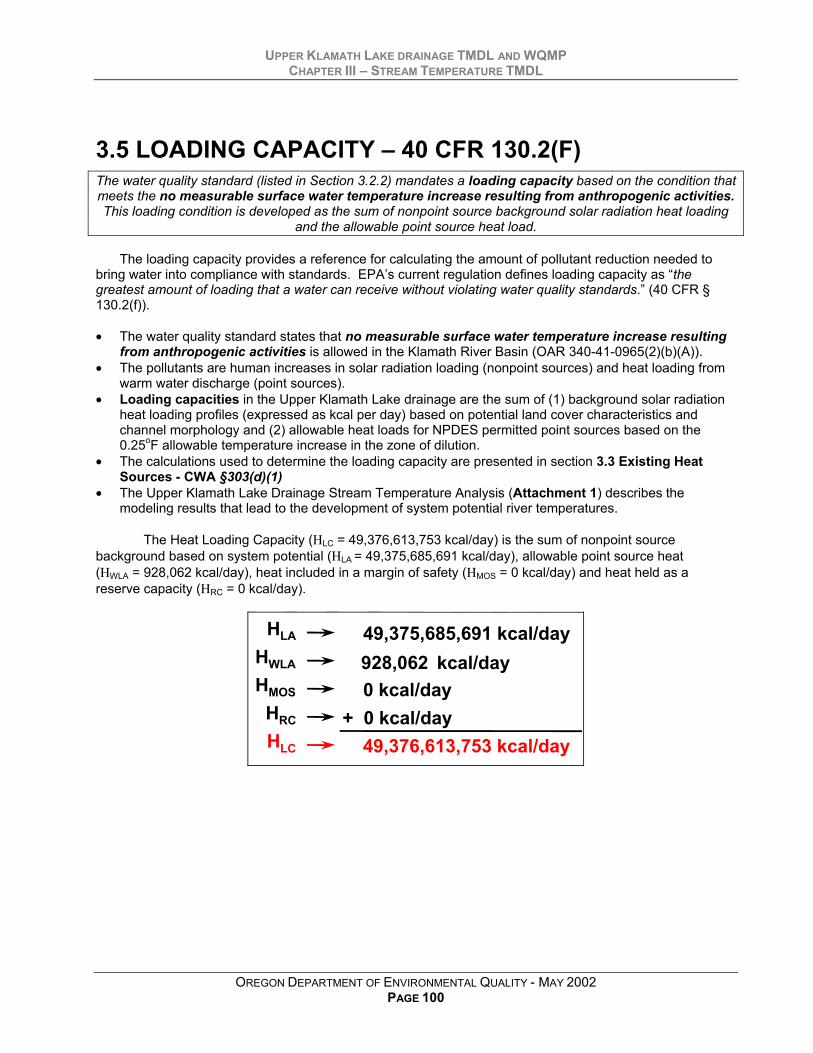
UPPER KLAMATH LAKE DRAINAGE TMDL AND WQMPCHAPTER III – STREAM TEMPERATURE TMDL
OREGON DEPARTMENT OF ENVIRONMENTAL QUALITY - MAY 2002PAGE 100
3.5 LOADING CAPACITY – 40 CFR 130.2(F)The water quality standard (listed in Section 3.2.2) mandates a loading capacity based on the condition thatmeets the no measurable surface water temperature increase resulting from anthropogenic activities.This loading condition is developed as the sum of nonpoint source background solar radiation heat loading
and the allowable point source heat load.
The loading capacity provides a reference for calculating the amount of pollutant reduction needed tobring water into compliance with standards. EPA’s current regulation defines loading capacity as “thegreatest amount of loading that a water can receive without violating water quality standards.” (40 CFR §130.2(f)).
• The water quality standard states that no measurable surface water temperature increase resultingfrom anthropogenic activities is allowed in the Klamath River Basin (OAR 340-41-0965(2)(b)(A)).
• The pollutants are human increases in solar radiation loading (nonpoint sources) and heat loading fromwarm water discharge (point sources).
• Loading capacities in the Upper Klamath Lake drainage are the sum of (1) background solar radiationheat loading profiles (expressed as kcal per day) based on potential land cover characteristics andchannel morphology and (2) allowable heat loads for NPDES permitted point sources based on the0.25oF allowable temperature increase in the zone of dilution.
• The calculations used to determine the loading capacity are presented in section 3.3 Existing HeatSources - CWA §303(d)(1)
• The Upper Klamath Lake Drainage Stream Temperature Analysis (Attachment 1) describes themodeling results that lead to the development of system potential river temperatures.
The Heat Loading Capacity (ΗLC = 49,376,613,753 kcal/day) is the sum of nonpoint sourcebackground based on system potential (ΗLA = 49,375,685,691 kcal/day), allowable point source heat(ΗWLA = 928,062 kcal/day), heat included in a margin of safety (ΗMOS = 0 kcal/day) and heat held as areserve capacity (ΗRC = 0 kcal/day).
49,375,685,691 kcal/day 928,062 kcal/day 0 kcal/day+ 0 kcal/day 49,376,613,753 kcal/day
HLA
HWLA
HMOS
HRC
HLC

UPPER KLAMATH LAKE DRAINAGE TMDL AND WQMPCHAPTER III – STREAM TEMPERATURE TMDL
OREGON DEPARTMENT OF ENVIRONMENTAL QUALITY - MAY 2002PAGE 101
3.6 ALLOCATIONS – 40 CFR 130.2(G) AND (H)Load Allocations (Nonpoint Sources) - Load Allocations are portions of the loading capacity reserved fornatural, human and future nonpoint pollutant sources. The temperature standard targets system potential(i.e., no measurable temperature increases from anthropogenic sources). To meet this requirement thesystem potential solar radiation heat load (46,025,933,728 kcal/day) is allocated to background nonpointsources.
Wasteload Allocations (Point Sources) - A Waste Load Allocation (WLA) is the amount of pollutant that apoint source can contribute to the stream without violating water quality criteria. Surface water dischargesinto Upper Klamath Lake drainage receiving waters have been given a heat load based on the 0.25oFallowable increase in the zone of dilution as specified in the temperature standard. Heat loads have beenconverted to allowable effluent temperatures as well. It should be noted that the wasteload allocation is thepoint source heat load (2,367,258 kcal/day) and not the calculated maximum effluent temperatures. Thereare several options for meeting the allocated heat loads (i.e. passive effluent temperature reductions,changes in facility discharge operation, purchasing instream flows, pollutant trading, etc.).
Table 3-7. Heat Allocation Summary - Distributions of the Loading CapacityNonpoint Sources
Source
Loading AllocationAllowable Nonpoint
Source SolarRadiation Heat
Load(kcal/day)
All Nonpoint Sources 49,375,685,691
Point Sources
Facility Name Receiving WaterMaximum Effluent
Temperature(oF)
Waste LoadAllocation
Allowable PointSource Heat Load
(kcal/day)Chiloquin WWTP Williamson R.
RM - 11.5 72 928,062(Current Condition)
Reserve Capacity and Margins of Safety
Source
Loading AllocationAllowable Nonpoint
Source SolarRadiation Heat
Load(kcal/day)
Reserve Capacity 0
Margin of Safety 0
Total Allowable Heat Loading (Loading Capacity) 49,376,613,753
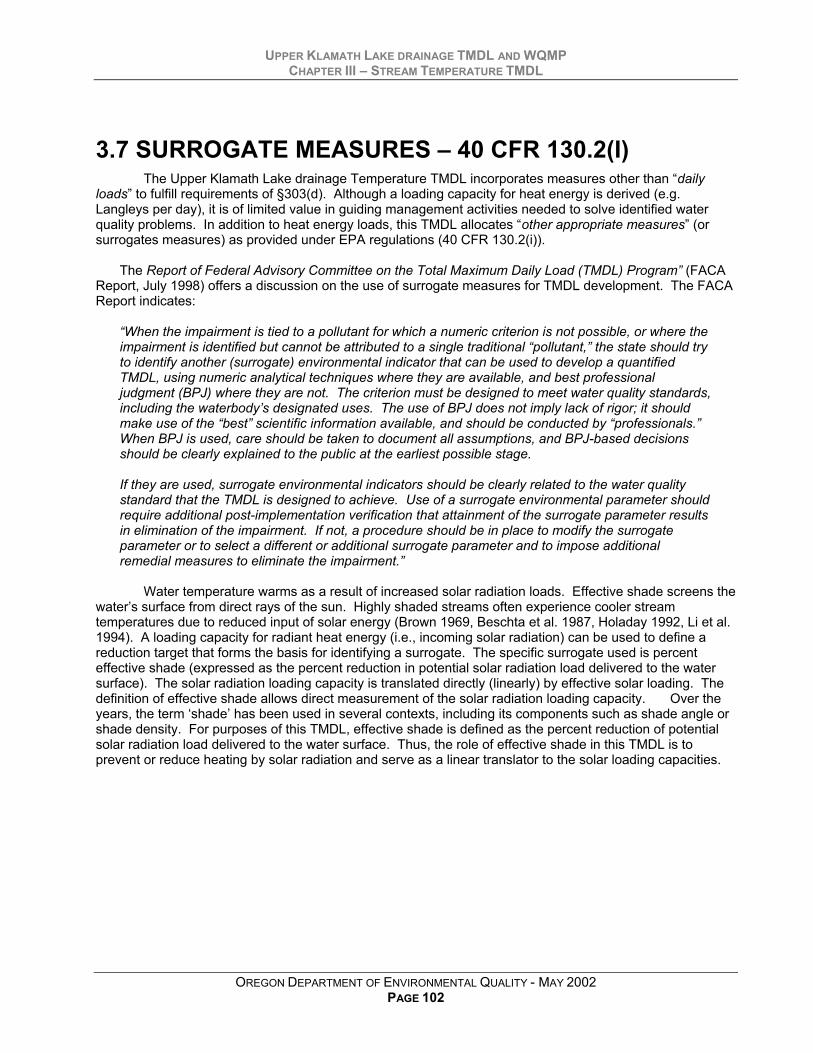
UPPER KLAMATH LAKE DRAINAGE TMDL AND WQMPCHAPTER III – STREAM TEMPERATURE TMDL
OREGON DEPARTMENT OF ENVIRONMENTAL QUALITY - MAY 2002PAGE 102
3.7 SURROGATE MEASURES – 40 CFR 130.2(I)The Upper Klamath Lake drainage Temperature TMDL incorporates measures other than “daily
loads” to fulfill requirements of §303(d). Although a loading capacity for heat energy is derived (e.g.Langleys per day), it is of limited value in guiding management activities needed to solve identified waterquality problems. In addition to heat energy loads, this TMDL allocates “other appropriate measures” (orsurrogates measures) as provided under EPA regulations (40 CFR 130.2(i)).
The Report of Federal Advisory Committee on the Total Maximum Daily Load (TMDL) Program” (FACAReport, July 1998) offers a discussion on the use of surrogate measures for TMDL development. The FACAReport indicates:
“When the impairment is tied to a pollutant for which a numeric criterion is not possible, or where theimpairment is identified but cannot be attributed to a single traditional “pollutant,” the state should tryto identify another (surrogate) environmental indicator that can be used to develop a quantifiedTMDL, using numeric analytical techniques where they are available, and best professionaljudgment (BPJ) where they are not. The criterion must be designed to meet water quality standards,including the waterbody’s designated uses. The use of BPJ does not imply lack of rigor; it shouldmake use of the “best” scientific information available, and should be conducted by “professionals.”When BPJ is used, care should be taken to document all assumptions, and BPJ-based decisionsshould be clearly explained to the public at the earliest possible stage.
If they are used, surrogate environmental indicators should be clearly related to the water qualitystandard that the TMDL is designed to achieve. Use of a surrogate environmental parameter shouldrequire additional post-implementation verification that attainment of the surrogate parameter resultsin elimination of the impairment. If not, a procedure should be in place to modify the surrogateparameter or to select a different or additional surrogate parameter and to impose additionalremedial measures to eliminate the impairment.”
Water temperature warms as a result of increased solar radiation loads. Effective shade screens thewater’s surface from direct rays of the sun. Highly shaded streams often experience cooler streamtemperatures due to reduced input of solar energy (Brown 1969, Beschta et al. 1987, Holaday 1992, Li et al.1994). A loading capacity for radiant heat energy (i.e., incoming solar radiation) can be used to define areduction target that forms the basis for identifying a surrogate. The specific surrogate used is percenteffective shade (expressed as the percent reduction in potential solar radiation load delivered to the watersurface). The solar radiation loading capacity is translated directly (linearly) by effective solar loading. Thedefinition of effective shade allows direct measurement of the solar radiation loading capacity. Over theyears, the term ‘shade’ has been used in several contexts, including its components such as shade angle orshade density. For purposes of this TMDL, effective shade is defined as the percent reduction of potentialsolar radiation load delivered to the water surface. Thus, the role of effective shade in this TMDL is toprevent or reduce heating by solar radiation and serve as a linear translator to the solar loading capacities.

UPPER KLAMATH LAKE DRAINAGE TMDL AND WQMPCHAPTER III – STREAM TEMPERATURE TMDL
OREGON DEPARTMENT OF ENVIRONMENTAL QUALITY - MAY 2002PAGE 103
3.7.1 Site Specific Effective Shade Surrogate MeasuresSite specific effective shade surrogates are developed to help translate the nonpoint source solar radiation
heat loading allocations. Attainment of the effective shade surrogate measures is equivalent to attainment ofthe nonpoint source load allocations.
Percent effective shade is a surrogate measure that can be calculated directly from the loadingcapacity. Additionally, percent effective shade is simple to quantify in the field or through mathematicalcalculations and is useful in guiding nonpoint source management practices. Figures 3-9 to 3-15 display thepercent effective shade values that correspond to the loading capacities throughout the Upper Klamath Lakedrainage. It is important to note that the percent effective shade surrogate measures rely upon both thesystem potential land cover (near stream vegetation) and potential channel morphology (near streamdisturbance zone widths). The Upper Klamath Lake Drainage Stream Temperature Analysis -Attachment 1 contains detailed descriptions of the methodology used to develop the temperature TMDL.
North Fork Sprague River
0%
10%
20%
30%
40%
50%
60%
70%
80%
90%
100%
051015202530River Mile
Effe
ctiv
e Sh
ade
0
65
130
195
260
325
390
455
520
585
650
Sola
r Hea
t Flu
x (L
y/da
y)
Simulated Potential ConditionSimulated Current Condition
Figure 3-9. Percent Effective Shade Surrogate Measures – North Fork Sprague River
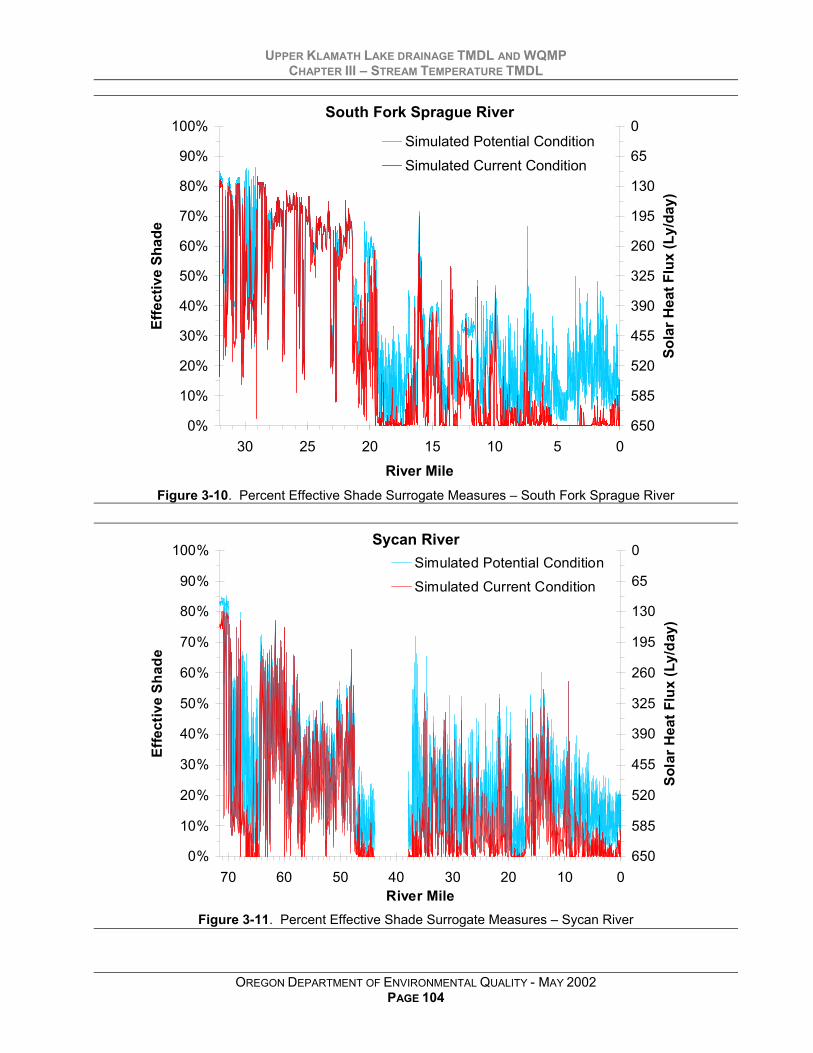
UPPER KLAMATH LAKE DRAINAGE TMDL AND WQMPCHAPTER III – STREAM TEMPERATURE TMDL
OREGON DEPARTMENT OF ENVIRONMENTAL QUALITY - MAY 2002PAGE 104
South Fork Sprague River
0%
10%
20%
30%
40%
50%
60%
70%
80%
90%
100%
051015202530River Mile
Effe
ctiv
e Sh
ade
0
65
130
195
260
325
390
455
520
585
650
Sola
r Hea
t Flu
x (L
y/da
y)
Simulated Potential ConditionSimulated Current Condition
Figure 3-10. Percent Effective Shade Surrogate Measures – South Fork Sprague River
0%
10%
20%
30%
40%
50%
60%
70%
80%
90%
100%
010203040506070River Mile
Effe
ctiv
e Sh
ade
0
65
130
195
260
325
390
455
520
585
650
Sola
r Hea
t Flu
x (L
y/da
y)
Simulated Potential ConditionSimulated Current Condition
Sycan River
Figure 3-11. Percent Effective Shade Surrogate Measures – Sycan River
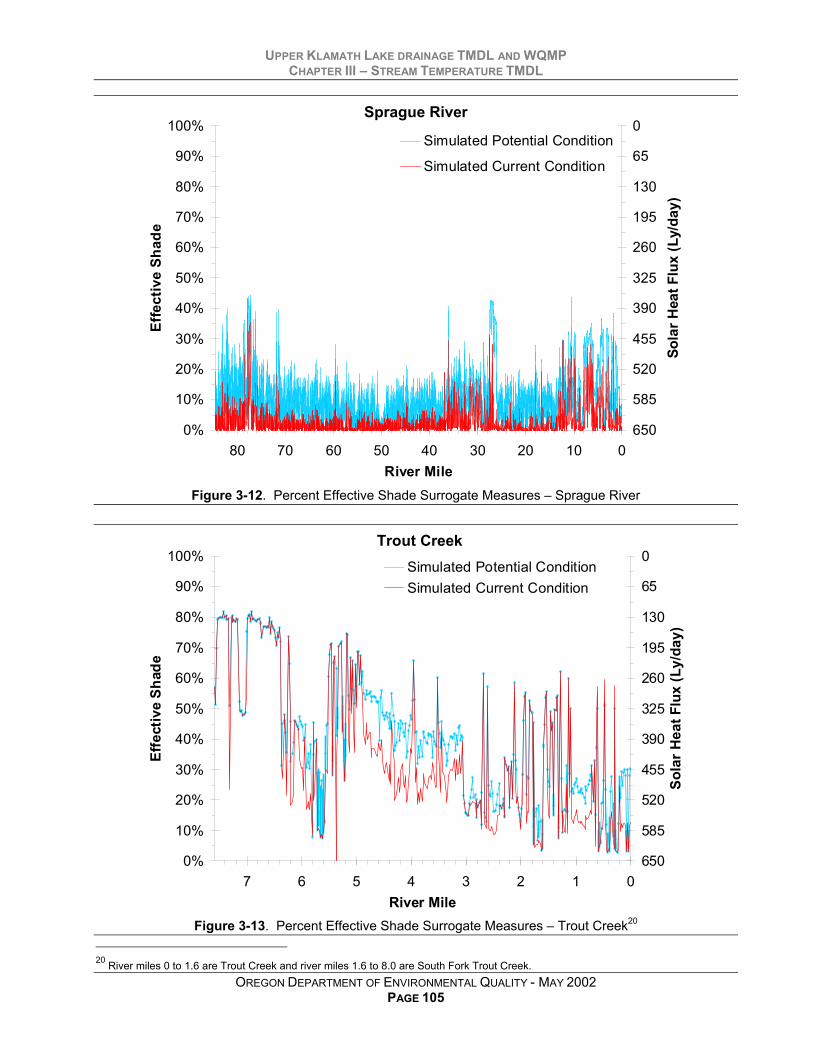
UPPER KLAMATH LAKE DRAINAGE TMDL AND WQMPCHAPTER III – STREAM TEMPERATURE TMDL
OREGON DEPARTMENT OF ENVIRONMENTAL QUALITY - MAY 2002PAGE 105
0%
10%
20%
30%
40%
50%
60%
70%
80%
90%
100%
01020304050607080River Mile
Effe
ctiv
e Sh
ade
0
65
130
195
260
325
390
455
520
585
650
Sola
r Hea
t Flu
x (L
y/da
y)
Simulated Potential Condition
Simulated Current Condition
Sprague River
Figure 3-12. Percent Effective Shade Surrogate Measures – Sprague River
Trout Creek
0%
10%
20%
30%
40%
50%
60%
70%
80%
90%
100%
01234567River Mile
Effe
ctiv
e Sh
ade
0
65
130
195
260
325
390
455
520
585
650
Sola
r Hea
t Flu
x (L
y/da
y)
Simulated Potential ConditionSimulated Current Condition
Figure 3-13. Percent Effective Shade Surrogate Measures – Trout Creek20
20 River miles 0 to 1.6 are Trout Creek and river miles 1.6 to 8.0 are South Fork Trout Creek.
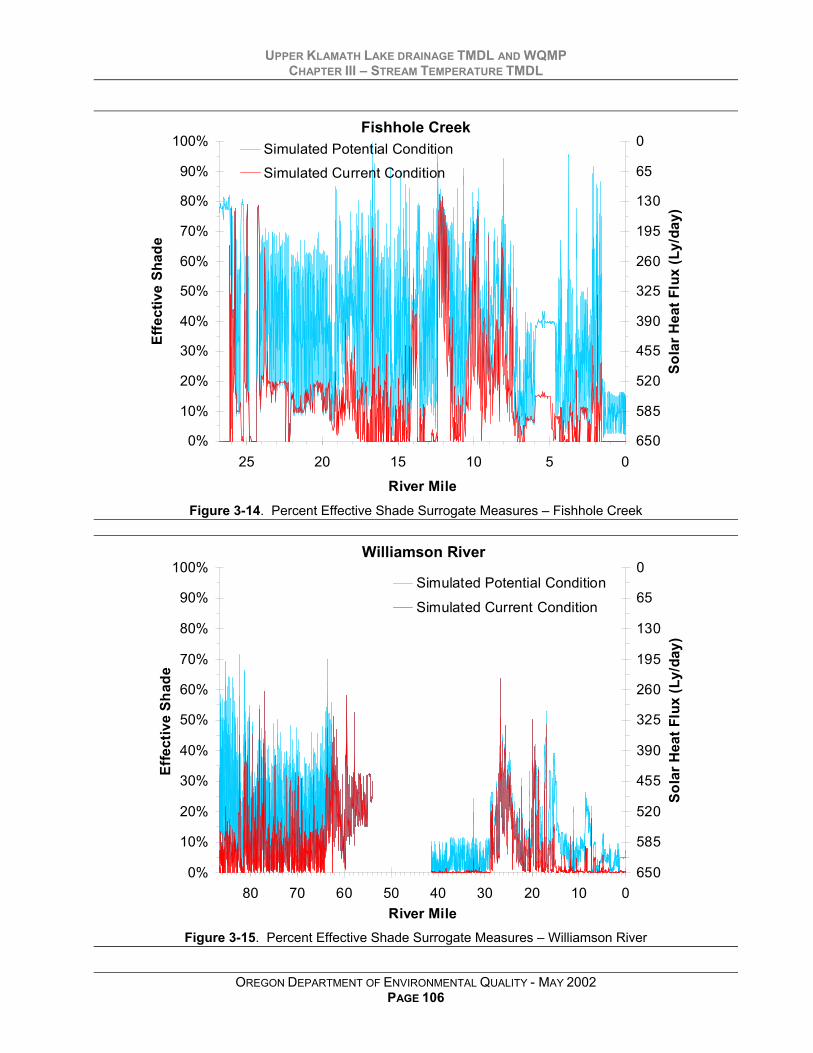
UPPER KLAMATH LAKE DRAINAGE TMDL AND WQMPCHAPTER III – STREAM TEMPERATURE TMDL
OREGON DEPARTMENT OF ENVIRONMENTAL QUALITY - MAY 2002PAGE 106
0%
10%
20%
30%
40%
50%
60%
70%
80%
90%
100%
0510152025
River Mile
Effe
ctiv
e Sh
ade
0
65
130
195
260
325
390
455
520
585
650
Sola
r Hea
t Flu
x (L
y/da
y)
Simulated Potential ConditionSimulated Current Condition
Fishhole Creek
Figure 3-14. Percent Effective Shade Surrogate Measures – Fishhole Creek
Williamson River
0%
10%
20%
30%
40%
50%
60%
70%
80%
90%
100%
01020304050607080River Mile
Effe
ctiv
e Sh
ade
0
65
130
195
260
325
390
455
520
585
650
Sola
r Hea
t Flu
x (L
y/da
y)
Simulated Potential Condition
Simulated Current Condition
Figure 3-15. Percent Effective Shade Surrogate Measures – Williamson River
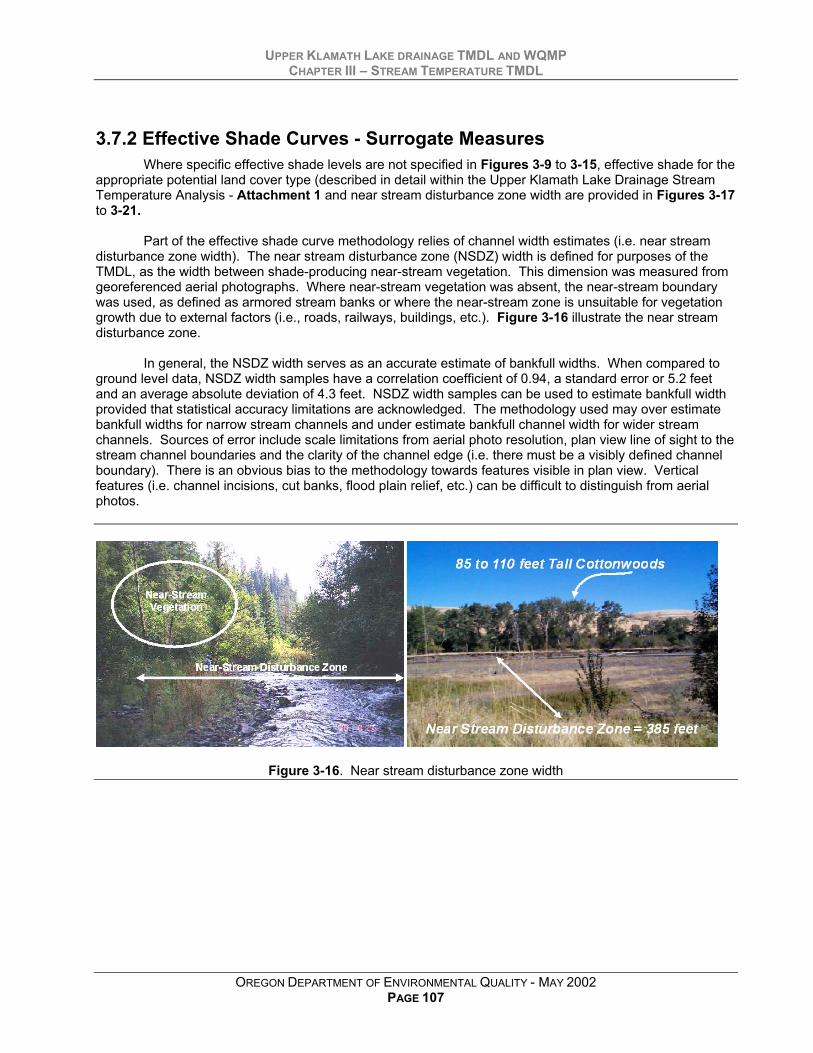
UPPER KLAMATH LAKE DRAINAGE TMDL AND WQMPCHAPTER III – STREAM TEMPERATURE TMDL
OREGON DEPARTMENT OF ENVIRONMENTAL QUALITY - MAY 2002PAGE 107
3.7.2 Effective Shade Curves - Surrogate MeasuresWhere specific effective shade levels are not specified in Figures 3-9 to 3-15, effective shade for the
appropriate potential land cover type (described in detail within the Upper Klamath Lake Drainage StreamTemperature Analysis - Attachment 1 and near stream disturbance zone width are provided in Figures 3-17to 3-21.
Part of the effective shade curve methodology relies of channel width estimates (i.e. near streamdisturbance zone width). The near stream disturbance zone (NSDZ) width is defined for purposes of theTMDL, as the width between shade-producing near-stream vegetation. This dimension was measured fromgeoreferenced aerial photographs. Where near-stream vegetation was absent, the near-stream boundarywas used, as defined as armored stream banks or where the near-stream zone is unsuitable for vegetationgrowth due to external factors (i.e., roads, railways, buildings, etc.). Figure 3-16 illustrate the near streamdisturbance zone.
In general, the NSDZ width serves as an accurate estimate of bankfull widths. When compared toground level data, NSDZ width samples have a correlation coefficient of 0.94, a standard error or 5.2 feetand an average absolute deviation of 4.3 feet. NSDZ width samples can be used to estimate bankfull widthprovided that statistical accuracy limitations are acknowledged. The methodology used may over estimatebankfull widths for narrow stream channels and under estimate bankfull channel width for wider streamchannels. Sources of error include scale limitations from aerial photo resolution, plan view line of sight to thestream channel boundaries and the clarity of the channel edge (i.e. there must be a visibly defined channelboundary). There is an obvious bias to the methodology towards features visible in plan view. Verticalfeatures (i.e. channel incisions, cut banks, flood plain relief, etc.) can be difficult to distinguish from aerialphotos.
Figure 3-16. Near stream disturbance zone width

UPP
ER K
LAM
ATH
LAK
E D
RAI
NAG
E TM
DL
CH
APTE
R V
I – W
ATER
QU
ALIT
Y M
ANA
GEM
ENT
PLAN
OR
EGO
N D
EPAR
TMEN
T O
F EN
VIR
ON
MEN
TAL
QU
ALIT
Y - M
AY 2
002
PAG
E 10
8
0%10%
20%
30%
40%
50%
60%
70%
80%
90%
100%
0
25
50
75
100
125
150
175
200
225
250
275
300
Near
Stre
am D
istu
rban
ce Z
one
(met
ers)
Surrogate MeasureEffective Shade
0.0
63.0
126.
0
189.
0
252.
0
315.
0
377.
9
440.
9
503.
9
566.
9
629.
9
0.0
7.6
15.2
22.9
30.5
38.1
45.7
53.3
61.0
68.6
76.2
83.8
91.4
Near
Stre
am D
istu
rban
ce Z
one
(feet
)
Solar Radiation Loading (ly/day)
0 or
180
deg
rees
from
Nor
th45
, 135
, 225
or 3
15 d
egre
es fr
om N
orth
90 o
r 270
deg
rees
from
Nor
thA
vera
ge
0%10%
20%
30%
40%
50%
60%
70%
80%
90%
100%
0
25
50
75
100
125
150
175
200
225
250
275
300
Near
Stre
am D
istu
rban
ce Z
one
(met
ers)
Surrogate MeasureEffective Shade
0.0
63.0
126.
0
189.
0
252.
0
315.
0
377.
9
440.
9
503.
9
566.
9
629.
9
0.0
7.6
15.2
22.9
30.5
38.1
45.7
53.3
61.0
68.6
76.2
83.8
91.4
Near
Stre
am D
istu
rban
ce Z
one
(feet
)Solar Radiation Loading (ly/day)
0 or
180
deg
rees
from
Nor
th45
, 135
, 225
or 3
15 d
egre
es fr
om N
orth
90 o
r 270
deg
rees
from
Nor
thA
vera
ge
Shad
e C
urve
s - M
ixed
Dec
iduo
us/C
onife
r Pot
entia
l Lan
d C
over
North Fork Sprague River
Pote
ntia
l Hei
ght:
16.4
met
ers
(53.
8 fe
et)
Pote
ntia
l Den
sity
:60
%
Pote
ntia
l Ove
rhan
g:2.
1 m
eter
s (6
.9 fe
et)
Pote
ntia
l Hei
ght:
16.4
met
ers
(53.
8 fe
et)
Pote
ntia
l Den
sity
:30
%
Pote
ntia
l Ove
rhan
g:2.
1 m
eter
s (6
.9 fe
et)
Figu
re 3
-17.
Sha
de C
urve
s –
Mix
ed D
ecid
uous
and
Con
ifer P
oten
tial L
and
Cov
er
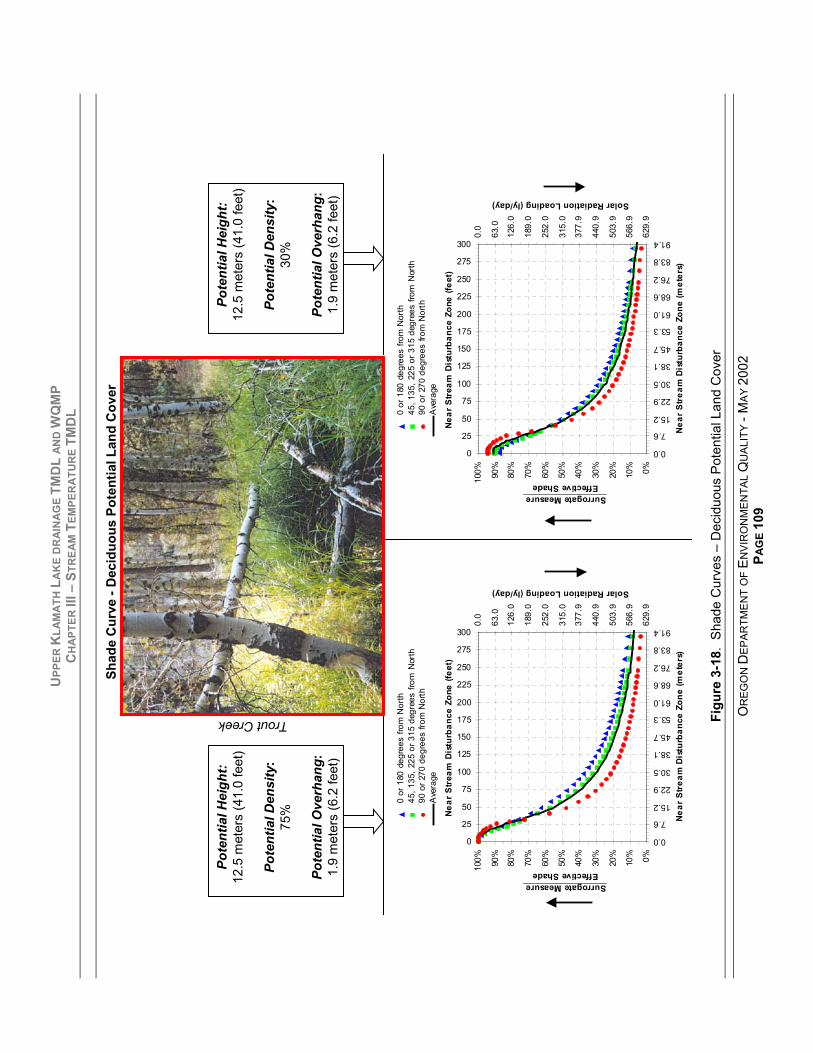
UPP
ER K
LAM
ATH
LAK
E D
RAI
NAG
E TM
DL
AND
WQ
MP
CH
APTE
R II
I – S
TREA
M T
EMPE
RAT
UR
E TM
DL
OR
EGO
N D
EPAR
TMEN
T O
F EN
VIR
ON
MEN
TAL
QU
ALIT
Y - M
AY 2
002
PAG
E 10
9
0%10%
20%
30%
40%
50%
60%
70%
80%
90%
100%
0
25
50
75
100
125
150
175
200
225
250
275
300
Nea
r S
trea
m D
istu
rban
ce Z
one
(met
ers)
Surrogate MeasureEffective Shade
0.0
63.0
126.
0
189.
0
252.
0
315.
0
377.
9
440.
9
503.
9
566.
9
629.
9
0.0
7.6
15.2
22.9
30.5
38.1
45.7
53.3
61.0
68.6
76.2
83.8
91.4
Nea
r S
trea
m D
istu
rban
ce Z
one
(feet
)Solar Radiation Loading (ly/day)
0 or
180
deg
rees
from
Nor
th45
, 135
, 225
or 3
15 d
egre
es fr
om N
orth
90 o
r 270
deg
rees
from
Nor
thA
vera
ge
0%10%
20%
30%
40%
50%
60%
70%
80%
90%
100%
0
25
50
75
100
125
150
175
200
225
250
275
300
Nea
r S
trea
m D
istu
rban
ce Z
one
(met
ers)
Surrogate MeasureEffective Shade
0.0
63.0
126.
0
189.
0
252.
0
315.
0
377.
9
440.
9
503.
9
566.
9
629.
9
0.0
7.6
15.2
22.9
30.5
38.1
45.7
53.3
61.0
68.6
76.2
83.8
91.4
Nea
r S
trea
m D
istu
rban
ce Z
one
(feet
)
Solar Radiation Loading (ly/day)
0 or
180
deg
rees
from
Nor
th45
, 135
, 225
or 3
15 d
egre
es fr
om N
orth
90 o
r 270
deg
rees
from
Nor
thA
vera
ge
Pote
ntia
l Hei
ght:
12.5
met
ers
(41.
0 fe
et)
Pote
ntia
l Den
sity
:75
%
Pote
ntia
l Ove
rhan
g:1.
9 m
eter
s (6
.2 fe
et)
Pote
ntia
l Hei
ght:
12.5
met
ers
(41.
0 fe
et)
Pote
ntia
l Den
sity
:30
%
Pote
ntia
l Ove
rhan
g:1.
9 m
eter
s (6
.2 fe
et)
Shad
e C
urve
- D
ecid
uous
Pot
entia
l Lan
d C
over
Trout Creek Figu
re 3
-18.
Sha
de C
urve
s –
Dec
iduo
us P
oten
tial L
and
Cov
er

UPP
ER K
LAM
ATH
LAK
E D
RAI
NAG
E TM
DL
AND
WQ
MP
CH
APTE
R II
I – S
TREA
M T
EMPE
RAT
UR
E TM
DL
OR
EGO
N D
EPAR
TMEN
T O
F EN
VIR
ON
MEN
TAL
QU
ALIT
Y - M
AY 2
002
PAG
E 11
0
0%10%
20%
30%
40%
50%
60%
70%
80%
90%
100%
0
25
50
75
100
125
150
175
200
225
250
275
300
Near
Stre
am D
istu
rban
ce Z
one
(met
ers)
Surrogate MeasureEffective Shade
0.0
63.0
126.
0
189.
0
252.
0
315.
0
377.
9
440.
9
503.
9
566.
9
629.
9
0.0
7.6
15.2
22.9
30.5
38.1
45.7
53.3
61.0
68.6
76.2
83.8
91.4
Near
Str
eam
Dis
turb
ance
Zon
e (fe
et)
Solar Radiation Loading (ly/day)
0 or
180
deg
rees
from
Nor
th45
, 135
, 225
or 3
15 d
egre
es fr
om N
orth
90 o
r 270
deg
rees
from
Nor
thA
vera
ge
Pote
ntia
l Hei
ght:
20.3
met
ers
(66.
6 fe
et)
Pote
ntia
l Den
sity
:60
%
Pote
ntia
l Ove
rhan
g:2.
0 m
eter
s (6
.6 fe
et)
Pote
ntia
l Hei
ght:
20.3
met
ers
(66.
6 fe
et)
Pote
ntia
l Den
sity
:30
%
Pote
ntia
l Ove
rhan
g:2.
0 m
eter
s (6
.6 fe
et)
Shad
e C
urve
- C
onife
r Pot
entia
l Lan
d C
over
Sycan River
Figu
re 3
-19.
Sha
de C
urve
s –
Con
ifer P
oten
tial L
and
Cov
er

UPP
ER K
LAM
ATH
LAK
E D
RAI
NAG
E TM
DL
AND
WQ
MP
CH
APTE
R II
I – S
TREA
M T
EMPE
RAT
UR
E TM
DL
OR
EGO
N D
EPAR
TMEN
T O
F EN
VIR
ON
MEN
TAL
QU
ALIT
Y - M
AY 2
002
PAG
E 11
1
Pote
ntia
l Hei
ght:
3.2
met
ers
(10.
5 fe
et)
Pote
ntia
l Den
sity
:90
%
Pote
ntia
l Ove
rhan
g:0.
5 m
eter
s (1
.6 fe
et)
Shad
e C
urve
- W
etla
nd S
hrub
Pot
entia
l Lan
d C
over
North Fork Sprague River
0%10%
20%
30%
40%
50%
60%
70%
80%
90%
100%
0
25
50
75
100
125
150
175
200
225
250
275
300
Nea
r S
trea
m D
istu
rban
ce Z
one
(met
ers)
Surrogate MeasureEffective Shade
0.0
63.0
126.
0
189.
0
252.
0
315.
0
377.
9
440.
9
503.
9
566.
9
629.
9
0.0
7.6
15.2
22.9
30.5
38.1
45.7
53.3
61.0
68.6
76.2
83.8
91.4
Nea
r S
trea
m D
istu
rban
ce Z
one
(feet
)
Solar Radiation Loading (ly/day)
0 or
180
deg
rees
from
Nor
th45
, 135
, 225
or 3
15 d
egre
es fr
om N
orth
90 o
r 270
deg
rees
from
Nor
thA
vera
ge
Figu
re 3
-20.
Sha
de C
urve
– W
etla
nd S
hrub
Pot
entia
l Lan
d C
over

UPP
ER K
LAM
ATH
LAK
E D
RAI
NAG
E TM
DL
AND
WQ
MP
CH
APTE
R II
I – S
TREA
M T
EMPE
RAT
UR
E TM
DL
OR
EGO
N D
EPAR
TMEN
T O
F EN
VIR
ON
MEN
TAL
QU
ALIT
Y - M
AY 2
002
PAG
E 11
2
Pote
ntia
l Hei
ght:
0.55
met
ers
(1.8
feet
)
Pote
ntia
l Den
sity
:90
%
Pote
ntia
l Ove
rhan
g:0.
27 m
eter
s (0
.9 fe
et)
Shad
e C
urve
- G
ram
inoi
d/Fo
rb P
oten
tial L
and
Cov
er
South Fork Sprague River
0%10%
20%
30%
40%
50%
60%
70%
80%
90%
100%
0
25
50
75
100
125
150
175
200
225
250
275
300
Nea
r Str
eam
Dis
turb
ance
Zon
e (m
eter
s)
Surrogate MeasureEffective Shade
0.0
63.0
126.
0
189.
0
252.
0
315.
0
377.
9
440.
9
503.
9
566.
9
629.
9
0.0
7.6
15.2
22.9
30.5
38.1
45.7
53.3
61.0
68.6
76.2
83.8
91.4
Nea
r S
trea
m D
istu
rban
ce Z
one
(feet
)
Solar Radiation Loading (ly/day)
0 or
180
deg
rees
from
Nor
th45
, 135
, 225
or 3
15 d
egre
es fr
om N
orth
90 o
r 270
deg
rees
from
Nor
thA
vera
ge
Figu
re 3
-21.
Sha
de C
urve
– G
ram
inoi
d/Fo
rb P
oten
tial L
and
Cov
er

UPPER KLAMATH LAKE DRAINAGE TMDL AND WQMPCHAPTER III – STREAM TEMPERATURE TMDL
OREGON DEPARTMENT OF ENVIRONMENTAL QUALITY - MAY 2002PAGE 113
3.7.3 Channel Morphology - Surrogate MeasuresChannel width is an important component in stream heat transfer and mass transfer
processes. Effective shade, stream surface area, wetted perimeter, stream depth and streamhydraulics are all highly sensitive to channel width. Accurate measurement of channel widthacross the stream network, coupled with other derived data, allows a comprehensive analyticalmethodology for assessing channel morphology (see Attachment 1 for more informationregarding the analysis of channel width). Potential bankfull width is estimated as a function ofwidth to depth ratio and drainage area. Relating targeted width to depth ratios to Rosgen streamtypes, bankfull width can also be assessed as a function of drainage area and Rosgen streamtype. Table 3-8 lists channel morphology surrogate measures.
Table 3-8. Channel Morphology Surrogate Measure - Potential Level I Rosgen Stream Typesand Targeted Width to Depth Ratios
Current Level I Rosgen Stream Type
Surrogate MeasurePotential Level I Rosgen Stream Type &
Targeted Width to Depth Ratio
A AW:D = 7.9
B BW:D = 18.6
C CW:D = 29.8
EW:D = 7.1
D CW:D = 29.8
DW:D = N/A
EW:D = 7.1
E EW:D = 7.1
F CW:D = 29.8
EW:D = 7.1
G CW:D = 29.8
EW:D = 7.1

UPPER KLAMATH LAKE DRAINAGE TMDL AND WQMPCHAPTER III – STREAM TEMPERATURE TMDL
OREGON DEPARTMENT OF ENVIRONMENTAL QUALITY - MAY 2002PAGE 114
1
10
100
1,000
1 10 100 1,000 10,000
Drainage Area (mi2)
Ban
kful
l Cha
nnel
Wid
th (f
t)
A (W:D = 7.9)
B (W:D = 18.6)
C (W:D = 29.8)
E (W:D = 7.1)
F (W:D = 27.6)
G (W:D = 8.0)
Figure 3-22. Potential Bankfull Width as a Function of Width to Depth Ratio and Drainage Area
3.8 MARGINS OF SAFETY – CWA §303(D)(1)The Clean Water Act requires that each TMDL be established with a margin of safety
(MOS). The statutory requirement that TMDLs incorporate a MOS is intended to account foruncertainty in available data or in the actual effect controls will have on loading reductions andreceiving water quality. A MOS is expressed as unallocated assimilative capacity or conservativeanalytical assumptions used in establishing the TMDL (e.g., derivation of numeric targets,modeling assumptions or effectiveness of proposed management actions).
The MOS may be implicit, as in conservative assumptions used in calculating the loadingcapacity, Waste Load Allocation, and Load Allocations. The MOS may also be explicitly stated asan added, separate quantity in the TMDL calculation. In any case, assumptions should be statedand the basis behind the MOS documented. The MOS is not meant to compensate for a failureto consider
A TMDL and associated MOS, which results in an overall allocation, represents the bestestimate of how standards can be achieved. The selection of the MOS should clarify theimplications for monitoring and implementation planning in refining the estimate if necessary(adaptive management). The TMDL process accommodates the ability to track and ultimatelyrefine assumptions within the TMDL implementation-planning component.

UPPER KLAMATH LAKE DRAINAGE TMDL AND WQMPCHAPTER III – STREAM TEMPERATURE TMDL
OREGON DEPARTMENT OF ENVIRONMENTAL QUALITY - MAY 2002PAGE 115
Table 3-9. Approaches for Incorporating a Margin of Safety into a TMDL
Type of Margin of Safety Available Approaches
Explicit
1. Set numeric targets at more conservative levels than analyticalresults indicate.
2. Add a safety factor to pollutant loading estimates.3. Do not allocate a portion of available loading capacity; reserve
for MOS.
Implicit
1. Conservative assumptions in derivation of numeric targets.2. Conservative assumptions when developing numeric model
applications.3. Conservative assumptions when analyzing prospective feasibility
of practices and restoration activities.
The following factors may be considered in evaluating and deriving an appropriate MOS:
The analysis and techniques used in evaluating the components of the TMDL process andderiving an allocation scheme.
Characterization and estimates of source loading (e.g., confidence regarding data limitation,analysis limitation or assumptions).
Analysis of relationships between the source loading and instream impact.
Prediction of response of receiving waters under various allocation scenarios (e.g., thepredictive capability of the analysis, simplifications in the selected techniques).
The implications of the MOS on the overall load reductions identified in terms of reductionfeasibility and implementation time frames.
Implicit Margins of Safety
Description of the MOS for the Upper Klamath Lake drainage Temperature TMDL beginswith a statement of assumptions. A MOS has been incorporated into the temperatureassessment methodology. Conservative estimates for groundwater inflow and wind speed wereused in the stream temperature simulations. Specifically, unless measured, groundwater inflowwas assumed to be zero. In addition, wind speed was also assumed to be at the lower end ofrecorded levels for the day of sampling. Recall that groundwater directly cools streamtemperatures via mass transfer/mixing. Wind speed is a controlling factor for evaporation, acooling heat energy process. Further, cooler microclimates and channel morphology changesassociated with mature and healthy near stream land cover were not accounted for in thesimulation methodology.
Calculating a numeric MOS is not easily performed with the methodology presented inthis document. In fact, the basis for the loading capacities and allocations is the definition ofsystem potential conditions. It is illogical to presume that anything more than system potentialriparian conditions are possible, feasible or reasonable.

UPPER KLAMATH LAKE DRAINAGE TMDL AND WQMPCHAPTER III – STREAM TEMPERATURE TMDL
OREGON DEPARTMENT OF ENVIRONMENTAL QUALITY - MAY 2002PAGE 116
3.9 WATER QUALITY STANDARD ATTAINMENTANALYSIS & REASONABLE ASSURANCES –CWA §303(D)(1)The temperature TMDL and the temperature water quality standards are achieved when (1)nonpoint source solar radiation loading is representative of a condition without humandisturbance and (2) point source discharges cause no measurable temperature increases (asdefined in the temperature standard) in surface waters.
Stream temperatures (displayed in Figures 3-23 to 3-27) that result from the system potentialconditions represent attainment of the temperature standard (no measurable surface watertemperature increase resulting from anthropogenic activities).
Simulations were performed to calculate the temperatures that result under the allocatedconditions and surrogate measures (i.e. potential channel morphology and land cover) thatrepresent the system potential condition with no measurable surface water temperatureincrease resulting from anthropogenic activities. The resulting simulated streamtemperatures represent attainment of system potential, and therefore, attainment of thetemperature standard.
Figures 3-23 through 3-27 display the stream temperatures that result from systempotential conditions. Analysis of potential flow conditions indicate that irrigation practices are acontributing factor to stream heating, and that improving flow conditions could further improveaquatic habitat. Although flow is not allocated in this TMDL, stream temperatures that result fromsystem potential flow conditions are included in the charts for informational purposes. Thestream temperatures that result from the potential channel width and land cover are the allocatedcondition.
A total of 250.6 river miles in the Williamson River, Sycan River, Sprague River, NorthFork Sprague River, and South Fork Sprague River were analyzed and simulated during thecritical period (August 4 to August 16, 1999). Figures 3-23 to 3-27 compares the current streamtemperatures with the potential conditions for each stream modeled.
Maximum daily stream temperature distributions are presented in Figure 3-28. Currently61% of the sampled stream segments in the Upper Klamath Lake Drainage exceed 68oF21.Under potential land cover and channel width, 17% of the simulated stream segments exceed68.5oF resulting in an additional 117 river miles that remain below this temperature thresholdwhen compared to the current condition. When potential flow volume is added to potential landcover and channel width, 10% of the simulated stream segments exceed 68oF, resulting in anadditional 26 river miles below this threshold condition when compared to the potential land coverand channel width. Results indicate that 83% of the stream length can achieve maximum dailystream temperatures less than 68oF under system potential conditions. With this result comes areality that 17% of the stream system (roughly 45 river miles) will remain above 68oF.
An overriding emphasis of the temperature TMDL is the focus on spatial distributions ofstream temperatures in the Upper Klamath Lake drainage. Comparisons of stream temperaturedistributions capture the variability that naturally exists in stream thermodynamics. Spatialvariability is observed in all of the stream segments sampled and analyzed. With the advent ofnew sampling technologies and analytical tools that include landscape scaled data and 21 The EPA proposed redband trout sub-lethal thermal limit is 68oF

UPPER KLAMATH LAKE DRAINAGE TMDL AND WQMPCHAPTER III – STREAM TEMPERATURE TMDL
OREGON DEPARTMENT OF ENVIRONMENTAL QUALITY - MAY 2002PAGE 117
computational methodologies, an improved understanding of stream temperature dynamics isemerging (Boyd, 1996, Faux et al. 2001, Torgersen et al., 1999, Torgersen et al., 2001, ODEQ2000, ODEQ 2001a, ODEQ2001b, ODEQ 2001c). This understanding accommodates spatialand temporal variability that includes departures from biologically derived temperature thresholdconditions.
Further, simple conceptual models that focus on a single stream, landscape oratmospheric parameter will fail to capture the interactions of a multitude of parameters that areinterrelated. These parameters combine to have complex thermal effects. As an example, at anetwork scale modeling demonstrates that stream temperature is relatively insensitive to potentialland cover conditions. However, when coupled with potential channel width, stream temperaturesare highly sensitive to potential land cover. When flow volume is increased to potential, thetemperature reductions created by potential land cover and channel width are further increased.The results of this analytical effort clearly demonstrate that a comprehensive restorationapproach should be developed that focuses on the protection and recovery of land coverand channel morphology, and increases instream flow volume during low flow periods.
Summary of Conclusions Developed in this Stream Temperature Analysis(see Attachment 1 for more information)
Conclusion #1 - Modest Increases in Effective Shade Produce Thermally Significant Cooling
Conclusion #2 - Spatial and temporal thermal variability includes departures from biologicallyderived temperature threshold conditions (i.e. EPA proposed Redband Trout sub-lethal thermallimit of 68oF). This holds true even in the defined “potential conditions”
Conclusion #3 - The shift in stream temperature distribution is favorable to fish. An additional117 stream miles are expected to become optimal, making sub-optimal thermal exposure verylimited in the potential condition.
Conclusion #4 - Simple conceptual models that focus on a single stream, landscape oratmospheric parameter will fail to capture the interactions of a multitude of parameters that areinterrelated. These parameters combine to have complex thermal effects.
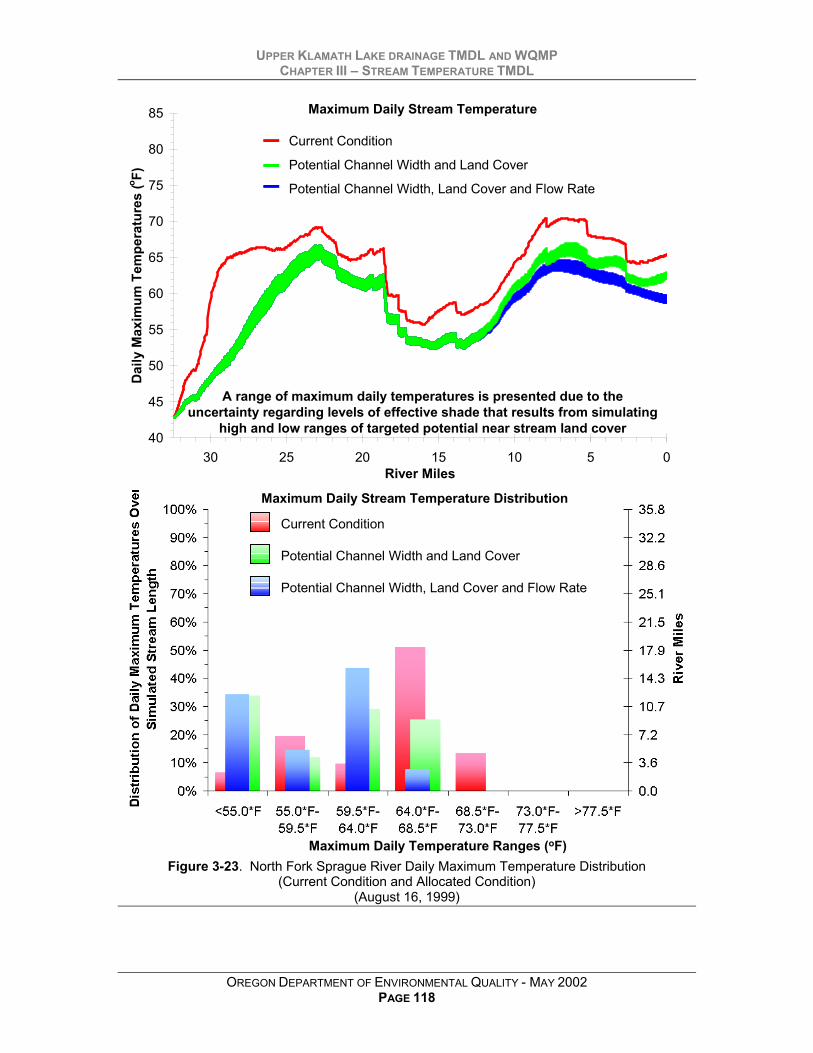
UPPER KLAMATH LAKE DRAINAGE TMDL AND WQMPCHAPTER III – STREAM TEMPERATURE TMDL
OREGON DEPARTMENT OF ENVIRONMENTAL QUALITY - MAY 2002PAGE 118
Current Condition
Potential Channel Width and Land Cover
Potential Channel Width, Land Cover and Flow Rate
A range of maximum daily temperatures is presented due to theuncertainty regarding levels of effective shade that results from simulating
high and low ranges of targeted potential near stream land cover
Current Condition
Potential Channel Width and Land Cover
Potential Channel Width, Land Cover and Flow Rate
Maximum Daily Temperature Ranges (oF)
40
45
50
55
60
65
70
75
80
85
051015202530River Miles
Dai
ly M
axim
um T
empe
ratu
res
(o F)
Maximum Daily Stream Temperature
Maximum Daily Stream Temperature Distribution
Figure 3-23. North Fork Sprague River Daily Maximum Temperature Distribution(Current Condition and Allocated Condition)
(August 16, 1999)
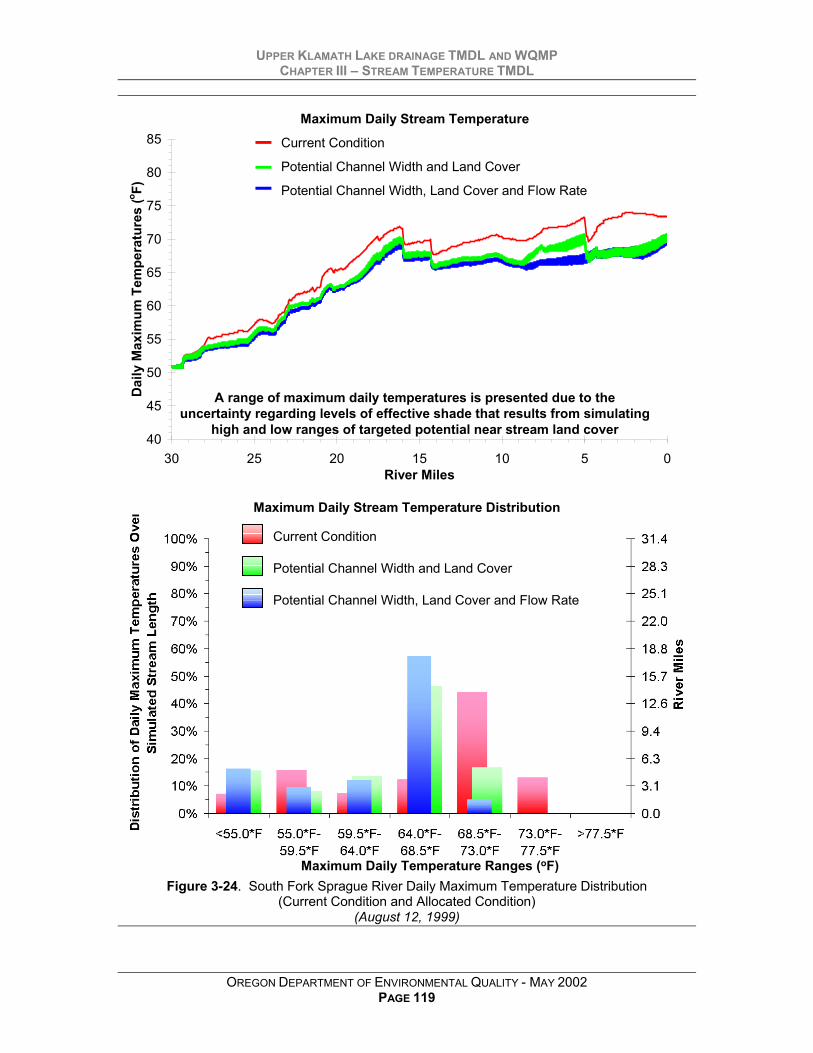
UPPER KLAMATH LAKE DRAINAGE TMDL AND WQMPCHAPTER III – STREAM TEMPERATURE TMDL
OREGON DEPARTMENT OF ENVIRONMENTAL QUALITY - MAY 2002PAGE 119
40
45
50
55
60
65
70
75
80
85
051015202530River Miles
Dai
ly M
axim
um T
empe
ratu
res
(o F)
Maximum Daily Stream Temperature Distribution
Current Condition
Potential Channel Width and Land Cover
Potential Channel Width, Land Cover and Flow Rate
A range of maximum daily temperatures is presented due to theuncertainty regarding levels of effective shade that results from simulating
high and low ranges of targeted potential near stream land cover
Current Condition
Potential Channel Width and Land Cover
Potential Channel Width, Land Cover and Flow Rate
Maximum Daily Temperature Ranges (oF)
Maximum Daily Stream Temperature
Figure 3-24. South Fork Sprague River Daily Maximum Temperature Distribution(Current Condition and Allocated Condition)
(August 12, 1999)

UPPER KLAMATH LAKE DRAINAGE TMDL AND WQMPCHAPTER III – STREAM TEMPERATURE TMDL
OREGON DEPARTMENT OF ENVIRONMENTAL QUALITY - MAY 2002PAGE 120
40
45
50
55
60
65
70
75
80
85
05101520253035River Miles
Dai
ly M
axim
um T
empe
ratu
res
(o F)
Maximum Daily Stream Temperature Distribution
Current Condition
Potential Channel Width and Land Cover
Potential Channel Width, Land Cover and Flow Rate
A range of maximum daily temperatures is presented due to theuncertainty regarding levels of effective shade that results from simulating
high and low ranges of targeted potential near stream land cover
Current Condition
Potential Channel Width and Land Cover
Potential Channel Width, Land Cover and Flow Rate
Maximum Daily Temperature Ranges (oF)
Maximum Daily Stream Temperature
Figure 3-25. Sycan River Daily Maximum Temperature Distribution(Current Condition and Allocated Condition)
(August 16, 1999)
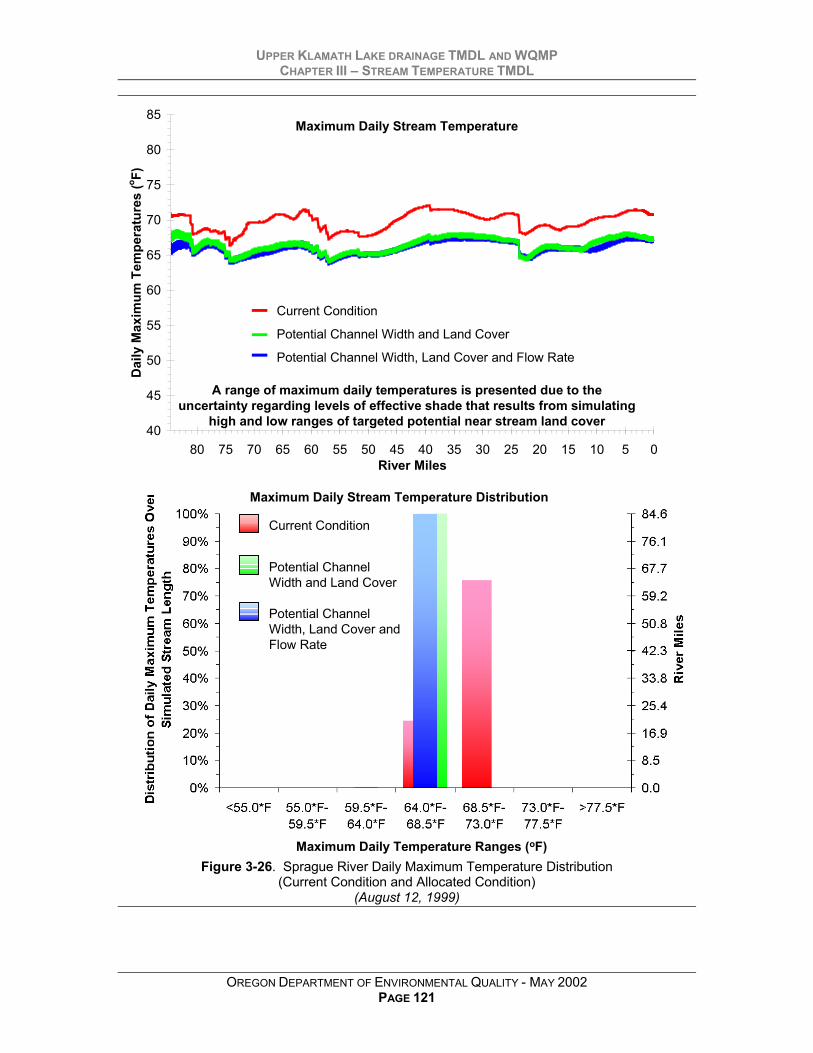
UPPER KLAMATH LAKE DRAINAGE TMDL AND WQMPCHAPTER III – STREAM TEMPERATURE TMDL
OREGON DEPARTMENT OF ENVIRONMENTAL QUALITY - MAY 2002PAGE 121
Maximum Daily Stream Temperature Distribution
Current Condition
Potential ChannelWidth and Land Cover
Potential ChannelWidth, Land Cover andFlow Rate
A range of maximum daily temperatures is presented due to theuncertainty regarding levels of effective shade that results from simulating
high and low ranges of targeted potential near stream land cover
Current Condition
Potential Channel Width and Land Cover
Potential Channel Width, Land Cover and Flow Rate
Maximum Daily Temperature Ranges (oF)
Maximum Daily Stream Temperature
40
45
50
55
60
65
70
75
80
85
05101520253035404550556065707580River Miles
Dai
ly M
axim
um T
empe
ratu
res
(o F)
Figure 3-26. Sprague River Daily Maximum Temperature Distribution(Current Condition and Allocated Condition)
(August 12, 1999)

UPPER KLAMATH LAKE DRAINAGE TMDL AND WQMPCHAPTER III – STREAM TEMPERATURE TMDL
OREGON DEPARTMENT OF ENVIRONMENTAL QUALITY - MAY 2002PAGE 122
Current Condition
Potential Channel Width and Land Cover
Potential Channel Width, Land Cover and Flow Rate
A range of maximum daily temperatures is presented due to theuncertainty regarding levels of effective shade that results from simulating
high and low ranges of targeted potential near stream land cover
Current Condition
Potential Channel Width and Land Cover
Potential Channel Width, Land Cover and Flow Rate
Maximum Daily Temperature Ranges (oF)
40
45
50
55
60
65
70
75
80
85
05101520253035404550556065707580River Mile
Dai
ly M
axim
um T
empe
ratu
re (o F) Klamath
Marsh
Maximum Daily Stream Temperature Distribution
Maximum Daily Stream Temperature
Figure 3-27. Williamson River Daily Maximum Temperature Distribution(Current Condition and Allocated Condition)
(August 4, 1999)
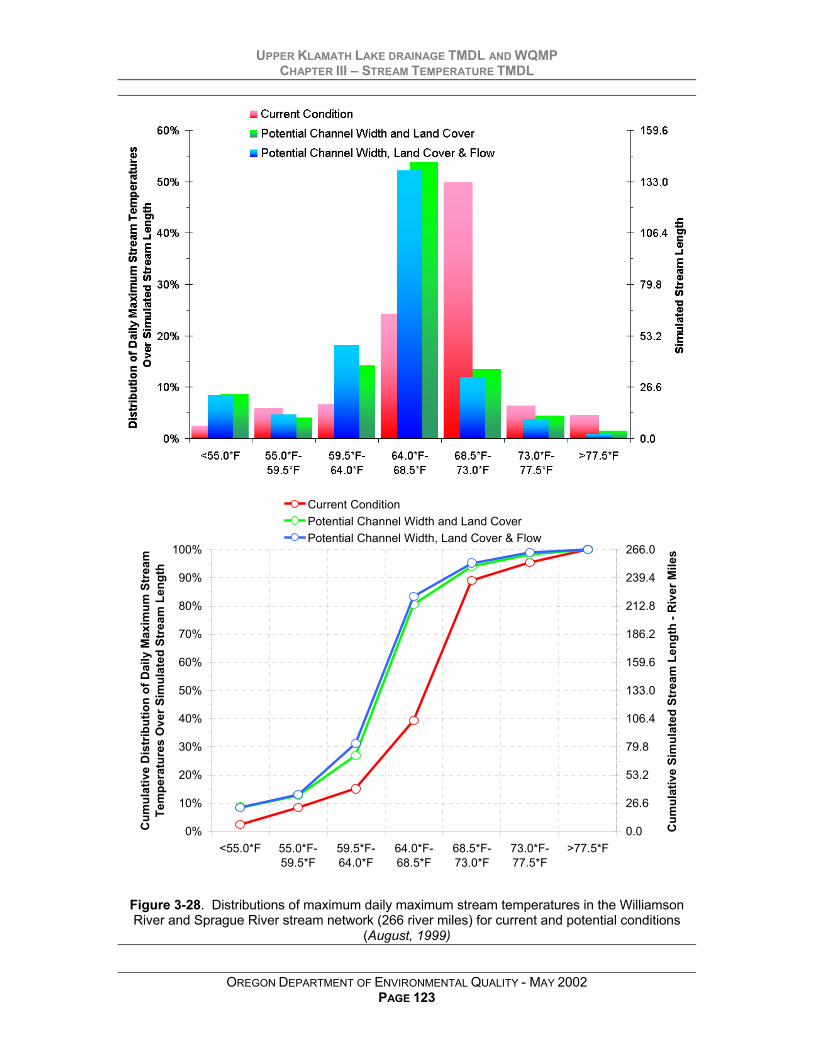
UPPER KLAMATH LAKE DRAINAGE TMDL AND WQMPCHAPTER III – STREAM TEMPERATURE TMDL
OREGON DEPARTMENT OF ENVIRONMENTAL QUALITY - MAY 2002PAGE 123
0%
10%
20%
30%
40%
50%
60%
70%
80%
90%
100%
<55.0*F 55.0*F-59.5*F
59.5*F-64.0*F
64.0*F-68.5*F
68.5*F-73.0*F
73.0*F-77.5*F
>77.5*F
Cum
ulat
ive
Dis
trib
utio
n of
Dai
ly M
axim
um S
trea
m
Tem
pera
ture
s O
ver S
imul
ated
Str
eam
Len
gth
0.0
26.6
53.2
79.8
106.4
133.0
159.6
186.2
212.8
239.4
266.0
Cum
ulat
ive
Sim
ulat
ed S
trea
m L
engt
h - R
iver
Mile
s
Current ConditionPotential Channel Width and Land CoverPotential Channel Width, Land Cover & Flow
Figure 3-28. Distributions of maximum daily maximum stream temperatures in the WilliamsonRiver and Sprague River stream network (266 river miles) for current and potential conditions
(August, 1999)

UPPER KLAMATH LAKE DRAINAGE TMDL AND WQMPCHAPTER III – STREAM TEMPERATURE TMDL
OREGON DEPARTMENT OF ENVIRONMENTAL QUALITY - MAY 2002PAGE 124
Increase in Effective Shade Resulting from Potential Channel Width & Land Cover
#####################################################################################################################################################################################################################################################################################################################################################################################################################################################################################################################################################################################################################################################################################################################################################################################################################################################################################################################################################################################################################
######################################################################################################################################################################################################################################################################################################################################################################################################################
################################################################################################################################################################################################################################
###############################################################################################################################################################################################################################################################################
###############################################################################################################################################################################################################################################################
###############################################################################################################################################################################################################################################################################################################################################################################################################################################################################
#################################################################################################################################################################################################
########################################################################################################
####################################################################################################################
##################################################################################################################################
####################################################################################################################################################################################
#####################################################################################################################################################################################################################################
#####################################################################################################################################################################################################################################################################################################################################################################################################################################################################################################################################################################################################################################################################################################################
#########################################################################################################################################################################################################################################################################################################################################################################################################################################################################################################################################################################################################################################################################
#############################################################################################################################################################################################################################################################################################################################################################################################################################
##################################################################################################################################################################################################################################################################################################################################################################################################################################################################################################
###########################################################################################################################################################################################################################################################################################################################################################################################################################################################################################################################################################################################################################################################################################################################################################################################################################################################################################################################################################################################################################################################################################################################################################################################################################################################################################################################################################################################################################################################################################################################################################################################################################################################################################################################################################################################################################################################################################################################################################################################################################################################################################################################################################################################################################################################################################
##########################################################################################################################################################
###############################################################################################################################################################################################################################################################################################################################################################################################################################################################################################################################################################################################################################################################################################################################################################################################################################################################################################################################################################################################################################################################################################################################################################################################################################################################################################################################################################################################################################################################################################################################################################
##################################################################################################################################################################################################################################################################################################################################################################################################################################################################################################################################################################################################################################################################################################################################################################################################################################################################################################################################
#####################################################################################################################################################################################################################################################################################################################################################################################################################################################################
########################################################################################################################################################################################################################################################################################################################################################################################################################################################################################################################################################################################################################################################################################################################################################################################################################################################################
###############################################################################################################################################################################################################################################################################################################################################################################################################################################################################################################################
###################################################################################################################################################################
##############################################################################################################################################################################################################################
######################################################################################################################################################################################################################################################################################################################################################################################################################################################################################################
################################################################################################################################################################################################################################################################################################################################################################################################################################################################################################################################################################
#####################################################################################################################################################################################################################################################################################################################################################################################################################################################################################################################################################################################################################################
#################################################################
##############################################################################################################################################################################################################################################################
######################################################################################################################################################################################################################################################################################################################################################################################################################################################################################
##########################################################################################################################################################################################################################################################################################################
#################################################################################################################################################################################################################################################################################################
############################################################################################################################################################################################################################################################
#######################################################################################################################################################################################################################################################################################################################################################################################################################################################################################################################################################################################################################################################################################################################################################################################################################################################################################################################################################################################################################################################################################################################################################################################################################################################################################################################################################################################################################################################################################################################################################################################################################################################################################################################################################################################################################################################################################################################################################################################################################################################################################################################################################################################################################################
Klamath Falls
ChiloquinAgency
Lake
UpperKlamath
Lake
Will
iam
son
Rive
r
Sprague River
Syca
n Ri
ver
N.F.
S.F.Fishhole Creek
KlamathMarsh
Wood River
Sun Creek
#
Increase in Effective Shade(Potential Channel & Land Cover
Condition - Current Condition)0% - 5%5% - 10%10% - 15%15% - 25%25% - 50%50% - 100%
#####
Increase inEffective Shade
Temperature Difference Resulting from Potential Channel Width & Land Cover
########################################################################################################################################################################################################################################################################################################################################################################################################################################################################################################################################################################################################################################################################################################################################################################################################################################################################################################
######################################################################################################################################################################################################################################################################################################################################################################################################################
################################################################################################################################################################################################################################
#############################################################################################################################################################
###########################################################################################################################################################################################################################################################################################################################################################################################################################
###############################################################################################################################################################################################################################################################################################################################################################################################################################################################################################################################################################################################################################################################
#################################################################################################################################################################################################################################################################################################################################################################################################################################
##################################################################################################################################################################################################################################################
#
###############################################################################################################################################################################################################################################################################################################################################################################################################################################################################################################################################################################################################################################################################################################################################################################################################################################################################################################################################################################################################################################################################################################################################################################################################################################################################################################################################################################################################################################################################################################################################################################################################################################################################################################################################################################################################################################################################################################################################################################################################################################################################################################################################################################################################################################################################################
#############################################################################################################################################################################################################################################################################################################################################################################################################################################################################################################################################################################################################################################################################################################################################################################################################################################################################################################################################################################################################################################################################################################################################################################################################################################################################################################################################################################################################################################################################################################################################################################################################################
##################################################################################################################################################################################################################################################################################################################################################################################################################################################################################################################################################################################################################################################################################################################################################################################################################################################################################################################################
#####################################################################################################################################################################################################################################################################################################################################################################################################################################################################
########################################################################################################################################################################################################################################################################################################################################################################################################################################################################################################################################################################################################################################################################################################################################################################################################################################################################
###############################################################################################################################################################################################################################################################################################################################################################################################################################################################################################################################
###################################################################################################################################################################
##############################################################################################################################################################################################################################
######################################################################################################################################################################################################################################################################################################################################################################################################################################################################################################
################################################################################################################################################################################################################################################################################################################################################################################################################################################################################################################################################################
#####################################################################################################################################################################################################################################################################################################################################################################################################################################################################################################################################################################################################################################
###########################################################
#######################################################################################################################################################################################################################################################################################################################################################################################################################################################################################################################################################################################################################################################################################################################################################################################################################################################################################################################################################################################################################################################################################################################################################################################################################################################################################################################################################################################################################################################################################################################################################################################################################################################################################################################################################################################################################################################################################################################################################################################################################################################################################################
Klamath Falls
ChiloquinAgency
Lake
UpperKlamath
Lake
Will
iam
son
Rive
r
Sprague River
Syca
n Ri
ver
N.F.
S.F.Fishhole Creek
KlamathMarsh
Wood River
Sun Creek
#####
0.0*F to +2.5*F-2.5*F to 0.0*F-5.0 *F to -2.5*F-7.5*F to -5.0*F-10.0*F to -7.5*F-15.0*F to -10.0*F
Simulated Difference in Critical ConditDaily Maximum Stream Temperatur
(Potential Channel & Land Cover Condition - Current Condition)
#
Change in Maximum Stream Temperature
Conclusion #1 - Modest Increases in Effective Shade Produce Thermally Significant Cooling

UPPER KLAMATH LAKE DRAINAGE TMDL AND WQMPCHAPTER III – STREAM TEMPERATURE TMDL
OREGON DEPARTMENT OF ENVIRONMENTAL QUALITY - MAY 2002PAGE 125
Simulated Potential Daily Maximum Stream Temperature Summaries
Shift in potential temperature
regime
Optimal Sub-OptimalConclusion #2 - Spatial and temporal thermal variability includes departures from biologicallyderived temperature threshold conditions (i.e. EPA proposed Redband Trout limit of 68oF). Thisholds true even in the defined “potential conditions”
83%
17%
39%
61%
0%
10%
20%
30%
40%
50%
60%
70%
80%
90%
100%
Optimal Sub-Optimal
Port
ion
of S
trea
m N
etw
ork
Abo
ve a
nd B
elow
Opt
imal
Str
eam
Tem
pera
ture
- 68
o F
Current Condition
Potential Condition
Conclusion #3 - The shift in stream temperature distribution is favorable to fish. An additional117 stream miles are expected to become optimal, making sub-optimal thermal exposure verylimited in the potential condition.
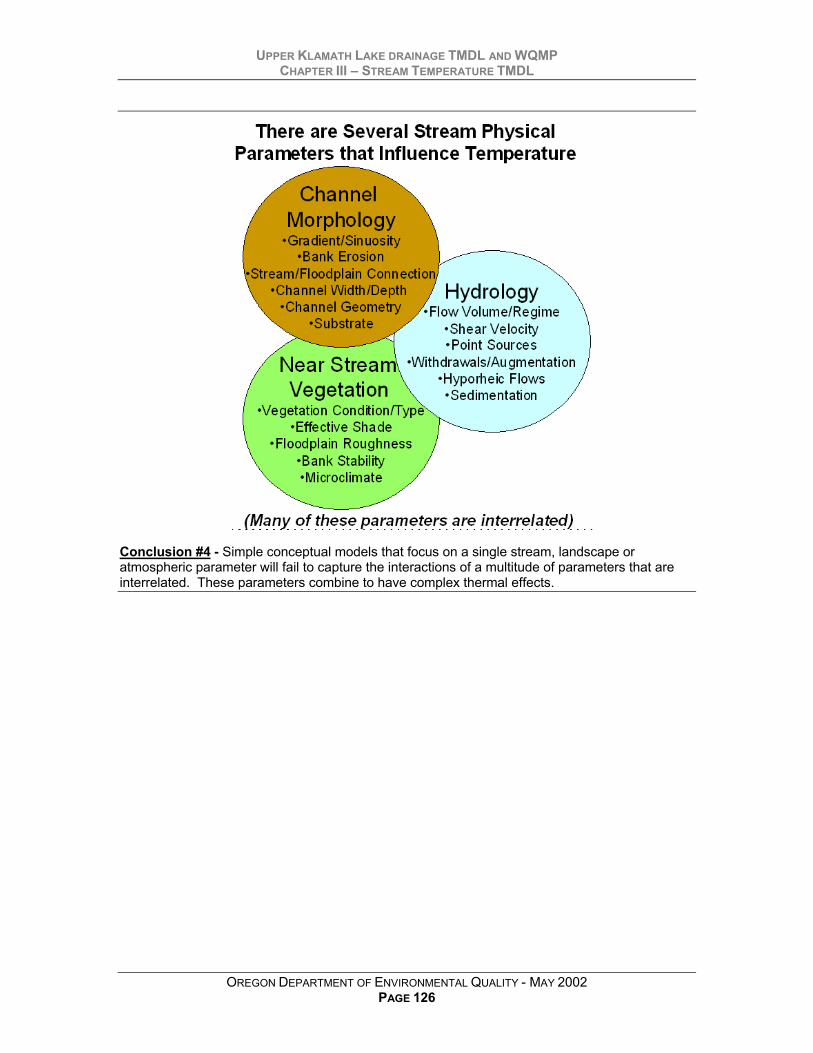
UPPER KLAMATH LAKE DRAINAGE TMDL AND WQMPCHAPTER III – STREAM TEMPERATURE TMDL
OREGON DEPARTMENT OF ENVIRONMENTAL QUALITY - MAY 2002PAGE 126
Conclusion #4 - Simple conceptual models that focus on a single stream, landscape oratmospheric parameter will fail to capture the interactions of a multitude of parameters that areinterrelated. These parameters combine to have complex thermal effects.

UPPER KLAMATH LAKE DRAINAGE TMDL AND WQMPCHAPTER IV – SPRAGUE RIVER DISSOLVED OXYGEN TMDL
OREGON DEPARTMENT OF ENVIRONMENTAL QUALITY - MAY 2002PAGE 127
CHAPTER IVSPRAGUE RIVER DISSOLVED
OXYGEN TMDL
Algal Mass in the North Fork Sprague River

UPPER KLAMATH LAKE DRAINAGE TMDLCHAPTER VI – WATER QUALITY MANAGEMENT PLAN
OREGON DEPARTMENT OF ENVIRONMENTAL QUALITY - MAY 2002PAGE 128
Table 4-1. Upper Klamath Lake drainage Dissolved Oxygen TMDL Components
Waterbodies SPRAGUE RIVER - HUC CODE 18010202.
PollutantIdentification
Pollutants: increased algal biomass resulting from human causedincreases in stream temperatures, channel modifications and near streamvegetation disturbance/removal.
TargetIdentification
(Applicable WaterQuality Standards)CWA §303(d)(1)
OAR 340-041-0965(2)(A) (IN PART)(A) For waterbodies identified by DEQ as providing salmonid spawning,
during the periods from spawning until fry emergence from the gravels,the following criteria apply:
(i) The dissolved oxygen shall not be less than 11.0 mg/L.(D) For waterbodies identified by DEQ as providing cold-water aquatic life,
the dissolved oxygen shall not be less than 8.0 mg/l as an absoluteminimum. Where conditions of barometric pressure, altitude, andtemperature preclude attainment of the 8.0 mg/l, dissolved oxygenshall not be less than 90 percent of saturation. At the discretion ofDEQ, when it is determined that adequate information exists, thedissolved oxygen shall not fall below 8.0 mg/l as a 30-day meanminimum, 6.5 mg/l as a seven-day minimum mean, and shall not fallbelow 6.0 mg/l as an absolute minimum;
(E) For waterbodies identified by DEQ as providing cool-water aquatic life,the dissolved oxygen shall not be less than 6.5 mg/l as an absoluteminimum. At the discretion of DEQ, when it is determined thatadequate information exists, the dissolved oxygen shall not fall below6.5 mg/l as a 30-day mean minimum, 5.0 mg/l as a seven-dayminimum mean, and shall not fall below 4.0 mg/l as an absoluteminimum;
(F) For waterbodies identified by DEQ as providing warm-water aquaticlife, the dissolved oxygen shall not be less than 5.5 mg/l as an absoluteminimum. At the discretion of DEQ, when it is determined thatadequate information exists, the dissolved oxygen shall not fall below5.5 mg/l as a 30-day mean minimum, and shall not fall below 4.0 mg/las an absolute minimum ;
Existing SourcesCWA §303(d)(1) Forestry, Agriculture, Transportation, Rural Residential, Urban
SeasonalVariation
CWA §303(d)(1)Critical DO levels on the Sprague River generally occur in late summer.
TMDLLoading Capacityand Allocations40 CFR 130.2(f)40 CFR 130.2(g)40 CFR 130.2(h)
Loading Capacity: The LC for the mainstem is the cold water-aquatic lifedissolved oxygen criteria: The dissolved oxygen shall not fall below 6.0mg/L as an absolute minimum. Waste Wasteload Allocations (Point Sources): There are no point sourcesin the Sprague subbasin that adversely affect dissolved oxygen.Load Allocations (Non-Point Sources): The LAs for instream temperatureare presented in Table 3-7 and surrogate measures listed in Section 3.7Surrogate Measures – 40 CFR 130.2(i)).
SurrogateMeasures
40 CFR 130.2(i)
Margins of Safety demonstrated in critical condition assumptions and isinherent to methodology. (Detailed in section )
Margins of SafetyCWA §303(d)(1)
• Analytical modeling of TMDL loading capacities demonstratesattainment water quality standards
Water QualityStandard
AttainmentAnalysis
CWA §303(d)(1)
To be conducted by Oregon Department of Environmental Quality

UPPER KLAMATH LAKE DRAINAGE TMDL AND WQMPCHAPTER IV – SPRAGUE RIVER DISSOLVED OXYGEN TMDL
OREGON DEPARTMENT OF ENVIRONMENTAL QUALITY - MAY 2002PAGE 129
4.1 OVERVIEWData was collected on the Sprague River during two synoptic surveys in 1999 and 2000.
Grab data and continuous monitoring data were collected during these efforts. Computersimulations (i.e. Qual2E) were developed using this data and data developed in the temperatureTMDL for hydrology, channel morphology and near stream vegetation. Dissolved oxygen wascalibrated in a steady state hydraulic simulation with dynamic algal growth simulations.Producing an equivalent algal biomass at critical portions of the finite difference grid simulatedperiphyton. Calibration focused on dissolved oxygen during early morning and late eveningperiods.
Conditions developed in the temperature TMDL listed as surrogate measures (seeSection 3.7 Surrogate Measures – 40 CFR 130.2(i)) that relate to channel morphology, nearstream land cover and resulting solar loading and stream temperature were demonstrated toimprove dissolved oxygen levels that meet water quality standards.
4.2 TARGET IDENTIFICATION – CWA §303(D)(1)Loss of DO has detrimental effects on aquatic species, especially salmonids. Minimum
levels of oxygen are required to maintain all healthy populations. A minimum level of 4.0 mg/LDO concentration is needed to avoid acute mortality of non-salmonid fish in early life Stages (U.S.EPA, 1986), a minimum of 4.0 mg/L for cool water species, and a minimum of 6.0 mg/L for coldwater species (OAR 340-041-0965(2)(a)).
4.2.1 Sensitive Beneficial Use IdentificationThe primary benefit to maintaining adequate dissolved oxygen (DO) concentrations is to
support a healthy and balanced distribution of aquatic life. Table 4-2 lists the beneficial uses thatoccur in the Sprague River highlights those that are related to DO.
Table 4-2. Beneficial uses occurring in the Upper Klamath Lake Subbasin(OAR 340 – 41 – 965)
Beneficial uses related to Dissolved Oxygen are marked in RED
Beneficial Use Occurring Beneficial Use OccurringPublic Domestic Water Supply Salmonid Fish Spawning (Trout)Private Domestic Water Supply Salmonid Fish Rearing (Trout)
Industrial Water Supply Resident Fish and Aquatic LifeIrrigation Anadromous Fish Passage
Livestock Watering Wildlife and HuntingBoating Fishing
Hydro Power Water Contact Recreation
Aesthetic Quality Commercial Navigation &Transportation

UPPER KLAMATH LAKE DRAINAGE TMDL AND WQMPCHAPTER IV – SPRAGUE RIVER DISSOLVED OXYGEN TMDL
OREGON DEPARTMENT OF ENVIRONMENTAL QUALITY - MAY 2002PAGE 130
The applicable section(s) of the dissolved oxygen rule (OAR 340-041-0965) aredetermined by the presence of cool or cold-water aquatic life, and the life stages of any salmonidspresent (i.e., spawning, rearing, etc.). Redband trout are the most sensitive beneficial use in theSprague River Subbasin. A map showing where redband trout are a beneficial use is included inFigure 1-10, page 21. Cold, cool, and warm-water aquatic life are defined in OregonAdministrative Rule (OAR) 340-041-0006 as follows:
(51) “Cold-Water Aquatic Life” – The aquatic communities that are physiologically restricted tocold water, composed of one or more species sensitive to reduced oxygen levels. Including butnot limited to Salmonidae and cold-water invertebrates.(52) “Cool-Water Aquatic Life” – The aquatic communities that are physiologically restricted tocool waters, composed of one or more species having dissolved oxygen requirements believedsimilar to the cold-water communities. Including but not limited to Cottidae, Osmeridae,Acipenseridae, and sensitive Centrarchidae such as the small-mouth bass.(53) “Warm-Water Aquatic Life” – The aquatic communities that are adapted to warm-waterconditions and do not contain either cold- or cool-water species.
Based on available fish survey information, habitat assessments and professionaljudgement, DEQ, with input from the USFWS, ODF&W and Klamath Tribes staff, the streamsegments denoted in Figure 1-10 are designated as providing cold water aquatic life. Thedynamic water quality modeling done to determine the TMDL predicts the daily diel range ofdissolved oxygen during “worst case” conditions. The Department, with input from local fisheriesbiologists, has determined that sufficient data and analyses provide the basis for targeting the 6.0mg/L absolute minimum cold water criteria. The 6.0 mg/L minimum dissolved oxygen, with the0.4 mg/L margin of safety included in this TMDL, will be protective of beneficial uses (redbandtrout).
4.2.2 Water Quality Standard Identification
4.2.2.1 Dissolved Oxygen Water Quality Standard
Oregon Administrative Rule 340-041-0965
(3) No wastes shall be discharged and no activities shall be conducted which either alone or incombination with other wastes or activities will cause violation of the following standards inthe waters of the Klamath Basin:(a) Dissolved oxygen (DO): The changes adopted by the Commission on January 11, 1996,
become effective July 1, 1996. Until that time, the requirements of this rule that were ineffect on January 10, 1996, apply:(A) For waterbodies identified by DEQ as providing salmonid spawning, during the
periods from spawning until fry emergence from the gravels, the following criteriaapply:(i) The dissolved oxygen shall not be less than 11.0 mg/L. However, if the minimum
intergravel dissolved oxygen, measured as a spatial median, is 8.0 mg/L orgreater, then the DO criterion is 9.0 mg/L;
(ii) Where conditions of barometric pressure, altitude, and temperature precludeattainment of the 11.0 mg/L or 9.0 mg/L criteria, dissolved oxygen levels shall notbe less than 95 percent of saturation.
(B) For waterbodies identified by DEQ as providing salmonid spawning during the periodfrom spawning until fry emergence from the gravels, the spatial median intergraveldissolved oxygen concentration shall not fall below 6.0 mg/l;
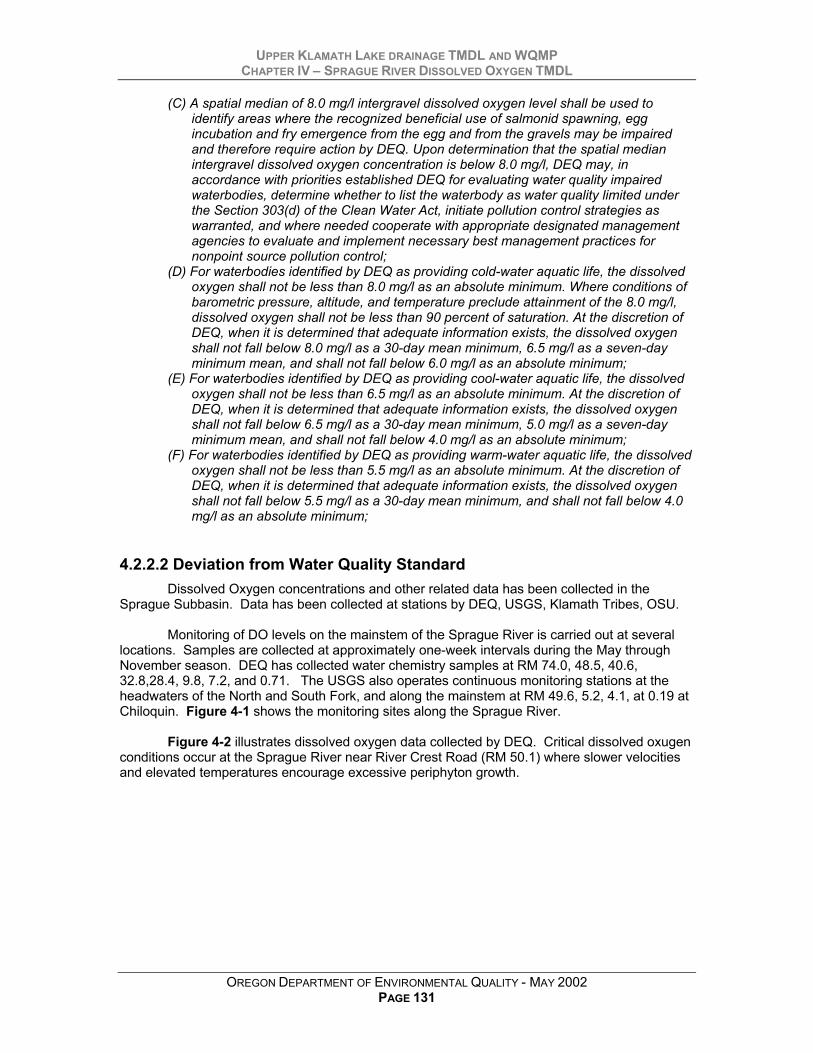
UPPER KLAMATH LAKE DRAINAGE TMDL AND WQMPCHAPTER IV – SPRAGUE RIVER DISSOLVED OXYGEN TMDL
OREGON DEPARTMENT OF ENVIRONMENTAL QUALITY - MAY 2002PAGE 131
(C) A spatial median of 8.0 mg/l intergravel dissolved oxygen level shall be used toidentify areas where the recognized beneficial use of salmonid spawning, eggincubation and fry emergence from the egg and from the gravels may be impairedand therefore require action by DEQ. Upon determination that the spatial medianintergravel dissolved oxygen concentration is below 8.0 mg/l, DEQ may, inaccordance with priorities established DEQ for evaluating water quality impairedwaterbodies, determine whether to list the waterbody as water quality limited underthe Section 303(d) of the Clean Water Act, initiate pollution control strategies aswarranted, and where needed cooperate with appropriate designated managementagencies to evaluate and implement necessary best management practices fornonpoint source pollution control;
(D) For waterbodies identified by DEQ as providing cold-water aquatic life, the dissolvedoxygen shall not be less than 8.0 mg/l as an absolute minimum. Where conditions ofbarometric pressure, altitude, and temperature preclude attainment of the 8.0 mg/l,dissolved oxygen shall not be less than 90 percent of saturation. At the discretion ofDEQ, when it is determined that adequate information exists, the dissolved oxygenshall not fall below 8.0 mg/l as a 30-day mean minimum, 6.5 mg/l as a seven-dayminimum mean, and shall not fall below 6.0 mg/l as an absolute minimum;
(E) For waterbodies identified by DEQ as providing cool-water aquatic life, the dissolvedoxygen shall not be less than 6.5 mg/l as an absolute minimum. At the discretion ofDEQ, when it is determined that adequate information exists, the dissolved oxygenshall not fall below 6.5 mg/l as a 30-day mean minimum, 5.0 mg/l as a seven-dayminimum mean, and shall not fall below 4.0 mg/l as an absolute minimum;
(F) For waterbodies identified by DEQ as providing warm-water aquatic life, the dissolvedoxygen shall not be less than 5.5 mg/l as an absolute minimum. At the discretion ofDEQ, when it is determined that adequate information exists, the dissolved oxygenshall not fall below 5.5 mg/l as a 30-day mean minimum, and shall not fall below 4.0mg/l as an absolute minimum;
4.2.2.2 Deviation from Water Quality StandardDissolved Oxygen concentrations and other related data has been collected in the
Sprague Subbasin. Data has been collected at stations by DEQ, USGS, Klamath Tribes, OSU.
Monitoring of DO levels on the mainstem of the Sprague River is carried out at severallocations. Samples are collected at approximately one-week intervals during the May throughNovember season. DEQ has collected water chemistry samples at RM 74.0, 48.5, 40.6,32.8,28.4, 9.8, 7.2, and 0.71. The USGS also operates continuous monitoring stations at theheadwaters of the North and South Fork, and along the mainstem at RM 49.6, 5.2, 4.1, at 0.19 atChiloquin. Figure 4-1 shows the monitoring sites along the Sprague River.
Figure 4-2 illustrates dissolved oxygen data collected by DEQ. Critical dissolved oxugenconditions occur at the Sprague River near River Crest Road (RM 50.1) where slower velocitiesand elevated temperatures encourage excessive periphyton growth.

UPPER KLAMATH LAKE DRAINAGE TMDL AND WQMPCHAPTER IV – SPRAGUE RIVER DISSOLVED OXYGEN TMDL
OREGON DEPARTMENT OF ENVIRONMENTAL QUALITY - MAY 2002PAGE 132
# #
#
#
#
#
#####
#
#
#
#
##
#
%U
%U%U%U
%U
%U
%U%U %U
%U
%U%U
%U%U
%U
%U%U
%U
%U
%U%U%U
''
'
'
'
'
'
'
'
'
'
''
'
'
'' '
''' '
' ''' ''' ' '
' ''' '' '' '''' '''''
' ''' '' ''
'' '
' '
' '''' '
'
''
'''
'
''
'
''
'
'
'
'
'
'
'
'
'''
''
''
''
''
''
'
'
'
''
'
'
'
'''
'
'
'
$T$T$T$T$T$T$T$T$T$T$T$T$T$T$T$T$T$T$T$T$T$T$T$T$T$T$T$T$T$T$T$T$T$T$T$T$T$T$T$T$T$T$T$T$T$T$T$T$T$T$T$T$T$T$T$T$T$T$T$T$T$T$T$T$T$T$T$T$T$T$T$T$T$T$T$T$T$T$T$T$T$T$T$T$T$T$T$T$T$T$T$T$T$T$T$T$T$T$T$T$T$T$T$T$T$T$T$T$T$T$T$T$T$T$T$T$T$T$T$T$T$T$T$T$T$T$T$T$T$T$T$T$T$T$T$T$T$T$T$T$T$T$T$T$T$T$T$T$T$T$T$T$T$T$T$T$T$T
$T$T$T$T$T$T
$T$T$T$T$T$T
$T$T$T$T$T$T$T$T$T$T$T$T$T$T$T$T$T$T$T$T$T$T$T$T$T$T$T$T$T$T$T$T$T$T$T$T$T$T$T$T$T$T$T$T$T$T$T$T$T$T$T$T$T$T$T$T$T$T$T$T$T$T$T$T$T$T
$T$T
$T$T$T$T
$T$T$T$T$T$T
$T$T$T$T$T$T$T$T$T
$T$T
$T$T$T
$T$T$T
$T$T$T
$T$T$T
$T$T$T
Sprague Sub-basin303(d) Listed-DO
%U FLOW GAGE' USGS $T DEQ Water Chemistry
# NPDES
Figure 4-1. Monitoring Sites on Sprague River
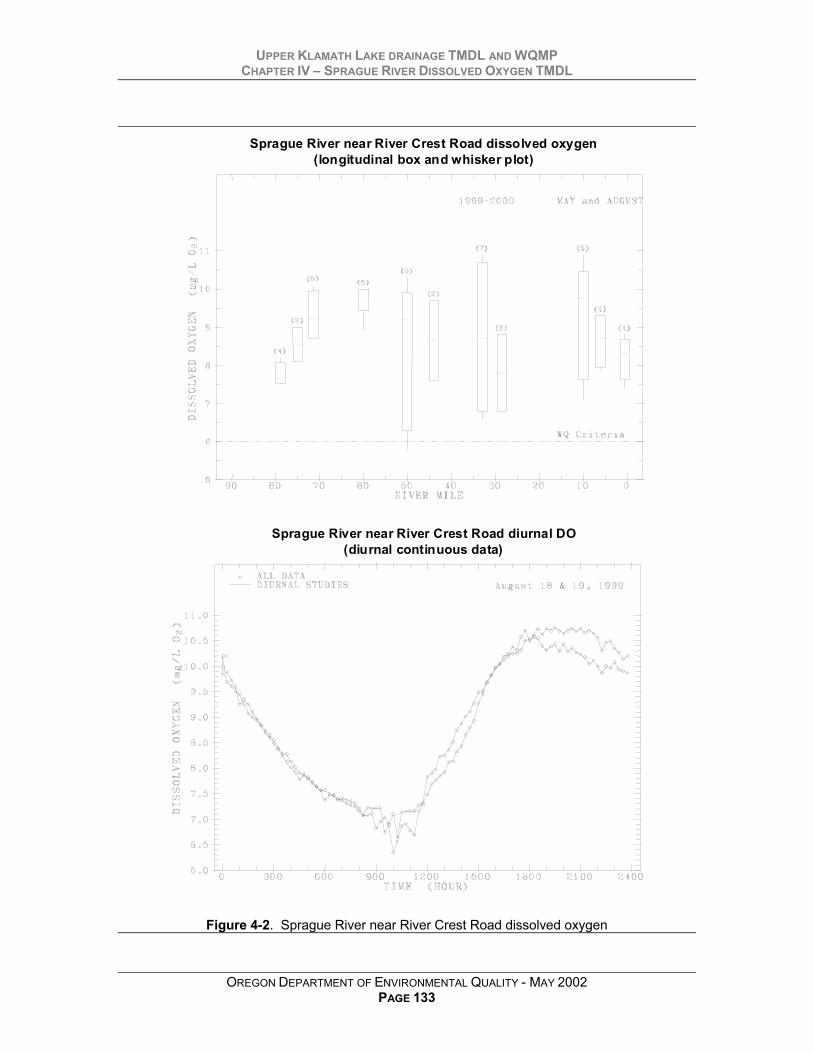
UPPER KLAMATH LAKE DRAINAGE TMDL AND WQMPCHAPTER IV – SPRAGUE RIVER DISSOLVED OXYGEN TMDL
OREGON DEPARTMENT OF ENVIRONMENTAL QUALITY - MAY 2002PAGE 133
Sprague River near River Crest Road dissolved oxygen(longitudinal box and whisker plot)
Sprague River near River Crest Road diurnal DO(diurnal continuous data)
Figure 4-2. Sprague River near River Crest Road dissolved oxygen

UPPER KLAMATH LAKE DRAINAGE TMDL AND WQMPCHAPTER IV – SPRAGUE RIVER DISSOLVED OXYGEN TMDL
OREGON DEPARTMENT OF ENVIRONMENTAL QUALITY - MAY 2002PAGE 134
Section 303(d) of the Federal Clean Water Act (1972) requires that waterbodies thatviolate water quality standards, thereby failing to fully protect beneficial uses, be identified andplaced on the state’s 303(d) list. The Sprague River, from mouth to North/South Fork (RM 0.0-79.1) has been placed on the Oregon Department of Environmental Quality’s (DEQ) 1998 303(d)list for dissolved oxygen.
Klamath Falls
Chiloquin
Figure 4-3. Sprague River 303(d) listing (dissolved oxygen)Mouth to North/South Fork
May 1 - Oct. 31

UPPER KLAMATH LAKE DRAINAGE TMDL AND WQMPCHAPTER IV – SPRAGUE RIVER DISSOLVED OXYGEN TMDL
OREGON DEPARTMENT OF ENVIRONMENTAL QUALITY - MAY 2002PAGE 135
4.2.3 Pollutant IdentificationWhile many chemical and physical processes can affect dissolved oxygen levels, this
analysis determines that water quality standards can be achieved simply by targeting pollutantloading and surrogate measures developed for stream temperature. Specifically, increased solarheating of the water column, poor channel morphology conditions and warm stream temperaturescause excessive periphyton growth. Periphyton (algal growth) mass is targeted as apollutant. The reduction of periphyton mass is targeted in the dissolved oxygen TMDL to meetwater quality standards.
4.3 EXISTING SOURCES - CWA §303(D)(1)
4.3.1 Source DescriptionsDissolved oxygen in water bodies may fall below healthy levels for a number of reasons
including carbonaceous biochemical oxygen demand (CBOD) within the water column,nitrogenous biochemical oxygen demand (NBOD, also known as nitrification), algal respiration,zooplankton respiration and sediment oxygen demand (SOD). Increased water temperatures willalso reduce the amount of oxygen in water by decreasing its solubility and increasing the rates ofboth nitrification and the decay of organic matter. More detailed discussions of the relationshipsbetween dissolved oxygen and pollutants are included in the discussion below.
Causes of DO depletion in streams and lakes are many and depend widely on the localecosystem, background history and climate. Depth of streambed, sediments, algal populations,and phosphorus, and turbidity can impact levels of DO. DO fluctuation is directly related to thechanges in either one of these parameters, either individually or in combination.
4.3.1.1 Sediment Oxygen Demand (SOD)Sediments in waterbodies are important to riverine systems. However, too much
sediment can increase levels of other pollutant parameters. When solids that contain organicssettle to the bottom of a stream they may decompose anaerobically or aerobically, depending onconditions. The oxygen consumed in aerobic decomposition of these sediments is calledsediment oxygen demand (SOD) and represents another dissolved oxygen sink for a stream.The SOD may differ from both water column CBOD and nitrification in that SOD will remain a DOsink for a much longer period after the pollution discharge ceases (e.g., organic-containingsediment deposited as a result of rain-driven runoff may remain a problem long after the rainevent has passed).
Sediment oxygen demand (SOD) is the oxygen demand exerted by the aerobicdecomposition of sediments on the stream bottom. The Department is not aware of any SODdata being collected from the Sprague River. SOD is not considered to be a significantcontributor to oxygen depletion in the Sprague River. This assumption is based on modelcalibration. However, SOD data would be very useful for any future DO modeling and potentialTMDL refinement.
4.3.1.2 AmmoniaWhen nitrogen in the form of ammonia is introduced to natural waters, the ammonia may
“consume” dissolved oxygen as nitrifying bacteria converts the ammonia into nitrite and nitrate.

UPPER KLAMATH LAKE DRAINAGE TMDL AND WQMPCHAPTER IV – SPRAGUE RIVER DISSOLVED OXYGEN TMDL
OREGON DEPARTMENT OF ENVIRONMENTAL QUALITY - MAY 2002PAGE 136
The process of ammonia being transformed into nitrite and nitrate is called nitrification. Theconsumption of oxygen during this process is called nitrogenous biochemical oxygen demand(NBOD). To what extent this process occurs, and how much oxygen is consumed, is related toseveral factors, including residence time, water temperature, ammonia concentration in the water,and the presence of nitrifying bacteria. It is because of this somewhat complex relationship that acomputer model was used to determine the amount of ammonia that can be attenuated by theriver and still meet the DO standards.
4.3.1.3 CBODWater column carbonaceous biochemical oxygen demand (CBOD) is the oxygen
consumed by the decomposition of organic matter in water. The sources of the organic mattercan be varied, either resulting from natural sources such as direct deposition of leaf litter or fromanthropogenic sources such as polluted runoff.
4.3.1.4 Algal GrowthIn many waterbodies, dissolved oxygen concentrations may be violated because of
excessive algal growth. Excessive algae concentrations can cause large diurnal fluctuations inDO. Such streams generally exhibit supersaturated dissolved oxygen concentrations during theday and low DO concentrations at night. The State of Oregon has designated an action level of15 ug/L concentration of chlorophyll a (a measure of suspended algal content) to indicate whenalgal growth may be a problem. Chlorophyll a action level concentrations are not exceeded in theSprague River. However, periphyton growth (attached algae) is a concern due to the diurnal DOfluctuations resulting from photosynthesis and respiration.
4.3.1.5 TemperatureTemperature has a significant impact on the dissolved oxygen in a stream in two ways.
The first is that with increasing temperatures the amount of oxygen that can remain dissolved inwater decreases. The second is that, in general, all of the dissolved oxygen sinks listed aboveincrease their oxygen consumption as temperature increases.
4.3.1.6 OtherWhile there are other factors such as stream flow that may influence the dissolved
oxygen in the tributaries, these are not considered pollutants (or the result of pollutants) andtherefore are not analyzed within the TMDL context for allocations.
4.3.2 Analysis - Water Quality ModelingA dynamic water quality model (dynamic biological component, steady state hydraulics)
was developed for the Sprague River in order to evaluate the sensitivity of diurnal dissolvedoxygen concentrations to temperature. The model was developed using the modeling frameworkQUAL2E (USEPA 1987). QUAL2E is supported by the U.S. Environmental Protection Agencyand has been extensively applied throughout North America. Channel geometry, velocity, flowand temperature inputs to the model were extracted from a Heat Source temperature model ofthe Sprague River developed by DEQ.
4.3.2.1 Model Limitations/AssumptionsQual2e models phytoplankton (suspended algae) rather than periphyton (attached
algae). Periphyton is the algae of concern in the Sprague River. The assumption was made thatthe biological processes (photosynthesis and respiration) in Qual2e could simulate the effect ofperiphyton growth, provided that during the dynamic simulation the algal concentrations in thecritical reach were similar during the early morning and late afternoon time periods. Therefore,

UPPER KLAMATH LAKE DRAINAGE TMDL AND WQMPCHAPTER IV – SPRAGUE RIVER DISSOLVED OXYGEN TMDL
OREGON DEPARTMENT OF ENVIRONMENTAL QUALITY - MAY 2002PAGE 137
boundary and inflow algal concentrations were adjusted during model calibration to result inmorning and afternoon algal biomass being roughly equivalent.
Qual2e can dynamically simulate temperature and the biological component; the model,however, is limited to steady-state hydraulics. Inflow into the reaches resulting from springs andtributaries was accounted for in the model, utilizing information from the Heat Source model.
4.3.2.2 Model CalibrationThe model was calibrated to daily minimum and maximum dissolved oxygen data, as well
as instream temperature, biochemical oxygen demand, and organic phosphorus. The followingplot demonstrates the DO calibration. Descriptive statistics for model calibration parameters arepresented in Table 4-3.
Table 4-3. DO Model Calibration Parameter Statistics
August, 1999-2000 Orthophosphorus(mg/l)
InorganicNitrogen
(mg/l)
BiochemicalOxygen Demand
(mg/l)Number of data 48 49 49
Mean (95% Confidence Limit) 0.0429 0.0266 0.8224Upper Confidence Limit 0.0517 0.0296 0.9800Lower Confidence Limit 0.0341 0.0236 0.6649Standard Error Mean 0.0044 0.0015 0.0784Standard Deviation 0.0302 0.0105 0.5486
Coefficient of Variation 0.7043 0.3935 0.6670Coefficient of Skewness 6.1225 1.7011 2.0860
n-Kurtosis 40.6239 5.1785 5.0595Geometric Mean 0.0392 0.0249 0.6956
Maximum 0.2400 0.0704 2.9000Median 0.0390 0.0250 0.7000
Minimum 0.0190 0.0150 0.200075th Percentile 0.0440 0.0350 0.950025th Percentile 0.0350 0.0202 0.5000
6.3
10.6
6.3
10.2
0.0
2.0
4.0
6.0
8.0
10.0
12.0
Daily Minimum Daily Maximum
Diss
olve
d O
xyge
n (m
g/L
O 2)
Observed DO (8/18/99)Predicted DO
Figure 4-4. Sprague River diurnal dissolved oxygen (measured vs. modeled)

UPPER KLAMATH LAKE DRAINAGE TMDL AND WQMPCHAPTER IV – SPRAGUE RIVER DISSOLVED OXYGEN TMDL
OREGON DEPARTMENT OF ENVIRONMENTAL QUALITY - MAY 2002PAGE 138
4.3.2.4 Model Simulation – Sensitivity to Temperature ReductionNutrients to support periphyton growth are relatively low in the Sprague River, and should
be reduced further as a result implementation of the lake nutrient TMDL. Biochemical oxygendemand is also relatively low. Therefore, the emphasis on achieving and maintaining thedissolved oxygen standard is on the benefits from reducing the temperature effect on periphytongrowth through instream temperature reduction. Following are descriptive statistics of SpragueRiver orthophosphorus, total inorganic nitrogen, and biochemical oxygen demand data collectedby DEQ:
A simulation was performed to evaluate the impact on DO of the temperature reductionsexpected from the temperature TMDL system potential shade scenario. The results of the DOmodel simulation with system potential stream temperatures, potential solar heat loading andimprovements in channel morphology are presented in Figure 4.5.
6.4
9.9
0.0
2.0
4.0
6.0
8.0
10.0
12.0
Daily Minimum Daily Maximum
Dis
solv
ed O
xyge
n (m
g/L
O2)
Predicted DO at SitePotential Temperature
Figure 4-5. DO model simulation output with site potential temperature
4.4 LOAD ALLOCATIONS – 40 CFR 130.2(G) & (H)It was determined by the DO modeling of the Sprague River that achieving the load
allocations established for temperature will reduce periphyton growth and lead to the attainmentof the water quality standards for DO.
Allocations for Dissolve Oxygen are the same as those for stream temperature:
• Section 3.6 Allocations - 40 CFR 130.2(g) and (h)
• Section 3.7 Surrogate Measure - 40 CFR 130.2(I)

UPPER KLAMATH LAKE DRAINAGE TMDL AND WQMPCHAPTER IV – SPRAGUE RIVER DISSOLVED OXYGEN TMDL
OREGON DEPARTMENT OF ENVIRONMENTAL QUALITY - MAY 2002PAGE 139
4.5 MARGINS OF SAFETY – CWA §303(D)(1)The following are margins of safety are explicit and implicit in the determination of the DO TMDL:
• The DO criteria applicable to this TMDL is an absolute minimum dissolved oxygenconcentration of 6.0 mg/L. The dynamic model predicted that during summer low flow(critical) conditions the absolute minimum DO will be 6.4 mg/L. Targeting 6.4 mg/L DOprovides an explicit 0.4 mg/L margin of safety.
4.6 SEASONAL VARIATION – CWA §303(D)(1)There has been limited DO data collected on the Sprague River. Most of the data has
been collected during the summer months when maximum DO deficits occur as a result ofconditions conducive to excessive periphyton growth. Such conditions include the increasedsteam temperature. As stated earlier, temperature has a significant impact on the dissolvedoxygen in a stream in two ways. With increasing temperatures, the amount of oxygen that canremain dissolved in water decreases. The second is that, in general, dissolved oxygen sinksincrease their oxygen consumption as temperature increases. Therefore, the critical condition forDO is during summer conditions. During cooler, higher flow conditions, DO concentrations willgenerally be much higher than during summer low flow, which is the critical condition addressedin this TMDL.

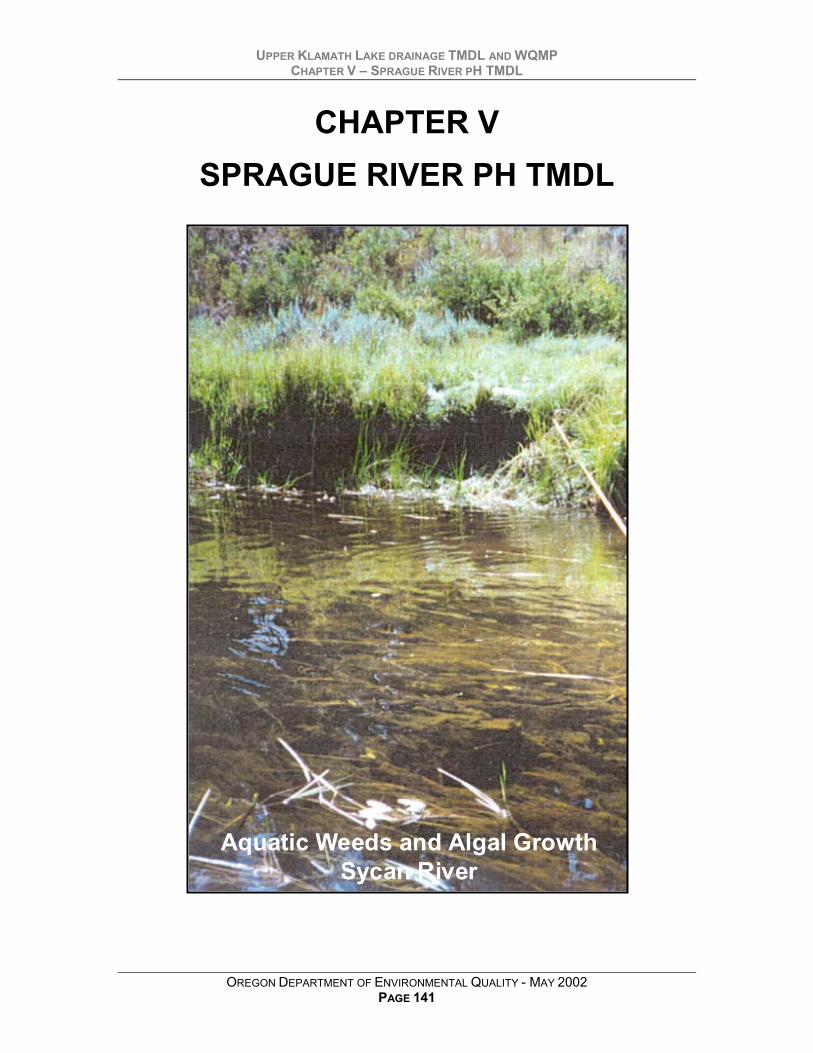
UPPER KLAMATH LAKE DRAINAGE TMDL AND WQMPCHAPTER V – SPRAGUE RIVER PH TMDL
OREGON DEPARTMENT OF ENVIRONMENTAL QUALITY - MAY 2002PAGE 141
CHAPTER VSPRAGUE RIVER PH TMDL
Aquatic Weeds and Algal GrowthSycan River
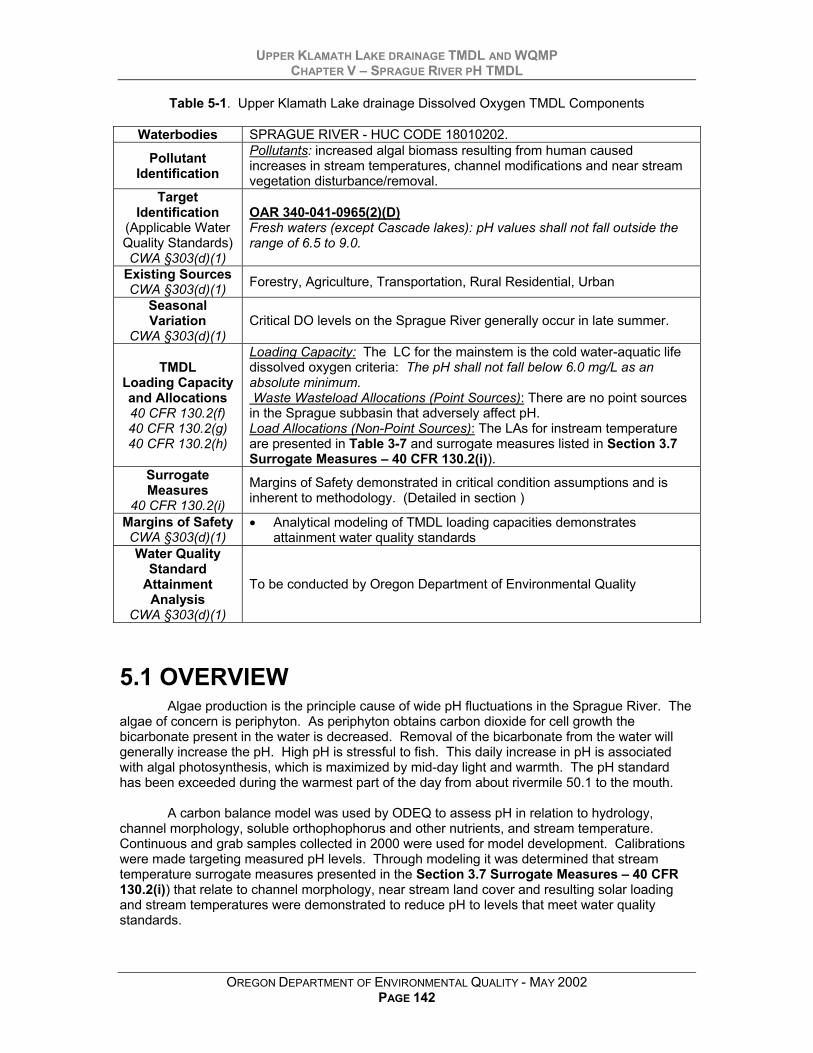
UPPER KLAMATH LAKE DRAINAGE TMDL AND WQMPCHAPTER V – SPRAGUE RIVER PH TMDL
OREGON DEPARTMENT OF ENVIRONMENTAL QUALITY - MAY 2002PAGE 142
Table 5-1. Upper Klamath Lake drainage Dissolved Oxygen TMDL Components
Waterbodies SPRAGUE RIVER - HUC CODE 18010202.
PollutantIdentification
Pollutants: increased algal biomass resulting from human causedincreases in stream temperatures, channel modifications and near streamvegetation disturbance/removal.
TargetIdentification
(Applicable WaterQuality Standards)CWA §303(d)(1)
OAR 340-041-0965(2)(D)Fresh waters (except Cascade lakes): pH values shall not fall outside therange of 6.5 to 9.0.
Existing SourcesCWA §303(d)(1) Forestry, Agriculture, Transportation, Rural Residential, Urban
SeasonalVariation
CWA §303(d)(1)Critical DO levels on the Sprague River generally occur in late summer.
TMDLLoading Capacityand Allocations40 CFR 130.2(f)40 CFR 130.2(g)40 CFR 130.2(h)
Loading Capacity: The LC for the mainstem is the cold water-aquatic lifedissolved oxygen criteria: The pH shall not fall below 6.0 mg/L as anabsolute minimum. Waste Wasteload Allocations (Point Sources): There are no point sourcesin the Sprague subbasin that adversely affect pH.Load Allocations (Non-Point Sources): The LAs for instream temperatureare presented in Table 3-7 and surrogate measures listed in Section 3.7Surrogate Measures – 40 CFR 130.2(i)).
SurrogateMeasures
40 CFR 130.2(i)
Margins of Safety demonstrated in critical condition assumptions and isinherent to methodology. (Detailed in section )
Margins of SafetyCWA §303(d)(1)
• Analytical modeling of TMDL loading capacities demonstratesattainment water quality standards
Water QualityStandard
AttainmentAnalysis
CWA §303(d)(1)
To be conducted by Oregon Department of Environmental Quality
5.1 OVERVIEWAlgae production is the principle cause of wide pH fluctuations in the Sprague River. The
algae of concern is periphyton. As periphyton obtains carbon dioxide for cell growth thebicarbonate present in the water is decreased. Removal of the bicarbonate from the water willgenerally increase the pH. High pH is stressful to fish. This daily increase in pH is associatedwith algal photosynthesis, which is maximized by mid-day light and warmth. The pH standardhas been exceeded during the warmest part of the day from about rivermile 50.1 to the mouth.
A carbon balance model was used by ODEQ to assess pH in relation to hydrology,channel morphology, soluble orthophophorus and other nutrients, and stream temperature.Continuous and grab samples collected in 2000 were used for model development. Calibrationswere made targeting measured pH levels. Through modeling it was determined that streamtemperature surrogate measures presented in the Section 3.7 Surrogate Measures – 40 CFR130.2(i)) that relate to channel morphology, near stream land cover and resulting solar loadingand stream temperatures were demonstrated to reduce pH to levels that meet water qualitystandards.

UPPER KLAMATH LAKE DRAINAGE TMDL AND WQMPCHAPTER V – SPRAGUE RIVER PH TMDL
OREGON DEPARTMENT OF ENVIRONMENTAL QUALITY - MAY 2002PAGE 143
5.2 TARGET IDENTIFICATION – CWA §303(D)(1)
5.2.1 Sensitive Beneficial Use IdentificationBeneficial uses affected by aquatic weeds, algae and pH include water contact
recreation, aesthetics, and fish-related uses. Excessive algal growth can increase pH in the riverto levels that are stressful to fish. The Sprague River provides habitat for redband trout.Redband trout are the most sensitive beneficial use in the Sprague River Subbasin. Discussionof the distribution of redband trout can be found in Section 1.3.5 Fisheries, Figure 1-10.
5.2.2 Water Quality Standard Identification
5.2.2.1 pH Water Quality StandardThe following is the State of Oregon standard that is applicable to pH, in the Klamath
Basin (OAR 340-41-965(2)(d):
• Fresh waters (except Cascade lakes): pH values shall not fall outside the range of 6.5 to 9.0.
5.2.2.2 Deviation from Water Quality Standard and Critical ConditionThe Sprague River is listed on the 1998 §303(d) list for pH from the mouth to thye
North/South Fork confluence for the summer period. Oregon’s §303(d) list and its supportingdata references can be publicly accessed through the Oregon Department of EnvironmentalQuality web page at the following URL: http://www.deq.state.or.us.
Observed total phosphorus, pH, and temperature data, all factors that influenceperiphyton growth, are reviewed below. Much of the reviewed data were used as input to a pH(carbon balance) model used to determine the TMDL.
Phosphorus
An intensive survey was conducted by DEQ on August 16 – 20, 1999. Orthophosphorus(soluble phosphorus), the most readily available form for periphyton growth, was collected atseveral sites on the Sprague River. Table 5-2 lists the data collected during the survey that wasused as pH model input:
Table 5-2. Sprague River Orthophosphorus (August 16-20, 1999)
MONITORING LOCATION Orthophosphorus (mg/L)N. Fork Sprague @ Cambell Rd. (RM 1.5) 0.049S. Fork Sprague @ Ivory Pine (RM 1.0) 0.035Sprague R. near River Crest Rd. (RM 50.1) 0.040Sprague R. nr. Williamson Rd. (RM 10.0) 0.038Sprague R. @ Chiloquin Ridge Rd. (RM 6.0) 0.033
As can be seen in Table 5-2, the orthophosphorus (OP) steadily decreases from theforks to the mouth. This is evidence that there is periphyton uptake of OP which is decreasingthe concentration as the periphyton grow. In order to limit the growth of periphyton, it isrecommended in the literature that one of the nutrients be limited to the half-saturation constants.

UPPER KLAMATH LAKE DRAINAGE TMDL AND WQMPCHAPTER V – SPRAGUE RIVER PH TMDL
OREGON DEPARTMENT OF ENVIRONMENTAL QUALITY - MAY 2002PAGE 144
Literature values for phosphorus half-saturation constants range from 0.001 to 0.005 mg/L(Thomann and Mueller, 1987). This will result in a periphyton productivity rate that is no greaterthan 50 percent of the maximum rate. It would be highly unlikely for there to be any algal growthlimitation for OP because concentrations observed in the North and South forks of the SpragueRiver are 7 to 10 times higher than the high end of this range, or 0.035 to 0.049 mg/L. There isapparently sufficient instream OP in the forks to support periphyton growth downstream to theSprague River at rivermile 50.1 where pH violations occur.
Figure 5-1 presents pH data collected by DEQ during May and August, 1999-2000. Thelongitudinal boxes represent minimum, maximum, upper and lower quartiles, and medianobserved pH values. The observed pH begins to exceed the 9.0 SU criteria at rivermile 50.1.The increase in pH coincides with the increase in stream temperature from the confluence of theforks to rivermile 50.1.
Figure 5-1. Sprague River Longitudinal pH (Box and Whiskers Plot)
5.2.3 Pollutant IdentificationInstream temperature is the pollutant that is the focus of this pH TMDL. Nutrients,
pH and temperature data indicate that reducing instream temperature is the key to reducingexcessive periphyton growth and pH fluctuations in the river. Since phosphorus concentrationsare above what could be considered limiting in the upper reaches of the Sprague River, theredoes not appear to be adequate opportunity to reduce phosphorus loads to have a significantimpact on either periphyton growth or pH.
A model (discussed below) was developed to further investigate the relationship betweentemperature and pH. The model corroborates the association seen in the pH and temperaturedata collected at rivermile 50.1. The model predicts that the pH standard will be achievedthrough the implementation of the system potential temperature TMDL allocations.

UPPER KLAMATH LAKE DRAINAGE TMDL AND WQMPCHAPTER V – SPRAGUE RIVER PH TMDL
OREGON DEPARTMENT OF ENVIRONMENTAL QUALITY - MAY 2002PAGE 145
5.3 EXISTING SOURCES - CWA §303(D)(1)
5.3.1 Data Review
A relationship between pH and stream temperature can be developed. Figure 5-2 is aregression analysis that illustrates the relationship between pH and temperature at rivermile 50.1.Data plotted were collected by DEQ using a continuous (every 15 minutes) pH, DO andtemperature instrument.
Figure 5-2. Regression Analysis, pH vs. Temperature at RM 50.1
The above plot represents data collected from dawn to dusk for a single day. The pH isrelatively low during the early morning hours when stream temperature is at its lowest; the pHincreases to above the 9.0 SU pH standard in the afternoon when water temperature warms. Theregression analysis ignores other factors, such as the effect that nutrients and light have on algalgrowth, and subsequently pH. Nonetheless, it illustrates an association between pH andinstream temperature.
The increase in Sprague River temperature coincides with the increase in periphytongrowth and pH. It appears from this data review that the key to reducing periphyton growth andmeeting the goal of instream pH below 9.0 SU is to reduce instream temperature.

UPPER KLAMATH LAKE DRAINAGE TMDL AND WQMPCHAPTER V – SPRAGUE RIVER PH TMDL
OREGON DEPARTMENT OF ENVIRONMENTAL QUALITY - MAY 2002PAGE 146
Figure 5-3 represents the theoretical relationship between instream temperature andalgal growth. The algal growth rate increases significantly as the instream temperatureincreases.
Figure 5-3. The Theoretical Relationship between Instream Temperature and Algal Growth
5.3.2 Photosynthesis and the Carbonate Buffering SystemThe following sections discuss the theory and application of the pH model used to
determine the periphyton loading capacities.
Periphyton is important because of its ability to photosynthesize. The essence of thephotosynthetic process centers about chlorophyll containing plants that can utilize radiant energyfrom the sun, convert water and carbon dioxide into glucose, and release oxygen. Thephotosynthesis reaction can be written as (Thomann and Mueller, 1987):
2612622 O 6 +OHC 06H + CO 6 esisphotosynth →
(Equation 5-1)
Periphyton obtains energy from the sun for this daytime process. Instream dissolvedoxygen is produced by the removal of hydrogen atoms from the water. The photosynthesisprocess consumes dissolved forms of carbon during the production of plant cells. Periphytonrequires oxygen for respiration, which can be considered to proceed throughout the day and night
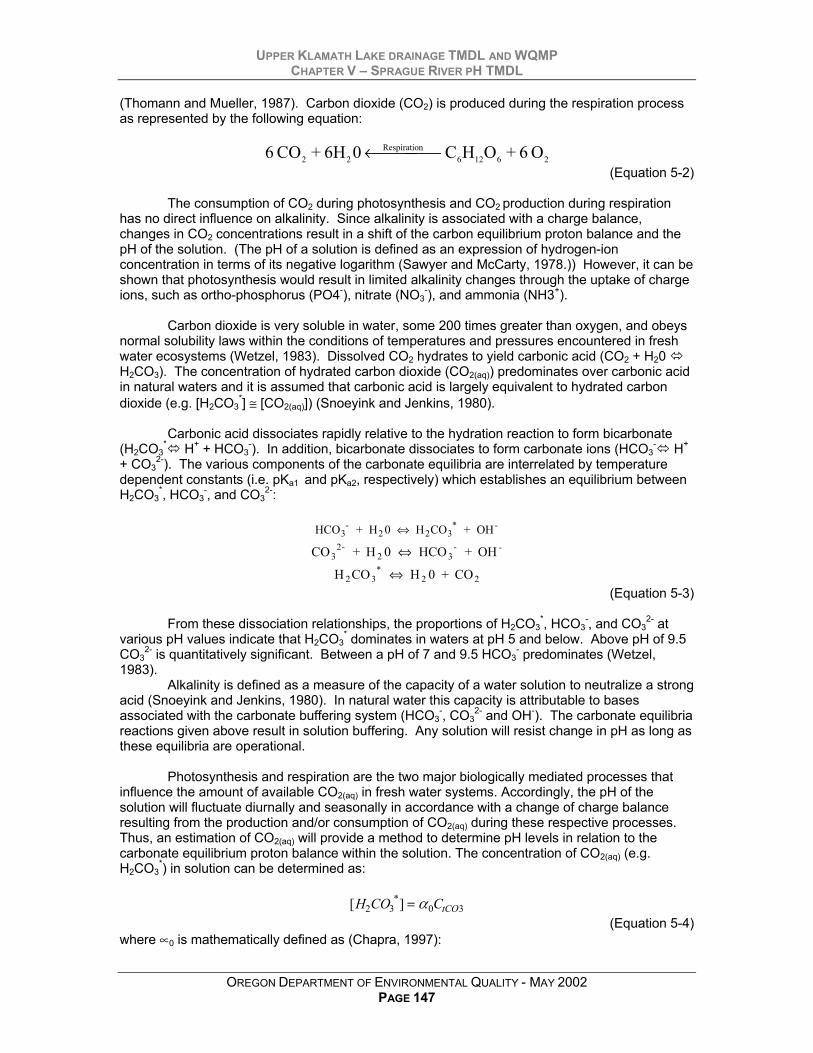
UPPER KLAMATH LAKE DRAINAGE TMDL AND WQMPCHAPTER V – SPRAGUE RIVER PH TMDL
OREGON DEPARTMENT OF ENVIRONMENTAL QUALITY - MAY 2002PAGE 147
(Thomann and Mueller, 1987). Carbon dioxide (CO2) is produced during the respiration processas represented by the following equation:
26126nRespiratio
22 O 6 +OHC 06H + CO 6 ←(Equation 5-2)
The consumption of CO2 during photosynthesis and CO2 production during respirationhas no direct influence on alkalinity. Since alkalinity is associated with a charge balance,changes in CO2 concentrations result in a shift of the carbon equilibrium proton balance and thepH of the solution. (The pH of a solution is defined as an expression of hydrogen-ionconcentration in terms of its negative logarithm (Sawyer and McCarty, 1978.)) However, it can beshown that photosynthesis would result in limited alkalinity changes through the uptake of chargeions, such as ortho-phosphorus (PO4-), nitrate (NO3
-), and ammonia (NH3+).
Carbon dioxide is very soluble in water, some 200 times greater than oxygen, and obeysnormal solubility laws within the conditions of temperatures and pressures encountered in freshwater ecosystems (Wetzel, 1983). Dissolved CO2 hydrates to yield carbonic acid (CO2 + H20 H2CO3). The concentration of hydrated carbon dioxide (CO2(aq)) predominates over carbonic acidin natural waters and it is assumed that carbonic acid is largely equivalent to hydrated carbondioxide (e.g. [H2CO3
*] ≅ [CO2(aq)]) (Snoeyink and Jenkins, 1980).
Carbonic acid dissociates rapidly relative to the hydration reaction to form bicarbonate(H2CO3
* H+ + HCO3-). In addition, bicarbonate dissociates to form carbonate ions (HCO3
- H+
+ CO32-). The various components of the carbonate equilibria are interrelated by temperature
dependent constants (i.e. pKa1 and pKa2, respectively) which establishes an equilibrium betweenH2CO3
*, HCO3-, and CO3
2-:
HCO + H 0 H CO + OH3-
2 2 3* -⇔
CO + H 0 HCO + OH32-
2 3- -⇔
H CO H 0 + CO2 3*
2 2⇔(Equation 5-3)
From these dissociation relationships, the proportions of H2CO3*, HCO3
-, and CO32- at
various pH values indicate that H2CO3* dominates in waters at pH 5 and below. Above pH of 9.5
CO32- is quantitatively significant. Between a pH of 7 and 9.5 HCO3
- predominates (Wetzel,1983).
Alkalinity is defined as a measure of the capacity of a water solution to neutralize a strongacid (Snoeyink and Jenkins, 1980). In natural water this capacity is attributable to basesassociated with the carbonate buffering system (HCO3
-, CO32- and OH-). The carbonate equilibria
reactions given above result in solution buffering. Any solution will resist change in pH as long asthese equilibria are operational.
Photosynthesis and respiration are the two major biologically mediated processes thatinfluence the amount of available CO2(aq) in fresh water systems. Accordingly, the pH of thesolution will fluctuate diurnally and seasonally in accordance with a change of charge balanceresulting from the production and/or consumption of CO2(aq) during these respective processes.Thus, an estimation of CO2(aq) will provide a method to determine pH levels in relation to thecarbonate equilibrium proton balance within the solution. The concentration of CO2(aq) (e.g.H2CO3
*) in solution can be determined as:
[ ]*H CO CtCO2 3 0 3= α(Equation 5-4)
where ∝0 is mathematically defined as (Chapra, 1997):

UPPER KLAMATH LAKE DRAINAGE TMDL AND WQMPCHAPTER V – SPRAGUE RIVER PH TMDL
OREGON DEPARTMENT OF ENVIRONMENTAL QUALITY - MAY 2002PAGE 148
α 0
2
2 1 1 2=
+ +
+
+ +[ ]
[ ] [ ]H
H H K K Ka a a
(Equation 5-5)
where Ka1 and Ka2 are equilibrium constants for carbonic acid and bicarbonate ions, respectively,and where the amount of total inorganic carbon (CtCO3) in natural waters is defined as:
CAlkalinity Kw
HH
tCO31 22
=− +
+
++
[ ][ ]
( )α α(Equation 5-6)
The “Alkalinity” component of Equation 6 is expressed in milliequivalents (meq). The“Kw” term is a temperature dependent equilibrium constant for water and can be defined as:
K H OHw = + −[ ][ ](Equation 5-7)
The“∝1” and “∝2” terms in Equation 6 are mathematical definitions of ionization fractions(Chapra, 1997):
α 11
21 1 2
=+ +
+
+ +
[ ][ ] [ ]
H kH H K K K
a
a a a
(Equation 5-8)
α 21 2
21 1 2
=+ ++ +
K KH H K K K
a a
a a a[ ] [ ](Equation 5-9)
An increase in instream CO2 results in a lower pH. Conversely, a decrease in CO2results in a higher pH. The consumption of CO2 during periphyton photosynthesis causeselevated pH levels between the Sprague River at rivermile 71.5, 50.1 and 6.0 monitoring sites.
5.3.3 pH ModelThe impact of algal production on pH can be determined by a mass balance of the
carbonate species. Assuming that the consumption of carbon is consistent along the riverbottom, the change in total carbonate species can be estimated as the amount of CO2 (aq) plus theamount brought in by aeration and production, minus the amount of carbon dioxide consumedover time:
C C C C e e PKCO aq T CO aq E CO aq E CO aq T
ka T ka T aCO
aCO
CO CO2 2 2 22
2
2 21( ) ( ) ( ) ( )({[ ] } {[ ][ ]})= − − + −− −
(Equation 5-10)where:
CCO2(aq) = Dissolved CO2 (e.g. [CO2(aq)]≈ [H2CO3*]) (mmoles/l); and
E = Equilibrium Condition @ Time = 0;T = Time (day);KaCO2 = Inorganic carbon gas transfer rate from the atmosphere (day-1);PaCO2 = Periphyton consumption of CO2 (mmoles CO2/mg O2/l * day).
UPPER KLAMATH LAKE DRAINAGE TMDL AND WQMPCHAPTER V – SPRAGUE RIVER PH TMDL
OREGON DEPARTMENT OF ENVIRONMENTAL QUALITY - MAY 2002PAGE 149
Periphyton oxygen production is developed through an analytical formula developed byDi Torro (1981) that relates the observed range of diurnal dissolved oxygen (∆DO), depth (H), andaeration coefficient (KaO2) to a measure of maximum potential benthic oxygen production (PaO2):
P Ka ee
HaOO
KaO
Ka DOO
22
2
0 5 205 1
1 2=
−−
−
−( . [ ][ ]
)( )( )( . ) ∆
(Equation 5-11)
Equation 11 is a method to calculate the amount of oxygen produced by periphyton perbottom area normalized by depth (mg/l-day). The stoichiometric equivalent of carbon consumedduring the photosynthetic process was determined by a simple mass balance relationship whichdefines the amount of oxygen produced during photosynthesis to the amount of carbonconsumed (Equation 1). Specifically, PaO2 (Equation 11) was converted to carbon consumedduring the photosynthetic process (Chapra, 1997) and incorporated into the model:
Oxygen to Carbon Coversion = 6 mmole CO x 32 mgO
= 0.03125 mmole COmgO
2
2
2
26(Equation 5-12)
Equation 10 is analogous to classical dissolved oxygen balances, with the exception thatonly the free carbon ([CO2(aq)]≈ [H2CO3
*]) portion of the total carbonate concentration is involvedin the aeration equilibrium calculations. Neglecting the influence of buffers other than thecarbonate system, and assuming that total alkalinity does not change, the pH can then beestimated from the application of these equations. Changes in free carbon (e.g. [CO2(aq)] ≈[H2CO3
*]) and total carbonate species (e.g. [CtCO3]) due to photosynthesis and respiration werecalculated through the application of Equation 10. At the range of pH found in the Sprague River(approximately 6.5-9.2), it can be assumed that most of the carbonate buffers are in the form ofbicarbonate HCO3
- (e.g. CtCO3 ≈ HCO3-). The temperature dependent equilibrium constant for
bicarbonate (Ka1) is defined as:
K H HCOH CO
a13
2 3=
+ −[ ][ ][ ]*
(Equation 5-13)
Through substitution and rearrangement, pH can be defined as the negative logarithm of [H+]:
[ ][ ]
[ ]( )H
K COC COA aq
t
+ = 1 2
3
(Equation 5-14)
where [CtCO3] and [CO2(aq)] are determined through the application of Equation 10.
The carbon balance presented in Equation 10 is expressed in terms of a deficit, and isdefined as the difference between saturation and existing concentrations. The carbon deficit willincrease due to carbon uptake from periphyton and decrease from gas exchange (Chapra, 1997).The carbon equilibrium level in water is defined as saturation, at which point no net diffusionexchange of carbon between air and the water will occur. The carbon exchange rate between airand water depends on both the differences between existing carbon concentrations andsaturation, as well as water turbulence. For example, carbon diffusion rates will increase at agreater carbon deficit and water turbulence levels. This process is similar to re-aeration instreams.

UPPER KLAMATH LAKE DRAINAGE TMDL AND WQMPCHAPTER V – SPRAGUE RIVER PH TMDL
OREGON DEPARTMENT OF ENVIRONMENTAL QUALITY - MAY 2002PAGE 150
It is assumed that the dominant carbon balance processes are photosynthetic uptake (i.e.periphyton uptake) and carbon re-areation (i.e. gas exchange). By assuming that the uptake ofcarbon and equilibrium reactions occur at a greater rate than replacement of carbon throughaeration, the response of pH to reduced carbon concentration can be modeled. Accordingly, thecarbon balance accounts for the current deficit, the amount of carbon brought in through aerationdue to that deficit, the amount of carbon lost due to photosynthesis and the amount of carbonbrought in through aeration due to the increase deficit resulting from photosynthesis.
The impact of algal production on pH was determined by solving the inorganic carbonmass balance up to a pH of 9.5. Above 9.5, the solution was assumed to be simply greater than9.5 in order to simplify the calculations (e.g. available inorganic carbon is significantly curtailed atpH values equal or above 9.5.).
5.3.4 Application of the pH Model
5.3.4.1 Model Time StepA simple steady state analysis does not provide information on how effective nutrient
control may be downstream of the nutrient source because uptake from benthic algae reducesthe available nutrient supply. Accordingly, a time dependent solution of the inorganic carbonbalance was used to assess the potential influence of diurnal pattern of photosynthetic activity. Atime dependent determination of total carbonate (CtCO3) and hydrated carbon dioxide (CO2(aq))provided a method to estimate in-stream pH levels resulting from increased periphyton productionrates downstream of a source of pollution. The time step was modeled at a ten-minute interval.
5.3.4.2 CO2 and O2 Aeration RateThe carbon mass balance equations in this model are extremely sensitive to the
estimated, or assumed, ratios between aeration (KaO2) and production (Pa) rates. It can beshown that a decreased gas transfer or increased benthic consumption rate would increase therate which the CO2(aq) deficit develops, and therefore result in an increase in-stream pH. Inaddition, increased depths would decrease the relative impact from periphyton production rates(Pa). The distance or the time required to exceed water quality standards is dependent on theavailability of inorganic carbon concentrations of the water entering the section of the river, orfrom other sources such as tributaries, groundwater, or atmospheric aeration of CO2.
Aeration rates (KaO2) were estimated through the use of the Tsivoglou and Wallace(1972) formula. The formula was developed using a database of direct measurement of re-aeration:
KaO2 = 0.88US(Equation 5-15)
Where KaO2 is in day-1 at 20*C, S is the slope in feet/mile, and U is the velocity in feet persecond. More recent comparisons by Grant and Skavroneck (1980) indicated that thisexpression is most accurate for small shallow streams (Thomann and Mueller, 1987).
There is little literature describing aeration rates for inorganic carbon (KaCO2). Tsivoglou(1967) found during a series of laboratory tests that the mean ratio for dissolved oxygen (KaO2)and inorganic carbon aeration rates (KaCO2) to be 0.894 with a range of 0.845 to 0.940 and astandard deviation of 0.034. Simonsen and Harremoest (1978) determined aeration rates in ariver using a twin curve method for both carbon and oxygen and found that the KaCO2 averaged
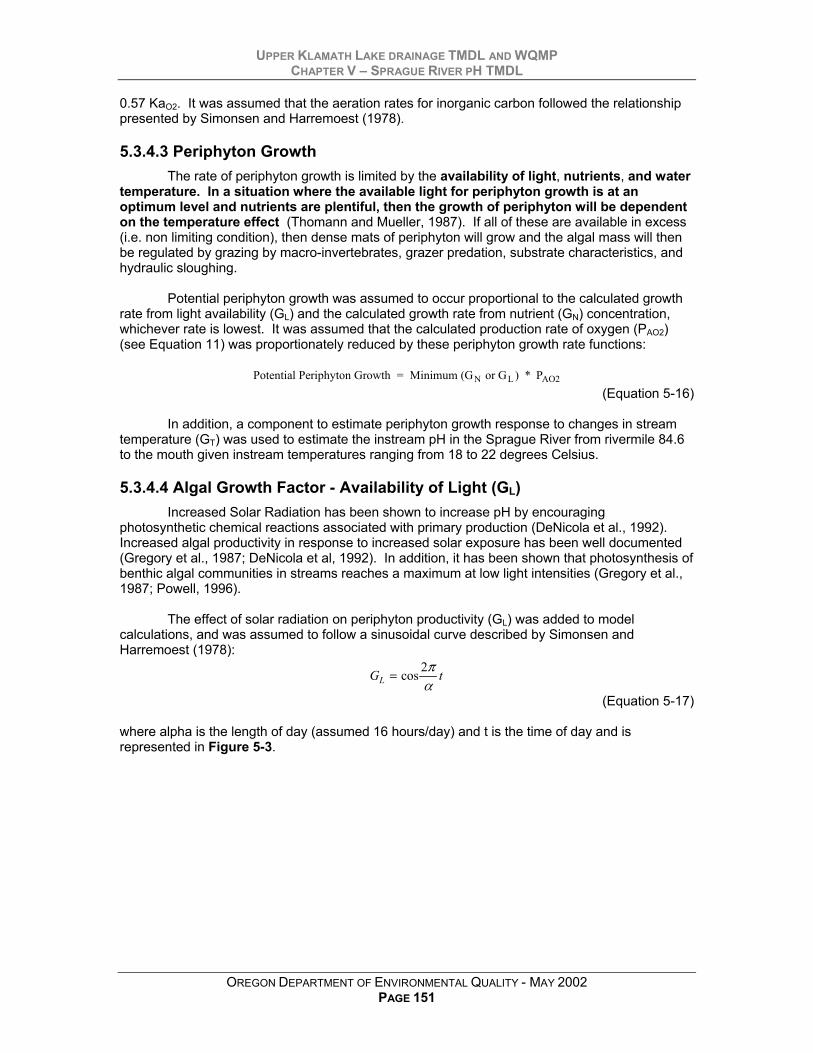
UPPER KLAMATH LAKE DRAINAGE TMDL AND WQMPCHAPTER V – SPRAGUE RIVER PH TMDL
OREGON DEPARTMENT OF ENVIRONMENTAL QUALITY - MAY 2002PAGE 151
0.57 KaO2. It was assumed that the aeration rates for inorganic carbon followed the relationshippresented by Simonsen and Harremoest (1978).
5.3.4.3 Periphyton GrowthThe rate of periphyton growth is limited by the availability of light, nutrients, and water
temperature. In a situation where the available light for periphyton growth is at anoptimum level and nutrients are plentiful, then the growth of periphyton will be dependenton the temperature effect (Thomann and Mueller, 1987). If all of these are available in excess(i.e. non limiting condition), then dense mats of periphyton will grow and the algal mass will thenbe regulated by grazing by macro-invertebrates, grazer predation, substrate characteristics, andhydraulic sloughing.
Potential periphyton growth was assumed to occur proportional to the calculated growthrate from light availability (GL) and the calculated growth rate from nutrient (GN) concentration,whichever rate is lowest. It was assumed that the calculated production rate of oxygen (PAO2)(see Equation 11) was proportionately reduced by these periphyton growth rate functions:
Potential Periphyton Growth = Minimum (G or G ) * PN L AO2
(Equation 5-16)
In addition, a component to estimate periphyton growth response to changes in streamtemperature (GT) was used to estimate the instream pH in the Sprague River from rivermile 84.6to the mouth given instream temperatures ranging from 18 to 22 degrees Celsius.
5.3.4.4 Algal Growth Factor - Availability of Light (GL)Increased Solar Radiation has been shown to increase pH by encouraging
photosynthetic chemical reactions associated with primary production (DeNicola et al., 1992).Increased algal productivity in response to increased solar exposure has been well documented(Gregory et al., 1987; DeNicola et al, 1992). In addition, it has been shown that photosynthesis ofbenthic algal communities in streams reaches a maximum at low light intensities (Gregory et al.,1987; Powell, 1996).
The effect of solar radiation on periphyton productivity (GL) was added to modelcalculations, and was assumed to follow a sinusoidal curve described by Simonsen andHarremoest (1978):
G tL = cos 2πα
(Equation 5-17)
where alpha is the length of day (assumed 16 hours/day) and t is the time of day and isrepresented in Figure 5-3.
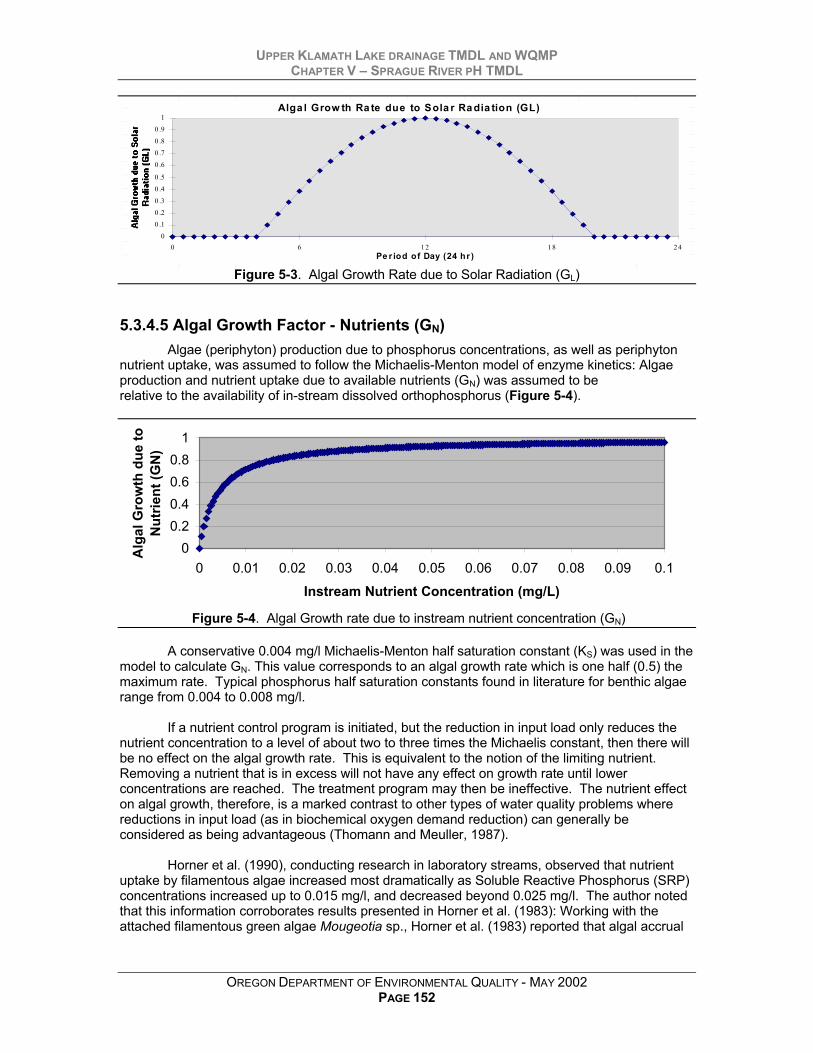
UPPER KLAMATH LAKE DRAINAGE TMDL AND WQMPCHAPTER V – SPRAGUE RIVER PH TMDL
OREGON DEPARTMENT OF ENVIRONMENTAL QUALITY - MAY 2002PAGE 152
Alga l Grow th Ra te due to Sola r Ra dia tion (GL)
0
0 .1
0 .2
0 .3
0 .4
0 .5
0 .6
0 .7
0 .8
0 .9
1
0 6 1 2 1 8 2 4Pe r iod of Day (24 hr )
Figure 5-3. Algal Growth Rate due to Solar Radiation (GL)
5.3.4.5 Algal Growth Factor - Nutrients (GN)Algae (periphyton) production due to phosphorus concentrations, as well as periphyton
nutrient uptake, was assumed to follow the Michaelis-Menton model of enzyme kinetics: Algaeproduction and nutrient uptake due to available nutrients (GN) was assumed to berelative to the availability of in-stream dissolved orthophosphorus (Figure 5-4).
00.20.40.60.8
1
0 0.01 0.02 0.03 0.04 0.05 0.06 0.07 0.08 0.09 0.1
Instream Nutrient Concentration (mg/L)
Alg
al G
row
th d
ue to
N
utrie
nt (G
N)
Figure 5-4. Algal Growth rate due to instream nutrient concentration (GN)
A conservative 0.004 mg/l Michaelis-Menton half saturation constant (KS) was used in themodel to calculate GN. This value corresponds to an algal growth rate which is one half (0.5) themaximum rate. Typical phosphorus half saturation constants found in literature for benthic algaerange from 0.004 to 0.008 mg/l.
If a nutrient control program is initiated, but the reduction in input load only reduces thenutrient concentration to a level of about two to three times the Michaelis constant, then there willbe no effect on the algal growth rate. This is equivalent to the notion of the limiting nutrient.Removing a nutrient that is in excess will not have any effect on growth rate until lowerconcentrations are reached. The treatment program may then be ineffective. The nutrient effecton algal growth, therefore, is a marked contrast to other types of water quality problems wherereductions in input load (as in biochemical oxygen demand reduction) can generally beconsidered as being advantageous (Thomann and Meuller, 1987).
Horner et al. (1990), conducting research in laboratory streams, observed that nutrientuptake by filamentous algae increased most dramatically as Soluble Reactive Phosphorus (SRP)concentrations increased up to 0.015 mg/l, and decreased beyond 0.025 mg/l. The author notedthat this information corroborates results presented in Horner et al. (1983): Working with theattached filamentous green algae Mougeotia sp., Horner et al. (1983) reported that algal accrual
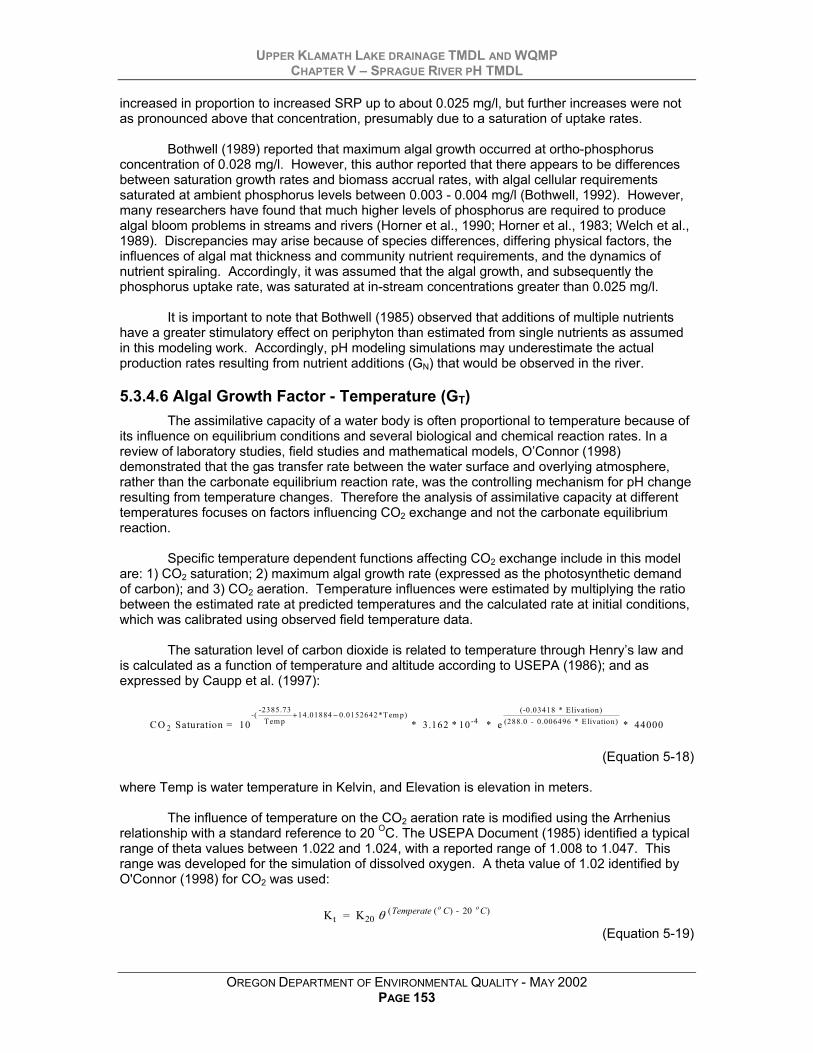
UPPER KLAMATH LAKE DRAINAGE TMDL AND WQMPCHAPTER V – SPRAGUE RIVER PH TMDL
OREGON DEPARTMENT OF ENVIRONMENTAL QUALITY - MAY 2002PAGE 153
increased in proportion to increased SRP up to about 0.025 mg/l, but further increases were notas pronounced above that concentration, presumably due to a saturation of uptake rates.
Bothwell (1989) reported that maximum algal growth occurred at ortho-phosphorusconcentration of 0.028 mg/l. However, this author reported that there appears to be differencesbetween saturation growth rates and biomass accrual rates, with algal cellular requirementssaturated at ambient phosphorus levels between 0.003 - 0.004 mg/l (Bothwell, 1992). However,many researchers have found that much higher levels of phosphorus are required to producealgal bloom problems in streams and rivers (Horner et al., 1990; Horner et al., 1983; Welch et al.,1989). Discrepancies may arise because of species differences, differing physical factors, theinfluences of algal mat thickness and community nutrient requirements, and the dynamics ofnutrient spiraling. Accordingly, it was assumed that the algal growth, and subsequently thephosphorus uptake rate, was saturated at in-stream concentrations greater than 0.025 mg/l.
It is important to note that Bothwell (1985) observed that additions of multiple nutrientshave a greater stimulatory effect on periphyton than estimated from single nutrients as assumedin this modeling work. Accordingly, pH modeling simulations may underestimate the actualproduction rates resulting from nutrient additions (GN) that would be observed in the river.
5.3.4.6 Algal Growth Factor - Temperature (GT)The assimilative capacity of a water body is often proportional to temperature because of
its influence on equilibrium conditions and several biological and chemical reaction rates. In areview of laboratory studies, field studies and mathematical models, O’Connor (1998)demonstrated that the gas transfer rate between the water surface and overlying atmosphere,rather than the carbonate equilibrium reaction rate, was the controlling mechanism for pH changeresulting from temperature changes. Therefore the analysis of assimilative capacity at differenttemperatures focuses on factors influencing CO2 exchange and not the carbonate equilibriumreaction.
Specific temperature dependent functions affecting CO2 exchange include in this modelare: 1) CO2 saturation; 2) maximum algal growth rate (expressed as the photosynthetic demandof carbon); and 3) CO2 aeration. Temperature influences were estimated by multiplying the ratiobetween the estimated rate at predicted temperatures and the calculated rate at initial conditions,which was calibrated using observed field temperature data.
The saturation level of carbon dioxide is related to temperature through Henry’s law andis calculated as a function of temperature and altitude according to USEPA (1986); and asexpressed by Caupp et al. (1997):
CO Saturation = 10 * 3.162 * 10 * e * 440002
-(-2385.73
Tem p14.01884 0.0152642*Tem p)
-4(-0.03418 * Elivation)
(288.0 - 0.006496 * Elivation)+ −
(Equation 5-18)
where Temp is water temperature in Kelvin, and Elevation is elevation in meters.
The influence of temperature on the CO2 aeration rate is modified using the Arrheniusrelationship with a standard reference to 20 OC. The USEPA Document (1985) identified a typicalrange of theta values between 1.022 and 1.024, with a reported range of 1.008 to 1.047. Thisrange was developed for the simulation of dissolved oxygen. A theta value of 1.02 identified byO'Connor (1998) for CO2 was used:
K = K t 20( ( ) - )θ Temperate C Co o20
(Equation 5-19)

UPPER KLAMATH LAKE DRAINAGE TMDL AND WQMPCHAPTER V – SPRAGUE RIVER PH TMDL
OREGON DEPARTMENT OF ENVIRONMENTAL QUALITY - MAY 2002PAGE 154
where Kt is the CO2 aeration rate at temperature (t), and K20 is the CO2 aeration rate at 20 OC.
Temperature effects on the algal growth rate were related directly to maximum productionrate (PAO2) (Equation 11). Algal growth rate, expressed as photosynthetic demand of carbon, wasadjusted for temperature using the equations presented by the USEPA (1986):
Algal Growth = (Temperature)(Temperature (C) - 20 (C))θ
(Equation 5-20)
Typical theta values were reported by USEPA to range between 1.01 and 1.2. Eppley(1972) reported a theta of 1.066. This value was used in the model.
5.3.5 Initial Buffering CapacityInitial alkalinity, pH and temperature of the Sprague River were included in the carbon
balance calculations in the model.
5.3.5.1 Algal Biomass AccrualResults obtained from the application of this model do not simulate algal biomass
accrual, but it provides a method to calculate an assumed diel production (≈ growth) pattern. Asimple procedure proposed by Horner et al. (1983) and discussed by Welch et al. (1989) providesa steady state kinetic prediction of the potential periphyton biomass accrual based on physicaland chemical characteristics of the river and their influence on algae growth rates andaccumulation. The model was originally calibrated against the growth of filamentous green algaein artificial channels over a range of velocities and phosphorus concentrations. Application of themodel with site specific data from the Spokane River, Washington (Welch et al., 1989) and theCoast Fork Willamette River, Oregon (DEQ 1995-b) indicated that the rate of biomassaccumulation reduced proportionally to that of in-stream limiting nutrient concentrations, and thatthe rate of bioaccumulation was expected to decrease downstream as uptake removed thelimiting nutrient. In addition, it was also hypothesized that periphyton biomass will eventuallyapproach maximum levels even at low in-stream nutrient concentrations following a sufficientlylong growing season.
5.3.5.2 Invertebrate GrazingThe pH model described above does not estimate the potential effects of grazing by
macroinvertebrate on the standing crops and net production of the periphyton community.Grazing may influence not only standing crop, but also nutrient uptake and recycle rates, as wellas species distribution within the benthic algal mat. Grazing generally results in lower periphytonbiomass (Lamberti et al., 1987 and; Welch et al., 1989), a simplified algal community, lower ratesof carbon production, and a constraint nutrient cycling (Mulholland et al., 1991). Reducedproduction rates anticipated under a nutrient control strategy would likely increase the relativeinfluence of grazing as a controlling mechanism on periphyton. Hence, periphyton biomassaccrual rates in The Sprague River may be lower than predicted by the model as a result of arelative increased invertebrate grazing pressure at the anticipated reduced periphyton growthrates.
5.3.6 Model Calibration
The model was calibrated using the streamflow and continuous pH data collected duringAugust, 1999. As can be seen in Figures 5-5 and 5-6 the model calculated pH matched theobserved pH.
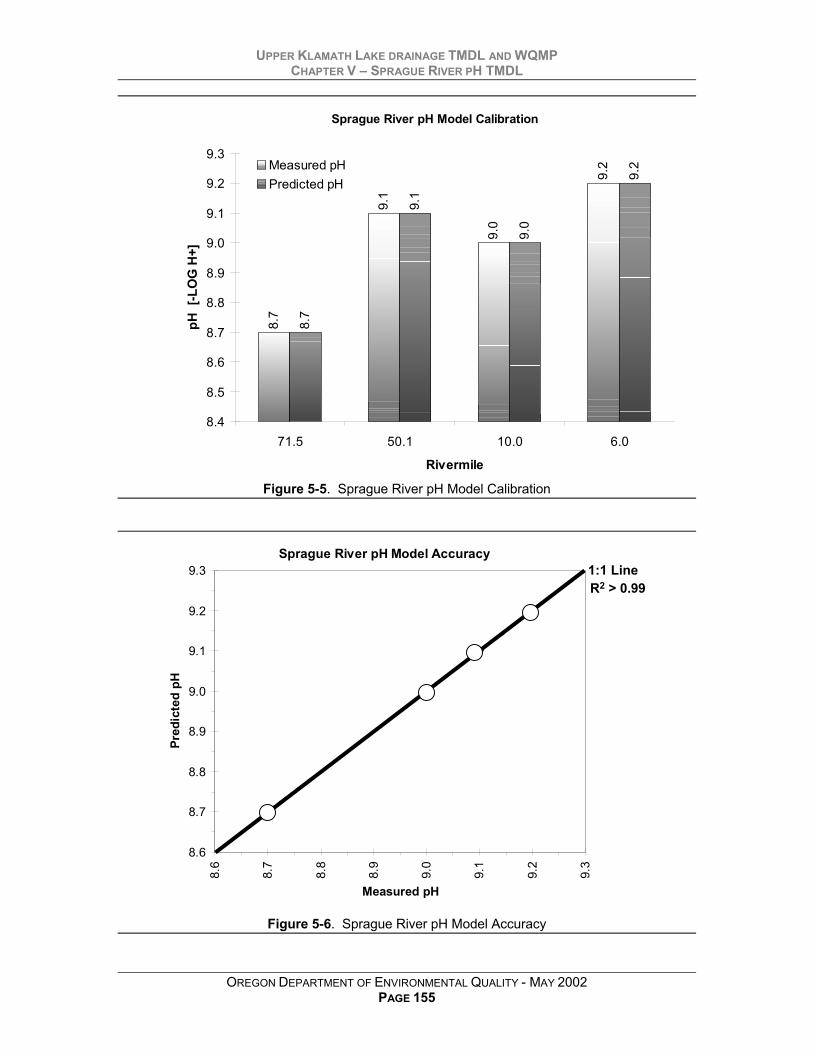
UPPER KLAMATH LAKE DRAINAGE TMDL AND WQMPCHAPTER V – SPRAGUE RIVER PH TMDL
OREGON DEPARTMENT OF ENVIRONMENTAL QUALITY - MAY 2002PAGE 155
Sprague River pH Model Calibration
8.7
9.1
9.0
9.2
8.7
9.1
9.0
9.2
8.4
8.5
8.6
8.7
8.8
8.9
9.0
9.1
9.2
9.3
71.5 50.1 10.0 6.0
Rivermile
pH [
-LO
G H
+]
Measured pHPredicted pH
Figure 5-5. Sprague River pH Model Calibration
Sprague River pH Model Accuracy
Predicted = 1.0 (Measured)R2 = 1.0
8.6
8.7
8.8
8.9
9.0
9.1
9.2
9.3
8.6
8.7
8.8
8.9
9.0
9.1
9.2
9.3
Measured pH
Pred
icte
d pH
1:1 LineR2 > 0.99
Figure 5-6. Sprague River pH Model Accuracy

UPPER KLAMATH LAKE DRAINAGE TMDL AND WQMPCHAPTER V – SPRAGUE RIVER PH TMDL
OREGON DEPARTMENT OF ENVIRONMENTAL QUALITY - MAY 2002PAGE 156
5.3.7 pH Standard Attainment AnalysisThe temperature model of the Sprague River predicts system potential maximum
temperatures at rivermiles 71.5, 50.1 and 6.0 of 18.3, 18.9, and 19.4 degrees Celsius,respectively. The pH model predicts that the maximum instream pH at rivermile 50.1 will be 8.6SU with the river achieving site potential temperatures (see model output in Figure 5-7). ThepH predicted at site potential temperature near the mouth of the Sprague River is 8.5 SU. Theloading capacities for pH are the system potential instream temperatures discussedabove.
Sprague River System Potential pH8.
7
9.1
9.0
9.2
8.3
8.6
8.5
8.5
7.8
8.0
8.2
8.4
8.6
8.8
9.0
9.2
9.4
71.5 50.1 10.0 6.0
Rivermile
pH [
-LO
G H
+]
Measured pH
Site Potential pH
Figure 5-7. pH Model Output at System Potential Temperatures
5.4 LOADING CAPACITY – 40 CFR 130.2 (F)As discussed in the data review, a water quality concern in the Sprague River from
approximately rivermile 50.1 to the mouth is pH exceeding the State of Oregon water qualitystandard (greater than 9.0 standard pH units (SU)). The presence of instream aquatic plants canhave a profound effect on the variability of pH throughout a day and from day to day. In theSprague River, the emphasis is on attached algae (periphyton) which clings to rocks and othersurfaces.
Nutrients, light availability, and instream temperature are all parameters necessary forsupporting periphyton growth. The data review indicates that the best opportunity to reduce pH tobelow the water quality standard is through the implementation of the temperature TMDL.
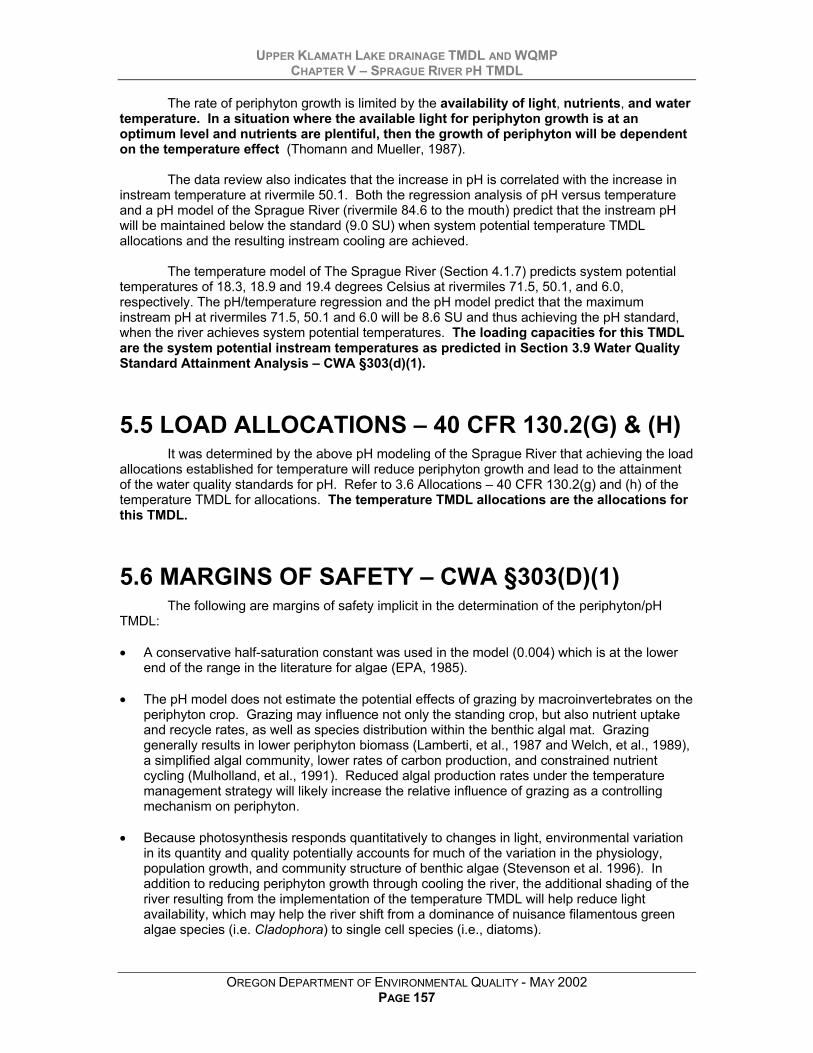
UPPER KLAMATH LAKE DRAINAGE TMDL AND WQMPCHAPTER V – SPRAGUE RIVER PH TMDL
OREGON DEPARTMENT OF ENVIRONMENTAL QUALITY - MAY 2002PAGE 157
The rate of periphyton growth is limited by the availability of light, nutrients, and watertemperature. In a situation where the available light for periphyton growth is at anoptimum level and nutrients are plentiful, then the growth of periphyton will be dependenton the temperature effect (Thomann and Mueller, 1987).
The data review also indicates that the increase in pH is correlated with the increase ininstream temperature at rivermile 50.1. Both the regression analysis of pH versus temperatureand a pH model of the Sprague River (rivermile 84.6 to the mouth) predict that the instream pHwill be maintained below the standard (9.0 SU) when system potential temperature TMDLallocations and the resulting instream cooling are achieved.
The temperature model of The Sprague River (Section 4.1.7) predicts system potentialtemperatures of 18.3, 18.9 and 19.4 degrees Celsius at rivermiles 71.5, 50.1, and 6.0,respectively. The pH/temperature regression and the pH model predict that the maximuminstream pH at rivermiles 71.5, 50.1 and 6.0 will be 8.6 SU and thus achieving the pH standard,when the river achieves system potential temperatures. The loading capacities for this TMDLare the system potential instream temperatures as predicted in Section 3.9 Water QualityStandard Attainment Analysis – CWA §303(d)(1).
5.5 LOAD ALLOCATIONS – 40 CFR 130.2(G) & (H)It was determined by the above pH modeling of the Sprague River that achieving the load
allocations established for temperature will reduce periphyton growth and lead to the attainmentof the water quality standards for pH. Refer to 3.6 Allocations – 40 CFR 130.2(g) and (h) of thetemperature TMDL for allocations. The temperature TMDL allocations are the allocations forthis TMDL.
5.6 MARGINS OF SAFETY – CWA §303(D)(1)The following are margins of safety implicit in the determination of the periphyton/pH
TMDL:
• A conservative half-saturation constant was used in the model (0.004) which is at the lowerend of the range in the literature for algae (EPA, 1985).
• The pH model does not estimate the potential effects of grazing by macroinvertebrates on theperiphyton crop. Grazing may influence not only the standing crop, but also nutrient uptakeand recycle rates, as well as species distribution within the benthic algal mat. Grazinggenerally results in lower periphyton biomass (Lamberti, et al., 1987 and Welch, et al., 1989),a simplified algal community, lower rates of carbon production, and constrained nutrientcycling (Mulholland, et al., 1991). Reduced algal production rates under the temperaturemanagement strategy will likely increase the relative influence of grazing as a controllingmechanism on periphyton.
• Because photosynthesis responds quantitatively to changes in light, environmental variationin its quantity and quality potentially accounts for much of the variation in the physiology,population growth, and community structure of benthic algae (Stevenson et al. 1996). Inaddition to reducing periphyton growth through cooling the river, the additional shading of theriver resulting from the implementation of the temperature TMDL will help reduce lightavailability, which may help the river shift from a dominance of nuisance filamentous greenalgae species (i.e. Cladophora) to single cell species (i.e., diatoms).

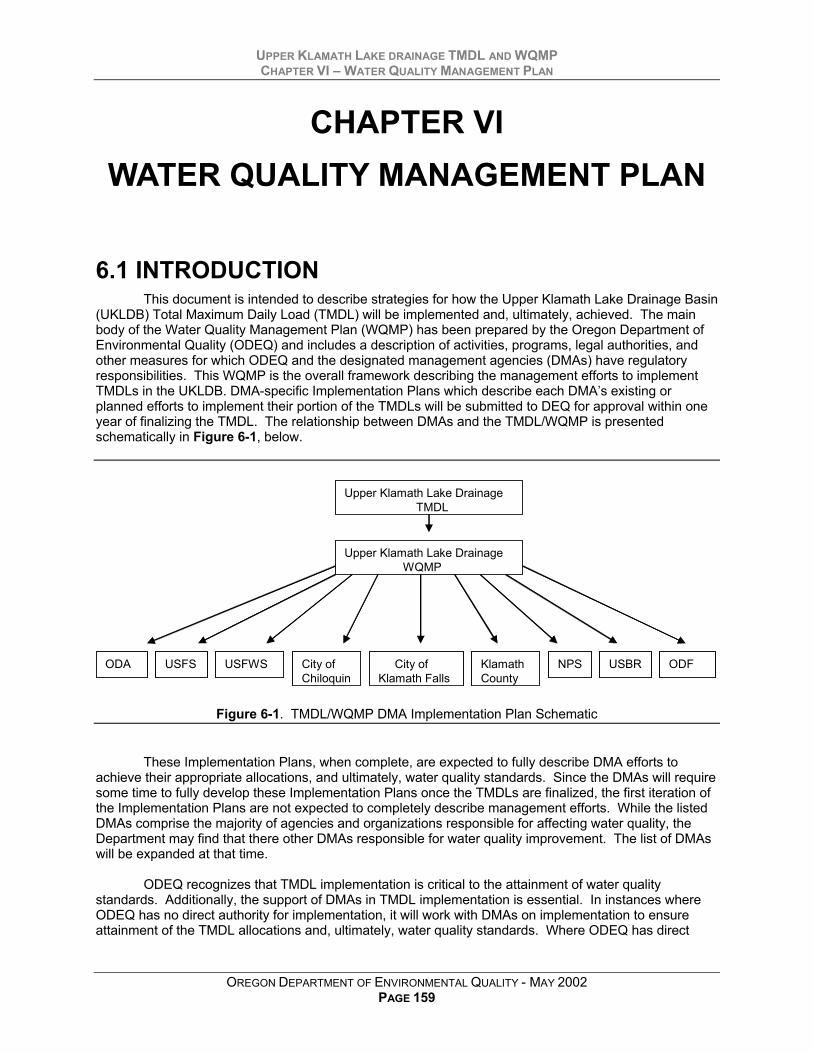
UPPER KLAMATH LAKE DRAINAGE TMDL AND WQMPCHAPTER VI – WATER QUALITY MANAGEMENT PLAN
OREGON DEPARTMENT OF ENVIRONMENTAL QUALITY - MAY 2002PAGE 159
CHAPTER VIWATER QUALITY MANAGEMENT PLAN
6.1 INTRODUCTIONThis document is intended to describe strategies for how the Upper Klamath Lake Drainage Basin
(UKLDB) Total Maximum Daily Load (TMDL) will be implemented and, ultimately, achieved. The mainbody of the Water Quality Management Plan (WQMP) has been prepared by the Oregon Department ofEnvironmental Quality (ODEQ) and includes a description of activities, programs, legal authorities, andother measures for which ODEQ and the designated management agencies (DMAs) have regulatoryresponsibilities. This WQMP is the overall framework describing the management efforts to implementTMDLs in the UKLDB. DMA-specific Implementation Plans which describe each DMA’s existing orplanned efforts to implement their portion of the TMDLs will be submitted to DEQ for approval within oneyear of finalizing the TMDL. The relationship between DMAs and the TMDL/WQMP is presentedschematically in Figure 6-1, below.
Upper Klamath Lake Drainage TMDL
Upper Klamath Lake DrainageWQMP
ODA USFS USFWS ODFCity ofChiloquin
City ofKlamath Falls
Klamath County
USBRNPS
Upper Klamath Lake Drainage TMDL
Upper Klamath Lake DrainageWQMP
ODA USFS USFWS ODFCity ofChiloquin
City ofKlamath Falls
Klamath County
USBRNPS
Figure 6-1. TMDL/WQMP DMA Implementation Plan Schematic
These Implementation Plans, when complete, are expected to fully describe DMA efforts toachieve their appropriate allocations, and ultimately, water quality standards. Since the DMAs will requiresome time to fully develop these Implementation Plans once the TMDLs are finalized, the first iteration ofthe Implementation Plans are not expected to completely describe management efforts. While the listedDMAs comprise the majority of agencies and organizations responsible for affecting water quality, theDepartment may find that there other DMAs responsible for water quality improvement. The list of DMAswill be expanded at that time.
ODEQ recognizes that TMDL implementation is critical to the attainment of water qualitystandards. Additionally, the support of DMAs in TMDL implementation is essential. In instances whereODEQ has no direct authority for implementation, it will work with DMAs on implementation to ensureattainment of the TMDL allocations and, ultimately, water quality standards. Where ODEQ has direct
UPPER KLAMATH LAKE DRAINAGE TMDL AND WQMPCHAPTER VI – WATER QUALITY MANAGEMENT PLAN
OREGON DEPARTMENT OF ENVIRONMENTAL QUALITY - MAY 2002PAGE 160
authority, it will use that authority to ensure attainment of the TMDL allocations (and water qualitystandards).
This document is the first iteration of the Water Quality Management Plan (WQMP) for the new andrevised UKLDB TMDLs. As explained in “Element 6” of this document, DMA-specific ImplementationPlans will be more fully developed once the current TMDLs are finalized. This WQMP will establishproposed timelines (following final TMDL approval) to develop full Implementation Plans. ODEQ and theDMAs will work cooperatively in the development of the TMDL Implementation Plans and ODEQ willassure that the plans adequately address the elements described below under “TMDL Water QualityManagement Plan Guidance”. In short, this document is a starting point and foundation for the WQMPelements being developed by ODEQ and UKLDB DMAs.
6.2 ADAPTIVE MANAGEMENTThe goal of the Clean Water Act and associated Oregon Administrative Rules (OARs) is that
water quality standards shall be met or that all feasible steps will be taken towards achieving the highestquality water attainable. This is a long-term goal in many watersheds, particularly where non-pointsources are the main concern. To achieve this goal, implementation must commence as soon aspossible.
Upper Klamath Lake TMDLs are numerical loadings that are set to limit pollutant levels such thatin-lake water quality standards are met. ODEQ recognizes that TMDLs are values calculated frommathematical models and other analytical techniques designed to simulate and/or predict very complexphysical, chemical and biological processes. TMDLs for Upper Klamath Lake were developed using theavailable data and associated pollutant loading estimates available at the time. Models and techniquesare simplifications of these complex processes and, as such, are unlikely to produce an exact predictionof how Upper Klamath and Agency Lakes will respond to the application of various managementmeasures.
WQMPs are plans designed to reduce pollutant loads to meet TMDLs. ODEQ recognizes that it
may take several decades - after full implementation before management practices identified in a WQMPbecome fully effective in reducing and controlling pollution. In addition, ODEQ recognizes that technologyfor controlling nonpoint source pollution is, in many cases, in the development stages and will likely takeone or more iterations to develop effective techniques. It is possible that after application of allreasonable best management practices, some TMDLs or their associated surrogates cannot be achievedas originally established. Figure 6-2 is a graphical representation of this adaptive management concept.
ODEQ also recognizes that, despite the best and most sincere efforts, natural events beyond thecontrol of humans may interfere with or delay attainment of the TMDL and/or its associated surrogates.Such events could be, but are not limited to, floods, fire, insect infestations, and drought.
In the UKL TMDLs, pollutant surrogate (total phosphorus) has been defined as alternative targetsfor meeting the TMDLs for pH and dissolved oxygen. The purpose of a surrogate is not to bar oreliminate human activity in the basin. It is the expectation, however, that this WQMP and the associatedDMA-specific Implementation Plans will address how human activities will be managed to achieve thesurrogate. It is also recognized that full attainment of pollutant surrogate (target load reduction) at alllocations may not be feasible due to physical, legal or other regulatory constraints. To the extentpossible, the Implementation Plans should identify potential constraints, but should also provide the abilityto mitigate those constraints should the opportunity arise.
If a non-point source that is covered by the TMDLs complies with its finalized ImplementationPlan or applicable forest practice rules, it will be considered in compliance with the TMDL.

UPPER KLAMATH LAKE DRAINAGE TMDL AND WQMPCHAPTER VI – WATER QUALITY MANAGEMENT PLAN
OREGON DEPARTMENT OF ENVIRONMENTAL QUALITY - MAY 2002PAGE 161
If and when ODEQ determines that the WQMP has been fully implemented, that all feasiblemanagement practices have reached maximum expected effectiveness and a TMDL or its interim targetshave not been achieved, the Department shall reopen the TMDL and adjust it or its interim targets andthe associated water quality standard(s) as necessary.
The implementation of TMDLs and the associated plans is generally enforceable by ODEQ, otherstate agencies and local government. However, it is envisioned that sufficient initiative exists to achievewater quality goals with minimal enforcement. Should the need for additional effort emerge, it is expectedthat the responsible agency will work with land managers to overcome impediments to progress througheducation, technical support or enforcement. Enforcement may be necessary in instances of insufficientaction towards progress. This could occur first through direct intervention from land managementagencies (e.g. ODF, ODA, counties and cities), and secondarily through ODEQ. The latter may be basedon departmental orders to implement management goals leading to water quality standards.
If a source is not given a load allocation, it does not necessarily mean that the source isprohibited from discharging any wastes. A source may be permitted to discharge by ODEQ if the holdercan adequately demonstrate that the discharge will not have a significant impact on water quality overthat achieved by a zero allocation. For instance, a permit applicant may be able to demonstrate that aproposed thermal discharge would not have a measurable detrimental impact on projected streamtemperatures when site temperature is achieved. Alternatively, in the case where a TMDL is set basedupon attainment of a specific pollutant concentration, a source may be permitted to discharge at thatconcentration and still be considered as meeting a zero allocation.
As part of the adaptive management process, the Department is committed toward ensuring thatthere is a process to evaluate new data and technical analyses into the TMDL as this information is madeavailable. In response to this need, the Department will be actively involved after the TMDL is approvedby EPA and will assign a staff person to oversee implementation of the TMDL and this WQMP. Activitiesassigned to this staff person include:
I. With the assistance of local stake holders, establishing a science review team comprised of qualifiedscientists to accomplish the following objectives:
A. Provide a forum to review water quality data.
B. Provide technical review of research reports related to water quality of UKLD.
C. Assist the Department in coordinating water quality monitoring in the UKLD.
D. Provide a forum to discuss the effectiveness of activities to reduce and control pollution.
E. Provide recommendations concerning adjustments to the TMDL and/or allocations.
F. Convene a meeting of the science review team quarterly to assess progress.
II. At least annually, and more frequently if deemed necessary, hold a public meeting to provide updateson new data and progress toward implementing the TMDL and WQMP.
III. Within two years (and every two years thereafter), convene a special meeting of the science reviewteam and local stakeholders to consider and/or propose modifications to the TMDL and/or WQMP.The Department will seriously consider any and all recommendations proposed by stakeholders torevise the TMDL/WQMP. However, the Department will make the final decision on revising the TMDLbecause a revision of the TMDL will require significant resources.
UPPER KLAMATH LAKE DRAINAGE TMDL AND WQMPCHAPTER VI – WATER QUALITY MANAGEMENT PLAN
OREGON DEPARTMENT OF ENVIRONMENTAL QUALITY - MAY 2002PAGE 162
IV. DEQ staff will actively assist researchers in acquiring funding for research projects in, but not limitedto, the following list:
A. Investigate and model phosphorus internal loading as a function of wind-induced mixingof suspended sediments. The role of wind in the cycling of nutrients from the sediments is notconsidered in this TMDL. Previous research by USGS studied the mechanisms for wind-inducedresuspension of sediments. Further studies should quantify the loading of phosphorus to thewater column from wind-induced resuspended sediments.
B. Investigate and model cycling and storage of phosphorus in sediments. Data collection andanalysis should focus on both long-term changes in nutrient storage in sediments and lakemanagement effects of storage processes.
C. Quantify loading capacity and load allocations as a function of lake levels. This TMDL isdeveloped for average loading, hydrologic and reservoir/lake management conditions from 1991to 1998. Additional analysis is needed to evaluate pH responses for alternative reservoir/lakemanagement (Walker 2001).
D. Quantify sedimentation and phosphorus loading as a function of sediment loads fromtributaries. It is widely acknowledged that both human and natural upland sources ofsedimentation contribute bound phopsphorus to the streams and rivers that drain to UpperKlamath Lake (Gearheart et al. 1995, Eilers et al. 2001 and Kann and Walker, 2001). Sedimentsources should be monitored from the source (i.e. active erosion, stream bank retreat anddowncutting) and the downstream effects (i.e. stream and lake sedimentation and sedimentaccumulation rates) should be more accurately quantified. Overland erosion, stream bankerosion and overall stream condition is an important component for each of the TMDL parametersin this document. While there has been significant effort in quantifying and analyzing causes andeffects of sedimentation, improved understanding and documentation of source areas, associatedimpacts and restoration processes will serve to benefit and compliment the overall goals of thisTMDL.
E. Quantify phosphorus loads reductions associated with reconnected wetlands. Snyder andMorace (1997) provide compelling information regarding the role of wetlands in Upper KlamathLake nutrient loading. Further research should consider the quantification of loading reductionsassociate with wetland functions: reduction of peat decomposition, removal of pumps and gravitydrains from reclaimed areas, wetland reconnection to the lake systems and wetland macrophytenutrient uptake dynamics.
F. Investigate the role of dissolved humic substances in the suppression of AFA blooms.Geiger (2001) speculates that dissolved organic material can affect the growth rates ofAphanizonmenon via: the effect on light availability, interactions among dissolved iron, dissolvedorganic matter and nutrients and/or the complexation of toxic metals by dissolved organic matter.
G. Install continuous flow gages at the mouth of Sevenmile Canal and Wood River at DikeRoad. Gaps in flow data occur in the lower Wood River and Sevenmile Canal monitoring sitesduring the 1991 to 1998 period of record. While it is recognized that these are difficult samplingenvironments, the installation and operation of Doppler gages will allow accurate quantification offlows and nutrient loading. These sites justify the monitoring expense due to their high rates ofnutrient loading, the increased accuracy will translate to more accurate loading calculations, anddue to the current and future restoration efforts there is a need for measurement of the potentialloading reductions.
H. Identify hot-spots of external (upland, wetland and lake biota) phosphorus loading. Geiger(personal communication) suggests that nutrient loading from malfunctioning septic systemsshould be quantified. Rykbost (personal communication) suggests that future investigationsshould quantify rates of phosphorus loading from waterfowl and introduced fish species.
I. Quantify phosphorus loads from ungaged springs and artesian wells.
J. Investigate the potential composition near stream land cover composition at highlydisturbed near stream sites.
UPPER KLAMATH LAKE DRAINAGE TMDL AND WQMPCHAPTER VI – WATER QUALITY MANAGEMENT PLAN
OREGON DEPARTMENT OF ENVIRONMENTAL QUALITY - MAY 2002PAGE 163
K. Where appropriate, refine channel morphology targets based upon hydrologic conditionsand riparian function.
L. Develop a coordinated water quality sampling and quality assurance plan to integratesampling activities by the Klamath Tribes, state and federal agencies.
In addition to the implementation activities stated above, ODEQ also has the following expectations andintentions:
• ODEQ expects that each DMA will also monitor and document its progress in implementing theprovisions of its Implementation Plan. This information will be provided to ODEQ for its use inreviewing the TMDL.
• As implementation of the WQMP and the associated Implementation Plans proceeds, ODEQ expectsthat DMAs will develop benchmarks for attainment of TMDL surrogates, which can then be used tomeasure progress.
• Where implementation of the Implementation Plans or effectiveness of management techniques arefound to be inadequate, ODEQ expects management agencies to revise the components of theirImplementation Plan to address these deficiencies.
• When ODEQ, in consultation with the DMAs, concludes that all feasible steps have been taken tomeet the TMDL and its associated surrogates and attainment of water quality standards, the TMDL,or the associated surrogates is not practicable, it will reopen the TMDL and revise it as appropriate.ODEQ would also consider reopening the TMDL should new information become available indicatingthat the TMDL or its associated surrogates should be modified.
6.3 TMDL WATER QUALITY MANAGEMENT PLANGUIDANCEIn February 2000, ODEQ entered into a Memorandum of Agreement (MOA) with the U.S. EnvironmentalProtection Agency (EPA) that describes the basic elements needed in a TMDL Water QualityManagement Plan (WQMP). That MOA was endorsed by the Courts in a Consent Order signed byUnited States District Judge Michael R. Hogan in July 2000. These elements, as outlined below, willserve as the framework for this WQMP.
WQMP Elements1. Condition assessment and problem description2. Goals and objectives3. Identification of responsible participants4. Proposed management measures5. Timeline for implementation6. Reasonable assurance7. Monitoring and evaluation8. Public involvement9. Costs and funding10. Citation to legal authorities11. This UKLDB WQMP is organized around these plan elements and is intended to fulfill the
requirement for a management plan contained in OAR 340-041-0745.

UPPER KLAMATH LAKE DRAINAGE TMDL AND WQMPCHAPTER VI – WATER QUALITY MANAGEMENT PLAN
OREGON DEPARTMENT OF ENVIRONMENTAL QUALITY - MAY 2002PAGE 164
6.3.1 Condition Assessment and Problem DescriptionThe 1998 303(d) Upper Klamath Lake Drainage listings are summarized below (for more
information refer to the DEQ website containing Oregon's 303(d) list athttp://waterquality.deq.state.or.us/wq/. In the following text, values other than State water qualitystandards are referenced. This is because some standards are narrative rather than numeric,necessitating additional numeric targets to fulfill or evaluate attainment of water quality standards.
• Temperature: Williamson River, Sprague River Drainage, Agency Lake, Upper Klamath Lake, andtributaries based on exceedance of the numeric temperature criteria of the Oregon water qualitystandard.
• pH: Sprague River, mouth to North/South Fork, Agency, Upper Klamath lakes based on exceedanceof numeric pH criteria of the Oregon water quality standard.
• DO: Agency, Upper Klamath Lakes, Sprague River, mouth to North/South Fork based on the toxicityabsolute minimum criteria of 4.0 mg/l an Oregon water quality standard; also based on listingspecifications for ‘cold’ or ‘cool’ water.
• Chlorophyll-a : Klamath and Agency Lakes. Listed as a nuisance criteria.
• Habitat: Threemile Creek, mouth to headwaters based on low pool frequency and minimal largewoody debris occurrence, relative to ODFW benchmarks.
6.3.2 Existing Sources of Water Pollution
6.3.2.1 EutrophicationUpper Klamath and Agency Lakes exhibits many water quality problems typically associated with
excessive algal production. Extensive blooms of the cyanobacterium Aphanizomenon flos-aqaue (AFA)cause significant water quality deterioration due to photosynthetically elevated pH (Kann and Smith 1993)and to both supersaturated and low dissolved oxygen (DO) concentrations (Kann 1993a, 1993b). AFA isthe dominant primary producer in Upper Klamath and Agency Lakes (UKL), comprising >90% of theprimary producer biomass during blooms. Both high pH and low DO reach levels that are consideredlethal levels in UKL, and as such are important parameters affecting survival and viability of native fishes.
Total phosphorus load reduction is the primary mechanism to attain water quality standards forpH, dissolved oxygen and algal biomass in Upper Klamath Lake and Agency Lake. Seasonal maximumalgal growth rates in Klamath and Agency Lakes, and its subsequent impact on elevated pH and lowdissolved oxygen levels, are controlled primarily by phosphorus and secondarily by light and temperature.High nutrient loading promotes correspondingly high production of algae, which, in turn, modifies physicaland chemical water quality characteristics that can directly diminish the survival and production of fishpopulations. However, year to year variations in the timing and development of algal blooms during latespring and early summer are strongly temperature dependent.
Under conditions of high nutrient input and adequate light, algae growth rates increase, resultingin an accumulation of biomass, until some factor, either light, nutrients, or other factors, limits furthergrowth. As biomass increases, the available soluble forms of nitrogen (N) and phosphorus (P) decrease,because the nutrients are accumulated in the biomass, and are therefore unavailable for further biomassincrease.
UPPER KLAMATH LAKE DRAINAGE TMDL AND WQMPCHAPTER VI – WATER QUALITY MANAGEMENT PLAN
OREGON DEPARTMENT OF ENVIRONMENTAL QUALITY - MAY 2002PAGE 165
The primary anthropogenic sources of total phosphorus in the UKLDB are the following (thislisting is not meant to be comprehensive, but it does contain probable sources in UKDB):
1. Wastewater Treatment Plants and Sanitary Sewer SystemsOne municipal waste water treatment plant at Chiloquin discharges into the Williamson River. Wasteloadallocations have been assigned to this plant.2. Permitted Sites other than POTWsCrooked Creek fish hatchery is the only other permitted point source. Wasteload allocations havebeen assigned to this facility.3. Agricultural RunoffSome of the potential sources of phosphorus in agricultural runoff are fertilizers, animal waste, anderosion.4. Urban RunoffUrban runoff can be quite high in total phosphorus concentrations. The ultimate sources could includefertilizers, erosion, cross-connections, etc.5. Rural RunoffRural runoff may contain phosphorus from the same sources as urban runoff, with the possible exceptionof sanitary sewers. Additional potential sources are ranches, farms, and horse pastures. These sites areoften stocked very densely.6. Forestry RunoffSince surface runoff in forested areas during the TMDL season is expected to be minimal, phosphorusloads from forestry operations during are most likely predominately associated with roads and culverts.7. Failing Septic SystemsEffluent from failing septic systems will contain phosphorus, along with bacteria, BOD and otherpollutants.8. Instream and Near-stream ErosionPhosphorus contained in soils may be transported to Upper Klamath and Agency Lakes through instreamand near-stream erosion. While a certain amount of this erosion is natural, some erosion (especiallyduring the summer), is not natural.
6.3.2.2 TemperatureSurface water temperatures in UKDB are heavily influenced by human activities. These
activities are diverse and may have either a detrimental or a beneficial impact on rivertemperature. Some of these activities have readily observable and direct impact on watertemperature, such as cool water releases from reservoirs, while other activities may have a lessobservable impact, such as the loss of riparian vegetation (shading), water withdrawal and thedisconnection of floodplains to rivers.
Riparian vegetation, stream morphology, hydrology, climate, and geographic locationinfluence stream temperature. While climate and geographic location are outside of humancontrol, the condition of the riparian area, channel morphology and hydrology can be affected byland use activities. Specifically, elevated summertime stream temperatures attributed toanthropogenic sources may result from the following conditions within the UKLDB:
1. Riparian vegetation disturbance that reduces stream surface shading, riparian vegetationheight, and riparian vegetation density (shade is commonly measured as percent effectiveshade),
2. Channel widening (increased width to depth ratios) due to factors such as loss of riparianvegetation that increases the stream surface area exposed to energy processes, namely solarradiation,
3. Reduced flow volumes (from irrigation, industrial, and municipal withdrawals) or increasedhigh temperature discharges, and
4. Disconnected floodplains which prevent/reduce groundwater discharge into the river.

UPPER KLAMATH LAKE DRAINAGE TMDL AND WQMPCHAPTER VI – WATER QUALITY MANAGEMENT PLAN
OREGON DEPARTMENT OF ENVIRONMENTAL QUALITY - MAY 2002PAGE 166
6.3.3 Goals and ObjectivesThe overall goal of the TMDL Water Quality Management Plan (WQMP) is to achieve
compliance with water quality standards for each of the 303(d) listed parameters and streams inthe UKLDB. Specifically the WQMP combines a description of all Designated ResponsibleParticipants (or Designated Management Agencies (DMA)) plans that are or will be in place toaddress the load and wasteload allocations in the TMDL. The specific goal of this WQMP is todescribe a strategy for reducing discharges from nonpoint sources to the level of the loadallocations and for reducing discharges from point sources to the level of the waste loadallocations described in the TMDL. As discussed above, this plan is preliminary in nature and isdesigned to be adaptive as more information is gained regarding the pollutants, allocations,management measures, and other related areas.
The expectation of all DMAs are to:
1. Develop Best Management Practices (BMPs) to achieve Load Allocations and Waste LoadAllocations.
2. Give reasonable assurance that management measures will meet load allocations throughboth quantitative and qualitative analysis of management measures.
3. Adhere to measurable milestones for progress.4. Develop a timeline for implementation, with reference to costs and funding.5. Develop a monitoring plan to determine if:
• BMPs are being implemented• Individual BMPs are effective• Load and wasteload allocations are being met• Water quality standards are being met
6.3.4 Identification of responsible participantsThe purpose of this element is to identify the organizations responsible for the implementation of
the plan and to list the major responsibilities of each organization. What follows is a simple list of thoseorganizations and responsibilities. This is not intended to be an exhaustive list of every participant thatbears some responsibility for improving water quality in the UKDB. Because this is a community wideeffort, a complete listing would have to include every business, every industry, every farm, and ultimatelyevery citizen living or working within UKLDB. We are all contributors to the existing quality of the watersin the UKLDB and we all must be participants in the efforts to improve water quality.
Oregon Department of Environmental Quality• NPDES Permitting and Enforcement• WPCF Permitting and Enforcement• Technical Assistance• Financial Assistance
Oregon Department of Agriculture• Agricultural Water Quality Management Plan Development, Implementation & Enforcement.• CAFO Permitting and Enforcement• Technical Assistance• Revise Agricultural WQMAP• Rules under Senate Bill (SB) 1010 to clearly address TMDL and Load Allocations as
necessary.Riparian area management
Oregon Department of Forestry• Forest Practices Act (FPA) Implementation
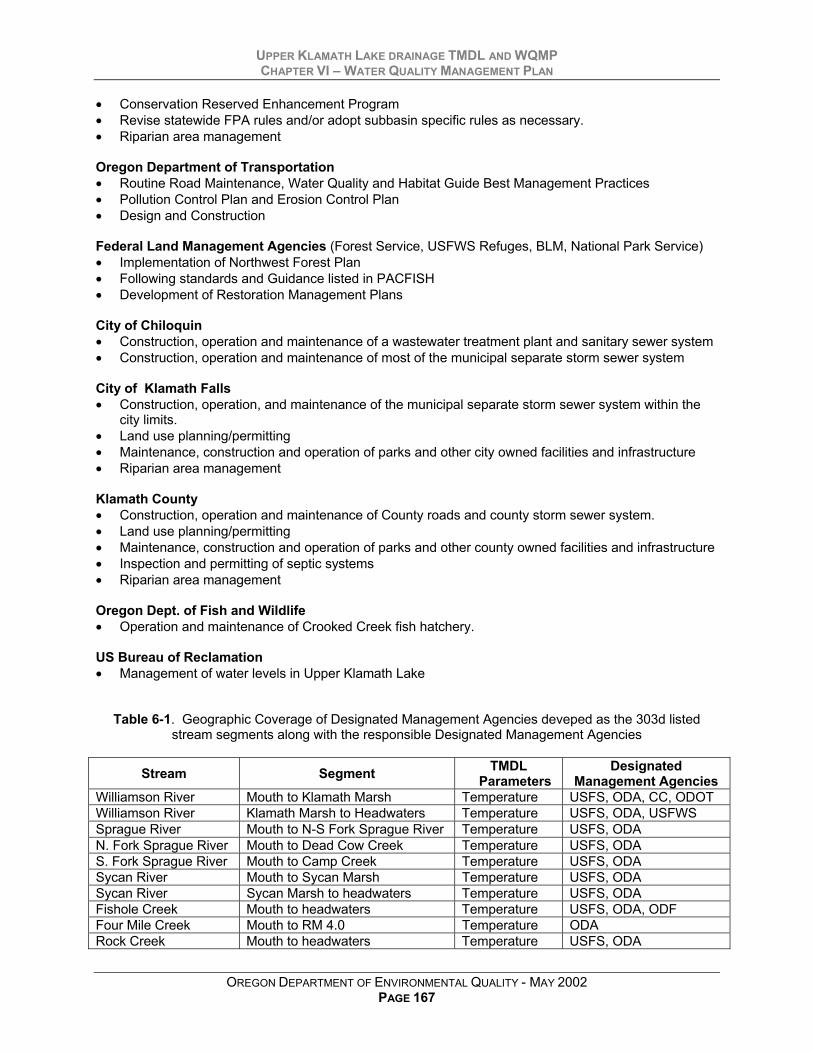
UPPER KLAMATH LAKE DRAINAGE TMDL AND WQMPCHAPTER VI – WATER QUALITY MANAGEMENT PLAN
OREGON DEPARTMENT OF ENVIRONMENTAL QUALITY - MAY 2002PAGE 167
• Conservation Reserved Enhancement Program• Revise statewide FPA rules and/or adopt subbasin specific rules as necessary.• Riparian area management
Oregon Department of Transportation• Routine Road Maintenance, Water Quality and Habitat Guide Best Management Practices• Pollution Control Plan and Erosion Control Plan• Design and Construction
Federal Land Management Agencies (Forest Service, USFWS Refuges, BLM, National Park Service)• Implementation of Northwest Forest Plan• Following standards and Guidance listed in PACFISH• Development of Restoration Management Plans
City of Chiloquin• Construction, operation and maintenance of a wastewater treatment plant and sanitary sewer system• Construction, operation and maintenance of most of the municipal separate storm sewer system
City of Klamath Falls• Construction, operation, and maintenance of the municipal separate storm sewer system within the
city limits.• Land use planning/permitting• Maintenance, construction and operation of parks and other city owned facilities and infrastructure• Riparian area management
Klamath County• Construction, operation and maintenance of County roads and county storm sewer system.• Land use planning/permitting• Maintenance, construction and operation of parks and other county owned facilities and infrastructure• Inspection and permitting of septic systems• Riparian area management
Oregon Dept. of Fish and Wildlife• Operation and maintenance of Crooked Creek fish hatchery.
US Bureau of Reclamation• Management of water levels in Upper Klamath Lake
Table 6-1. Geographic Coverage of Designated Management Agencies deveped as the 303d listedstream segments along with the responsible Designated Management Agencies
Stream Segment TMDLParameters
DesignatedManagement Agencies
Williamson River Mouth to Klamath Marsh Temperature USFS, ODA, CC, ODOTWilliamson River Klamath Marsh to Headwaters Temperature USFS, ODA, USFWSSprague River Mouth to N-S Fork Sprague River Temperature USFS, ODAN. Fork Sprague River Mouth to Dead Cow Creek Temperature USFS, ODAS. Fork Sprague River Mouth to Camp Creek Temperature USFS, ODASycan River Mouth to Sycan Marsh Temperature USFS, ODASycan River Sycan Marsh to headwaters Temperature USFS, ODAFishole Creek Mouth to headwaters Temperature USFS, ODA, ODFFour Mile Creek Mouth to RM 4.0 Temperature ODARock Creek Mouth to headwaters Temperature USFS, ODA

UPPER KLAMATH LAKE DRAINAGE TMDL AND WQMPCHAPTER VI – WATER QUALITY MANAGEMENT PLAN
OREGON DEPARTMENT OF ENVIRONMENTAL QUALITY - MAY 2002PAGE 168
Denio Creek Mouth to headwaters Temperature USFSCorral Creek Mouth to headwaters Temperature USFSPothole Creek Mouth to headwaters Temperature USFSParadise Creek Mouth to headwaters Temperature ODF, USFSLeonard Creek Mouth to headwaters Temperature ODF, USFSLong Creek Mouth to headwaters Temperature ODF, USFSUpper Klamath andAgency Lakes
pH, DO,chlorophyll-a
USFS, ODA, BLM,USFWS, ODOT, CLNP,KC, USBR
*Notes: DO = Dissolved Oxygen, DO is listed for May – Oct. unless otherwise noted, Temperature andChlorophyll-a are listed for Summer unless otherwise noted.
CC = City of ChiloquinODA= Oregon Dept. of AgricultureODF = Oregon Dept. of ForestryUSFWS = US Fish and Wildlife Service
CLNP= Crater Lake National ParkKC = Klamath CountyUSBR = US Bureau of ReclamationODFW = Oregon department of Fish and Wildlife
6.3.5 Proposed Management MeasuresThis section of the plan outlines the proposed management measures that are designed to
meet the wasteload allocations and load allocations of each TMDL. The timelines for addressingthese measures are given in the following section.
The management measures to meet the load and wasteload allocations may differdepending on the source of the pollutant. Given below is a categorization of the sources and adescription of the management measures being proposed for each source category.
Wastewater Treatment PlantsThe wasteload allocations given to the one wastewater treatment plants (WWTPs), will beimplemented through modifications to their National Pollutant Discharge Elimination System(NPDES) permit. The permits will either include numeric effluent limits or provisions to developand implement management plans, whichever is appropriate.
General and Minor Individual NPDES Permitted SourcesAll general NPDES permits and minor individual NPDES permits will be reviewed and, ifnecessary, modified to ensure compliance with allocations. Either numeric effluent limits will beincorporated into the permits or specific management measures and plans will be developed.
Other SourcesFor discharges from sources other than the WWTPs and those permitted under general or minorNPDES permits, ODEQ has assembled an initial listing of management categories. This listing,given in Table 6-2 below, is designed to be used by the designated management agencies(DMAs) as guidance for selecting management measures to be included in their ImplementationPlans. Each DMA will be responsible for examining the categories in Table 6-2 to determine if thesource and/or management measure is applicable within their jurisdiction. This listing is notcomprehensive and other sources and management measures will most likely be added by theDMAs where appropriate. For each source or measures deemed applicable a listing of thefrequency and extent of application should also be provided. In addition, the DMAs areresponsible for source assessment and identification, which may result in additional categories. Itis crucial that management measures be directly linked with their effectiveness at reducingpollutant loading contributions.
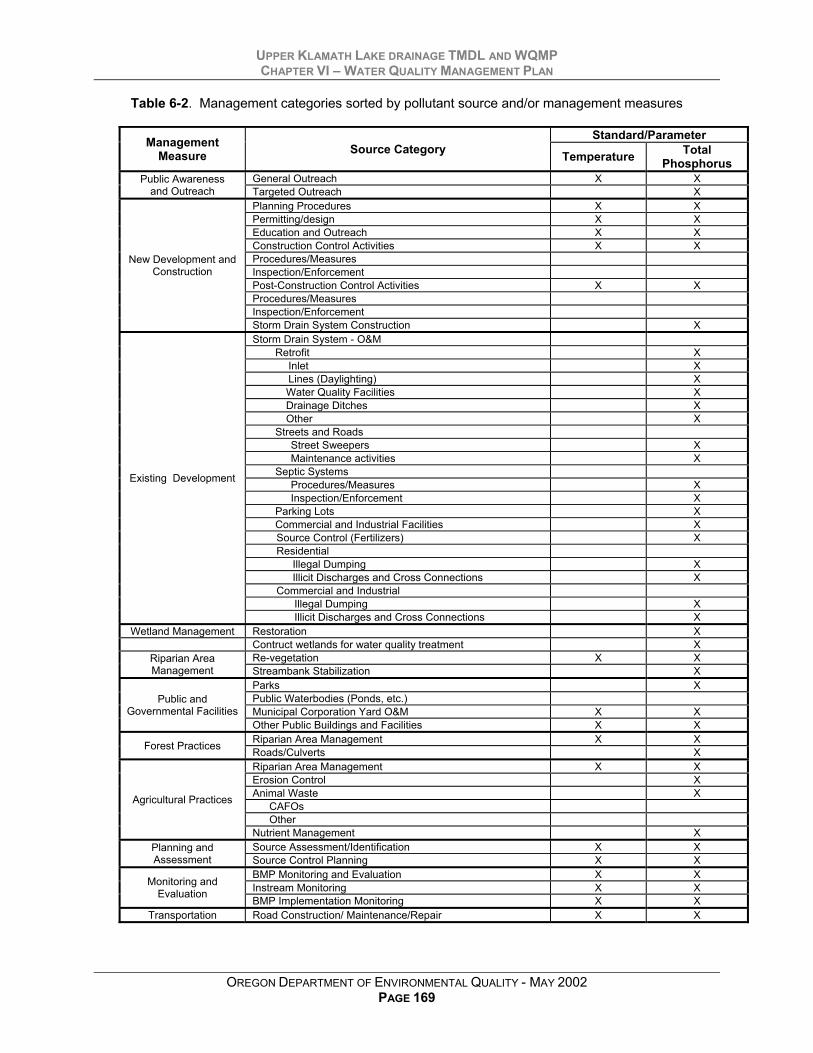
UPPER KLAMATH LAKE DRAINAGE TMDL AND WQMPCHAPTER VI – WATER QUALITY MANAGEMENT PLAN
OREGON DEPARTMENT OF ENVIRONMENTAL QUALITY - MAY 2002PAGE 169
Table 6-2. Management categories sorted by pollutant source and/or management measures
Standard/ParameterManagementMeasure Source Category Temperature Total
PhosphorusGeneral Outreach X XPublic Awareness
and Outreach Targeted Outreach XPlanning Procedures X XPermitting/design X XEducation and Outreach X XConstruction Control Activities X XProcedures/MeasuresInspection/EnforcementPost-Construction Control Activities X XProcedures/MeasuresInspection/Enforcement
New Development andConstruction
Storm Drain System Construction XStorm Drain System - O&M
Retrofit XInlet XLines (Daylighting) XWater Quality Facilities XDrainage Ditches XOther X
Streets and RoadsStreet Sweepers XMaintenance activities X
Septic SystemsProcedures/Measures XInspection/Enforcement X
Parking Lots XCommercial and Industrial Facilities XSource Control (Fertilizers) XResidential
Illegal Dumping XIllicit Discharges and Cross Connections X
Commercial and IndustrialIllegal Dumping X
Existing Development
Illicit Discharges and Cross Connections XWetland Management Restoration X
Contruct wetlands for water quality treatment XRe-vegetation X XRiparian Area
Management Streambank Stabilization XParks XPublic Waterbodies (Ponds, etc.)Municipal Corporation Yard O&M X X
Public andGovernmental Facilities
Other Public Buildings and Facilities X XRiparian Area Management X XForest Practices Roads/Culverts XRiparian Area Management X XErosion Control XAnimal Waste X
CAFOsOther
Agricultural Practices
Nutrient Management XSource Assessment/Identification X XPlanning and
Assessment Source Control Planning X XBMP Monitoring and Evaluation X XInstream Monitoring X XMonitoring and
Evaluation BMP Implementation Monitoring X XTransportation Road Construction/ Maintenance/Repair X X

UPPER KLAMATH LAKE DRAINAGE TMDL AND WQMPCHAPTER VI – WATER QUALITY MANAGEMENT PLAN
OREGON DEPARTMENT OF ENVIRONMENTAL QUALITY - MAY 2002PAGE 170
6.3.6 Timeline for ImplementationThe purpose of this element of the WQMP is to demonstrate a strategy for implementing
and maintaining the plan and the resulting water quality improvements over the long term.Included in this section are timelines for the implementation of ODEQ activities. Each DMA-specific Implementation Plan will also include timelines for the implementation of the milestonesdescribed earlier. Timelines should be as specific as possible and should include a schedule forBMP installation and/or evaluation, monitoring schedules, reporting dates and milestones forevaluating progress.
The DMA-specific Implementation Plans are designed to reduce pollutant loads fromsources to meet TMDLs, associated loads and water quality standards. IndividualImplementation Plans, where they exist, are referenced in this document and are notattached as appendices. The Department recognizes that where implementation involvessignificant habitat restoration or reforestation, water quality standards may not be met for decades.In addition, the Department recognizes that technology for controlling nonpoint source pollution is,in some cases, in the development stages and will likely take one or more iterations to developeffective techniques.
For UKLD TMDLs, pollutant surrogates have been defined as alternative targets formeeting the TMDL for some parameters. The purpose of the surrogates is not to bar or eliminatehuman access or activity in the subbasin or its riparian areas. It is the expectation, however, thatthe Implementation Plans will address how human activities will be managed to achieve thesurrogates. It is also recognized that full attainment of pollutant surrogates (system potentialvegetation, for example) at all locations may not be feasible due to physical, legal or otherregulatory constraints. To the extent possible, the Implementation Plans should identify potentialconstraints, but should also provide the ability to mitigate those constraints should the opportunityarise. For instance, at this time, the existing location of a road or highway may precludeattainment of system potential vegetation due to safety considerations. In the future, however,should the road be expanded or upgraded, consideration should be given to designs that supportTMDL load allocations and pollutant surrogates such as system potential vegetation.
The Department intends to regularly review progress of the Implementation Plans. Theplans, this overall WQMP, and the TMDLs are part of an adaptive management process.Modifications to the WQMP and the Implementation Plans are expected to occur on an annual ormore frequent basis. Review of the TMDLs are expected to occur approximately five years afterthe final approval of the TMDLs, or whenever deemed necessary by ODEQ. Table 6-3 below,gives the timeline for activities related to the WQMP and associated DMA Implementation Plans.
Table 6-3. Water Quality Management Plan Timeline
Activity 2002 2003 2004 2005 2006ODEQ Establishes MAOs withNPDES Sources
ODEQ Incorporate WLAs into Permits
DMA Development and Submittal ofImplementation and Monitoring Plans
DMA Implementation of Plans
ODEQ/DMA/Public Review of TMDLand WQMPDMA Submittal of Annual Reports Sept. 30 of Each Year
UPPER KLAMATH LAKE DRAINAGE TMDL AND WQMPCHAPTER VI – WATER QUALITY MANAGEMENT PLAN
OREGON DEPARTMENT OF ENVIRONMENTAL QUALITY - MAY 2002PAGE 171
6.3.7 Reasonable AssuranceThis section of the WQMP is intended to provide reasonable assurance that the WQMP
(along with the associated DMA-specific Implementation Plans) will be implemented and that theTMDL and associated allocations will be met.
There are several programs that are either already in place or will be put in place to helpassure that this WQMP will be implemented. Some of these are traditional regulatory programssuch as specific requirements under NPDES discharge permits. Other programs addressnonpoint sources under the auspices of state law (for forested and agricultural lands) andvoluntary efforts.
6.3.7.1 Point Sources - NPDES and WPCF Permit ProgramsReasonable assurance that implementation of the point source wasteload allocations will
occur will be addressed through the revision, issuance or revision of NPDES and WPCF permits.The ODEQ administers two different types of wastewater permits in implementing Oregon RevisedStatute (ORS) 468B.050. These are: the National Pollutant Discharge Elimination System(NPDES) permits for surface water discharge; and Water Pollution Control Facilities (WPCF)permits for onsite (land) disposal. The NPDES permit is also a Federal permit, which is requiredunder the Clean Water act for discharge of waste into waters of the United States. ODEQ hasbeen delegated authority to issue NPDES permits by the EPA. The WPCF permit is unique to theState of Oregon. As the permits are renewed, they will be revised to insure that all 303(d) relatedissues are addressed in the permit. These permit activities assure that elements of the TMDLWQMP involving urban and industrial pollution problems will be implemented.
For point sources, provisions to address the appropriate waste load allocations (WLAs)will be incorporated into NPDES permits when permits are renewed by ODEQ, typically within 1year after the EPA approves the TMDL. It is likely each point source will be given a reasonabletime to upgrade, if necessary, to meet its new permit limits. A schedule developing information tomeet waste load allocations will be established in a Mutual Agreement Order (MAO). Adherenceto permit conditions is required by State and Federal Law and ODEQ has the responsibility toensure compliance.
The NPDES permits for the single wastewater treatment plant (City of Chiloquin) withwasteload allocations, will be revised to address the WLAs. The general NPDES permits withinthe subbasin will also be revised to address the appropriate WLAs.
6.3.7.2 Nonpoint Sources
State ForestryThe Oregon Department of Forestry (ODF) is the designated management agency for
regulation of water quality on non-federal forest lands. The Board of Forestry has adopted waterprotection rules, including but not limited to OAR Chapter 629, Divisions 635-660, which describeBMPs for forest operations. These rules are implemented and enforced by ODF and monitored toassure their effectiveness. The Environmental Quality Commission, Board of Forestry, ODEQ,and ODF have agreed that these pollution control measurers will be relied upon to result inachievement of state water quality standards. ODF provides on the ground field administration ofthe Forest Practices Act (FPA). For each administrative rule, guidance is provided to fieldadministrators to insure proper, uniform and consistent application of the Statutes and Rules. TheFPA requires penalties, both civil and criminal, for violation of Statutes and Rules. Additionally,whenever a violation occurs, the responsible party is obligated to repair the damage. For moreinformation, refer to the Management Measures element of this Plan.

UPPER KLAMATH LAKE DRAINAGE TMDL AND WQMPCHAPTER VI – WATER QUALITY MANAGEMENT PLAN
OREGON DEPARTMENT OF ENVIRONMENTAL QUALITY - MAY 2002PAGE 172
ODF and ODEQ are involved in several statewide efforts to analyze the existing FPA measuresand to better define the relationship between the TMDL load allocations and the FPA measures designedto protect water quality. Although the analysis and modeling in the TMDL demonstrate that increasedlevels of shade on many of the forested stream reaches in the subbasin would decrease solar loadingand potentially lower maximum daily stream temperatures, insufficient information exists to determine ifspecific FPA revisions will be necessary to meet the TMDL load allocations. The information in theTMDL, as well as other monitoring data, will be an important part of the body of information used indetermining the adequacy of the FPA.
As the DMA for water quality management on nonfederal forestlands, the ODF is also workingwith the ODEQ through a memorandum of understanding (MOU) signed in June of 1998. This MOU wasdesigned to improve the coordination between the ODF and the ODEQ in evaluating and proposingpossible changes to the forest practice rules as part of the Total Maximum Daily Load process. Thepurpose of the MOU is also to guide coordination between the ODF and ODEQ regarding water qualitylimited streams on the 303d list. An evaluation of rule adequacy will be conducted (also referred to as a“sufficiency analysis”) through a water quality parameter by parameter analysis. This statewidedemonstration of forest practices rule effectiveness in the protection of water quality will address thefollowing specific parameters and will be conducted in the following order:
1) Temperature2) Sediment and turbidity3) Aquatic habitat modification4) Bio-criteria5) Other parameters
These sufficiency analyses will be reviewed by peers and other interested parties prior to finalrelease. The analyses will be designed to provide background information and assessments of BMPeffectiveness in meeting water quality standards. Once the sufficiency analyses are completed, they willbe used as a coarse screen for common elements applicable to each individual TMDL to determine ifforest practices are contributing to water quality impairment within a given watershed and to support theadaptive management process.Currently ODF and DEQ do not have adequate data to make a collective determination on the sufficiencyof the current FPA BMPs in meeting water quality standards within the UKLDB. This situation mostclosely resembles the scenario described under condition c of the ODF/ODEQ MOU. Therefore, thecurrent BMPs will remain as the forestry component of the TMDL. The draft versions of the statewideFPA sufficiency analyses for the various water quality parameters will be completed as noted above. Theproposed UKLDB TMDLs will be completed in 2002. Data from an ODF/ODEQ shade study wascollected over the summer of 1999 and a final report will be completed in the summer of 2001, andinformation from the forest practices ad hoc committee advisory process is currently available. Informationfrom these efforts, along with other relevant information provided by the ODEQ, will be considered inreaching a determination on whether the existing FPA BMPs meet water quality standards within theUKLDB.
AgricultureIt is the Oregon Department of Agriculture’s (ODA) statutory responsibility to develop agricultural
water quality management (AWQM) plans and enforce rules that address water quality issues onagricultural lands. The AWQM Act directs ODA to work with local farmers and ranchers to develop waterquality management area plans for specific watersheds that have been identified as violating water qualitystandards and having agriculture water pollution contributions. The agriculture water quality managementarea plans are expected to identify problems in the watershed that need to be addressed and outlineways to correct those problems. These water quality management plans are developed at a local level,reviewed by the State Board of Agriculture, and then adopted into the Oregon Administrative Rules. It isthe intent that these plans focus on education, technical assistance, and flexibility in addressing
UPPER KLAMATH LAKE DRAINAGE TMDL AND WQMPCHAPTER VI – WATER QUALITY MANAGEMENT PLAN
OREGON DEPARTMENT OF ENVIRONMENTAL QUALITY - MAY 2002PAGE 173
agriculture water quality issues. These plans and rules will be developed or modified to achieve waterquality standards and will address the load allocations identified in the TMDL. In those cases when anoperator refuses to take action, the law allows ODA to take enforcement action. ODEQ will work withODA to ensure that rules and plans meet load allocations.
Recognizing the adopted rules need to be quantitatively evaluated in terms of load allocations inthe TMDL and pursuant to the June 1998 Memorandum of Agreement between ODA and ODEQ, theagencies will conduct a technical evaluation commencing in late 2000. The agencies will establish therelationship between the plan and its implementing rules and the load allocations in the TMDL todetermine if the rules provide reasonable assurance that the TMDLs will be achieved. The AWQMALocal Advisory Committee (LAC) will be apprised and consulted during this evaluation. This adaptivemanagement process provides for review of the AWQMA plan to determine if any changes are needed tothe current AWQMA rules specific to the UKLDB.
Oregon Department of TransportationThe Oregon Department of Transportation (ODOT) has been issued an NPDES MS4 waste
discharge permit. Included with ODOT’s application for the permit was a surface water managementplan which has been approved by ODEQ and which addresses the requirements of a Total MaximumDaily Load (TMDL) allocation for pollutants associated with the ODOT system. Both ODOT and ODEQagree that the provisions of the permit and the surface water management plan will apply to ODOT’sstatewide system. This statewide approach for an ODOT TMDL watershed management plan addressesspecific pollutants, but not specific watersheds. Instead, this plan demonstrates how ODOT willincorporate water quality protection into project development, construction, and operations andmaintenance of the state and federal transportation system that is managed by ODOT, thereby meetingthe elements of the National Pollutant Discharge Elimination System (NPDES) program, and the TMDLrequirements.
The MS4 permit and the plan:
• Streamlines the evaluation and approval process for the watershed management plans• Provides consistency to the ODOT highway management practices in all TMDL watersheds.• Eliminates duplicative paperwork and staff time developing and participating in the numerous TMDL
management plans.
Temperature and sediment are the primary concerns for pollutants associated with ODOTsystems that impair the waters of the state. ODEQ is still in the process of developing the TMDL waterbodies and determining pollutant levels that limit their beneficial uses. As TMDL allocations areestablished by watershed, rather than by pollutants, ODOT is aware that individual watersheds may havepollutants that may require additional consideration as part of the ODOT watershed management plan.When these circumstances arise, ODOT will work with DEQ to incorporate these concerns into thestatewide plan.
Federal Forest LandsAll management activities on federal lands managed by the U.S. Forest Service (USFS) and the
Bureau of Land Management must follow standards and guidelines (S&Gs) as listed in the respectiveLand Use and Management Plans (LRMPs), as amended, for the specific land management units. TheWQMPs for USFS and BLM are anticipated to outline BMPs to achieve water quality standards andaddress the nonpoint Load Allocations.
In response to environmental concerns and litigation related to timber harvest and otheroperations on Federal Lands, the United States Forest Service (USFS) and the Bureau of LandManagement (BLM) commissioned the Forest Ecosystem Management Assessment Team (FEMAT) toformulate and assess the consequences of management options. The assessment emphasizesproducing management alternatives that comply with existing laws and maintaining the highest

UPPER KLAMATH LAKE DRAINAGE TMDL AND WQMPCHAPTER VI – WATER QUALITY MANAGEMENT PLAN
OREGON DEPARTMENT OF ENVIRONMENTAL QUALITY - MAY 2002PAGE 174
contribution of economic and social well being. The “backbone” of ecosystem management is recognizedas constructing a network of late-successional forests and an interim and long-term scheme that protectsaquatic and associated riparian habitats adequate to provide for threatened species and at risk species.Biological objectives of the Northwest Forest Plan include assuring adequate habitat on Federal lands toaid the “recovery” of late-successional forest habitat-associated species listed as threatened under theEndangered Species Act and preventing species from being listed under the Endangered Species Act.
Urban and Rural SourcesResponsible participants for implementing DMA specific water quality management plans for
urban and rural sources were identified in Chapter 5 of this Water Quality Management Plan. Uponapproval of the UKLD TMDLs, it is ODEQ’s expectation that identified, responsible participants willdevelop, submit to DEQ, and implement individual water quality management plans that will achieve theload allocations established by the TMDLs. These activities will be accomplished by the responsibleparticipants in accordance with the Schedule in Chapter 7 of this Water Quality Management Plan. TheDMA specific water quality implementation plans must address the following items:
1) Proposed management measures tied to attainment of the load allocations and/or establishedsurrogates of the TMDLs, such as vegetative site potential for example.2) Timeline for implementation.3) Timeline for attainment of load allocations.4) Identification of responsible participants demonstrating who is responsible for implementing the variousmeasures.5) Reasonable assurance of implementation.6) Monitoring and evaluation, including identification of participants responsible for implementation ofmonitoring, and a plan and schedule for revision of implementation plan.7) Public involvement.8) Maintenance effort over time.9) Discussion of cost and funding.10) Citation of legal authority under which the implementation will be conducted.
Should any responsible participant fail to comply with their obligations under this WQMP, theDepartment will take all necessary action to seek compliance. Such action will first include negotiation,but could evolve to issuance of Department or Commission Orders and other enforcement mechanisms.
The Oregon PlanThe Oregon Plan for Salmon and Watersheds represents a major effort, unique to Oregon, to
improve watersheds and restore endangered fish species. The Oregon Plan is a major component of thedemonstration of “ reasonable assurance “ that this TMDL WQMP will be implemented.
The Plan consists of four essential elements:
Coordinated Agency Programs:Many state and federal agencies administer laws, policies, and management programs that have animpact on salmon and water quality. These agencies are responsible for fishery harvest management,production of hatchery fish, water quality, water quantity, and a wide variety of habitat protection,alteration, and restoration activities. Previously, agencies conducted business independently. Waterquality and salmon suffered because they were affected by the actions of all the agencies, but no singleagency was responsible for comprehensive, life-cycle management. Under the Oregon Plan, allgovernment agencies that impact salmon are accountable for coordinated programs in a manner that isconsistent with conservation and restoration efforts.
Community-Based Action:Government, alone, cannot conserve and restore salmon across the landscape. The Oregon Planrecognizes that actions to conserve and restore salmon must be worked out by communities and

UPPER KLAMATH LAKE DRAINAGE TMDL AND WQMPCHAPTER VI – WATER QUALITY MANAGEMENT PLAN
OREGON DEPARTMENT OF ENVIRONMENTAL QUALITY - MAY 2002PAGE 175
landowners, with local knowledge of problems and ownership in solutions. Watershed councils, soil andwater conservation districts, and other grassroots efforts are vehicles for getting the work done.Government programs will provide regulatory and technical support to these efforts, but local people willdo the bulk of the work to conserve and restore watersheds. Education is a fundamental part of thecommunity based action. People must understand the needs of salmon in order to make informeddecisions about how to make changes to their way of life that will accommodate clean water and theneeds of fish.
Monitoring:The monitoring program combines an annual appraisal of work accomplished and results achieved. Workplans will be used to determine whether agencies meet their goals as promised. Biological and physicalsampling will be conducted to determine whether water quality and salmon habitats and populationsrespond as expected to conservation and restoration efforts.
Appropriate Corrective Measures:The Oregon Plan includes an explicit process for learning from experience, discussing alternativeapproaches, and making changes to current programs. The Plan emphasizes improving compliance withexisting laws rather than arbitrarily establishing new protective laws. Compliance will be achievedthrough a combination of education and prioritized enforcement of laws that are expected to yield thegreatest benefits for salmon.
Voluntary MeasuresThere are many voluntary, non-regulatory, watershed improvement programs (Actions) that are in
place and are addressing water quality concerns in the UKLDB. Both technical expertise and partialfunding are provided through these programs. Examples of activities promoted and accomplishedthrough these programs include: planting of conifers, hardwoods, shrubs, grasses and forbs alongstreams; relocating legacy roads that may be detrimental to water quality; replacing problem culverts withadequately sized structures, and improvement/ maintenance of legacy roads known to cause waterquality problems. These activities have been and are being implemented to improve watersheds andenhance water quality. Many of these efforts are helping resolve water quality related legacy issues.
Landowner Assistance ProgramsA variety of grants and incentive programs are available to landowners in the UKDB. These
incentive programs are aimed at improving the health of the watershed, particularly on private lands.They include technical and financial assistance, provided through a mix of state and federal funding.Local natural resource agencies administer this assistance, including the Oregon Department of Forestry,the Oregon Department of Fish and Wildlife, ODEQ, Klamath Basin Ecosystem Restoration Office, theNational Resources Conservation Service, Bureau of Reclamation, National Wildlife Foundation, SmallBusiness Administration, Oregon Watershed Enhancement Board, Oregon State University AgricultureExtension Service, Klamath Watershed Council, Klamath County Soil and Water Conservation District,and the Klamath Basin Ecosystem Foundation.
Field staff from the administrative agencies provide technical assistance and advice to individuallandowners, watershed councils, local governments, and organizations interested in enhancing theUKDB. These services include on-site evaluations, technical project design, stewardship/conservationplans, and referrals for funding as appropriate. This assistance and funding is further assurance ofimplementation of the TMDL WQMP.
Financial assistance is provided through a mix of cost-share, tax credit, and grant fundedincentive programs designed to improve on-the-ground watershed conditions. Some of these programs,due to source of funds, have specific qualifying factors and priorities. Cost share programs include theForestry Incentive Program (FIP), Stewardship Incentive Program (SIP), Environmental Quality IncentivesProgram (EQIP), and the Wildlife Habitat Incentive Program (WHIP).

UPPER KLAMATH LAKE DRAINAGE TMDL AND WQMPCHAPTER VI – WATER QUALITY MANAGEMENT PLAN
OREGON DEPARTMENT OF ENVIRONMENTAL QUALITY - MAY 2002PAGE 176
6.3.8 Monitoring and EvaluationMonitoring and evaluation has two basic components: 1. implementation of DMA specific water
quality management plans identified in this document and 2. Physical, chemical and biologicalparameters for water quality and specific management measures. This information will provideinformation on progress being made toward achieving TMDL allocations and achieving water qualitystandards and to use as we evaluate progress as described under Adaptive Management in Chapter 1:Introduction.
The information generated by each of the agencies/entities gathering data in the UKLDB will bepooled and used to determine whether management actions are having the desired effects or if changesin management actions and/or TMDLs are needed. This detailed evaluation will typically occur on a 5year cycle. If progress is not occurring then the appropriate management agency will be contacted with arequest for action.
The objectives of this monitoring effort are to demonstrate long-term recovery, better understandnatural variability, track implementation of projects and BMPs, and track effectiveness of TMDLimplementation. This monitoring and feedback mechanism is a major component of the “reasonableassurance of implementation” for the UKDBTMDL-WQMP
This WQMP will be tracked by accounting for the numbers, types, and locations of projects,BMPs, educational activities, or other actions taken to improve or protect water quality. The mechanismfor tracking DMA implementation efforts will be annual reports to be submitted to ODEQ.
6.3.9 Public InvolvementTo be successful at improving water quality a TMDL WQMP must include a process to involve
interested and affected stakeholders in both the development and the implementation of the plan. Inaddition to the ODEQ public notice policy and public comment periods associated with TMDLs and permitapplications, future UKLDB TMDL public involvement efforts will focus specifically on urban, agriculturaland forestry activities. DMA-specific public involvement efforts will be detailed within the ImplementationPlans included in the appendices.
6.3.10 Costs and FundingDesignated Management Agencies will be expected to provide a fiscal analysis of the resources
needed to develop, execute and maintain the programs described in their Implementation Plans.
The purpose of this element is to describe estimated costs and demonstrate there is sufficientfunding available to begin implementation of the WQMP. Another purpose is to identify potential futurefunding sources for project implementation. There are many natural resource enhancement efforts andprojects occurring in the subbasin which are relevant to the goals of the plan. These efforts, in addition toproposed future actions are described in the Management Measurers element of this Plan.
UPPER KLAMATH LAKE DRAINAGE TMDL AND WQMPCHAPTER VI – WATER QUALITY MANAGEMENT PLAN
OREGON DEPARTMENT OF ENVIRONMENTAL QUALITY - MAY 2002PAGE 177
6.3.11 Potential Sources of Project FundingFunding is essential to implementing projects associated with this WQMP. There are many
sources of local, state, and federal funds. The following is a partial list of assistance programs availablein the UKLDB.
Program Agency/SourceOregon Plan for Salmon and Watersheds OWEBEnvironmental Quality Incentives Program USDA-NRCSWetland Reserve Program USDA-NRCSConservation Reserve Enhancement Program USDA-NRCSStewardship Incentive Program ODFAccess and Habitat Program ODFWPartners for Wildlife Program USDI-FSAConservation Implementation Grants ODAWater Projects WRDNonpoint Source Water Quality Control (EPA 319) ODEQ-EPARiparian Protection/Enhancement COEOregon Community Foundation OCFKlamath Basin Ecosystem Restoration UFWSBureau of Reclamation USBRWater Resources Program BIANational Wildlife Foundation NWFSmall grants program KSWCDJobs-in-the-Wods KEROPartners for Fish and Wildlife KEROHatfield Funds KERO
Grant funds are available for improvement projects on a competitive basis. Field agencypersonnel assist landowners in identifying, designing, and submitting eligible projects for these grantfunds. For private landowners, the recipient and administrator of these grants is generally the local Soiland Water Conservation District. Grant fund sources include:
Oregon Watershed Enhancement Board (OWEB) which funds watershed improvement projects withstate money. This is an important piece in the implementation of Oregon's Salmon Plan. Current and pastprojects have included road relocation/closure/improvement projects, in-stream structure work, riparianfencing and revegetation, off stream water developments, and other management practices.USFWS Klamath Basin Ecosystem Restoration Office funds are federal funds for fish habitat andwater quality improvement projects. These have also included projects addressing road conditions,grazing management, aquatic habitiat restoration, water quality retoration, and wetland restoration .Individual grant sources for special projects have included Forest Health money available through theState and Private arm of the USDA Forest Service.
6.3.12 Citation to Legal Authorities
6.3.12.1 Clean Water Act Section 303(d)Section 303(d) of the 1972 federal Clean Water Act as amended requires states to develop a list
of rivers, streams and lakes that cannot meet water quality standards without application of additionalpollution controls beyond the existing requirements on industrial sources and sewage treatment plants.Waters that need this additional help are referred to as “water quality limited” (WQL). Water qualitylimited waterbodies must be identified by the Environmental Protection Agency (EPA) or by a state
UPPER KLAMATH LAKE DRAINAGE TMDL AND WQMPCHAPTER VI – WATER QUALITY MANAGEMENT PLAN
OREGON DEPARTMENT OF ENVIRONMENTAL QUALITY - MAY 2002PAGE 178
agency which has been delegated this responsibility by EPA. In Oregon, this responsibility rests with theODEQ. The ODEQ updates the list of water quality limited waters every two years. The list is referred toas the 303(d) list. Section 303 of the Clean Water Act further requires that Total Maximum Daily Loads(TMDLs) be developed for all waters on the 303(d) list. A TMDL defines the amount of pollution that canbe present in the waterbody without causing water quality standards to be violated. An WQMP isdeveloped to describe a strategy for reducing water pollution to the level of the load allocations and wasteload allocations prescribed in the TMDL, which is designed to restore the water quality and result incompliance with the water quality standards. In this way, the designated beneficial uses of the water willbe protected for all citizens.
The Oregon Department of Environmental Quality is authorized by law to prevent and abatewater pollution within the State of Oregon pursuant to the following statute:
ORS 468B.020 Prevention of pollution (1) Pollution of any of the waters of the state is declared to benot a reasonable or natural use of such waters and to be contrary to the public policy of the State orOregon, as set forth in ORS 468B.015.
(2) In order to carry out the public policy set forth in ORS 468B.015, the department shall take suchaction as is necessary for the prevention of new pollution and the abatement of existing pollution by:
(a) Fostering and encouraging the cooperation of the people, industry, cities and counties, in order toprevent, control and reduce pollution of the waters of the state; and
(b) Requiring the use of all available and reasonable methods necessary to achieve the purposes ofORS 468B.015 and to conform to the standards of water quality and purity established under ORS468B.048.
6.3.12.2 NPDES and WPCF Permit ProgramsThe ODEQ administers two different types of wastewater permits in implementing Oregon
Revised Statute (ORS) 468B.050. These are: the National Pollution Discharge Elimination System(NPDES) permits for waste discharge; and Water Pollution Control Facilities (WPCF) permits for wastedisposal. The NPDES permit is also a Federal permit and is required under the Clean Water Act. TheWPCF permit is a state program. As permits are renewed they will be revised to insure that all 303(d)related issues are addressed in the permit.
6.3.12.3 Oregon Administrative RulesThe following Oregon Administrative Rules provide numeric and narrative criteria for parameters ofconcern in the UKLDB:
Standard/Criteria of Concern: Nuisance Phytoplankton GrowthApplicable Rules: OAR 340-41-150
TMDL Parameter: pHApplicable Rules: OAR 340-41-965 (1) (d)
TMDL Parameter: TemperatureApplicable Rules: OAR 340-41-026(3)(a)(D)
OAR 340-41-006(54) and (55)OAR 340-41-965 (1) (b)
TMDL Parameter: Dissolved OxygenApplicable Rules: OAR 340-041-965 (1) (a)
UPPER KLAMATH LAKE DRAINAGE TMDL AND WQMPCHAPTER VI – WATER QUALITY MANAGEMENT PLAN
OREGON DEPARTMENT OF ENVIRONMENTAL QUALITY - MAY 2002PAGE 179
6.3.12.4 Oregon Forest Practices ActThe Oregon Department of Forestry (ODF) is the designated management agency for regulation
of water quality on non-federal forest lands. The Board of Forestry has adopted water protection rules,including but not limited to OAR Chapter 629, Divisions 635-660, which describes BMPs for forestoperations. The Environmental Quality Commission (EQC), Board of Forestry, ODEQ and ODF haveagreed that these pollution control measurers will be relied upon to result in achievement of state waterquality standards.
ODF and ODEQ statutes and rules also include provisions for adaptive management that providefor revisions to FPA practices where necessary to meet water quality standards. These provisions aredescribed in ORS 527.710, ORS 527.765, ORS 183.310, OAR 340-041-0026, OAR 629-635-110, andOAR 340-041-0120.
6.3.12.5 Senate Bill 1010The Oregon Department of Agriculture has primary responsibility for control of pollution from
agriculture sources. This is accomplished through the Agriculture Water Quality Management (AWQM)program authorities granted ODA under Senate Bill 1010 Adopted by the Oregon State Legislature in1993. The AWQM Act directs the ODA to work with local farmers and ranchers to develop water qualitymanagement plans for specific watersheds that have been identified as violating water quality standardsand have agriculture water pollution contributions. The agriculture water quality management plans areexpected to identify problems in the watershed that need to be addressed and outline ways to correct theproblems.
6.3.12.6 Oregon Department of TransportationThe Oregon Department of Transportation (ODOT) plan addresses the requirements of a Total
Maximum Daily Load (TMDL) allocation for pollutants associated with the ODOT system. This statewideapproach for an ODOT TMDL watershed management plan would address specific pollutants, but notspecific watersheds. Instead, this plan would demonstrate how ODOT incorporates water quality intoproject development, construction, and operations and maintenance of the state and federaltransportation system, thereby meeting the elements of the National Pollutant Discharge EliminationSystem (NPDES) program, and the TMDL requirements.
ODOT has partnered with ODEQ in the development of several watershed management plans.By presenting a single, statewide, management plan, ODOT:
• Streamlines the evaluation and approval process for the watershed management plans• Provides consistency to the ODOT highway management practices in all TMDL watersheds.• Eliminates duplicative paperwork and staff time developing and participating in the numerous TMDL
management plans.
Temperature and sediment are the primary concerns for pollutants associated with ODOTsystems that impair the waters of the state. ODEQ is still in the process of developing the TMDL waterbodies and determining pollutant levels that limit their beneficial uses. As TMDL allocations areestablished by watershed, rather than by pollutants, ODOT is aware that individual watersheds may havepollutants that may require additional consideration as part of the ODOT watershed management plan.When these circumstances arise, ODOT will work with ODEQ to incorporate these concerns into thestatewide plan
6.3.12.7 Local OrdinancesWithin the Implementation Plans in the appendices, the DMAs are expected to describe their
specific legal authorities to carry out the management measures they choose to meet the TMDLallocations. Legal authority to enforce the provisions of a City’s NPDES permit would be a specificexample of legal authority to carry out management measures.


UPPER KLAMATH LAKE DRAINAGE TMDL AND WQMPACRONYM LIST
OREGON DEPARTMENT OF ENVIRONMENTAL QUALITY - MAY 2002PAGE 181
ACRONYM LISTBLM – Bureau of Land Management
CFR - Code of Federal Regulations
cfs - cubic feet per second
CWA - Clean Water Act
DEM - Digital Elevation Model
DEQ - Department of Environmental Quality(Oregon)
DOQ - Digital Orthophoto Quad
DOQQ - Digital Orthophoto Quarter Quad
EPA - (United States) EnvironmentalProtection Agency
FLIR - Forward Looking Infrared Radiometry
HUC - Hydrologic Unit Code
LA - Load Allocation
LC - Loading Capacity
NSDZ - Near-Stream Disturbance Zone
OAR - Oregon Administrative Rules
ODA - Oregon Department of Agriculture
ODEQ - Oregon Department ofEnvironmental Quality
ODF - Oregon Department of Forestry
ODFW - Oregon Department of Fish andWildlife
OWRD - Oregon Water ResourcesDepartment
R2 – Correlation coefficient
RM - River Mile
SE - Standard Error
TMDL - Total Maximum Daily Load
USBR (US BOR) - United States Bureau ofReclamation
US COE - United States Army Corps ofEngineers
USDA - United States Department ofAgriculture
USFS - United States Forest Service
USGS - United States Geological Survey
W:D - Width to Depth (ratio)
WLA - Waste Load Allocation
WQS - Water Quality Standard
WWTP - Waste Water Treatment Plant

OREGON DEPARTMENT OF ENVIRONMENTAL QUALITY - MAY 2002PAGE 182PAGE 182

UPPER KLAMATH LAKE DRAINAGE TMDL AND WQMPBIBLIOGRAPHY
OREGON DEPARTMENT OF ENVIRONMENTAL QUALITY - MAY 2002PAGE 183
BIBLIOGRAPHYAndersen, J.K. 1998. A management model for determining optimal watershed managementstrategies for reducing lake total phosphorous concentrations: application to Upper Klamath Lake,Oregon. Masters Thesis. Humbolt State University, Arcata California.
Barbiero, R.P., and J. Kann. 1994. The importance of benthic resrutment to the populationdevelopment of Aphanizomenon flos-aquae and internal loading in a shallow lake. J. PlanktonRes. 16: 1581-1588.
Behnke, R.B. 1992. Native Trout of Western North America, Amer. Fish. So. Mono. 6, Amer.Fish. Society, Bethesda, Maryland.
Bell, M.C. 1986. Fisheries handbook of engineering requirements and biological criteria. FishPassage Development and Evaluation Program, U. S. Army Corps of Engineers, North PacificDivision. Portland, Oregon, 290 pp.
Beschta, R.L, R.E. Bilby, G.W. Brown, L.B. Holtby, and T.D. Hofstra. 1987. Streamtemperature and aquatic habitat: Fisheries and Forestry Interactions. Pp. 191-232. In: E.O. Saloand T.W. Cundy (eds), Streamside Management: Forestry and Fishery Interactions. University ofWashington, Institute of Forest Resources, Contribution No. 57. 471 pp.
Bortleson, G. C. and M.O. Fretwell. 1993. A review of possible causes of nutrient enrichmentand decline of endangered sucker populations in Upper Klamath Lake, Oregon. U.S. GeologicalSurvey, Water-Resources Investigations Report 93-4087.
Bothwell, M. L. 1985. Phosphorus Limitation of Lotic Periphyton Growth Rates: An IntersiteComparison Using Continuous Flow Troughs (Thompson River System, British Columbia. Limnol.Ocean. 30(3).
Bothwell, M. L. 1989. Phosphorus-Limited Growth Dynamics of Lotic Periphyton DiatonCommunities: Areal Biomass and Cellular Growth Rate Response. Can. J. Fish. Aquatic. Sci. 46:pp. 1291-1301.
Bothwell, M. L. 1992. Eutrophication of Rivers by Nutrients in Treated Kraft Pulp Mill Effluent.Water Poll Res J Canada., V27 No. 3, pp. 447-472.
Boyd, M.S. 1996. Heat Source: stream temperature prediction. Master’s Thesis. Departmentsof Civil and Bioresource Engineering, Oregon State University, Corvallis, Oregon.
BRD (Biological Resource Division of USGS). 1996. Upper Klamath Lake Fish Kill – 8 Augustto 3 October 1996. BRD Field Station Study Bulletin No. 96-2. October 21, 1996.
Brett, J.R. 1952. Temperature Tolerance in Young Pacific Salmon, Genus Oncorhynchus. J.Fish. Res. Bd. Can., 9(6):265-323.
Brown, G.W. 1969. Predicting temperatures of small streams. Water Resour. Res. 5(1):68-75.
Carpenter, S.R., N.F. Caraco, D.L. Corell, R.W. Howarth, A.N. Sharpley, and V.H. Smith.1998. Nonpoint pollution of surface waters with nitrogen and phosphorous. Issues in Ecology.Number 3. Ecological Society of America, Washington, D.C.
Carpenter, S.R., and K.L. Cottingham. 1997. Resilience and restoration of lakes.Conservation Ecology 1(1): 2-19.
Chapra, S.C. 1997. Surface Water-Quality Modeling. WCB McGraw-Hill, pp. 884.
Cooke, G.D., E.B. Welch, S. Petersen, and P. Newroth. 1993. Restoration and managementof lakes and reservoirs. Lewis Publishers, Boca Raton, Fla.
UPPER KLAMATH LAKE DRAINAGE TMDL AND WQMPBIBLIOGRAPHY
OREGON DEPARTMENT OF ENVIRONMENTAL QUALITY - MAY 2002PAGE 184PAGE 184
Cope, E.D. 1879. The fishes of Klamath Lake, Oregon. Amer. Nat. 13:784-785.
Correll, D.L., Jordan, T.E. and Weller, D.E. 1992. Nutrient flux in a landscape: effects ofcoastal land use and terrestrial community mosaic on nutrient transport to coastal waters.Estuaries 15:431-442.
CSRI (Coastal Salmon Recovery Initiative). 1997. State Agency Measures.
Daly, C.., Neilson, R.P., and Phillips, D.L. 1994. A statistical topographic model for mappingclimatological precipitation over mountainous terrain. J. App. Metero. V.33, pp. 140-158.
Daly, C., Taylor, G.H., and Gibson, W.P. 1997. The PRISM aproach to mapping precipitationand temperature, in Conference on Applied Climatology, 10th , Reno, Nevada October 1997,Proceedings, Amemr Metero. Soc. Pp. 10-12 1994.
DeNicola, D.M. 1996. Algal Ecology – Freshwater Benthic Ecosystems. Edited by Stevenson,R.J., M.L. Bothwell, R.L. Lowe. Academic Press Inc., pp. 150-176.
Di Torro, D. M. 1981. Algae and Dissolved Oxygen. Summer Institute in Water Pollution Control,Manhattan College, pp. 3-99.
Eilers, J., J. Kann, J. Cornet, K. Moser, A.St. Amand, and C. Gubala. 2001. Recentpaleolimnology of Upper Klalath Lake, Oregon. Prepared for the U. S. Bureau of Reclamation,Klamath Falls, Oregon. Prepared by JC Headwaters, Inc., Roseburg, Oregon.
Eppley, R.W. 1972. Temperature and Phytoplankton Growth in the Sea. Fish Bull. 70. Pp. 1063-1085. (As reported in USEPA Document, 1986).
Faux, R. N., P. Maus, C. Torgersen, and M. Boyd. 2001. Airborne Thermal Infrared (TIR)Remote Sensing Application to USDA USFS Stream Temperature Monitoring Programs: NewApproaches for monitoring thermal variability. USFS Remote Sensing Applications Center, SaltLake City, Utah.
Fry, B. 1999. Using Stable Isotopes to Monitor Watershed Influences on aquatictrophodynamics. Can. J. Fish. Aquat. Sci. 56:2167-2171.
Gearheart, R. A., J.K. Anderson, M.G. Forbes, M. Osburn, and D. Oros. 1995. Watershedstrategies for improving water quality in Upper Klamath Lake, Oregon - Volumes I, II and III.Humbolt State University, August 1995.
Geiger, N.S. 2001. Reassociating wetlands with Upper Klamath Lake to improve water quality.Shapiro and Associates, Inc. Portland, Oregon.
Gilbert C.H. 1898. The fishes of Klamath Basin. Bull. U.S. Fish. Comm. 17(1897):I-13.
Gregory, S.V., G.A. Lambaerti, D.C. Erman, K.V. Koski, M.L. Murphy and J.R. Sedell. 1987.Influences of forest practices on aquatic production. In: E.O. Salo and T.W. Cundy (eds),Streamside Management: Forestry and Fishery Interactions. University of Washington, Instituteof Forest Resources, Contribution.
Hathaway, R.L. and R. Todd. 1993. Wood River sub-basin water quality as related to land useassociated with forest and livestock grazing. Oregon State University. Extension Service,Klamath County Office.
Heath A.G. and G.M. Hughes. 1973. Cardiovascular and respiratory changes during heatstress in rainbow trout (Salmo gairneri). J. Exp. Biol., 59:323-338.
Hogan, J.W. 1970. Water temperature as a source of variation in specific activity of brainacetylcholinesterase of bluegills. Bull. Environment. Contam. Toxicol., 5:347-353.
Hokanson, K., C.F. Kleiner and T.W. Thorslund. 1977. Effects of Constant Temperatures andDiel Temperature Fluctuations on Specific Growth and Mortality Rates and Yield of JuvenileRainbow Trout, Salmo gairdneri. J. Fish. Res. Bd. Can., 34:639-648.
UPPER KLAMATH LAKE DRAINAGE TMDL AND WQMPBIBLIOGRAPHY
OREGON DEPARTMENT OF ENVIRONMENTAL QUALITY - MAY 2002PAGE 185PAGE 185
Holaday, S.A. 1992. Summertime water temperature trends in Steamboat Cr. Basin, UmpquaNational Forest. Master’s Thesis. Department of Forest Engineering, Oregon State University,Corvallis, Oregon.
Horner, R.R., E.B. Welch and R.B. Veenstra. 1983. Development of nuisance periphytic algaein laboratory streams in relation to enrichment and velocity. Periphyton of FreshwaterEcosystems, Wetzel, R.G. (ed.), Dr W. Junk Publishers, The Hague.
Howe C.B. 1968. Ancient tribes of the Klamath country, Binfords and Mort, Portland, Oregon.252 pp.
Illian J.R. 1970. Interim report on the ground water in Klamath Basin Oregon. Issued by ChrisL. Wheeler, State Engineer, Salem, Oregon.
Jacoby, J.M., D.D. Lynch, E.B. Welch, and M.A. Perkins. 1982. Internal phosphorous loadingin a shallow hypereutrophic lake. Water. Res. 16:911-919.
Johnson, D.M., R.R. Petersen, D.R. Lycan, and J.W. Sweet. 1985. Atlas of Oregon Lakes.Oregon State University Press, Corvallis, Oregon. 317 pp.
Kann, J. 2000. Upper Klamath Lake Water Quality Database, 1990-2000: Prepared for KlamathTribes Natural Resources Department and USBR Cooperative Studies. Electronic Excel fileUKL1990-1998.xls
Kann, J. and W. Walker. 2001. Nutrient and hydrologic loading to Upper Klamath Lake, Oregon1991-1998. Prepared for the Bureau of Reclamation, Klamath Falls, Oregon.
Kann, J. 1998. Ecology and water quality dynamics of a shallow hypereutrophic lake dominatedby Cyanobacteria (Aphanizomenon flos-aquae). Doctoral dissertation. University of NorthCarolina, Curriculum in Ecology, Chapel Hill, North Carolina.
Kann, J., and V.H. Smith. 1993. Chlorophyll as a predictor of elevated pH in a hypertrophic lake:Estimating the probability of exceeding critical values for fish success. Klamath Tribes ResearchReport. KT-93-02. The Klamath Tribes, Chiloquin, Oregon.Kann, J. 1993. Limnological trends in Agency Lake, Oregon – 1992. Pp. 91-137 in S.GCampbell, editor. Environmental research in the Klamath Basin, Oregon – 1992 Annual ReportBureau of Reclamation Technical Report R-93-16.
Kann. J. 1992. Agency Lake Limnology. Pages 91-137 In: C. Campbell (ed.) Environmentalresearch in the Klamath Basin, Oregon – 1992 Annual Report Bureau of Reclamation TechnicalReport R-93-16.
Laenen, A., and A.P. LeTourneau. 1996. Upper Klamath Basin Nutrient-Loading Study -Estimate of wind-induced resuspension of bed sediment during periods of low lake elevation.U.S. Gelogical Survey. Open-File Report 95-414. Portland, OR.. 21:139-162.
Lamberti, G. A., L. R. Ashkenas, and S. V. Gregory, 1987. Effects of three herbivors onperiphyton communities in laboratory streams. Journal of North American Benthology Society.6(2), pp. 92-104.
Li, H.W., G.L. Lamberti, T.N. Pearsons, C.K. Tait, J.L. Li, and J.C. Buckhouse. 1994.Cumulative effects of riparian disturbance along high desert trout streams of the John Day Basin,Oregon. Am. Fish Soc. 123:627-640.
Logan, D.J. and D. F. Markle. 1993. Fish faunal survey of Agency Lake and northern UpperKlamath Lake, Oregon, In Campbell (ed.) Environmental Research in Klamth Basin, Oregon –1992 Annual Report. U.S. Bureau of Reclamation Technical Report R-93-16. 341 pp.
Lowrance, R., R. Leonard and J. Sheridan. 1985. Managing riparian ecosystems to controlnonpoint pollution. J. Soil Water Conserv. 40:87-91.

UPPER KLAMATH LAKE DRAINAGE TMDL AND WQMPBIBLIOGRAPHY
OREGON DEPARTMENT OF ENVIRONMENTAL QUALITY - MAY 2002PAGE 186PAGE 186
Lowrance, R., R. Todd, J. Fail, O. Hendrickson, R. Leonard and L. Asmussen. 1984.Riparian forests as nutrient filters in agricultural watersheds. BoiScience 34:374-377.
Lowrance, R., R. Todd, and L. Asmussen. 1983. Waterborne nutrient budgets for the riparianzone of an agricultural watershed. Agriculture, Ecosystems and Environment 10:371-384.
Marsden, M.W. 1989. Lake restoration by reducing external phosphorous loading: the influenceof sediment phosphorous release. Freshwater Biology. 21:139-162.
Miller, W.E., and J.C. Tash. 1967. Interim Report. 1967. Interim Report. Upper Klamath LakeStudies, Oregon. Pacific Northwest Water Laboratories. Fed. Water Poll. Cont. Fed. Waterpollution control Research Series. No. WP-20-8.
Mulholland , P. J., A. D. Steinman, A. V. Palumbo, J. W. Elwood, and D. B. Kirschtel (1991).Role of Nutrient Cycling and Herbivory in Regulating Periphyton Communities in LaboratoryStreams. Ecology 72(3), pp. 966-982.
Mulholland , P. J., A. D. Steinman, and J. W. Elwood (1991). Measures of Phosphours UptakeLength in Streams: Comparison of Radiotracer and Stable PO4 Releases. Can. J. Fish. Aquatic.Sci. 47: pp. 2351-2357.
National Research Council. 2002. Scientific Evaluation of Biological Opinions on Endangeredand Threatened Fishes in the Klamath River Basin: Interim Report. Committee on Endangeredand Threatened Fishes in the Klamath River Basin. Board on Environmental Studies andToxicology. Division of Earth and Life Studies. National Academy Press. Washington, D.C.International Standard Book Number 0-309-08324-9.http://www.nap.edu/books/0309083249/html/
O’Connor. 1998. Chemical Reactions and Gas Transfer in Natural Waters. Journal ofEnvironmental Engineering. Feb, pp. 85-93.
Omernick, J.M. 1977. Nonpoint source stream nutrient level relationships: a nationwide study.EPA-600-3-77-105. U.S. Environmental Protection Agency. Corvallis, Oregon.
Oregon Department of Environmental Quality. 2000. Upper Grande Ronde River SubbasinTotal Maximum Daily Load.
Oregon Department of Environmental Quality. 2001a. Umatilla River Subbasin TotalMaximum Daily Load.
Oregon Department of Environmental Quality. 2001b. Tualatin River Subbasin TotalMaximum Daily Load.
Oregon Department of Environmental Quality. 2001c. Tillamook Bay Drainage TotalMaximum Daily Load.
Oregon Department of Environmental Quality. 1998. Water Quality Limited Streams 303(d)List. http://www.deq.state.or.us/wq/303dlist/303dpage.htm.
Oregon Department of Forestry. 1994. The Oregon Forest Practices Program.http://www.odf.state.or.us/FP/.
Tillamook Bay Drainage Total Maximum Daily Load.
Perkins, D.L. , J. Kann and G. Scoppettone. 2000. The role of poor water quality andrepeated fish kills in the decline of endangered Lost River and shortnose suckers in UpperKlamath Lake. U.S. Geological Survey, Biological Division, Western Fisheries science Center,Reno Field Station, Reno, Nevada.
Poff, N.L , et al. 1997. The natural flow regime: a paradigm for river conservation andrestoration. Bioscience 47(11): 769-784.
Powell, M. 1996. Streamboat Creek water quality study, 1996. Colliding Rivers Research, Inc.
UPPER KLAMATH LAKE DRAINAGE TMDL AND WQMPBIBLIOGRAPHY
OREGON DEPARTMENT OF ENVIRONMENTAL QUALITY - MAY 2002PAGE 187PAGE 187
Risley, J.C. and A. Laenen. 1999. Upper Klamath Lake Basin nutrient-loading study –assessment of historic flows in the Williamson and Sprague rivers. U.S. Geological Survey WaterResources Investigation Report 98-4198. 22p.
Rothacher, F. 1970. Increases in water yield following clear-cut logging in the PacificNorthwest: Water Resources Research, vol. 6, no 2, p. 653-658.
Rykbost, K. A. and B. A. Charlton. 2001. Nutrient loading of surface waters in the upperklamath basin: agricultural and natural sources. Agricultural Experiment Station. Oregon SateUniversity. Special Report 1023.
Saiki, M.K. and D. Monda. 1993. Tolerance of juvenile Lost River and shortnose suckers tohigh pH, ammonia concentrations, and temperature, and to low dissolved oxygen concentration.In Environmental Research in the Klamath Basin, Oregon 1992 Annual Report. U.S. Bureau ofReclamation, Denver Office.
Sas, H. 1989. Lake restoration by reduction of nutrient loading. Academia Verlag RicharzGimbh., St. Augustin.
Sawyer, C. N. and P. L McCarty. 1978. Chemistry For Environmental Engineering. McGraw-HillPublishing Company, 3rd Edition.
Simonsen, J. F. and P. Harremoest. 1978. Oxygen and pH fluctuations in Rivers. WaterResearch Vol. 12, pp. 477-489.
Shapiro and Associates, Inc. 2000. Sevenmile canal – Wood River watershed, Klamath CountyOregon: evaluation of nutrient loading sources and options for water quality improvement onprivate and selected public lands. Prepared for Water for Life. Prepared by Shapiro andAssociates, Inc.
Snoeyink V. L. and D. Jenkins. 1980. Water Chemistry. John Wiley & Sons, Inc. New York.
Snyder, D.T. 2001. Nitrogen and Phosphorus Losses from Drained Wetlands Adjacent to UpperKlamath Lake, Oregon. Presented at Klamath Basin Fish and Wildlife Management Symposium.Humboldt State University, Arcata, CA.
Snyder, D.T. and Jennifer L. Morace. 1997. Nitrogen & Phosphorus Loading from DrainedWetlands Adjacent to Upper Klamath and Agency lakes, Oregon, Water-Resources InvestigationsReport 97-4059, U.S. Geological Survey, Portland, Oregon.
Sondergaard, M. 1988. Seasonal variations in the loosely sorbed phosphorous fraction of thesediment of a shallow and hypereutrophic lake. Environ. Geol. Water Sci. 11:115-121.
Stern, T. 1966. The Klamath Tribe. Univ. Wash. Press, Seattle, WA 356 pp.
Stevenson, R.J., M.L. Bothwell, R.L. Lowe. 1996. Algal Ecology, Freshwater BenthicEcosystems. Academic Press, Inc.
Thomann R. V., and J. A. Mueller. 1987. Principles of Surface Water Quality Modeling andControl. Harper and Row, Inc., New York.
Torgersen, C. E., D. M. Price, H. W. Li, and B. A. McIntosh. 1999. Multiscale thermal refugiaand stream habitat associations of chinook salmon in northeastern Oregon. EcologicalApplications 9: 301-319.
Torgersen, C.E., R. Faux, B.A. McIntosh, N. Poage, and D.J. Norton. 2001.Airborne thermal remote sensing for water temperature assessment in riversand streams. Remote Sensing of Environment 76(3): 386-398.
Tsivoglou, E. C. 1967. Tracer measurement of stream reaeration: U.S. Department of theInterior, Federal Water Pollution Control Administration, Washington, D. C., p.86.
Tsivoglou, E.C., and J.R. Wallace. 1972. Characterization of stream reaeration capacity,United States Environmental Protection Agency. Washington, D.C.
UPPER KLAMATH LAKE DRAINAGE TMDL AND WQMPBIBLIOGRAPHY
OREGON DEPARTMENT OF ENVIRONMENTAL QUALITY - MAY 2002PAGE 188PAGE 188
U.S. Army Corps of Engineers. 1982. Upper Klamath Lake, Oregon water resourcesdevelopment project (Potential eutrophication control measures for Upper Klamath Lake,Oregon). Prepared by Entranco Engineers, Bellvue, Washington for USACE San FranciscoDistrict. unpagninated.
U.S. Army Corps of Engineers (USACE). 1979. Klamath River Basin, Oregon reconnaissancereport USACE, San Francisco District, San Fransisco, California.
U.S. Environmental Protection Agency document - EPA/404/5-85-001. 1985. Ambient WaterQuality Criteria for Ammonia.
U.S. Environmental Protection Agency document - EPA/600/3-85/040 1986. Rates,Constants, and Kinetics Formulations in Surface Water Quality Modeling (Second Edition).
U.S. Environmental Protection Agency 1987. The Enhanced Stream Water Quality ModelsQUAL2E and QUAL2E-UNCAS.
U.S. Environmental Protection Agency 1998. Report of the federal advisory committee of thetotal maximum daily load (TMDL) program. 100-R-95-006. The National Advisory Council forEnvironmental Policy and Technology (NACEPT).http://www.epa.gov/owow/tmdl/faca/facaall.pdf.
U.S. Environmental Protection Agency 1998. Index of Watershed Indicators.http://www.epa.gov/iwi/.
U.S. Fish and Wildlife Service. 1988. Endangered and threatened wildlife and plants: Proposalto determin endangered status for the shortnose sucker and Lost River sucker. Federal Register,Vol. 52, No. 165: 23145-32149.
Walker W.W. 2001. Development of a Phosphorus TMDL for Klamath Lake, Oregon. Preparedfor Oregon Department of Environmental Quality.
Walker W.W. 1995. A nutrient-balance model for Agency Lake, Oregon. U.S. Dept. of Interior,U.S. Bureau of Reclamation, Denver, CO.
Welch, E.B. 1992. Ecological effects of wastewater: applied limnology and pollutant effects.Chapman and Hall. New York. 425p.
Welch E. B., R.R. Horner, and C.R. Patmont (1989). Prediction of Nuisance Biomass: AManagement Approach. Wat. Res. 4: pp. 401-405.
Wetzel, R.G. (1983). Limnology. Saunders College Publishing. 2nd edition.
Wildung, R. E., R.L. Scmidt, and R.C. Routson. 1997. The phosphorous status of eutrophiclake sediments as related to changes in limnological conditions – phosphorous mineralcomponents, J. Environ. Qual. 6(1):100-104.
Williams, J.E. (1988). Endangered and threatened wildlife and plants: determination ofendangered status for the shortnose sucker and the Lost River sucker. Federal Register53:137):27,130-27,134.


For more information contact:
Dick Pedersen, Manager of Watershed Management SectionDepartment of Environmental Quality811 Southwest 6th AvenuePortland, Oregon [email protected]
Dick Nichols, Manager of Eastern RegionDepartment of Environmental Quality2146 Northeast 4th, #104Bend, Oregon [email protected]