University of MarylandComputer Vision Lab 1 A Perturbation Method for Evaluating Background...
24
1 University of Maryla omputer Vision Lab A Perturbation Method for Evaluating Background Subtraction Algorithms Thanarat Horprasert, Kyungnam Kim, David Harwood, Larry Davis Computer Vision Lab, UMIACS, Univ.of Maryland at College Park Oct 12, 2003
-
date post
21-Dec-2015 -
Category
Documents
-
view
214 -
download
0
Transcript of University of MarylandComputer Vision Lab 1 A Perturbation Method for Evaluating Background...

1
University of MarylandComputer Vision Lab
A Perturbation Method for EvaluatingBackground Subtraction Algorithms
A Perturbation Method for EvaluatingBackground Subtraction Algorithms
Thanarat Horprasert, Kyungnam Kim,
David Harwood, Larry DavisComputer Vision Lab, UMIACS, Univ.of Maryland at College Park
Oct 12, 2003

2
University of MarylandComputer Vision Lab
ContentsContents
Introduction to Background Subtraction (BGS) BGS Algorithms Classical ROC Analysis Perturbation Detection Rate Analysis Experimental Results Conclusion and Future Work
Introduction to Background Subtraction (BGS) BGS Algorithms Classical ROC Analysis Perturbation Detection Rate Analysis
Conclusion and Future Work
Experimental Results
3
University of MarylandComputer Vision Lab
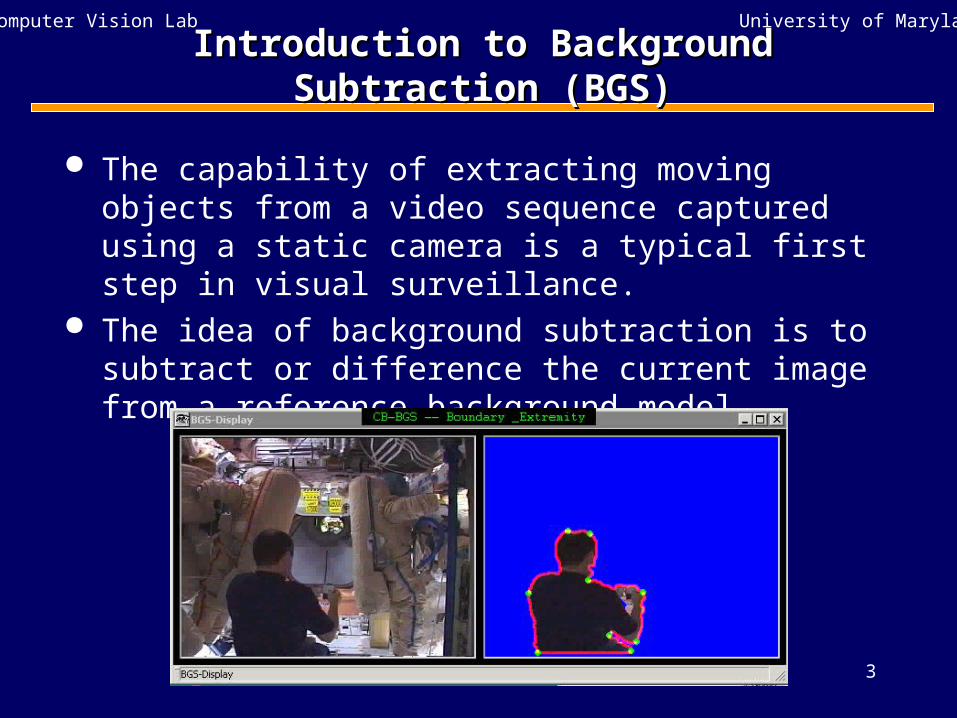
Introduction to Background Subtraction (BGS)Introduction to Background Subtraction (BGS)
The capability of extracting moving objects from a video sequence captured using a static camera is a typical first step in visual surveillance.
The idea of background subtraction is to subtract or difference the current image from a reference background model.

4
University of MarylandComputer Vision Lab
Introduction to Background Subtraction (BGS)Introduction to Background Subtraction (BGS)
5
University of MarylandComputer Vision Lab
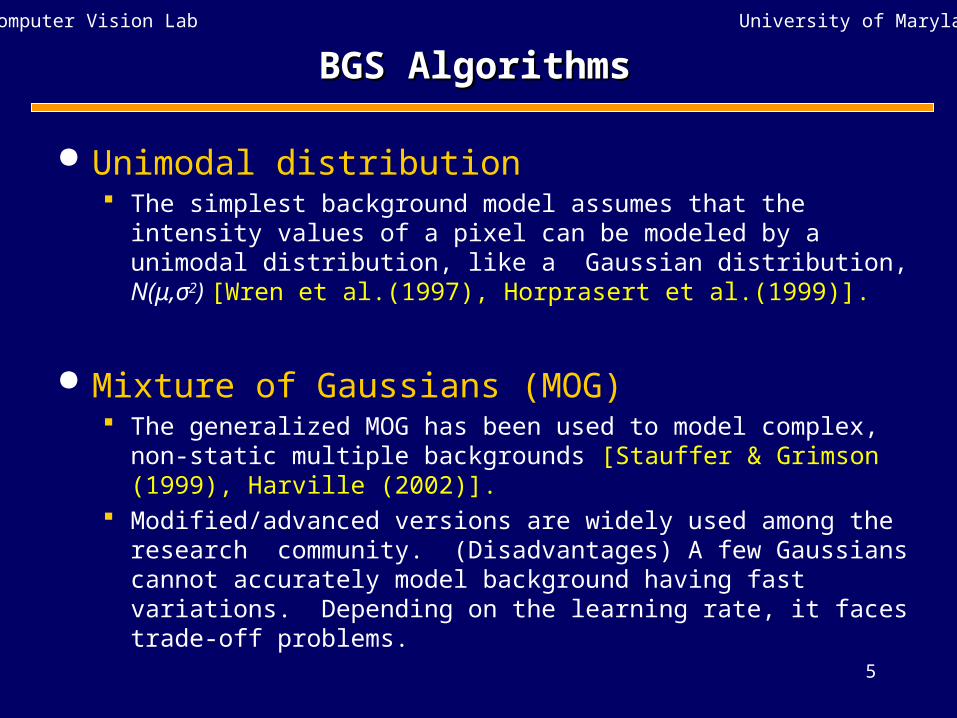
BGS AlgorithmsBGS Algorithms
Unimodal distribution The simplest background model assumes that the intensity values
of a pixel can be modeled by a unimodal distribution, like a Gaussian distribution, N(μ,σ2) [Wren et al.(1997), Horprasert et al.(1999)].
Mixture of Gaussians (MOG) The generalized MOG has been used to model complex, non-
static multiple backgrounds [Stauffer & Grimson (1999), Harville (2002)].
Modified/advanced versions are widely used among the research community. (Disadvantages) A few Gaussians cannot accurately model background having fast variations. Depending on the learning rate, it faces trade-off problems.
6
University of MarylandComputer Vision Lab
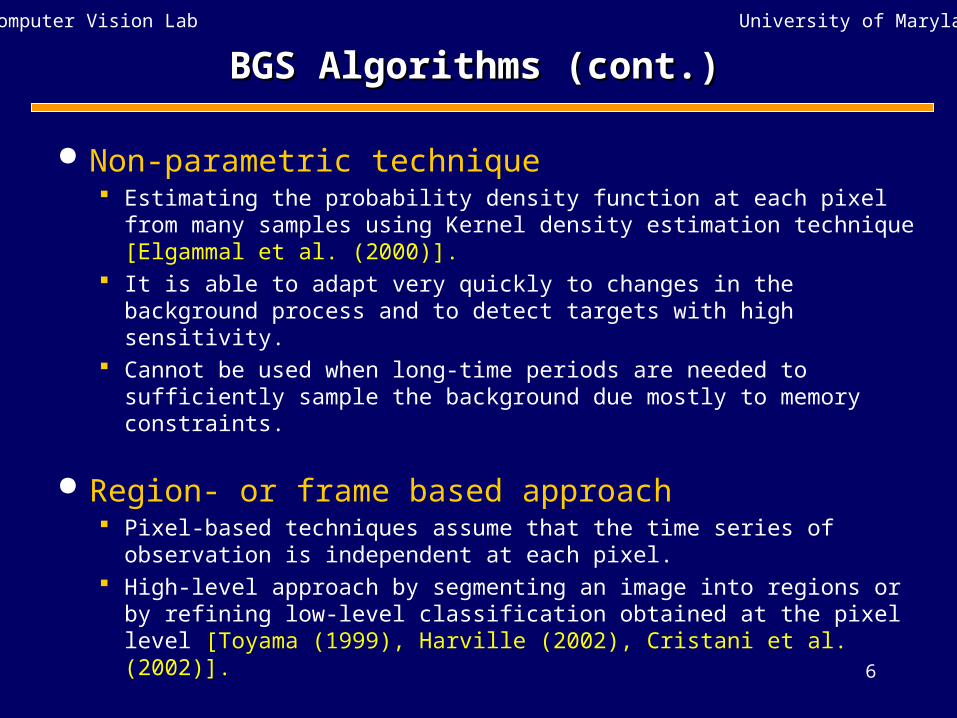
BGS Algorithms (cont.)BGS Algorithms (cont.)
Non-parametric technique Estimating the probability density function at each pixel from
many samples using Kernel density estimation technique [Elgammal et al. (2000)].
It is able to adapt very quickly to changes in the background process and to detect targets with high sensitivity.
Cannot be used when long-time periods are needed to sufficiently sample the background due mostly to memory constraints.
Region- or frame based approach Pixel-based techniques assume that the time series of
observation is independent at each pixel. High-level approach by segmenting an image into regions or by
refining low-level classification obtained at the pixel level [Toyama (1999), Harville (2002), Cristani et al. (2002)].

7
University of MarylandComputer Vision Lab
BGS Algorithms (cont.)BGS Algorithms (cont.)
Codebook-based technique (new)
We adopt a quantization and clustering technique motivated by Kohonen to construct the background model from long observation sequences, without making parametric assumptions.
For each pixel, a codebook (CB) consists of one or more codewords. Mixed backgrounds can be modeled by multiple codewords.
Samples at each pixel are clustered into the set of codewords based on a color distortion metric together with a brightness ratio.

8
University of MarylandComputer Vision Lab
BGS Algorithms (cont.)BGS Algorithms (cont.)
Four algorithms in evaluation
Name Background subtraction algorithm
CB codebook-based technique in the paper
MOGmixture of Gaussians by Stauffer & Grimson (1999)
KER and KER.RGB*
non-parametric method using Kernels by Elgammal et al. (2000).
UNIunimodal background modeling by Horprasert et al.(1999).
* The algorithm accepts normalized colors (KER) and RGB colors (KER.RGB) as inputs

9
University of MarylandComputer Vision Lab
Classical ROC AnalysisClassical ROC Analysis
Performance evaluation is required in terms of how well the algorithm detects the targets with less false alarms.
ROC (Receiver Operating Characteristic) Analysis. Applied when there are known background(BG) and
foreground(FG) distributions. Requires (hand-segmented) ground truth for analysis. Evaluation is centralized around
the tradeoff of ‘miss detection rate’and ‘false alarm rate’.
10
University of MarylandComputer Vision Lab
Classical ROC Analysis (cont.)Classical ROC Analysis (cont.)
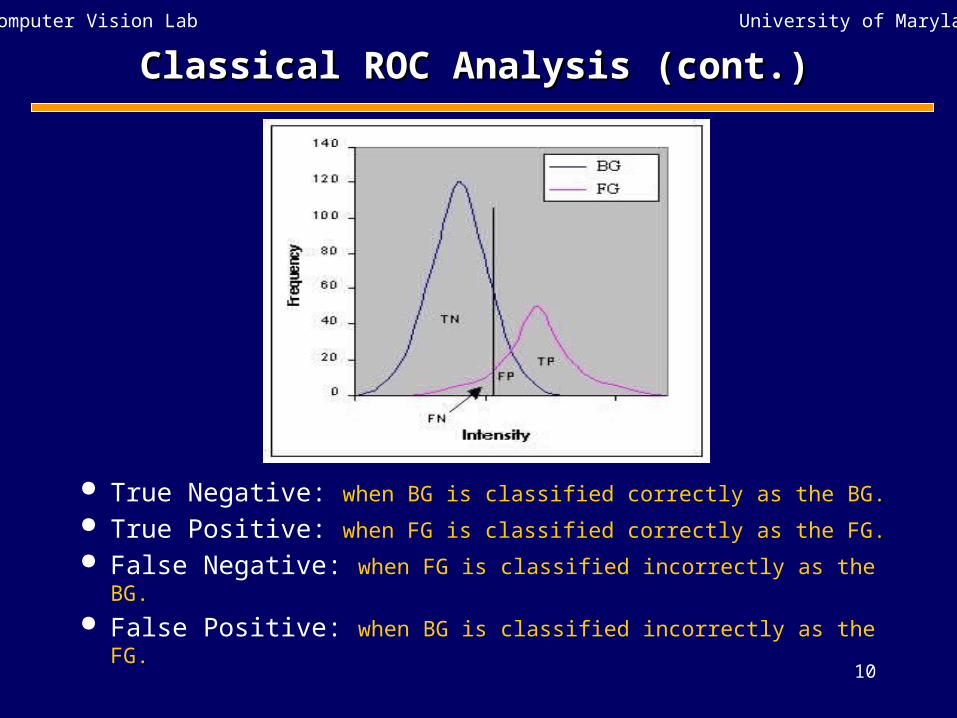
True Negative: when BG is classified correctly as the BG.
True Positive: when FG is classified correctly as the FG.
False Negative: when FG is classified incorrectly as the BG.
False Positive: when BG is classified incorrectly as the FG.

11
University of MarylandComputer Vision Lab
Classical ROC Analysis (cont.)Classical ROC Analysis (cont.)
Detection errors can be classified into 2 types:
False alarm rate (FA-rate)
= FP / (FP+TN)
Miss detection rate (MD-rate)
= FN / (FN + TP)
RROC curve
algo.1algo.2
better

12
University of MarylandComputer Vision Lab
Classical ROC Analysis (cont.)Classical ROC Analysis (cont.)
Limitations of ROC: In typical video surveillance applications, we are
usually given a BG scene for a fixed camera, but do not or cannot know what might possibly move in the scene as FG objects.
Requires manual groundtruth evaluation. Measures the errors for detecting a particular FG
against a particular BG. There are as many ROC curves as possible different FG targets.

13
University of MarylandComputer Vision Lab
Perturbation Detection Rate AnalysisPerturbation Detection Rate Analysis
Perturbation Detection Rate (PDR) analysis measures the sensitivity of the algorithm in detecting low contrast targets against background as a function of contrast
Without knowledge of the actual FG distribution. Assumption:
The shape of the FG distribution is locally similar to that of the BG distribution.
However, FG distribution of small contrast will be a shifted or perturbed version of the BG distribution.

14
University of MarylandComputer Vision Lab
PDR Analysis (cont.)PDR Analysis (cont.)
Given the parameters to achieve a certain fixed FA-rate, the analysis is performed by shifting or perturbing the entire BG distributions by vectors in uniformly random directions of RGB space with fixed magnitude , computing an average detection rate as a function of contract .

15
University of MarylandComputer Vision Lab
PDR Analysis (cont.)PDR Analysis (cont.)
Procedure to produce a PDR graph:
1. Train N training (empty) frames, adjusting parameters to achieve a target FA-rate (practically .01% to 1%).
2. Pass through those N frames again to obtain a test FG. For each frame, perturb a random sample of M pixel values (Ri, Gi, Bi) by a magnitude in uniformly random directions.
(R’i, G’i, B’i) = (Ri, Gi, Bi)) + (dR, dG, dB)
3. Test the BGS algorithmson these perturbed FG pixels and compute the detection rate for the
4. By varying the FG contrast , obtain a monotone increasing PDR graph of detection rates.
(Ri, Gi, Bi))
(R’i, G’i, B’i)
3D color sphere with radius
16
University of MarylandComputer Vision Lab
Experimental ResultsExperimental Results
Configuration Training frame: 100 empty consecutive frames from each video. For each frame, 1000 points are randomly selected for
perturbation During testing, no updating of the BG model is allowed. KER and KER.RGB: a sample size 50 (frames) represents the
BG. MOG: the max # of Gaussians is 4 for stationary BGs and 10 for
moving backgrounds. The learning rate is fixed and T is adjusted to give the desired FA-rate.
The FA-rate for each video is determined by(1) Video quality, (2) whether it is indoor or outdoor, and (3) good real FG detection results for most algorithms.

17
University of MarylandComputer Vision Lab
Experimental ResultsExperimental Results
Useful for choosing particular algorithm’s parameter values for use in a given application.
Shows trade-off between different parameters.
RROC curve of CB algorithm

18
University of MarylandComputer Vision Lab
Experimental ResultsExperimental Results
Indoor office video (mostly stationary BG)
MOG and KER.RGB don’t separately model brightness and color.
MOG does not model covariance (caused by variation in brightness)
Detection rate at perturbation Δ(video 'indoor office' / false alarm rate = .01%)
0
10
20
30
40
50
60
70
80
90
100
0 5 10 15 20 25 30 35 40
Δ
De
tect
ion
Ra
te(%
)CB
UNI
KER
MOG
KER.RGB
better
worse

19
University of MarylandComputer Vision Lab
Experimental ResultsExperimental Results
Outdoor woods video (containing moving BG)
All algorithms perform somewhat worse.
UNI does not perform well as in the indoor case (not designed for outdoors).
Detection rate at perturbation Δ(video 'outdoor woods' / false alarm rate = 1%)
0
10
20
30
40
50
60
70
80
90
100
0 5 10 15 20 25 30 35 40
Δ
Det
ectio
n R
ate(
%)
CB
KER
MOG
UNI
KER.RGB

20
University of MarylandComputer Vision Lab
Experimental ResultsExperimental Results
Sensitive detection in a real example
A red sweater against a reddish colored wall with difference (at the missing spots).
The graphs shows a large difference in detection rate.
Detection rate at perturbation Δ(video 'red-brick wall' / false alarm rate = .01%)
0
10
20
30
40
50
60
70
80
90
100
0 5 10 15 20 25 30 35 40
Δ
De
tect
ion
Ra
te(%
)
CB
UNI
KER
KER.RGB
MOG
CB MOG

21
University of MarylandComputer Vision Lab
Experimental ResultsExperimental Results
A window containing mostly moving BG
The FA-rate obtained only within the window.
Sample size of KER: 270 Reduced sensitivity of all
algorithms
Detection rate on window at perturbation Δ(video 'parking lot' / 'window' false alarm rate = .1%)
0
10
20
30
40
50
60
70
80
90
100
0 5 10 15 20 25 30 35 40
Δ
Det
ectio
n R
ate(
%)
CB
KER
KER.RGB
MOG
UNI
22
University of MarylandComputer Vision Lab
Conclusion and Future WorkConclusion and Future Work
Summary of PDR (as alternative to classical ROC
analysis):
does not require FG targets in videos or knowledge of actual FG distributions
assume that the FG has a distribution similar in form to BG, but shifted or perturbed.
applied to 4 representative algorithms on 4 videos, showing understandable results
useful for qualitative comparison of different algorithms as well as comparison of choice of parameters for a particular algorithms.

23
University of MarylandComputer Vision Lab
Conclusion and Future WorkConclusion and Future Work
Limitation:
Does not model motion blur of moving FG objects In the case of mixed (moving) BG, the simulated FG
distribution will be mixed (as plants or flags moving in the FG).
FG objects often have shading and reflection effects on BG. They are important for choosing a proper, practical false alarm rate.
24
University of MarylandComputer Vision Lab
Conclusion and Future WorkConclusion and Future Work
Future work
Extended to measure local detection rates throughout the frame of the scene or varying over time. localized parameter estimation
PDR on the videos containing FG already. Area of non-detection (PDR-II ?): measure the size of
the area covered by the decision surface of the BG model at a certain false alarm rate.