UNIVERSITY OF CALIFORNIA Economics 134 DEPARTMENT OF ...
54
UNIVERSITY OF CALIFORNIA Economics 134 DEPARTMENT OF ECONOMICS Spring 2018 Professor David Romer LECTURE 3 POSTWAR FLUCTUATIONS AND THE GREAT RECESSION JANUARY 24, 2018 I. CHANGES IN MACROECONOMIC VOLATILITY A. The pre-depression era versus the early postwar decades 1. The old facts 2. The new facts 3. Why didn’t the economy become more stable? B. The early postwar decades versus 1985–2005 1. The facts: the “Great Moderation” 2. Why did the economy become more stable? II. INFLATION AND MONETARY POLICY OVER THE POSTWAR PERIOD A. Inflation 1. The big picture: The rise and fall of inflation 2. Looking in more detail B. The role of monetary policy 1. Monetary policy and inflation 2. Issues that this raises III. THE RUN-UP TO THE GREAT RECESSION A. The 2001 recession B. The rise and fall of house prices C. Financial distress D. The first stages of the downturn E. The initial policy response IV. CRISIS IN THE FALL OF 2008 AND EARLY 2009 A. Financial crisis in September 2008 B. Comparison with the start of the Great Depression C. Real decline D. International contagion E. Policy actions in the heart of the crisis F. Rapidly rising unemployment and (slightly) falling inflation V. THE SLOW RECOVERY A. The trough B. The pace of recovery C. Possible reasons for the slow recovery VI. A LITTLE ABOUT THE EUROPEAN CRISIS
Transcript of UNIVERSITY OF CALIFORNIA Economics 134 DEPARTMENT OF ...

UNIVERSITY OF CALIFORNIA Economics 134 DEPARTMENT OF ECONOMICS Spring 2018
Professor David Romer
LECTURE 3 POSTWAR FLUCTUATIONS AND THE GREAT RECESSION
JANUARY 24, 2018
I. CHANGES IN MACROECONOMIC VOLATILITY A. The pre-depression era versus the early postwar decades 1. The old facts 2. The new facts
3. Why didn’t the economy become more stable? B. The early postwar decades versus 1985–2005 1. The facts: the “Great Moderation” 2. Why did the economy become more stable? II. INFLATION AND MONETARY POLICY OVER THE POSTWAR PERIOD A. Inflation 1. The big picture: The rise and fall of inflation 2. Looking in more detail B. The role of monetary policy 1. Monetary policy and inflation 2. Issues that this raises III. THE RUN-UP TO THE GREAT RECESSION A. The 2001 recession B. The rise and fall of house prices C. Financial distress D. The first stages of the downturn E. The initial policy response IV. CRISIS IN THE FALL OF 2008 AND EARLY 2009 A. Financial crisis in September 2008 B. Comparison with the start of the Great Depression C. Real decline D. International contagion E. Policy actions in the heart of the crisis F. Rapidly rising unemployment and (slightly) falling inflation V. THE SLOW RECOVERY A. The trough B. The pace of recovery C. Possible reasons for the slow recovery VI. A LITTLE ABOUT THE EUROPEAN CRISIS

LECTURE 3 Postwar Fluctuations and the Great
Recession
January 24, 2018
Economics 134 David Romer Spring 2018

I. CHANGES IN MACROECONOMIC VOLATILITY

Traditional data series showed a dramatic stabilization of the economy.

Macroeconomic volatility in the early postwar decades was very similar to before the Depression (or before WWI).

The Rise of Stabilization Policy • Keynes’s General Theory (1936). • The maturation of the Federal Reserve. • The greater size of government (leading to
automatic stabilizers and more scope for discretionary fiscal policy).
• Deposit insurance. • Formal government commitment to stabilization:
“It is the … responsibility of the Federal Government … to promote maximum employment, production, and purchasing power” (Employment Act of 1946).

Possible Reasons that the Rise of Stabilization Policy Did Not Cause the
Economy to Quickly Become Much More Stable

Macroeconomic volatility fell dramatically around the mid-1980s.

The fall in volatility in the mid-1980s shows up clearly in real GDP growth.
-15
-10
-5
0
5
10
15
20
194
7-II
194
9-III
195
1-IV
195
4-I
195
6-II
195
8-III
196
0-IV
196
3-I
196
5-II
196
7-III
196
9-IV
197
2-I
197
4-II
197
6-III
197
8-IV
198
1-I
198
3-II
198
5-III
198
7-IV
199
0-I
199
2-II
199
4-III
199
6-IV
199
9-I
200
1-II
200
3-III
200
5-IV
Real
GDP
Gro
wth
(Per
cent
)
Real GDP Growth 1947:2-2007:4
Possible Reasons that the Economy Was Much More Stable from Roughly
1985 to Roughly 2005 (the “Great Moderation”)

II. INFLATION AND MONETARY POLICY OVER THE POSTWAR PERIOD

Inflation rose irregularly over the 1960s and 1970s, fell dramatically in the early 1980s, and has remained low.

Some Issues Raised by Postwar Inflation Behavior
• Why was monetary policy conducted in a way that led to a rising inflation?
• What changed around 1980? • What is the link (if any) between the rising
inflation and the failure of the real economy to become more stable?
• What is the link (if any) between the conquest of inflation and the Great Moderation?

III. THE RUN-UP TO THE GREAT RECESSION

Tech bubble burst in early 2000.
NASDAQ Composite Index 1994-2005

House prices rose dramatically in the mid-2000s—and then fell sharply.

Issues:
• How might the decline in house prices have affected the economy?
• Why was the aftermath of the bursting of housing bubble so much worse than the aftermath of the bursting of the tech bubble?

TED Spread
Difference between the interest rates on short-term loans between banks (LIBOR) and short-term government debt (T-bills). It is a measure of credit risk.

TED spread spiked in August 2007.

Residential Construction Spending
Residential construction began to fall in 2006.

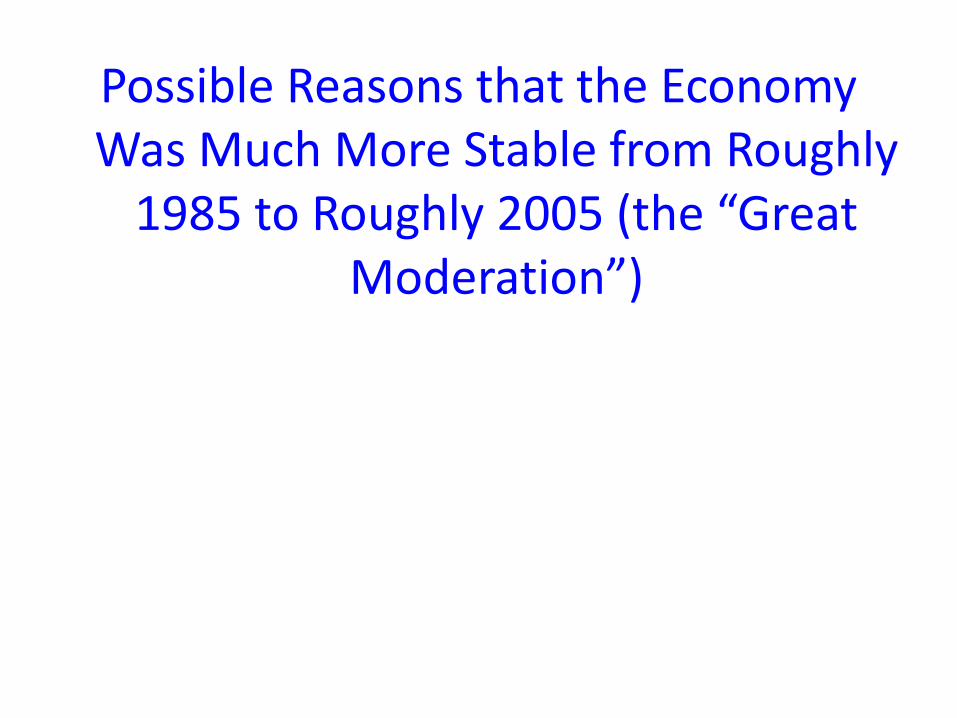
Real GDP peaked in 2007Q4 and then fell moderately. Employment peaked in Jan. 2008 and then fell, first slowly and then rapidly.

Major Policy Actions before September 2008
• Fiscal policy: Economic Stimulus Act of 2008 (February)
• Monetary policy: Lower interest rates; various Fed special programs, and interventions to help troubled financial firms

IV. CRISIS IN THE FALL OF 2008 AND EARLY 2009

0
2
4
6
8
10
12
141/
1/02
7/1/
021/
1/03
7/1/
031/
1/04
7/1/
041/
1/05
7/1/
051/
1/06
7/1/
061/
1/07
7/1/
071/
1/08
7/1/
081/
1/09
7/1/
091/
1/10
7/1/
101/
1/11
7/1/
111/
1/12
7/1/
12
Perc
ent
Delinquency Rate on Single-Family Mortgages


Initial fall in stock prices was larger in 2008-09 than in 1929-30.
World Stock Prices, 1929 and 2008

Initial rise in interest rate spreads was much larger in 2008-09 than in 1929-30.

World Industrial Output, 1929 and 2008
Initial fall in output in 2008-09 was similar to 1929-30.
GDP and employment plummeted in the second half of 2008 and early 2009.

IP fell early in US; rest of the world followed quickly.
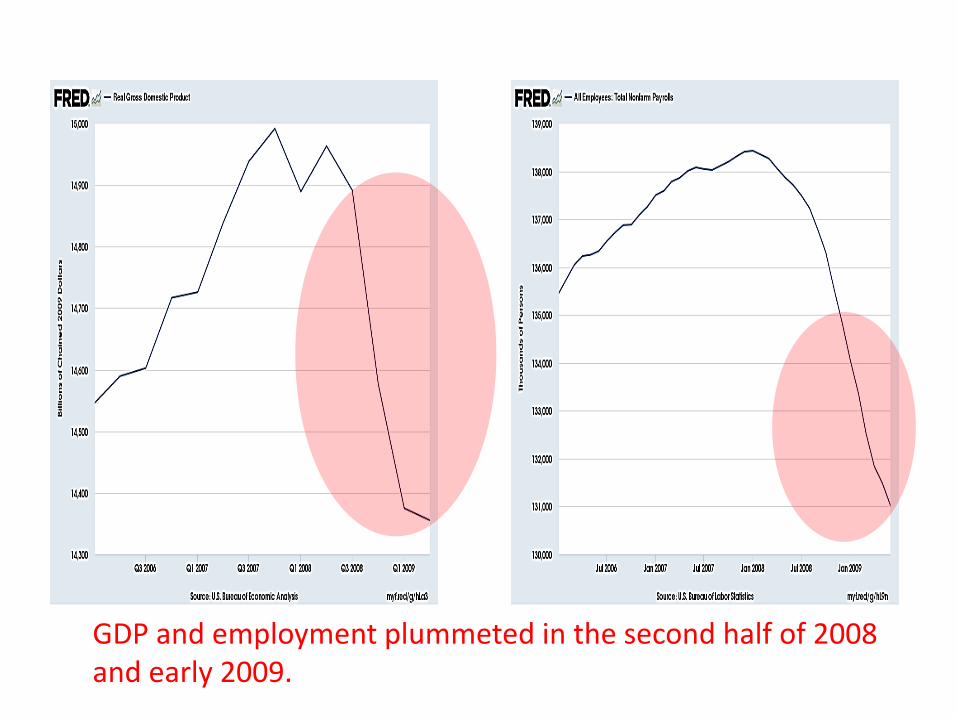
The Policy Response • Monetary policy: Federal funds rate lowered to
almost zero (December 2008); quantitative easing (December 2008 and March 2009); more Fed special programs
• Financial rescue: AIG rescue and Fannie and Freddie takeover (September 2008); Troubled Asset Relief Program (TARP) (October 2008); stress test (May 2009)
• Fiscal policy: American Recovery and Reinvestment Act of 2009 (February 2009)


Okun’s Law
A shortfall of GDP growth from normal of 1 percentage point is usually associated with a rise in the unemployment rate of about ½ percentage point.

The rise in unemployment in 2009 was unusually large given the behavior of real GDP.
Okun’s Law, 2000-2012
Δu = -0.5*(GDP Growth – 2.2)

Core inflation fell during the recession, but not by as much as one might have expected given high unemployment.

V. THE SLOW RECOVERY

Real GDP reached its low in 2009Q2; employment in Feb. 2010.

GDP never had a period of rapid growth, and never returned toward its previous path.

The fall in unemployment in 2011 and 2012 was unusually large given the behavior of real GDP.
Okun’s Law, 2000-2012
Δu = -0.5*(GDP Growth – 2.2)

Possible Reasons for the Slow Recovery

Home Vacancy Rate

Does high debt depress consumer spending?

VI. A LITTLE ABOUT THE EUROPEAN CRISIS

Euro area GDP turned down again in 2011, and did not return to its pre-crisis peak until 2015.

Unemployment in Greece and Spain reached Depression-like levels.

Unit Labor Costs across the Eurozone
Labor costs rose rapidly in many European countries – but not Germany.


0
5
10
15
20
25
30
Jan-
07
May
-07
Sep-
07
Jan-
08
May
-08
Sep-
08
Jan-
09
May
-09
Sep-
09
Jan-
10
May
-10
Sep-
10
Jan-
11
May
-11
Sep-
11
Jan-
12
May
-12
Sep-
12
Perc
ent
10-Year Government Bond Yields
Germany Ireland Greece Spain France Italy Portugal United Kingdom
The crisis spread from Greece to many other countries in late 2010.