UNIVERSITY OF CALIFORNIA Economics 134 … OF CALIFORNIA Economics 134 . DEPARTMENT OF ECONOMICS...
41
UNIVERSITY OF CALIFORNIA Economics 134 DEPARTMENT OF ECONOMICS Spring 2018 Professor David Romer LECTURE 2 OVERVIEW OF THE GREAT DEPRESSION January 22, 2018 I. THE 1920S A. GDP growth and inflation B. Rising inequality C. Stock price increases II. THE GREAT DEPRESSION A. Centered in the U.S., but spread to the rest of the world B. Stock market crash C. Financial panics, the decline in the money supply, and deflation D. Fiscal policy E. International factors F. Severity of the downturn III. THE RECOVERY FROM THE GREAT DEPRESSION A. Timing and strength B. Monetary policy at the zero lower bound C. Fiscal expansion D. The recession of 1937-38 E. World War II 1. Impact of the fiscal expansion 2. Consequences of rising debt IV. INTRODUCTION TO POSTWAR MACROECONOMIC FLUCTUATIONS A. Basic facts: The behavior of real GDP and unemployment B. Recessions 1. What is a recession? 2. Postwar recessions 3. The 3 largest postwar recessions before the Great Recession C. The labor market in recessions 1. Okun’s law 2. The sources of Okun’s law D. Short-run fluctuations and the components of output
Transcript of UNIVERSITY OF CALIFORNIA Economics 134 … OF CALIFORNIA Economics 134 . DEPARTMENT OF ECONOMICS...

UNIVERSITY OF CALIFORNIA Economics 134 DEPARTMENT OF ECONOMICS Spring 2018
Professor David Romer
LECTURE 2
OVERVIEW OF THE GREAT DEPRESSION January 22, 2018
I. THE 1920S A. GDP growth and inflation B. Rising inequality C. Stock price increases II. THE GREAT DEPRESSION A. Centered in the U.S., but spread to the rest of the world B. Stock market crash C. Financial panics, the decline in the money supply, and deflation D. Fiscal policy E. International factors F. Severity of the downturn III. THE RECOVERY FROM THE GREAT DEPRESSION A. Timing and strength B. Monetary policy at the zero lower bound C. Fiscal expansion D. The recession of 1937-38 E. World War II 1. Impact of the fiscal expansion 2. Consequences of rising debt IV. INTRODUCTION TO POSTWAR MACROECONOMIC FLUCTUATIONS A. Basic facts: The behavior of real GDP and unemployment B. Recessions 1. What is a recession? 2. Postwar recessions 3. The 3 largest postwar recessions before the Great Recession C. The labor market in recessions 1. Okun’s law 2. The sources of Okun’s law D. Short-run fluctuations and the components of output

LECTURE 2 Overview of the Great Depression
January 22, 2018
Economics 134 David Romer Spring 2018

Announcements
• A second reader, which contains the outside readings that are available online and is optional, is now available at Copy Central.
• You can order it in person at Copy Central, or online at https://copycentral.redshelf.com/book/842423/econ-134-vol-2-optional-reading-macroeconomic-policy-from-the-great-depression-to-today-842423-none-romer
• The price is $29.50.

I. THE 1920S
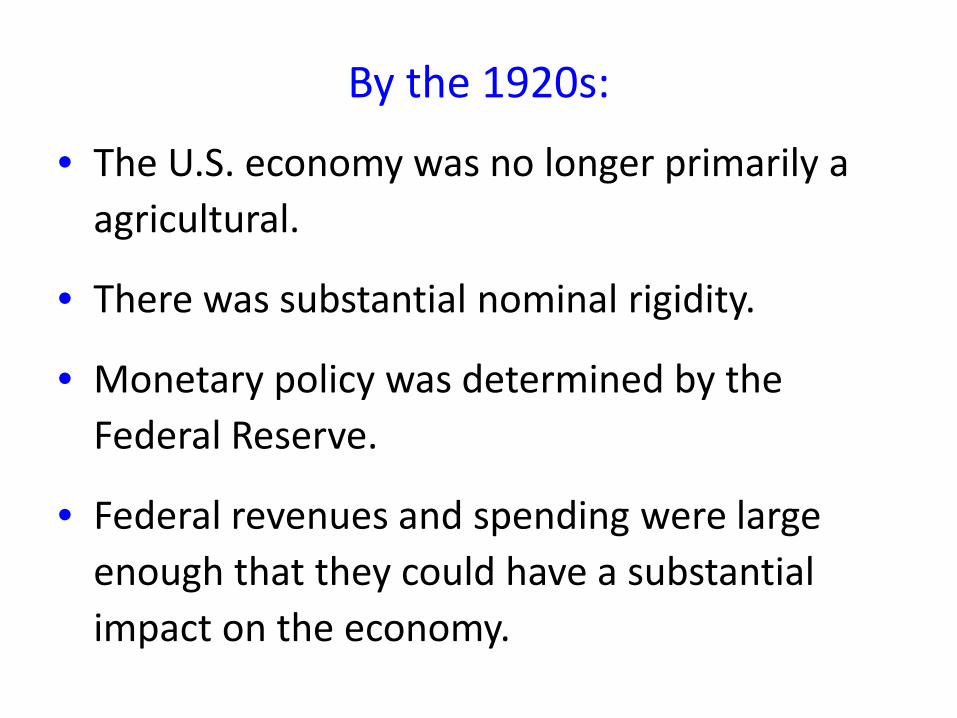
By the 1920s:
• The U.S. economy was no longer primarily a agricultural.
• There was substantial nominal rigidity.
• Monetary policy was determined by the Federal Reserve.
• Federal revenues and spending were large enough that they could have a substantial impact on the economy.

Issue: Was GDP growth above the growth rate of potential output?
1919 1920 1921 1922 1923 1924 1925 1926 1927 1928 1929-20
-15
-10
-5
0
5
10
15
Perc
ent
Real GDP Growth, 1919-1929
GDP Growth

1919 1920 1921 1922 1923 1924 1925 1926 1927 1928 1929-20
-15
-10
-5
0
5
10
15
Perc
ent
Real GDP Growth and Inflation 1919-1929
Inflation
GDP Growth
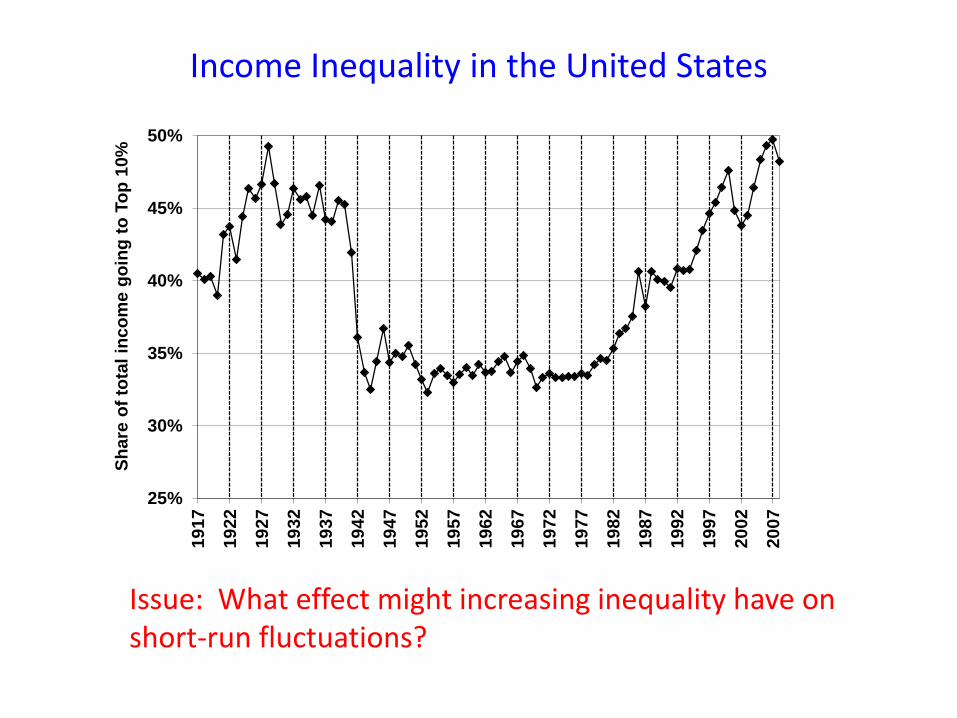
Issue: What effect might increasing inequality have on short-run fluctuations?
25%
30%
35%
40%
45%
50%
1917
1922
1927
1932
1937
1942
1947
1952
1957
1962
1967
1972
1977
1982
1987
1992
1997
2002
2007
Shar
e of
tota
l inc
ome
goin
g to
Top
10%
Income Inequality in the United States

1.5
6.5
11.5
16.5
21.5
26.5
31.5
36.5
Jan
1922
Jun
1922
Nov
192
2
Apr 1
923
Sep
1923
Feb
1924
Jul 1
924
Dec
1924
May
192
5
Oct
192
5
Mar
192
6
Aug
1926
Jan
1927
Jun
1927
Nov
192
7
Apr 1
928
Sep
1928
Feb
1929
Jul 1
929
Mon
thly
S&
P St
ock
Pric
e In
dex
Stock Prices, 1922:1-1929:8
Issue: What do we mean by a bubble?

II. THE GREAT DEPRESSION

Depression was worldwide, but likely began in the U.S.
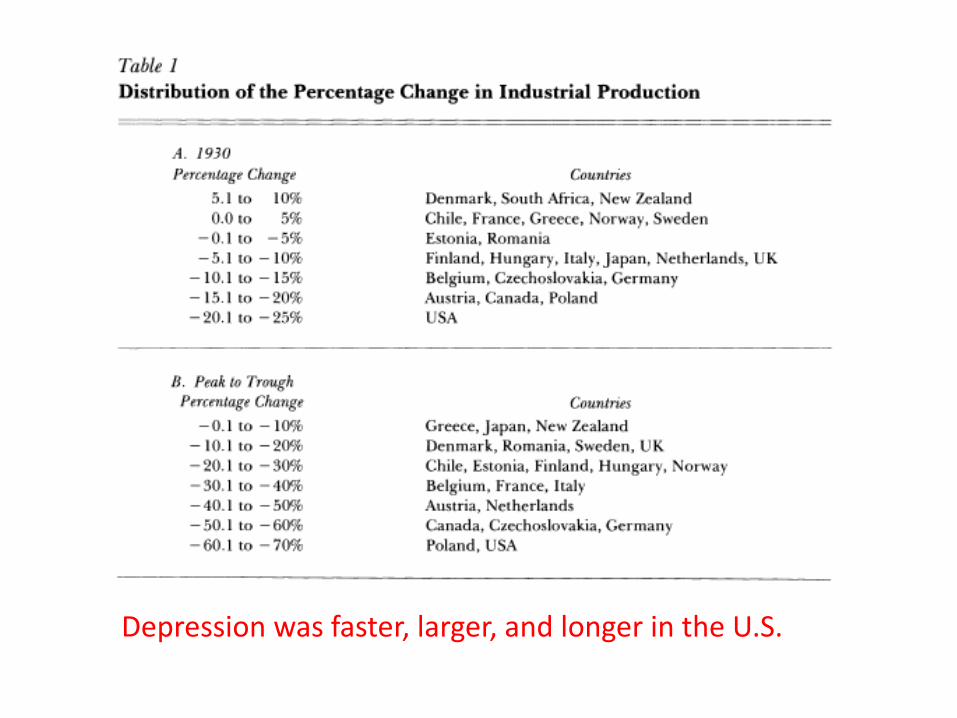
Depression was faster, larger, and longer in the U.S.

Why do we think Depression began in the U.S.?
• Circumstantial evidence – timing, severity, etc.
• Can identify shocks in the U.S. and transmission mechanism to the rest of the world.
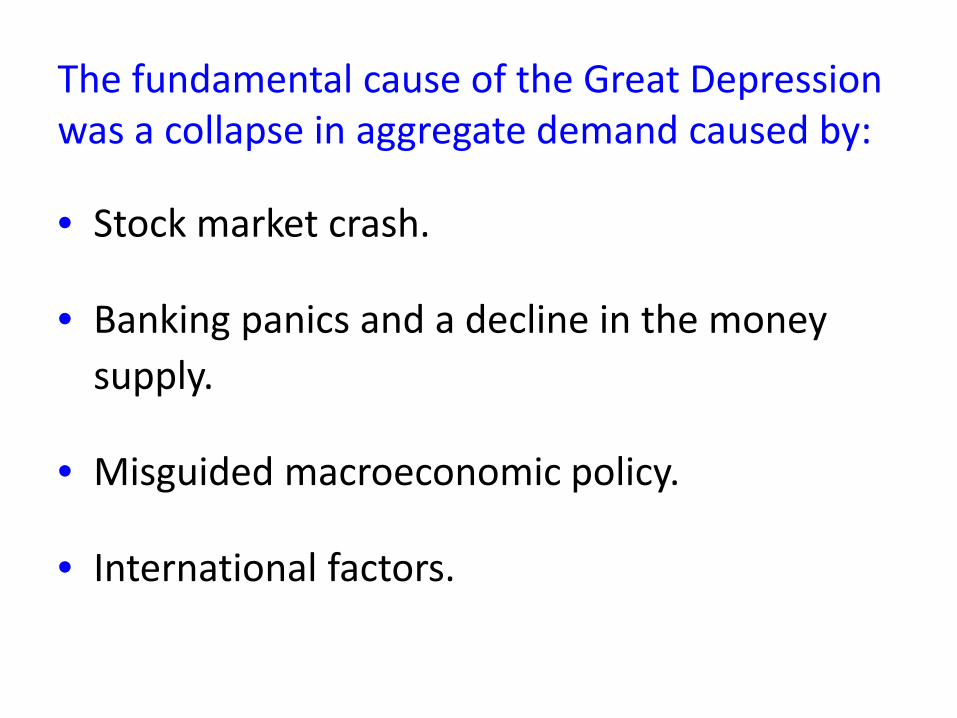
The fundamental cause of the Great Depression was a collapse in aggregate demand caused by:
• Stock market crash.
• Banking panics and a decline in the money supply.
• Misguided macroeconomic policy.
• International factors.

Issue: What role did the Great Crash play in the onset of the Depression?
1.5
6.5
11.5
16.5
21.5
26.5
31.5
36.5
Jan
1922
Jun
1922
Nov
192
2Ap
r 192
3Se
p 19
23Fe
b 19
24Ju
l 192
4De
c 19
24M
ay 1
925
Oct
192
5M
ar 1
926
Aug
1926
Jan
1927
Jun
1927
Nov
192
7Ap
r 192
8Se
p 19
28Fe
b 19
29Ju
l 192
9De
c 19
29
Mon
thly
S&
P St
ock
Pric
e In
dex
Stock Prices, 1922:1-1929:12

1929
-01
1929
-04
1929
-07
1929
-10
1930
-01
1930
-04
1930
-07
1930
-10
1931
-01
1931
-04
1931
-07
1931
-10
1932
-01
1932
-04
1932
-07
1932
-10
1933
-01
1933
-04
1933
-07
1933
-10
1
1.2
1.4
1.6
1.8
2
2.2
2.4In
dust
rial
Prod
uctio
n (L
ogar
ithm
s)
Industrial Production, 1929-1933
August 1929 October 1929

6
56
106
156
206
256
306
356
406
456
506
Jul 1
929
Sep
1929
Nov
192
9
Jan
1930
Mar
193
0
May
193
0
Jul 1
930
Sep
1930
Nov
193
0
Jan
1931
Mar
193
1
May
193
1
Jul 1
931
Sep
1931
Nov
193
1
Jan
1932
Mar
193
2
May
193
2
Jul 1
932
Sep
1932
Nov
193
2
Jan
1933
Num
ber
Bank Suspensions

15
17
19
21
23
25
27
29Ja
n 19
29M
ay 1
929
Sep
1929
Jan
1930
May
193
0Se
p 19
30Ja
n 19
31M
ay 1
931
Sep
1931
Jan
1932
May
193
2Se
p 19
32Ja
n 19
33M
ay 1
933
Sep
1933
Jan
1934
May
193
4Se
p 19
34Ja
n 19
35M
ay 1
935
Sep
1935
M1
(Bill
ions
of $
)
Money Supply and Banking Crises 1929-1935
Vertical lines show the dates of waves of panics identified by Friedman and Schwartz.
Issue: What was the impact of the banking panics and the collapse of the money supply?

Issue: What role did actual and expected deflation play?
2.2
2.3
2.4
2.5
2.6
2.7
2.8
2.9
3
1922
1923
1924
1925
1926
1927
1928
1929
1930
1931
1932
1933
1934
1935
1936
1937
1938
1939
1940
1941
Loga
rithm
s
Producer Price Index
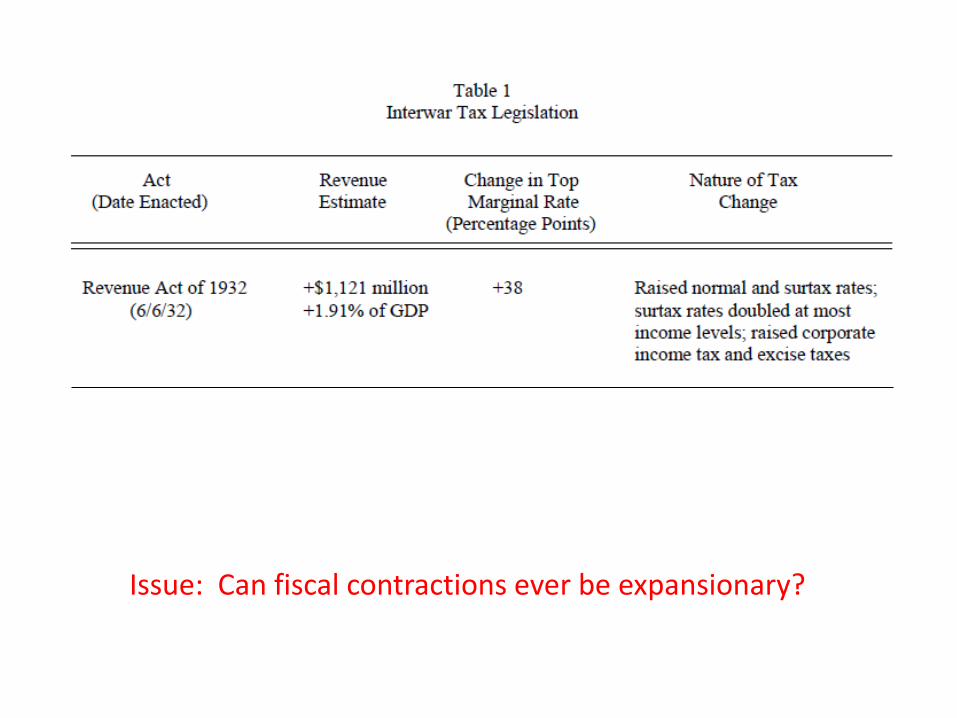
Issue: Can fiscal contractions ever be expansionary?

Issue: What role did the gold standard play in spreading the Depression throughout the world?
0
5
10
15
20
25
30
1920
1924
1928
1932
1936
1940
1944
1948
1952
1956
1960
1964
1968
1972
1976
1980
1984
1988
1992
1996
2000
2004
2008
Perc
ent
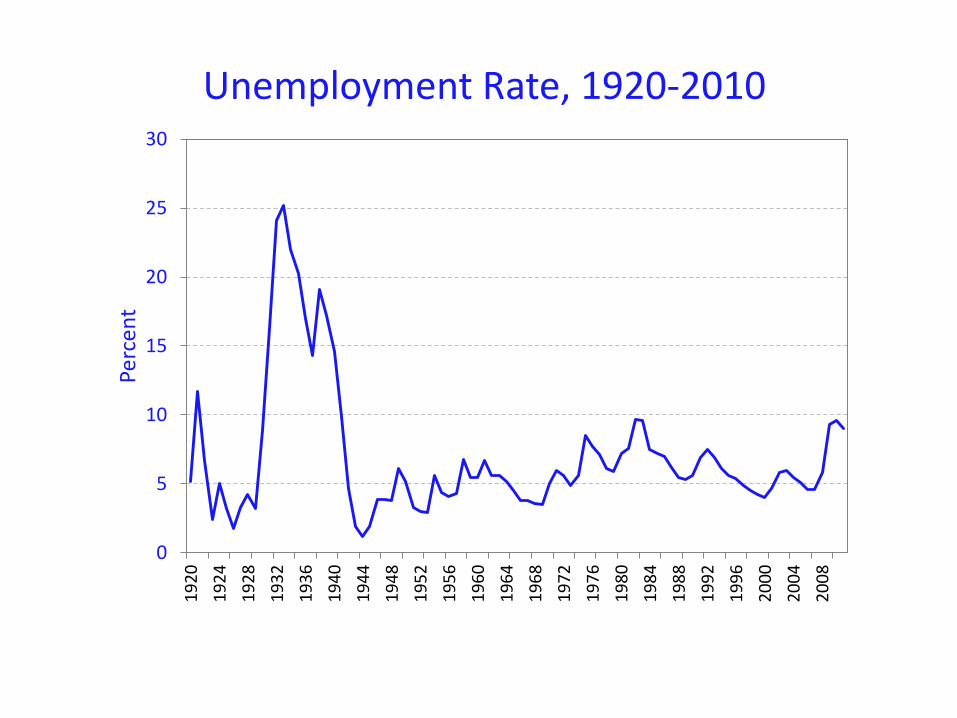
Unemployment Rate, 1920-2010

III. THE RECOVERY FROM THE GREAT DEPRESSION

1929
-01
1929
-08
1930
-03
1930
-10
1931
-05
1931
-12
1932
-07
1933
-02
1933
-09
1934
-04
1934
-11
1935
-06
1936
-01
1936
-08
1937
-03
1937
-10
1938
-05
1938
-12
1939
-07
1940
-02
1940
-09
1941
-04
1941
-11
1
1.2
1.4
1.6
1.8
2
2.2
2.4
Indu
stria
l Pr
oduc
tion
(Log
arith
ms)
Industrial Production, 1929-1941
August 1929
March 1933
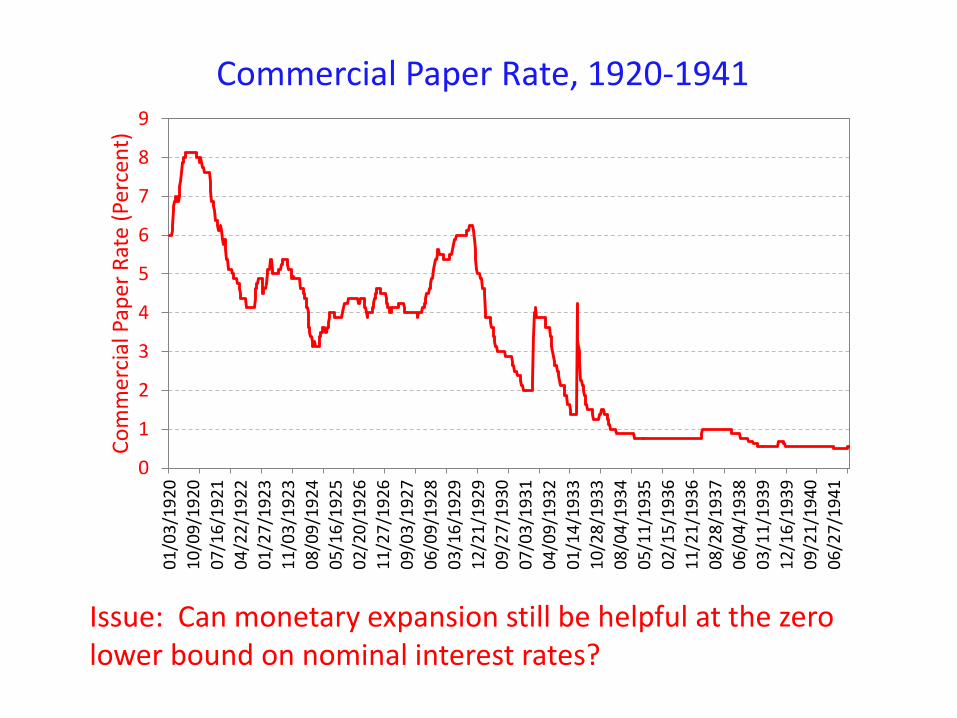
Issue: Can monetary expansion still be helpful at the zero lower bound on nominal interest rates?
0
1
2
3
4
5
6
7
8
9
01/0
3/19
2010
/09/
1920
07/1
6/19
2104
/22/
1922
01/2
7/19
2311
/03/
1923
08/0
9/19
2405
/16/
1925
02/2
0/19
2611
/27/
1926
09/0
3/19
2706
/09/
1928
03/1
6/19
2912
/21/
1929
09/2
7/19
3007
/03/
1931
04/0
9/19
3201
/14/
1933
10/2
8/19
3308
/04/
1934
05/1
1/19
3502
/15/
1936
11/2
1/19
3608
/28/
1937
06/0
4/19
3803
/11/
1939
12/1
6/19
3909
/21/
1940
06/2
7/19
41
Com
mer
cial
Pap
er R
ate
(Per
cent
)
Commercial Paper Rate, 1920-1941

15
20
25
30
35
40
45
50
Jan
1929
Aug
1929
Mar
193
0
Oct
193
0
May
193
1
Dec
1931
Jul 1
932
Feb
1933
Sep
1933
Apr 1
934
Nov
193
4
Jun
1935
Jan
1936
Aug
1936
Mar
193
7
Oct
193
7
May
193
8
Dec
1938
Jul 1
939
Feb
1940
Sep
1940
Apr 1
941
Nov
194
1
M1
(Bill
ions
of $
)
Money Supply, 1929-1941

Government Spending as a Percent of GDP
Issue: Does fiscal stimulus work?

Issue: What caused the recession of 1937-38?
1929
-01
1929
-08
1930
-03
1930
-10
1931
-05
1931
-12
1932
-07
1933
-02
1933
-09
1934
-04
1934
-11
1935
-06
1936
-01
1936
-08
1937
-03
1937
-10
1938
-05
1938
-12
1939
-07
1940
-02
1940
-09
1941
-04
1941
-11
1
1.2
1.4
1.6
1.8
2
2.2
2.4In
dust
rial
Prod
uctio
n (L
ogar
ithm
s)
Industrial Production, 1929-1941
August 1929
March 1933
May 1937
June 1938

6
6.5
7
7.5
8
8.5
1929
1931
1933
1935
1937
1939
1941
1943
1945
1947
1949
1951
1953
1955
1957
1959
1961
1963
1965
1967
1969
Real
GDP
(Bill
ions
of 2
005$
, Log
arith
ms)
Real GDP
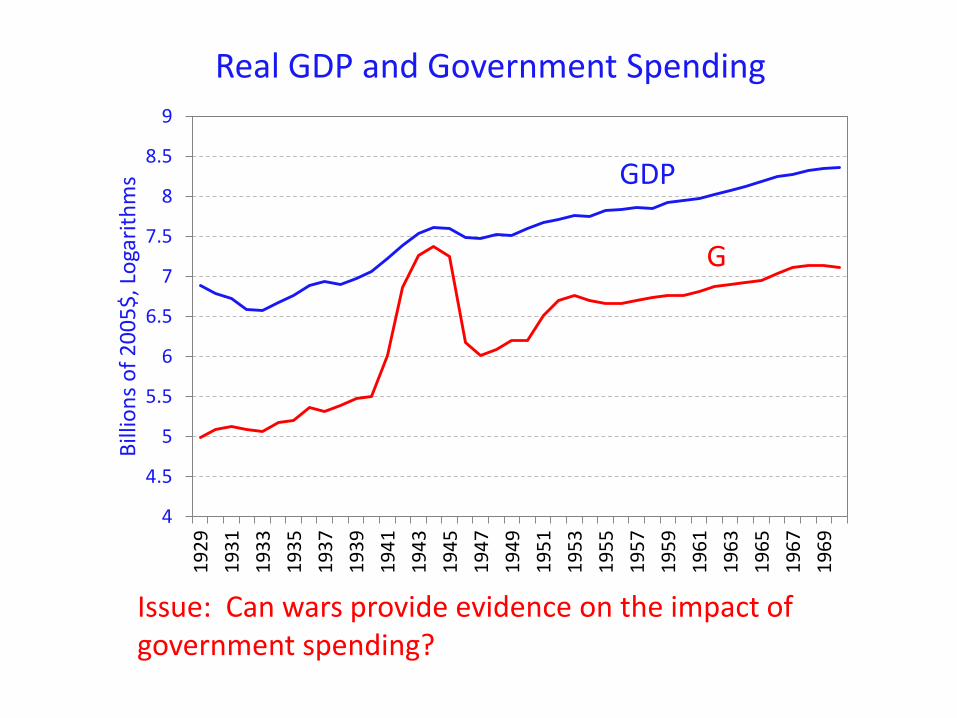
Issue: Can wars provide evidence on the impact of government spending?
4
4.5
5
5.5
6
6.5
7
7.5
8
8.5
9
1929
1931
1933
1935
1937
1939
1941
1943
1945
1947
1949
1951
1953
1955
1957
1959
1961
1963
1965
1967
1969
Billi
ons o
f 200
5$, L
ogar
ithm
s
Real GDP and Government Spending
GDP
G
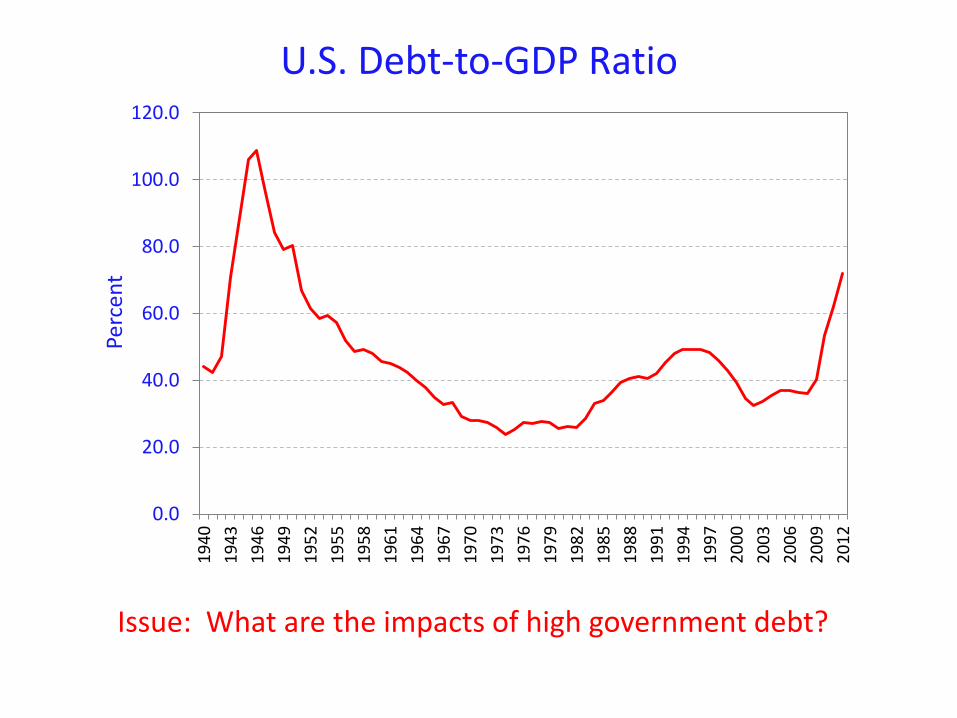
Issue: What are the impacts of high government debt?
0.0
20.0
40.0
60.0
80.0
100.0
120.0
1940
1943
1946
1949
1952
1955
1958
1961
1964
1967
1970
1973
1976
1979
1982
1985
1988
1991
1994
1997
2000
2003
2006
2009
2012
Perc
ent
U.S. Debt-to-GDP Ratio

IV. INTRODUCTION TO POSTWAR MACROECONOMIC FLUCTUATIONS

GDP does not grow smoothly.

Unemployment varies significantly, and sometimes rises sharply.

What Is a Recession? • Recessions are identified judgmentally by the
National Bureau of Economic Research.
• The NBER’s definition: “A recession [is] a significant decline in economic activity [that] spreads across the economy and can last from a few months to more than a year” (emphasis added).

Postwar recessions vary in frequency, duration, and size.
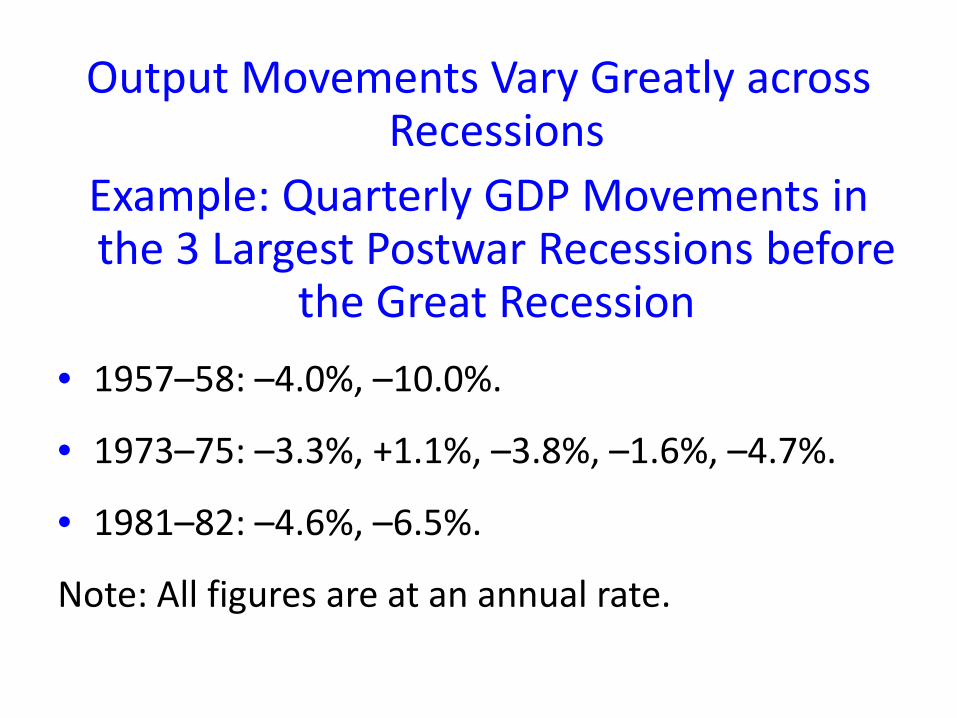
Output Movements Vary Greatly across Recessions
Example: Quarterly GDP Movements in the 3 Largest Postwar Recessions before
the Great Recession • 1957–58: –4.0%, –10.0%.
• 1973–75: –3.3%, +1.1%, –3.8%, –1.6%, –4.7%.
• 1981–82: –4.6%, –6.5%.
Note: All figures are at an annual rate.

Okun’s Law
A shortfall of GDP growth from normal of 2 percentage points is usually associated with a rise in the unemployment rate of about 1 percentage point.
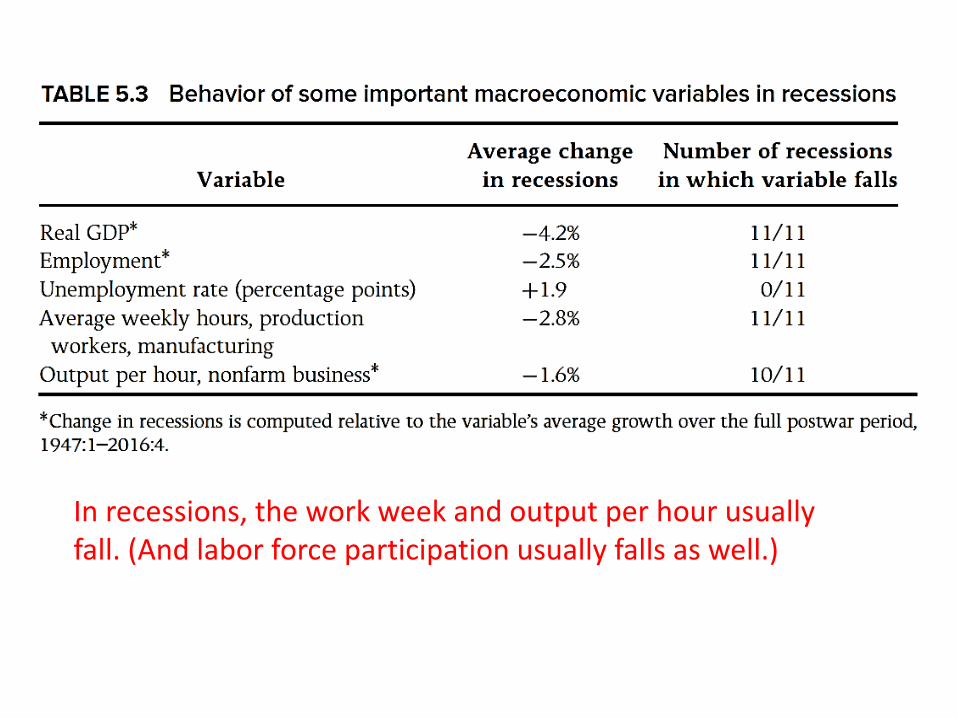
In recessions, the work week and output per hour usually fall. (And labor force participation usually falls as well.)

Short-run fluctuations in output are distributed very unevenly over the components of output.